3D confined assembly of polymer-tethered gold nanoparticles into size-segregated structures†
Yi
Yang‡
a,
Yulan
Wang‡
b,
Seon-Mi
Jin‡
c,
Jiangping
Xu
a,
Zaiyan
Hou
a,
Jingli
Ren
a,
Ke
Wang
a,
Eunji
Lee
 *c,
Lianbin
Zhang
 a,
Yufeng
Zhang
*b and
Jintao
Zhu
 *a
*a
aKey Lab of Materials Chemistry for Energy Conversion and Storage of Ministry of Education (HUST), School of Chemistry and Chemical Engineering, Huazhong University of Science and Technology (HUST), Wuhan 430074, P. R. China. E-mail: jtzhu@mail.hust.edu.cn
bState Key Lab Breeding Base of Basic Science of (Hubei-MOST) and Key Lab of oral Biomedicine, Ministry of Education, School and Hospital of Stomatology, Wuhan University, Wuhan 430079, P. R. China. E-mail: zyf@mail.whu.edu.cn
cSchool of Materials Science and Engineering, Gwangju Institute of Science and Technology, Gwangju 61005, Republic of Korea. E-mail: eunjilee@mail.gist.ac.kr
First published on 4th December 2018
Abstract
We demonstrate co-assembly of polystyrene (PS)-tethered gold nanoparticles (GNPs) with different sizes under 3D confinement. Interestingly, core–shell assemblies with particle size segregation were obtained, and the location/arrangement of GNPs can be effectively tuned by tailoring the chain length of the PS ligands. Typically, short PS-tethered GNPs locate in the outer layers while long PS-tethered GNPs accumulate in the interior because of the hydrophilicity difference between them. Binary GNP-based core–shell structures were clearly confirmed by transmission electron microscopy tomography and the formation mechanism was intensively explored. This fabrication approach is applicable to NPs with different sizes, shapes and types. Moreover, both UV-vis absorption spectra and photothermal conversion efficiencies of the GNP assemblies can be effectively regulated by adjusting the PS chain length and content ratio, thus facilitating their biomedical applications in osteosarcoma therapy.
1. Introduction
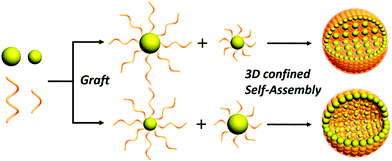
Designed functional inorganic nanoparticle (NP) assemblies have attracted extensive attentions owing to their broad applications in optical and electronic devices, drug delivery, and cancer therapy.1–4 Various bottom-up approaches have been proposed for generation of sophisticated assemblies from single type NPs.5–11 Integration of multiple NPs with distinct sizes and properties into one system with hierarchical arrangements has recently been investigated in order to achieve multi-functionalities and new advanced properties.12–14 To date, several binary NP systems including mutually embedded superlattice and phase-separated aggregations have been reported.15,16 In the case of phase separation, the assembly process is usually performed on substrates or at the liquid interface. The relative size and content ratio of binary NPs play decisive roles in the spontaneous formation process.17–19 Recently, Nishino et al. reported the formation of hierarchical assemblies of gold nanoparticles (GNPs) in solution through entropy-driven particle size segregation; spherical assemblies with small GNP shells and large GNP yolks were obtained.16 Despite considerable efforts in understanding the thermodynamics and kinetics of the size segregation phenomenon, previous reports have only focused on size segregation behavior of NPs and revealing the formed hierarchical architectures. Structural transformation by tuning experimental parameters and exploration of their applications are rarely investigated. Nevertheless, it remains a big challenge to precisely localize and arrange NPs to generate size-segregated assemblies with tunable properties for specific potential applications.Here, we demonstrate a facile yet effective strategy for the generation of core–shell assemblies with size-segregated GNPs. The method is based on the spontaneous segregation of binary polystyrene (PS)-tethered GNPs with different sizes under three-dimensional (3D) soft confinement in emulsion droplets (Scheme 1). Interestingly, when the molecular weight (Mw) difference of PS ligands reaches a threshold value (∼8 K), core–shell phase separation will take place. Specifically, long chain PS-tethered GNPs (LGNPs) preferentially located inside the assemblies loosely while short chain PS-tethered GNPs (SGNPs) form closely-packed outer layers, regardless of the size of the GNPs. Moreover, the UV-vis absorption spectra and hence photothermal conversion capabilities of the assemblies can be readily tuned by varying the Mw of the PS and content ratio of the two components, thus facilitating their applications in killing osteosarcoma cells.
2. Experimental section
2.1. Materials
Ascorbic acid, sodium borohydride (NaBH4), trisodium citrate, YCl3·6H2O (99.9%), YbCl3·6H2O (99.9%), ErCl3·6H2O (99.9%), oleic acid (90%), 1-octadecene (90%), NH4F (96.0%), poly(vinyl alcohol) (PVA, average Mw: 13–23 kg mol−1, 87–89% hydrolyzed), hydrogen tetrachloroauratetrihydrate (HAuCl4·3H2O, purity: 99.9%), and cetyltrimethylammonium bromide (CTAB, purity ≥99%) were obtained from Sigma-Aldrich. PS2k-SH (Mw/Mn = 1.04), PS5K-SH (Mw/Mn = 1.15), PS12K-SH (Mw/Mn = 1.14), PS20K-SH (Mw/Mn = 1.09), and PS50K-SH (Mw/Mn = 1.06) were purchased from Polymer Source, Inc., Canada. Deionized water (Millipore Milli-Q grade) with a resistivity of 18.0 MΩ was used in all the experiments.2.2. NP synthesis
Monodisperse GNPs with a size of 3.5 nm, 8 nm and 24 nm were synthesized through the seeding growth approach.20 GNPs with a size of 15 nm and 30 nm were synthesized through the citrate reduction method.21 GNRs, Fe3O4 magnetic NPs (MNPs) and NaYF4:Yb/Er upconversion NPs (UCNPs) were synthesized through the published methods.22–242.3. Surface modification of GNPs
As-synthesized CTAB-stabilized GNPs were first centrifuged (14![[thin space (1/6-em)]](https://www.rsc.org/images/entities/char_2009.gif) 000 rpm, 30 min) to remove excess CTAB and then modified by PS-SH via a ligand-exchange approach. In a typical experiment, aqueous GNP solution (20 mL, 20 μmol) was added to 40 mL THF containing dissolved PS-SH (15 mg), followed by ultrasonication for 50 min and incubation for 20 h. Purification of the modified GNPs was performed by using centrifugation at 10
000 rpm, 30 min) to remove excess CTAB and then modified by PS-SH via a ligand-exchange approach. In a typical experiment, aqueous GNP solution (20 mL, 20 μmol) was added to 40 mL THF containing dissolved PS-SH (15 mg), followed by ultrasonication for 50 min and incubation for 20 h. Purification of the modified GNPs was performed by using centrifugation at 10![[thin space (1/6-em)]](https://www.rsc.org/images/entities/char_2009.gif) 000–12
000–12![[thin space (1/6-em)]](https://www.rsc.org/images/entities/char_2009.gif) 000 rpm for 30 min. The modification process was repeated two times. Finally, the GNPs were dispersed in chloroform and the concentration was determined.
000 rpm for 30 min. The modification process was repeated two times. Finally, the GNPs were dispersed in chloroform and the concentration was determined.
2.4. Preparation of GNP assemblies
An emulsion-solvent evaporation method was applied to prepare the GNP assemblies. GNPs dispersed in chloroform were first mixed. Subsequently, the hybrid solution was concentrated to 0.1 mL (∼5 mg mL−1) and emulsified with 1.0 mL aqueous solution of surfactant PVA (3 mg mL−1) using hand-driven membrane extrusion emulsification (Fig. S1, ESI†). The resulting emulsions were diluted by adding another 0.5 mL of the surfactant solution with the same concentration. Chloroform was then allowed to slowly evaporate for 2 days at 30 °C. Finally, the assemblies were separated by centrifugation (6000 rpm, 6 min) to remove the surfactants. The GNP assemblies still have the ability to disperse well in water due to the residual PVA on their surfaces although they can precipitate at the bottom of the container due to gravity when longer time is given. We found that, after 30 days, GNP assemblies can still disperse well in water with just slight hand shaking.3. Results and discussion
3.1. Generation of PS-tethered GNP assemblies with size-segregated structures
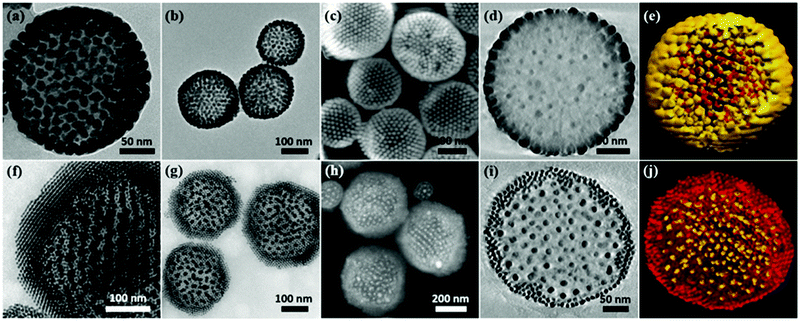
An emulsion-solvent evaporation approach was employed to generate PS-tethered GNP assemblies. Typically, PS-tethered GNPs with different sizes were dispersed in chloroform, and then emulsified with an aqueous solution containing surfactant PVA using hand-driven membrane extrusion emulsification (Fig. S1, ESI†). After dilution with a surfactant solution with the same concentration, chloroform was allowed to slowly evaporate to form the assemblies. Spontaneous segregation of binary PS-tethered GNPs with different sizes occurred under 3D soft confinement in emulsion droplets (Scheme 1), triggering the formation of core–shell assemblies with size-segregated GNPs.We show that chain length of the tethered PS plays a key role in controlling the location of the GNPs in the assemblies. When 15 nm-GNPs@PS2K and 8 nm-GNPs@PS20K GNPs were used, their co-assembly produced core–shell structures with closely packed 15 nm-GNPs@PS2K in the shell and loosely arranged 8 nm-GNPs@PS20K in the core (Fig. 1a–e). In contrast, the co-assembly of 8 nm-GNPs@PS2K and 15 nm-GNPs@PS20K led to structures with the complete opposite arrangement of GNPs in the core and shell (Fig. 1f–j). Transmission electron microscopy (TEM) images (Fig. 1a, b, f and g) and scanning electron microscopy (SEM) images (Fig. 1c and h) show that in both cases, GNPs in the shell packed more densely than those in the core, due to the shorter PS grafted on those GNPs. The two distinct parts of the segregated GNPs are further confirmed by transmission electron microscopy tomography (TEMT) of the cross-sectional images (Fig. 1d and i) and corresponding 3D reconstruction of binary GNP assemblies (Fig. 1e and j).
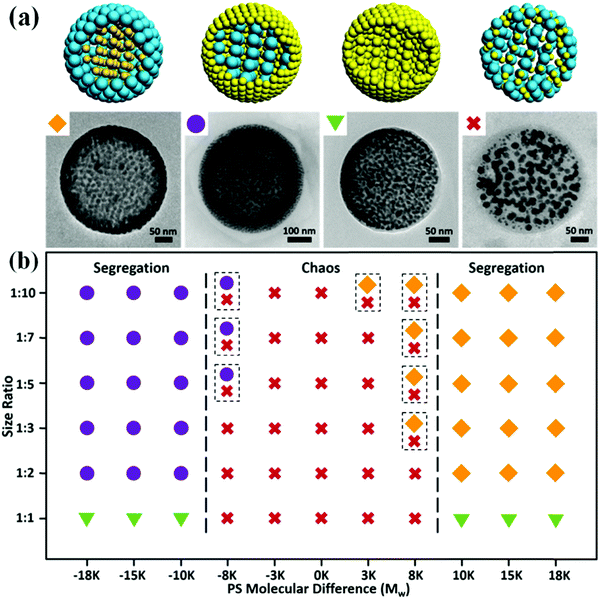
The effect of PS chain length on GNP size segregation within the assemblies was confirmed by using PS pairs with various Mw (2 K, 5 K, 12 K, 20 K, and 50 K). When the Mw difference of PS decreased to a certain value (∼8 K), size segregation behaviors are suppressed (Fig. S2, ESI†). In this case, GNPs of 8 nm and 15 nm form disordered aggregates instead of core–shell structures. Therefore, a threshold difference in the Mw of PS is one of the prerequisites for the occurrence of phase separation of hybrid GNPs. On the other hand, we show that the size of GNPs has little effect on the size segregation behaviors (Fig. S3 and S4, ESI†). For GNPs with the same size but different Mw (e.g., 8 nm-GNPs@PS2K and 8 nm-GNPs@PS20K), core–shell phase separation still occurred, as indicated by the much smaller interparticle spacing between the GNPs on the surface layers than those of the interior. Furthermore, we selected several GNP pairs with different size ratios (1![[thin space (1/6-em)]](https://www.rsc.org/images/entities/char_2009.gif) :
:![[thin space (1/6-em)]](https://www.rsc.org/images/entities/char_2009.gif) 3, 1
3, 1![[thin space (1/6-em)]](https://www.rsc.org/images/entities/char_2009.gif) :
:![[thin space (1/6-em)]](https://www.rsc.org/images/entities/char_2009.gif) 5, and 1
5, and 1![[thin space (1/6-em)]](https://www.rsc.org/images/entities/char_2009.gif) :
:![[thin space (1/6-em)]](https://www.rsc.org/images/entities/char_2009.gif) 10) to construct core–shell assemblies (Fig. S5, ESI†). In the PS2–20K tethered GNP system, core–shell phase separation was observed in all combinations of GNPs with different sizes and SGNPs always distribute on the surface.
10) to construct core–shell assemblies (Fig. S5, ESI†). In the PS2–20K tethered GNP system, core–shell phase separation was observed in all combinations of GNPs with different sizes and SGNPs always distribute on the surface.
In accordance with the above results, we speculate that the hydrophilicity of the GNPs plays a major role in the formation of size-segregated assemblies. Different from the reported entropy-driven size segregation, polymer-tethered NPs have no such strong volumetric collision with each other because of the reduced effect by tethered polymers.25 Importantly, the motion and arrangement of NPs largely depend on the property of the polymers. As-synthesized GNPs are hydrophilic due to the utilization of the bilayer ligand of amphiphilic cetryltrimethylammonium bromide (CTAB). After ligand exchange of CTAB with thiol-terminated PS (PS-SH), the surface property of the GNPs is transformed to hydrophobic. However, the residual CTAB molecules on the surface make the GNPs slightly hydrophilic (Table S1, ESI†). Obviously, the chain length of the PS ligands directly determines the hydrophilicity of the GNPs. Notably, the assembly process of the GNPs is carried out in emulsion droplets, and oil/water interfaces display varied selectivity to the GNPs with different hydrophilicity. GNPs with stronger hydrophilicity prefer the interface more than inner ones. Under 3D confinement, GNPs are arranged in accordance with priority from the interface to inside, triggering the size-segregated core–shell structure. The relationship between hydrophilicity and Mw of PS was confirmed by dynamic interfacial tension of GNP chloroform solution/water through a pendant drop method on the premise of small difference in hydrophilicity (Fig. S6, ESI†). With the decrease of PS chain length, GNPs of the same concentration became more hydrophilic, as indicated by the decline in interfacial tension for the GNP chloroform solution/water from 42.7 to 31.2 mN m−1. X-ray photoelectron spectroscopy (XPS) was also performed to verify the hydrophilicity of GNPs by quantitative detection of N element, representing the signal intensity of CTAB (Table S1, ESI†). Presumably, stronger hydrophilicity of SGNPs compared to LGNPs can be ascribed to two main reasons: (1) high Mw of hydrophobic PS endows the GNPs with more hydrophobicity; (2) most of the CTAB ligands are covered by long chain PS and isolated from the surrounding media due to the PS blanket effect, leading to a reduction of hydrophilicity. Thus, LGNPs and SGNPs show different interfacial selectivity, resulting in the formation of a core–shell size-segregated structure.
Our technique using the Mw difference of PS ligands to construct core–shell assemblies is general and can be applied to various size ratios of GNPs (Fig. 2b). The localization of GNPs is predominately determined by the length of the PS ligands rather than their own sizes. Close Mw of the PS ligands will suppress the phase separation of the two sets of GNPs, resulting in a chaotic structure. When the Mw difference of the PS ligands is larger than 8 K, an obvious segregation architecture can be observed. Yet, the situation that both GNPs are modified with high Mw PS ligands may not be suitable for the system since excessive Mw of the PS ligands will largely suppress the hydrophilicity of the GNPs so that the difference in hydrophilicity is hard to exhibit. For example, when 8 nm-GNPs@PS20K and 15 nm-GNPs@PS50K are combined, no obvious segregation occurs in the assemblies even though their Mw difference is 30 K (Fig. S7, ESI†). This phase diagram will be of importance for the design and fabrication of size-segregated assemblies.
Moreover, this technique for the fabrication of core–shell hybrid assemblies can be applied to NPs with different shapes, sizes and types. For instance, GNPs (size: 15 nm) and gold nanorods (GNRs, size: 28 nm × 7 nm) were applied in PS2–12K systems for co-assembly. In the hybrid assemblies, the core–shell phase separation of GNPs and GNRs can also take place as expected (Fig. S8, ESI†). Moreover, upconversion NPs (UCNPs, size: 28 nm) and magnetic NPs (MNPs, size: 10 nm) were also employed. The location and arrangement of GNPs, MNPs and UCNPs can be tuned by the Mw of the modified PS (Fig. S9, ESI†). In addition, solvent evaporation rate affects the assembly of structures. High evaporation rate (within 1 h) will result in a disc-like hybrid structure with central LGNPs and marginal SGNPs (Fig. S10, ESI†).
3.2. Regulation of absorption and photothermal properties of the assemblies
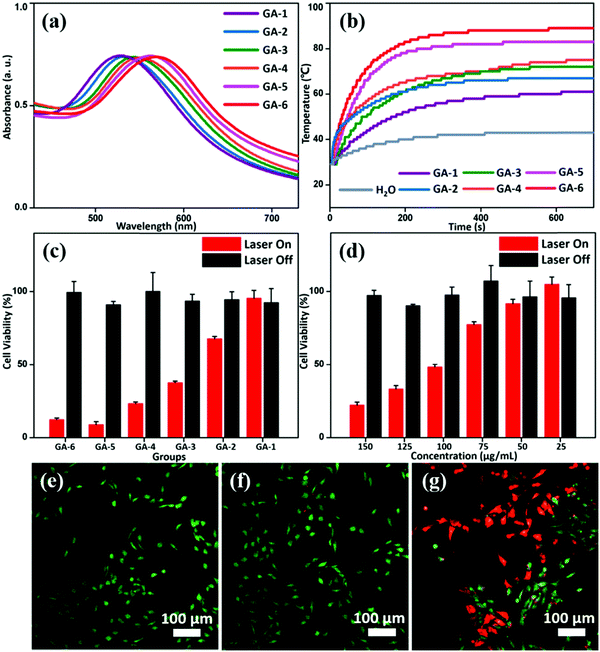
Generally, UV-vis absorption of the GNP assemblies can be largely determined by the size of the GNPs and interparticle distances.26 Therefore, tuning interparticle distance and components via varying the GNP size and polymer Mw allows us to modulate the absorption spectra and thus the photothermal properties of gold nanoparticle assemblies (GAs). Because the overall size of the GAs also has an effect on the location of UV-vis absorption, all GAs are controlled to similar sizes to avoid the impact (Fig. S11, ESI†).27 Here, we compare the UV-vis absorption spectra of the GNPs, GAs of single GNPs and GAs of hybrid GNPs. It is indicative that the aggregation of GNPs can lead to a red shift of the absorption peak compared to that of separate GNPs. On the other hand, GAs of single GNPs exhibit different red shift values when the NP size and Mw of PS are varied. Besides, the absorption peak of hybrid GAs is always located between the GAs formed by the two components. (Fig. S12, ESI†). Therefore, hybrid GAs with different absorption peaks can be obtained by manipulating the components and content ratio (Table 1). Compared to GA-1, the location of the UV-vis absorption peaks from GA-2 to GA-6 gradually red-shifted from 532 to 580 nm (Fig. 3a). Clearly, the content ratio increase of SGNPs leads to more red shift, and the GNPs-15 nm system has a stronger SPR effect than the GNPs-8 nm one. With the red shift of the UV-vis absorption peak and the increase of extinction coefficient at 655 nm, the photothermal conversion capability of the GAs has been enhanced to different degrees. Accordingly, gradient differences in their photothermal conversion effeciencies under a 655 nm laser are confirmed, which agree well with the variation trend of the UV-vis absorption (Table 1 and Fig. 3b). The photothermal conversion efficiencies (η) of GAs were calculated according to the system energy balance:26| η = (hSΔT − Qs)/I(1–10−A655) | (1) |
| τs = mC/hS | (2) |
| Group | Component | PT conversion efficiency |
|---|---|---|
| GA-1 | 8 nm@PS2K + 15 nm@PS20K (1![[thin space (1/6-em)]](https://www.rsc.org/images/entities/char_2009.gif) : :![[thin space (1/6-em)]](https://www.rsc.org/images/entities/char_2009.gif) 9) 9) |
7.1% |
| GA-2 | 15 nm@PS2K + 8 nm@PS20K (1![[thin space (1/6-em)]](https://www.rsc.org/images/entities/char_2009.gif) : :![[thin space (1/6-em)]](https://www.rsc.org/images/entities/char_2009.gif) 9) 9) |
8.4% |
| GA-3 | 8 nm@PS2K + 15 nm@PS20K (6![[thin space (1/6-em)]](https://www.rsc.org/images/entities/char_2009.gif) : :![[thin space (1/6-em)]](https://www.rsc.org/images/entities/char_2009.gif) 4) 4) |
9.9% |
| GA-4 | 15 nm@PS2K + 8 nm@PS20K (6![[thin space (1/6-em)]](https://www.rsc.org/images/entities/char_2009.gif) : :![[thin space (1/6-em)]](https://www.rsc.org/images/entities/char_2009.gif) 4) 4) |
10.6% |
| GA-5 | 8 nm@PS2K + 15 nm@PS20K (9![[thin space (1/6-em)]](https://www.rsc.org/images/entities/char_2009.gif) : :![[thin space (1/6-em)]](https://www.rsc.org/images/entities/char_2009.gif) 1) 1) |
13.7% |
| GA-6 | 15 nm@PS2K + 8 nm@PS20K (9![[thin space (1/6-em)]](https://www.rsc.org/images/entities/char_2009.gif) : :![[thin space (1/6-em)]](https://www.rsc.org/images/entities/char_2009.gif) 1) 1) |
15.2% |
The photothermal effect of GAs on in vitro bone-tumor cell ablation was investigated under 655 nm laser irradiation. Without irradiation, there was no significant effect on osteosarcoma cell survival rate of MG-63 after incubation with GAs at concentrations from 50 to 200 μg mL−1 for 12 h for all groups (Fig. S14, ESI†), verifying the biocompatibility of the GAs. However, after laser irradiation at 1.2 W cm−2 for 5 min,28 a reduction in cell viability of MG-63 to different degrees was observed from GA-1 to GA-6 (Fig. 3c). Taking GA-3 for example, we systemically studied the effects of concentration of GAs on the viability of MG-63 cells. It was found that the viability of the tumor cells decreased with the increase of concentration (Fig. 3d and Fig. S14, ESI†). Meanwhile, almost no dead cells (red signal) were observed under confocal laser scanning microscopy (CLSM) investigation for the groups where MG-63 cells were treated with laser irradiation only or incubated with GA-3 without laser irradiation (Fig. 3e and f). In contrast, cells treated with GA-3 and a laser showed a strong red fluorescence signal, indicating efficient photothermal ablation of tumor cells (Fig. 3g). Here, the ability of GAs to kill bone tumor cells mainly derives from their photothermal effect and is consistent with the variation trend of UV-vis absorption. Therefore, the therapy effect can be modulated by varying the GNP composition, making GAs potentially useful in tumor therapy.
4. Conclusions
In summary, we have demonstrated an effective route for the generation of hybrid GNP assemblies with size-segregated structures. The interfacial selectivity of the respective GNPs under 3D confinement gives rise to phase separation and core–shell spherical assemblies. We have precisely located and arranged 8 nm and 15 nm GNPs in the assemblies and confirmed the key role of the tethered polymers in the size segregation. The controllable segregation of binary GNPs enabled us to tune the UV-vis absorption spectra and photothermal properties of the assemblies. The different photothermal properties of the GAs under laser irradiation can be used for killing bone tumor cells. We believe that the size-segregated GNP assemblies with core–shell structures can provide a tunable model for the construction of advanced hybrid materials, potentially useful in bioimaging, sensing, drug delivery, and photothermal therapy.Conflicts of interest
The authors declare no competing interests.Acknowledgements
Y. Y., Y. W. and S. J. contributed equally to this work. This work was funded by the National Natural Science Foundation of China (51525302), Natural Science Foundation of Hubei Scientific Committee (2016CFA001) and Open Research Fund of State Key Lab of Polymer Physics & Chemistry, CIAC, CAS (2017-27). We also thank HUST Analytical and Testing Center for allowing us to use its facilities. E. L. acknowledges support by the NRF of Korea (NRF) (2016R1A2B4012322).Notes and references
- Z. Nie, A. Petukhova and E. Kumacheva, Nat. Nanotechnol., 2010, 5, 15–25 CrossRef CAS PubMed.
- J. L. Mohanan, I. U. Arachchige and S. L. Brock, Science, 2005, 307, 397–400 CAS.
- T. Teranishi, S. Hasegawa, T. Shimizu and M. Miyake, Adv. Mater., 2001, 13, 1699–1701 CrossRef CAS.
- S. Guo and S. Sun, J. Am. Chem. Soc., 2012, 134, 2492–2495 CrossRef CAS PubMed.
- R. J. Macfarlane, B. Lee, M. R. Jones, N. Harris, G. C. Schatz and C. A. Mirkin, Science, 2011, 334, 204–208 CrossRef CAS PubMed.
- S. Srivastava, B. L. Frankamp and V. M. Rotello, Chem. Mater., 2005, 17, 487–490 CrossRef CAS.
- M. A. Boles and D. V. Talapin, J. Am. Chem. Soc., 2015, 137, 4494–4502 CrossRef CAS PubMed.
- M. R. Jones, K. D. Osberg, R. J. Macfarlane, M. R. Langille and C. A. Mirkin, Chem. Rev., 2011, 111, 3736–3827 CrossRef CAS PubMed.
- B. Donnio, P. García-Vázquez, J. L. Gallani, D. Guillon and E. Terazzi, Adv. Mater., 2007, 19, 3534–3539 CrossRef CAS.
- D. Jishkariani, B. T. Diroll, M. Cargnello, D. R. Klein, L. A. Hough, C. B. Murray and B. Donnio, J. Am. Chem. Soc., 2015, 137, 10728–10734 CrossRef CAS PubMed.
- K. Kanie, M. Matsubara, X. Zeng, F. Liu, G. Ungar, H. Nakamura and A. Muramatsu, J. Am. Chem. Soc., 2012, 134, 808–811 CrossRef CAS PubMed.
- W. H. Evers, B. D. Nijs, L. Filion, S. Castillo, M. Dijkstra and D. Vanmaekelbergh, Nano Lett., 2010, 10, 4235–4241 CrossRef CAS PubMed.
- D. V. Talapin, E. V. Shevchenko, M. I. Bodnarchuk, X. Ye, J. Chen and C. B. Murray, Nature, 2009, 461, 964–967 CrossRef CAS PubMed.
- F. X. Redl, K.-S. Cho, C. B. Murray and S. O’Brien, Nature, 2003, 423, 968–971 CrossRef CAS PubMed.
- D. K. Smith, B. Goodfellow, D.-M. Smilgies and B. A. Korgel, J. Am. Chem. Soc., 2009, 131, 3281–3290 CrossRef CAS PubMed.
- J. Wei, K. Niikura, T. Higuchi, T. Kimura, H. Mitomo, H. Jinnai, Y. Joti, Y. Bessho, Y. Nishino, Y. Matsuo and K. Ijiro, J. Am. Chem. Soc., 2016, 138, 3274–3277 CrossRef CAS PubMed.
- C. J. Kiely, J. Fink, M. Brust, D. Bethell and D. J. Schiffrin, Nature, 1998, 396, 444–446 CrossRef CAS.
- Y. Liu, Y. Liu, P. Tao, W. Shang, C. Song and T. Deng, Nanoscale, 2014, 6, 14662–14666 RSC.
- S. Zellmer, G. Garnweitner, T. Breinlinger, T. Kraft and C. Schilde, ACS Nano, 2015, 9, 10749–10757 CrossRef CAS PubMed.
- N. R. Jana, L. Gearheart and C. J. Murphy, Langmuir, 2001, 17, 6782–6786 CrossRef CAS.
- J. He, Y. Liu, T. Babu, Z. Wei and Z. Nie, J. Am. Chem. Soc., 2012, 134, 11342–11345 CrossRef CAS PubMed.
- W. Li, P. Zhang, M. Dai, J. He, T. Babu, Y.-L. Xu, R. Deng, R. Liang, M.-H. Lu, Z. Nie and J. Zhu, Macromolecules, 2013, 46, 2241–2248 CrossRef CAS.
- J. Park, K. An, Y. Hwang, J. Park, H. Noh, J. Kim, J. Park, N. Hwang and T. Hyeon, Nat. Mater., 2004, 3, 891–895 CrossRef CAS.
- B. Xu, X. Zhang, W. Huang, J. Yang, Y. Ma, Z. Gu, T. Zhai and Y. Zhao, J. Mater. Chem. B, 2016, 4, 2776–2784 RSC.
- J. J. Chiu, B. J. Kim, E. J. Kramer and D. J. Pine, J. Am. Chem. Soc., 2005, 127, 5036–5037 CrossRef CAS PubMed.
- P. Huang, J. Lin, W. Li, P. Rong, Z. Wang, S. Wang, X. Wang, X. Sun, M. Aronova, G. Niu, R. D. Leapman, Z. Nie and X. Chen, Angew. Chem., Int. Ed., 2013, 52, 13958–13964 CrossRef CAS PubMed.
- H. Deng, F. Dai, G. Ma and X. Zhang, Adv. Mater., 2015, 27, 3645–3653 CrossRef CAS PubMed.
- C. Yi, D. Liu, C.-C. Fong, J. Zhang and M. Yang, ACS Nano, 2010, 4, 6439–6448 CrossRef CAS PubMed.
Footnotes |
| † Electronic supplementary information (ESI) available: Experimental details, additional table of XPS characterization, additional figures of experimental setup, size distribution of the assemblies, interfacial tension measurement, additional TEM and 3D tomography images of the assemblies, UV-vis absorption spectra of the assemblies, and photothermal conversion. See DOI: 10.1039/c8qm00560e |
| ‡ These authors contributed equally to this work. |
| This journal is © the Partner Organisations 2019 |


