In situ regulating aspect ratio of bamboo-like CNTs via CoxNi1−x-catalyzed growth to pursue superior microwave attenuation in X-band†
Yan
Cheng
,
Jieming
Cao
,
Hualiang
Lv
,
Huanqin
Zhao
,
Yue
Zhao
and
Guangbin
Ji
 *
*
College of Materials Science and Technology, Nanjing University of Aeronautics and Astronautics, Nanjing 211100, P. R. China. E-mail: gbji@nuaa.edu.cn; Fax: +86-255211-2900; Tel: +86-25-5211-2902
First published on 29th November 2018
Abstract
Carbon material systems, in particular carbon nanotube (CNTs)-based composites, have been demonstrated as potential electromagnetic absorbers if some difficulties, e.g., poor dispersion and lower skin-depth can be solved. To address the above barriers, amorphous bamboo-like carbon nanotubes (BCNTs) with controlled length/diameter ratios were catalyzed by tunable magnetic CoxNi1−x alloys through a facile in situ approach in this research. Such BCNT configuration can suppress the inverse microcurrent intensity and present boosted impedance matching behavior. Meanwhile, an improved dispersion state of BCNTs was achieved as compared to that of common graphited CNTs. Furthermore, reflection loss is highly influenced by the aspect ratio of BCNTs. After tailoring BCNTs to proper diameter, the sample of BCNTs/Co0.2Ni0.8 almost exhibited complete absorption focusing on X-band at low filler ratio of 20 wt%. This composite may be used as a light and efficient microwave absorber in X-band.
1. Introduction
In recent years, electromagnetic (EM) wave radiation has become a concern for human society, including daily health conditions and precise electronic device operation.1 Unwanted microwaves are usually emitted from alternating current equipments or a specific signal such as WiFi. To eliminate the issue, microwave absorption (MA) materials have been developed. Generally, the pursuit of magnetic-dielectric synergistic composites is the most common strategy to achieve excellent MA performance.2–5 In this way, the dual loss mechanism and optimized impedance matching characteristic can significantly dissipate unnecessary EM waves.For the selection of dielectric materials, up to now, lightweight fillers such as carbon materials (carbon sphere, carbon fiber, carbon nanotubes, and graphene) have been preferred due to their lightness and positive dielectric loss ability.6–9 Among these alternatives, carbon nanotubes (CNTs) have been widely employed for their compelling mechanical strength, good conductivity and unique nanostructures.10 For the selection of magnetic components, a single component of magnetic metal (i.e., Fe, Co, Ni) or its alloys are highly attractive because of desirable magnetic loss ability.11–13 Consequently, the combination of CNTs with magnetic metal/alloys has been extensively explored as microwave absorber candidates. For example, Liu et al. deposited cobalt nanoparticles on CNTs for EM wave absorption and obtained effective absorption frequency from 2.5 to 20 GHz with a matched thickness from 1.0 to 6.0 mm.14 Yu's group fabricated rod-like FeCo/CNTs and achieved a minimum reflection loss (RL) value of −46.5 dB and absorption frequency of 3.92 GHz at thickness of 1.7 mm.15 Yang and co-workers fabricated γ-FeNi/CNT nanocomposites by a wet chemical method and accomplished minimum RL of −15.4 dB at 1.6 mm.16 Zhao et al. used Co nanoparticles to modify CNTs and achieved a minimum RL value of −21.84 dB at 12.2 GHz.17
To date, the most used CNTs are commercially purchased at high cost with confined outputs. In addition, the intrinsic high conductivity leads to serious reflection of microwaves on its surface; thus, reducing the complex permittivity by means of magnetic oxide or metal is necessary. A typical complicated synthesis process is described as follows. First, pure CNTs are pre-treated with concentrated acid to functionalize them with carboxyl or hydroxyl groups. Then, metal ions are attached on these active sites and generate metal oxides via a chemical synthetic process. If needed, the metal oxides/CNTs are reduced to corresponding metal/CNTs under the effect of reductant. It is noteworthy that commonly used reductants such as hydrogen and hydrazine hydrate are sometimes dangerous and toxic. As we can see, the traditional composite route is unsuitable for developing CNT-based system.
Based on this consideration, we developed a facile, affordable and large-scale approach to construct low graphitized BCNTs interspersed with CoxNi1−x alloys as alternative microwave absorbers. By means of dicyandiamide as a special ligand, the transition metal Co/Ni could catalyze it in situ, forming well-defined BCNTs in a high-temperature calcination procedure under argon atmosphere. Furthermore, the microstructure and aspect ratio of CNTs could be tuned by varying the Co/Ni atomic ratio. Owing to the unique 1D bamboo-like nanostructure, 3D connected network and synergistic magnetic-dielectric loss, BCNTs/CoxNi1−x composites present superior microwave absorbing performance in X-band. BCNTs/Co0.2Ni0.8 hybrids showed effective absorption in the range of 8.4–11.6 GHz within X-band with the optimal RL of −25.8 dB at filling ratio of only 20 wt%. Furthermore, we believe that this novel and facile method may be adopted to grow adjustable CNTs on other objects’ surfaces to build a distinctive hierarchical structure.
2. Experimental
2.1 Materials
Nickel acetate tetrahydrate (Ni(CH3COO)2·4H2O), cobalt acetate tetrahydrate (Co(CH3COO)2·4H2O) and absolute ethanol were purchased from Sinopharm Chemical Reagent Co., Ltd. Dicyandiamide was purchased from Aladdin. All reagents were used as received without further purification.2.2 Synthesis of heterogeneous BCNTs/CoxNi1−x hybrids
The preparation process could be divided into two steps. First, 4 mmol of Co(CH3COO)2/Ni(CH3COO)2 was dissolved into 25 mL of ethanol. Then, 25 mL ethanol containing 16 mmol dicyandiamide was added with vigorous stirring for 30 min while heating. After that, the magnetic stirring bar was removed and the evenly mixed solution was put into an electro-thermostatic blast oven and heated at 80 °C for 12 h. Next, the dried precursors deposited on beaker walls and bottom were carefully collected and ground for at least 30 min. Second, the as-obtained precursors were annealed in a horizontal-tube furnace under 800 °C for 2 h with 10 °C min−1 ramping rate. The protective atmosphere was argon (Ar). The molar ratios of Co(CH3COO)2 to Ni(CH3COO)2 were set as 10![[thin space (1/6-em)]](https://www.rsc.org/images/entities/char_2009.gif) :
:![[thin space (1/6-em)]](https://www.rsc.org/images/entities/char_2009.gif) 0, 8
0, 8![[thin space (1/6-em)]](https://www.rsc.org/images/entities/char_2009.gif) :
:![[thin space (1/6-em)]](https://www.rsc.org/images/entities/char_2009.gif) 2, 5
2, 5![[thin space (1/6-em)]](https://www.rsc.org/images/entities/char_2009.gif) :
:![[thin space (1/6-em)]](https://www.rsc.org/images/entities/char_2009.gif) 5, 2
5, 2![[thin space (1/6-em)]](https://www.rsc.org/images/entities/char_2009.gif) :
:![[thin space (1/6-em)]](https://www.rsc.org/images/entities/char_2009.gif) 8, and 0
8, and 0![[thin space (1/6-em)]](https://www.rsc.org/images/entities/char_2009.gif) :
:![[thin space (1/6-em)]](https://www.rsc.org/images/entities/char_2009.gif) 10, which corresponded to samples of Co1Ni0/BCNTs, Co0.8Ni0.2/BCNTs, Co0.5Ni0.5/BCNTs, Co0.2Ni0.8/BCNTs, and Co0Ni1/BCNTs and are denoted as S1, S2, S3, S4, and S5 in the following description.
10, which corresponded to samples of Co1Ni0/BCNTs, Co0.8Ni0.2/BCNTs, Co0.5Ni0.5/BCNTs, Co0.2Ni0.8/BCNTs, and Co0Ni1/BCNTs and are denoted as S1, S2, S3, S4, and S5 in the following description.
2.3 Characterization
A powder X-ray diffractometer (XRD, Bruker D8 ADVANCE, using Cu Kα radiation, λ = 0.154178 nm, 40 kV scanning voltage and 40 mA scanning current) was employed to identify the phase structures. The morphology and microstructure were observed by transmission electron microscopy (TEM, JEOL, JEM-2100) and scanning electron microscopy (SEM, Hitachi S4800). Raman spectroscopy (Renishaw inVia 2000) was used to evaluate the bonding state of carbon. The atomic ratios of Co and Ni were confirmed by inductively coupled plasma-atomic emission spectroscopy (ICP-AES). The surface chemical composition was detected by X-ray photoelectron spectroscopy (XPS) equipped with a PHI 5000 Versa Probe system and an Al Kα X-ray source at 150 W. The surface areas and porous structures were determined by Micromeritics ASAP 2020 system on a BET analyzer. Electromagnetic parameters (εr, μr) were analyzed by an Agilent PNA N5244A vector network analyzer at 2–18 GHz via coaxial-line method and can be calculated by an algorithm software based on the measured S parameters. The toroidal samples (outer diameter 7.00 mm, inner diameter 3.04 mm) were prepared by homogeneously mixing as-prepared composites with paraffin wax at filling content of 20 wt%.3. Results and discussion
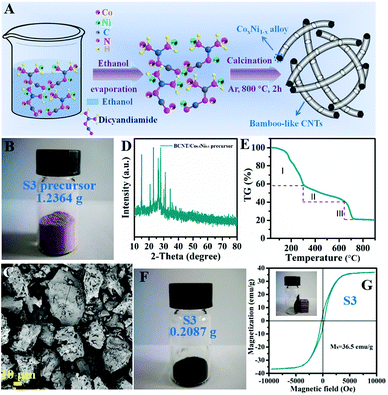
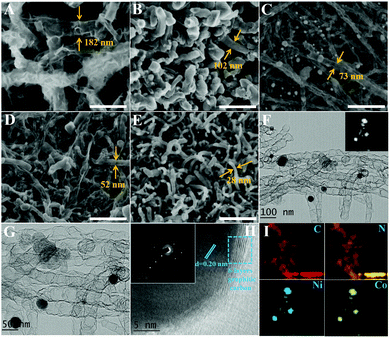
A brief synthetic procedure is presented in Fig. 1A. Initially, Co, Ni salt and dicyandiamide are uniformly mixed in ethanol solvent. During this reaction process, the N atom in dicyandiamide has an unpaired lone pair electron; meanwhile, transition metal Co2+ or Ni2+ ions have empty orbits. Thus, N atoms are apt to bond with the metal ions to form stable coordination compounds, which is similar to that observed for the zeolitic imidazolate framework (ZIF-67).18 After evaporation of ethanol, the precursor powders are treated with high-temperature calcination under Ar atmosphere to produce BCNTs/CoxNi1−x composites. As seen in Fig. 1B and C, the S3 precursor shows light pink color, ordered microstructure and micro-sized morphology, which are similar to metal–organic-framework (MOF) features. Its XRD pattern (Fig. 1D) further demonstrates the formation of an ordered crystalline structure. The TG curve in Fig. 1E clearly presents the decomposition process of S3 precursor versus temperature under protected atmosphere. Combined with the unique microstructure (CoNi alloys lie in the interior of BCNTs), we can rationally deduce the growth mechanism. During heat treatment process, the dicyandiamide ligand is incompletely carbonized at first stage (rapid mass decline, <300 °C); as temperature rises, ionized Co/Ni can be reduced to metal nanoparticles by carbon species during the second stage (slow mass decline, between 300 and 650 °C). Once Co/Ni metal is generated, the decomposed gas molecules, proved by the existence of mesopores from BET, are pulverized on the metal surface and the generated carbon undergoes epitaxial growth with the catalytic effect of transition metal to form BCNTs at the third stage (between 650 and 700 °C). Thereafter, we attempt to regulate the atomic ratio of Co and Ni (based on different metal activities) to further explore their role in BCNT growth as well as their microwave absorbing performance. The images of S3 (Fig. 1F and G) show that the pink precursor was converted to typical dark carbon materials after calcination and can be attracted to a wall of glass by a magnet, indicating its good magnetism. The rate of production, 16.9%, can also be calculated through the mass change between precursor and product, which is similar to the TG result shown in Fig. 1E.As exhibited in Fig. 2A–E and S1A–H,† both Co and Ni exhibit good catalytic reactivities for dicyandiamide to generate well-defined CNTs. The differences are that the obtained-BCNTs have distinct diameters and lengths. The CNTs catalyzed by pure Co are thick and long (Fig. S1A and B†). Although related CNTs have been observed upon decomposition of ZIF-67, such unique and high aspect ratios of bamboo-like CNTs are rare. In contrast, the CNTs catalyzed by pure Ni are thin and short (Fig. S1G and H†). Accordingly, a trend can be shown: the diameters of S1–S5 (182, 102, 73, 52, and 28 nm, respectively) gradually reduce with increase in Ni content and depend on different catalytic activities of Co and Ni. TEM images of S3 (Fig. 2F and G) clearly display the inner structure of BCNTs. Unlike traditional hollow CNTs, our prepared CNTs are segmented and bamboo-like, and the metal alloys are mostly located in the interior of CNTs. Fig. 2H presents the lattice spacing (0.20 nm) of wrapped nanoparticles, which is assigned to the (111) plane of CoNi alloy. In addition, the selected area electron diffraction (SAED) pattern further validates the perfect metal alloy and its monocrystalline characteristic. The surrounding carbon also displays high degree of graphitization due to the catalytic action of CoNi (encircled by a blue frame). The elemental mapping of S3 (Fig. 2I) illustrates that the sample is N-doped and the distributions of Co, Ni, N and C are uniform, which indicates that the produced metal granules are the expected alloys and not monodisperse metals.
Fig. 3A presents the XRD patterns of all the composites. The diffraction peaks of Co and Ni are similar but exhibit a slight shift. Three diffraction peaks at about 44.3°, 51.5° and 75.8° are ascribed to the (111), (200) and (220) planes of Co/Ni, respectively. It is clearly observed that the abovementioned diffraction peaks gradually shift right at elevated Ni ratios. This can be easily understood by Bragg's equation (2d![[thin space (1/6-em)]](https://www.rsc.org/images/entities/char_2009.gif) sin
sin![[thin space (1/6-em)]](https://www.rsc.org/images/entities/char_2009.gif) θ = nλ). As we know, Ni atom has a smaller radius than Co; it leads to a larger lattice spacing (d). Thus, the corresponding diffraction position moves to higher angles. Except this shift, the diffraction intensity becomes increasingly sharper with increasing Ni ratio. This can be due to the lower reducing potential of Ni2+ (−0.26 V) than that of Co2+ (−0.28 V). Another weak peak at 26° is assigned to amorphous carbon. The CoNi alloy content and atomic ratios were clarified by the ICP-AES technique, as plotted in Fig. 3B. The mass fractions of alloy occupy 52.6%, 43.1%, and 47.2% in S2–S4, respectively. Simultaneously, the measured ratios of 4.25, 1.04, and 0.26 agree well with their theoretical values of 4, 1, and 0.25 (Co0.8Ni0.2, Co0.5Ni0.5, Co0.2Ni0.8), suggesting the formation of the desired alloys.
θ = nλ). As we know, Ni atom has a smaller radius than Co; it leads to a larger lattice spacing (d). Thus, the corresponding diffraction position moves to higher angles. Except this shift, the diffraction intensity becomes increasingly sharper with increasing Ni ratio. This can be due to the lower reducing potential of Ni2+ (−0.26 V) than that of Co2+ (−0.28 V). Another weak peak at 26° is assigned to amorphous carbon. The CoNi alloy content and atomic ratios were clarified by the ICP-AES technique, as plotted in Fig. 3B. The mass fractions of alloy occupy 52.6%, 43.1%, and 47.2% in S2–S4, respectively. Simultaneously, the measured ratios of 4.25, 1.04, and 0.26 agree well with their theoretical values of 4, 1, and 0.25 (Co0.8Ni0.2, Co0.5Ni0.5, Co0.2Ni0.8), suggesting the formation of the desired alloys.
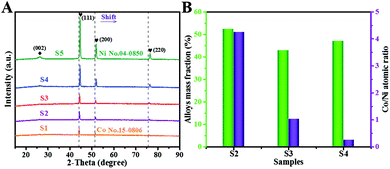 | ||
| Fig. 3 (A) XRD patterns of all samples; (B) final CoNi alloy mass fractions and Co/Ni atomic ratios of S2-S4. | ||
Fig. 4A shows the Raman spectra to explore the carbon bonding states of all composites. Two evident peaks located at 1348 and 1584 cm−1 belong to D-band and G-band of carbon species, respectively. The D-band is a breathing mode of A1g symmetry, involving phonons near the K zone boundary, and represents disordered carbon or graphite crystals; G-band corresponds to E2g mode induced by stretching vibrations of sp2 bond and indicates graphitic carbon. The intensity ratio of D- and G-bands (ID![[thin space (1/6-em)]](https://www.rsc.org/images/entities/char_2009.gif) :
:![[thin space (1/6-em)]](https://www.rsc.org/images/entities/char_2009.gif) IG) is used to evaluate the graphitization degree.19,20 Except for S1, other samples show similar ID
IG) is used to evaluate the graphitization degree.19,20 Except for S1, other samples show similar ID![[thin space (1/6-em)]](https://www.rsc.org/images/entities/char_2009.gif) :
:![[thin space (1/6-em)]](https://www.rsc.org/images/entities/char_2009.gif) IG values approaching 1, illustrating comparable and relatively low graphitization degrees. S1 exhibits a relatively high value of 2.11, which may be ascribed to insufficient catalysis of metal Co for BCNTs. However, all the values are far higher than the ID/IG ratio of purchased commercial CNTs (Fig. 4B). According to the skin effect theory, the skin-depth can be expressed as
IG values approaching 1, illustrating comparable and relatively low graphitization degrees. S1 exhibits a relatively high value of 2.11, which may be ascribed to insufficient catalysis of metal Co for BCNTs. However, all the values are far higher than the ID/IG ratio of purchased commercial CNTs (Fig. 4B). According to the skin effect theory, the skin-depth can be expressed as  . The commercial CNTs with higher conductivity have lower skin-depth that leads to most microwaves being reflected from the absorber surface, causing poor impedance matching behaviour. In contrast, BCNTs with large skin-depth can absorb microwaves as much as possible into samples and subsequently attenuate them. As a result, the low-graphitized BCNTs can effectively suppress the inverse microcurrent intensity and overcome the deficiency of exorbitant electric conductivity of traditional CNTs.
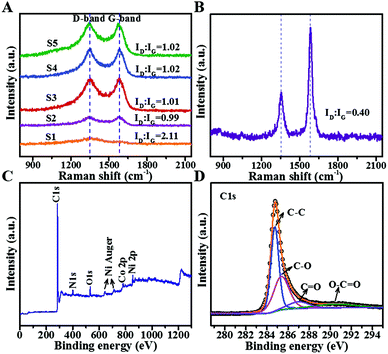 | ||
| Fig. 4 (A, B) Raman spectra of all samples and commercially purchased MCNTs, respectively; (C) XPS survey scan of S3; (D) the split peaks for C1S. | ||
For further investigating the chemical compositions, XPS analysis of S3 is performed, as shown in Fig. 4C. The scan spectrum (Fig. 4C) proves the existence of C, N, O, Ni, and Co in the composites, which is in accordance with elemental mapping. N is derived from the decomposition of dicyandiamide. O may be produced due to the oxidation of Co, Ni or oxygen functional groups on surfaces. To feature specific elemental states, splitting peaks are needed. As exhibited in Fig. 4D, C 1s profile can be deconvoluted into four peaks centered at 284.7, 285.4, 287.0 and 290.3 eV, which subsequently correspond to C–C, C–O, C![[double bond, length as m-dash]](https://www.rsc.org/images/entities/char_e001.gif) O, and O–C
O, and O–C![[double bond, length as m-dash]](https://www.rsc.org/images/entities/char_e001.gif) O.21 These functional groups attached on the surface can respond to the applied electric field and cause dipole polarization loss. Fig. S2A and S2B† reveal that Co0.5Ni0.5 alloy is partly oxidized, which may weaken the overall magnetic properties.
O.21 These functional groups attached on the surface can respond to the applied electric field and cause dipole polarization loss. Fig. S2A and S2B† reveal that Co0.5Ni0.5 alloy is partly oxidized, which may weaken the overall magnetic properties.
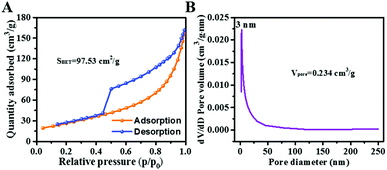
It is known that porous features and large surface areas are beneficial for prolonging microwave transmission and dissipation. Fig. 5A displays a typical IV type sorption isotherm (P/P0 > 0.4) for S3, confirming the existence of mesopores, with the diameters mainly concentrated at 3 nm (Fig. 5B). As previously mentioned, mesopore generation could be ascribed to the release of gas molecules during the heating process. The BET surface area of S3 is 97.53 m2 g−1 and the pore volume is 0.234 cm3 g−1.
MA performance is a critical criterion to evaluate microwave absorbers and has been calculated according to the following equations:22–24
Zin = Z0(μr/εr)1/2tan![[thin space (1/6-em)]](https://www.rsc.org/images/entities/char_2009.gif) h[j(2πfd/c)(μr/εr)1/2] h[j(2πfd/c)(μr/εr)1/2] | (1) |
| RL (dB) = 20log|(Zin − 1)/(Zin + 1) | (2) |
Here, Zin and Z0 represent the input impedance of absorber and impedance of free space, respectively; f indicates the frequency of microwaves, d is the coating thickness, εr (εr = ε′ − jε′′) represents complex permittivity and μr (μr = μ′ − jμ′′) represents complex permeability. For practical applications, the conversion of 90% of incident microwaves (RL < −10 dB) is available. As shown in Fig. 6A, S1 has poor MA capability because the minimum RL value cannot surpass −5 dB under thickness range of 2–4 mm across 8–12 GHz. After adding Ni, MA performance of S2–S5 is enhanced clearly compared with that of S1. In detail, S2 (Fig. 6B) exhibits 3.0 GHz (9.0–12.0) absorption range at minimal thickness of 2.55 mm and 2.7 GHz (8.0–10.7) absorption range at maximum thickness of 2.8 mm. Similarly, from Fig. 6B–F, it is observed that the broadest absorption range (3.4 GH) is achieved for S5 at 2.9 mm. The strongest RL intensities of S4 and S5 are −25.8 and −30.7 dB at thicknesses of 2.8 and 2.75 mm, respectively, with effective absorption bandwidths of 3.2 (8.4–11.6) and 3.3 (8.6–11.9) GHz. Hence, both of them achieve attractive absorbing properties in the X-band range. To reflect the performance advantages of S4, similar metal/CNT composites are listed in Table 1. As we can see, sample S4 presents integrated superiority in the absorption of X-band at low filler content but with slightly larger thickness than that of previously reported materials, which is mostly focused on Ku-band absorption. It is believed that the relatively low dielectric loss of S4 (Fig. 7) is the primary reason that results in coating of slightly large thickness for solving the X-band issue. Due to dielectric loss limitation, the coating should be thicker to sufficiently attenuate incident microwaves.14–17,25,26
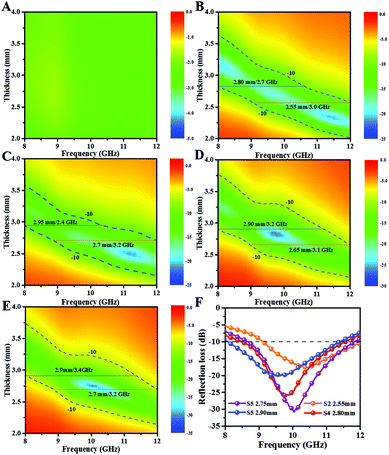 | ||
| Fig. 6 (A–E) RL of 2D contour maps of S1–S5 in X-band; (F) RL curves for S2 at the minimal thickness, S4 and S5 at the strongest absorption intensity, and S5 at the broadest absorption range. | ||
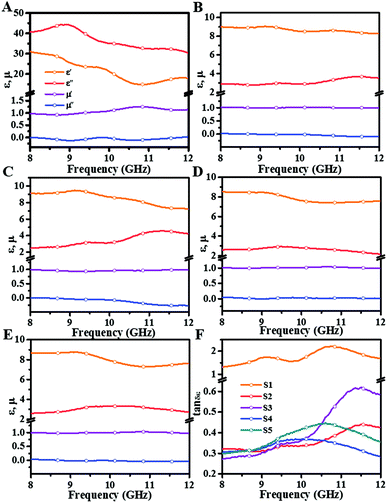 | ||
| Fig. 7 (A–E) Frequency dependence of complex permittivity and permeability in X-band; (F) dielectric loss factors of all samples in X-band. | ||
| Samples | Coating thickness/nm | The minimum RL/dB | Absorption band, range/GHz | Total absorbing bandwidth/GHz | Filler content/wt% | Ref. |
|---|---|---|---|---|---|---|
| Co/CNTs | 4.0 | −36.5 | S (3.6–4.0) | 1 | 20 | 14 |
| C (4.0–4.6) | ||||||
| FeCo/CNTs | 1.7 | −46.5 | X (10.88–12) | 3.92 | 50 | 15 |
| Ku (12–14.8) | ||||||
| γ-FeNi/CNTs | 1.6 | −15.4 | X (9.0–10.5) | 3.5 | 2 | 16 |
| Ku (15.7–18.0) | ||||||
| Co-filled CNTs | 1.0 | −21.84 | X (10.8–12) | 3.4 | 20 | 17 |
| Ku (12–14.2) | ||||||
| Fe-filled CNTs | 1.0 | −31.71 | X (11.8–12) | 2.9 | 20 | 25 |
| Ku (12–14.7) | ||||||
| CNTs/Co | 1.81 | −60.4 | Ku (12.8–18) | 5.2 | 20 | 26 |
| BCNTs, Co0.2Ni0.8 | 2.8 | −25.8 | X (8.4–11.6) | 3.2 | 20 | This work |
To clarify the variation in MA performance, analysis of electromagnetic parameters is decisive. It is well-known that ε′ and μ′ represent storage capability for electric energy and magnetic energy; ε′′ and μ′′ represent consumption ability for electric energy and magnetic energy.27 It is acknowledged that the electromagnetic parameters are highly correlated with microstructure/composition (identified by SEM, XRD, and Raman spectrum) of samples; thus, analysing the relationship between them is necessary. As presented in Fig. 7A, S1 possess high ε′ and ε′′ values (initial values >30), which seriously deteriorate its impedance matching with air, thus allowing most microwave reflection back from the absorber surface. Interestingly, the anomalous large permittivity is incompatible with low graphitization degree. In general, permittivity is positively correlated with graphitization. This may be due to thicker diameter and longer length of S1. On one hand, a thicker diameter of CNTs is found to initiate higher dielectric permittivity.28 On the other hand, the longer length facilitates formation of a well-conductive network and generates microcurrent along with CNT branches. Accordingly, S1 presents the largest permittivity among all samples. By contrast, complex permittivity of other samples is moderate and reasonable. Fig. 7B displays electromagnetic parameters of S2. It can be seen that ε′ exhibits typical frequency dispersion behaviour, which decreases from 9.0 to 8.1 with rising frequency. The ε′′ is maintained around 3.0 and with an upward trend in the 10.1–12 GHz range. As compared to the permittivity of sample S1, the permittivity rapidly decreases with improved graphitization. From SEM and TEM results, we can see that both diameter and length are reduced after adding Ni. Also, the XRD results reveal that both crystalline and grain sizes gradually increase with Ni content. The increased grain size can lead to reduced interface area and conductive sites, thus minimizing the permittivity. As displayed in Fig. 7C, ε′ of S3 is between 9.0 and 7.2, and ε′′ increases from 2.5 to 4.5. Notably, there is clear polarization behaviour at 11.3 GHz, which is presented as the simultaneous decline of ε′ and increase in ε′′. From microstructures of BCNTs, it is found that S3 has the most regular and delicate structure, which achieves a better galvanic circle, especially at high frequencies, corresponding to the boost of ε′′ after 10 GHz. From Fig. 7D and E, we could observe that the ε′ and ε′′ values of S4 and S5 show a high degree of similarity, due to which their optimal RL curves are obtained at similar thicknesses. Based on the above analysis, we can conclude that the continuity of BCNTs suffered severe damage upon adding excessive Ni atoms at low thickness. Hence, the ε′ (∼8) and ε′′ (∼2) values are slightly lower than those of previous samples and remain at a stable level.
Examining the complex permeability of all composites, we note that magnetic storage and loss are slightly inferior in spite of these composites displaying excellent magnetic properties (Fig. S3A and B†). This can be because of the low filler content (20%) of composites, which weakens their intrinsic magnetism to some extent.
It is well-known that dielectric (tan![[thin space (1/6-em)]](https://www.rsc.org/images/entities/char_2009.gif) δε = ε′′/ε′) and magnetic loss factors (tan
δε = ε′′/ε′) and magnetic loss factors (tan![[thin space (1/6-em)]](https://www.rsc.org/images/entities/char_2009.gif) δμ = μ′′/μ′) intuitively estimate the dielectric and magnetic loss abilities of absorbers. As shown in Fig. 7F, the highest dielectric dissipation values are obtained for S1, for which partial values are even greater than 1.0. The values of others are much closer, ranging from 0.25 to 0.6, and have increased response at elevated frequencies (10–12 GHz). Magnetic loss factors are presented in Fig. S4.† We observe that the values of all samples are lower than 0.2 over 2–18 GHz and decrease with increase in frequency, demonstrating inferior magnetic loss.
δμ = μ′′/μ′) intuitively estimate the dielectric and magnetic loss abilities of absorbers. As shown in Fig. 7F, the highest dielectric dissipation values are obtained for S1, for which partial values are even greater than 1.0. The values of others are much closer, ranging from 0.25 to 0.6, and have increased response at elevated frequencies (10–12 GHz). Magnetic loss factors are presented in Fig. S4.† We observe that the values of all samples are lower than 0.2 over 2–18 GHz and decrease with increase in frequency, demonstrating inferior magnetic loss.
To further evaluate integral dissipation abilities of composites (containing both dielectric and magnetic loss), the attenuation constant α is calculated according to the following equation:29–31
 | (3) |
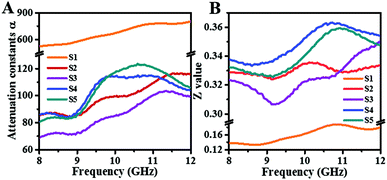
As presented in Fig. 8A, sample S1 still has the highest attenuation values similar to its dielectric loss factor. However, the MA performance of S1 is the poorest of all hybrids. Here, impedance matching value (Z) is another significant criterion for final MA properties, which can be determined by the following equation:32,33
 | (4) |
As seen from Fig. 8B, there is no doubt that S1 has the lowest values compared to other samples, which are lower than 0.2. This explains the reason for poor MA capability of S1. In comparison, the other four samples exhibit moderate microwave attenuation ability (70–120) and superior impedance matching with air (>0.3); thus, they achieve favourable MA performance in X-band.
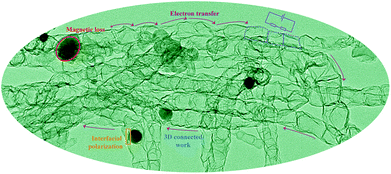
The intrinsic microwave attenuation from CoxNi1−x/BCNTs hybrids is briefly summarized in Fig. 9. First, the 3D connected network favours electron transfer among different BCNTs, which provides a basic foundation for conduction loss. Second, interfacial polarization relaxation between BCNTs and CoxNi1−x alloys results in increase in microwave conversion. Moreover, the magnetic loss induced by CoNi alloys is another aspect that cannot be neglected in the dissipation of incident microwaves. Furthermore, the unique bamboo-like segments can act as equivalent circuits to attenuate incident microwaves and transform them into heat energy.
4. Conclusions
In this study, we develop a facile and large-scale route to synthesize BCNTs, by decorating with CoNi alloys, which are further used as superior lightweight microwave absorbers in X-band. This in situ catalytic growth of CNTs applied to transition metal Co/Ni and dicyandiamide ligands is more convenient and cost-efficient than traditional CNT-based systems. Moreover, the effect of Co/Ni ratio on the growth of BCNTs was investigated. With increase in Ni content, the diameter of BCNTs has the tendency to decrease, whereas the MA properties are enhanced in the X-band. For BCNTs/Co0.2Ni0.8 hybrids, the minimum RL intensity is up to −25.8 dB with 3.2 GHz (8.4–11.6, in X-band range) effective bandwidth at 2.8 mm thickness when the filling ratio is as low as 20 wt%, which may render them promising candidates as X-band microwave absorbers.Conflicts of interest
There are no interests to declare.Acknowledgements
Financial supports from the Aeronautics Science Foundation of China (2017ZF52066), the National Nature Science Foundation of China (No. 11575085), the Qing Lan Project, Six talent peaks project in Jiangsu Province (No. XCL-035), the Open Research Fund of Jiangsu Provincial Key Laboratory for Nanotechnology of Nanjing University, the Funding for Outstanding Doctoral Dissertation in NUAA (No. BCXJ17-07), Postgraduate Research & Practice Innovation of Jiangsu Province (KYCX17_0252) and the Priority Academic Program Development of Jiangsu Higher Education Institutions (PAPD) are gratefully acknowledged.References
- H. L. Lv, Z. H. Yang, P. L. Y. Wang, G. B. Ji, J. Z. Song, L. R. Zheng, H. B. Zeng and Z. C. J. Xu, Adv. Mater., 2018, 345, 441–451 Search PubMed.
- J. S. Deng, X. Zhang, Z. Y. Bai, S. M. Li, S. M. Li and R. Zhang, J. Mater. Chem. C, 2018, 26, 712807140 Search PubMed.
- J. J. Xu, J. W. Liu, R. C. Che, C. Y. Liang, M. S. Cao, Y. Li and Z. W. Liu, Nanoscale, 2014, 6, 5782–5790 RSC.
- H. Wang, Y. Y. Dai, W. J. Gong, D. Y. Geng, S. Ma, D. Li, W. Liu and Z. D. Zhang, Appl. Phys. Lett., 2013, 102, 223113 CrossRef.
- Y. Liu, Y. N. Li, K. D. Jiang, G. X. Tong, T. X. Lv and W. H. Wu, J. Mater. Chem. C, 2016, 4, 7316–7323 RSC.
- Y. Cheng, Z. Y. Li, Y. Li, S. S. Dai, G. B. Ji, H. Q. Zhao, J. M. Cao and Y. W. Du, Carbon, 2018, 127, 643–652 CrossRef CAS.
- M. S. Cao, W. L. Song, Z. L. Hou, B. Wen and J. Yuan, Carbon, 2010, 48, 788–796 CrossRef CAS.
- Q. Song, F. Ye, X. W. Yin, W. Li, H. J. Li and Y. S. Liu, et al. , Adv. Mater., 2017, 29, 1701583 CrossRef PubMed.
- H. L. Lv, Y. H. Guo, Z. H. Yang, Y. Cheng, L. Y. Wang and B. S. Zhang, et al. , J. Mater. Chem. C, 2017, 5, 491–512 RSC.
- W. L. Song, M. S. Cao, Z. L. Hou, J. Yuan and X. Y. Fang, Scr. Mater., 2009, 61, 201–204 CrossRef CAS.
- H. L. Lv, G. B. Ji, W. Liu and H. Q. Zhang, J. Mater. Chem. C, 2015, 3, 10232–10241 RSC.
- Y. Cheng, G. B. Ji, Z. Y. Li, H. L. Lv, W. Liu, Y. Zhao, J. M. Cao and Y. W. Du, J. Alloys Compd., 2017, 704, 289–295 CrossRef CAS.
- H. Li, Z. M. Cao, J. Y. Lin, H. Zhao, Q. R. Jiang, Z. Y. Jiang, H. G. Liao, Q. Kuang and Z. X. Xie, Nanoscale, 2018, 10, 1930–1938 RSC.
- N. N. Wu, H. L. Lv, J. R. Liu, Y. Z. Liu, S. Y. Wang and W. Liu, Phys. Chem. Chem. Phys., 2016, 18, 31542–31550 RSC.
- B. Yang, Y. Wu, X. P. Li and R. H. Yu, Mater. Des., 2017, 136, 13–22 CrossRef CAS.
- Q. X. Yang, L. Liu, D. Hui and M. Chipara, Composites, Part B, 2016, 87, 256–262 CrossRef CAS.
- D. L. Zhao, J. M. Zhang, X. Li and Z. M. Shen, J. Alloys Compd., 2010, 505, 712–716 CrossRef CAS.
- S. W. Li, S. J. Peng, L. S. Huang, X. Q. Cui, A. M. Al-Enizi and G. F. Zheng, ACS Appl. Mater. Interfaces, 2016, 8, 20534–20539 CrossRef CAS PubMed.
- B. Mordina, R. Kumar, R. K. Tiwari, D. K. Setua and A. Sharma, J. Phys. Chem. C, 2017, 121, 7810–7820 CrossRef.
- R. Qiang, Y. C. Du, Y. Wang, N. Wang, C. H. Tian, J. Ma, P. Xu and X. J. Han, Carbon, 2016, 98, 599–606 CrossRef CAS.
- N. Zhou, Q. D. An, Z. Y. Xiao, S. R. Zhai and Z. Shi, RSC Adv., 2017, 7, 45156–45169 RSC.
- H. Luo, W. L. Feng, C. W. Liao, L. W. Deng, S. Liu, H. B. Zhang and P. Xiao, J. Appl. Phys., 2018, 123, 104103 CrossRef.
- G. Z. Wang, Z. Gao, S. W. Tang, C. Q. Chen, F. F. Duan and S. C. Zhao, et al. , ACS Nano, 2012, 6, 11009–11017 CrossRef CAS PubMed.
- H. L. Lv, G. B. Ji, X. H. Liang and Y. W. Du, J. Mater. Chem. C, 2015, 3, 5056–5064 RSC.
- D. L. Zhao, X. Li and Z. M. Shen, J. Alloys Compd., 2009, 471, 457–460 CrossRef CAS.
- Y. C. Yin, X. F. Liu, X. J. Wei, R. H. Yu and J. L. Shui, ACS Appl. Mater. Interfaces, 2016, 8, 34686–34698 CrossRef CAS PubMed.
- N. Zhou, Q. D. An, Z. Y. Xiao, S. R. Zhai and Z. Shi, ACS Sustainable Chem. Eng., 2017, 5, 5394–5407 CrossRef CAS.
- J. Macutkevic, P. Kuzhir, A. Paddubskaya, M. Shuba, J. Banys, S. Maksimenko, V. L. Kuznetsov, I. N. Mazov and D. V. Krasnikov, Phys. Status Solidi A, 2013, 210, 2491–2498 CrossRef CAS.
- M. T. Qiao, X. F. Lei, Y. Ma, L. D. Tian, X. W. He, K. H. Su and Q. Y. Zhang, Nano Res., 2018, 11, 1500–1519 CrossRef CAS.
- G. Z. Wang, Z. Gao, G. P. Wan, S. W. Lin, P. Yang and Y. Qin, Nano Res., 2014, 7, 704–716 CrossRef CAS.
- D. Ding, Y. Wang, X. D. Li, R. Qiang, P. Xu, W. L. Chu, X. J. Han and Y. C. Du, Carbon, 2017, 111, 722–732 CrossRef CAS.
- X. M. Zhang, G. B. Ji, W. Liu, X. X. Zhang, Q. W. Gao, Y. C. Li and Y. W. Du, J. Mater. Chem. C, 2016, 4, 1860–1870 RSC.
- Y. B. Zhang, P. Wang, Y. Wang, L. Qiao, T. Wang and F. S. Li, J. Mater. Chem. C, 2015, 3, 10813–10818 RSC.
Footnote |
| † Electronic supplementary information (ESI) available. See DOI: 10.1039/c8qi01102h |
| This journal is © the Partner Organisations 2019 |

