Effect of calcination temperature on the microstructure of vanadium nitride/nitrogen-doped graphene nanocomposites as anode materials in electrochemical capacitors†
Jinghua
Liu
a,
Fengfan
Li
a,
Weiwei
Liu
a and
Xin
Li
 *ab
*ab
aMIIT Key Laboratory of Critical Materials Technology for New Energy Conversion and Storage, School of Chemistry and Chemical Engineering, Harbin Institute of Technology, Harbin 150001, China. E-mail: lixin@hit.edu.cn
bState Key Lab of Urban Water Resource and Environment, Harbin Institute of Technology, Harbin 150090, China
First published on 14th November 2018
Abstract
Hybrid vanadium nitride/N-doped graphene (VN/N-Gr) nanocomposites have been recently used as anode materials in electrochemical capacitors. The electrochemical performances of electrode materials are dependent on their microstructures, which in turn are dependent on the fabrication methods and conditions. In this study, VN/N-Gr nanocomposites were fabricated by an in situ method by pyrolysis of a mixture of dicyandiamide, glucose, and vanadium(IV) oxide sulfate hydrate under a N2 atmosphere. The effect of calcination temperature on the microstructure of the as-prepared products was systematically investigated. It is found that calcination temperature can greatly influence the structure, VNxOy and doping N content of VN/N-Gr, as well as the corresponding electrochemical performance. As an electrochemical capacitor electrode, the VN/N-Gr nanocomposite prepared at 700 °C exhibits a high specific capacitance of 342.1 F g−1 at 0.5 A g−1 in a 2 M KOH aqueous electrolyte with a wide operation window from −1.0 to 0.2 V. Furthermore, the assembled symmetrical device delivers an energy density of 10.3 W h kg−1 at a power density of 276.3 W kg−1 and remains 7.6 W h kg−1 at a power density of 5484.2 W kg−1. The findings in this work suggest that a judicious choice of calcination temperature during the pyrolysis process could improve the performances of electrode materials and the corresponding devices.
Introduction
Electrochemical capacitors (ECs), also called supercapacitors, have attracted increasing scientific and technological attention due to their high power density, fast charge/discharge processes, and long cycle life.1–6 ECs as representative modern electrochemical energy-storage devices have been widely used for hybrid electrical vehicles with complementary electrochemical characteristics to traditional electric capacitors and rechargeable batteries. Typical ECs can be categorized into electrical double-layer capacitors (EDLCs) and pseudocapacitors (PCs).7–9 EDLCs mainly store energy based on the charges adsorbed on the electrode/electrolyte interfaces. In contrast, PCs store energy on the basis of fast reversible surface redox reactions.Transition metal nitrides, such as vanadium nitride (VN),10,11 copper nitride,12 titanium nitride,13,14 iron nitride,15,16 and molybdenum nitride,17,18 have been investigated as electrode materials in recent years. Among them, VN is one of the most widely studied anode materials for ECs due to its excellent electrical conductivity (1.6 × 10⁶ Ω−1 m−1) and high specific capacitance. Choi et al. reported the highest specific capacitance of VN, which can deliver 1340 F g−1 at a scan rate of 2 mV s−1.19 This high performance can be ascribed to the high conductivity and reversible redox reactions through vanadium oxide (VOx) layers formed on the surface of VN. It should be noted that VN is vulnerable to be oxidized, which is electrochemically unstable in aqueous electrolytes.19,20 To resolve this problem, it is helpful to protect the surface of VN from oxidation by introducing a carbon matrix.
An NH3 atmosphere is usually used in the fabrication of vanadium-based/carbon hybrids (VBCHs), which could cause environmental pollution.11,21,22 Recently, a simple, scalable, and environment friendly preparation method has been applied to prepare VBCHs for energy storage. The mainstream approach for fabricating VBCHs is the calcination of precursors (including vanadium, carbon, and nitrogen sources) under a N2 atmosphere with high temperature. Unlike the heat treatment under NH3 gas, which usually causes the doping of N at the defect sites and/or the edges of the carbon matrix. With this method, N can be doped uniformly in the carbon matrix. For instance, Ran et al. fabricated VN/porous carbon as an anode material with a specific capacitance of 255.0 F g−1 at 1.0 A g−1 in 2 M KOH by a thermolysis process of melamine and vanadium pentoxide xerogel.23 Tong et al. used melamine and ammonium metavanadate (NH4VO3) as precursors to prepare vanadium-based composites encapsulated in a carbon matrix.24 They can be used as anode materials for lithium-ion batteries. Balamurugan et al. reported the fabrication of VN/nitrogen-doped graphene composites using vanadium(IV) oxide sulfate hydrate (VOSO4), dicyandiamide (DCDA) and graphene oxide as precursors, showing stable high performance in 6 M KOH solution.25 More recently, Zhang and co-workers synthesized VN/nitrogen-doped graphene nanocomposites by calcining a mixture of NH4VO3, DCDA, and glucose under a N2 atmosphere at 800 °C. The mass ratio of VN to nitrogen-doped graphene was adjusted by changing the mass of NH4VO3, which exhibited a maximum capacitance of 255 F g−1 at 10 mV s−1.26 These results highlight the merits of VBCHs as electrode materials for energy storage application. As is known, the electrochemical performances of electrode materials are dependent on their microstructures, which in turn are dependent on the fabricating methods and conditions. Temperature is one of the most important factors during the pyrolysis process. Without a doubt, the absence of systematic investigations on calcination temperature could hinder the development of novel electrode materials for SCs.
Hence, we employed an in situ growth strategy to prepare VN/N-Gr nanocomposites with different VN and doping N contents by pyrolysis of a mixture of DCDA, glucose, and VOSO4 at 600, 700, 800, and 900 °C under a N2 atmosphere. VN nanoparticles with an average size of about 4 nm were encapsulated uniformly into the N-doped graphene skeleton. We also discussed the influence of calcination temperature in detail. The results demonstrate that the calcination temperature has a great influence on the structure of VN/N-Gr nanocomposites, which leads to different electrochemical performances.
Experimental
Synthesis of VN/N-Gr nanocomposites
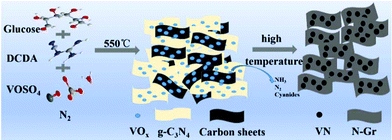
In a typical procedure, a two-step heating method was used to directly prepare VN/N-Gr nanocomposites. The overall preparation process is depicted in Scheme 1. 2 g of DCDA, 0.2 g of glucose, and 0.10 g of VOSO4 were mixed completely by grinding to form a light blue powder. Then, the mixture was put into a porcelain boat with a cover and heated up to 550 °C at a rate of 2 °C min−1 and then kept for 4 hours. After that, the temperature was increased to 600, 700, 800, and 900 °C at a rate of 2 °C min−1 and held for 2 h, respectively. The whole procedure was prepared under a protective flow of N2. The products calcined at different temperatures were denoted as VN/N-Gr-600, VN/N-Gr-700, VN/N-Gr-800, and VN/N-Gr-900 accordingly. For comparison, pure N-Gr was synthesized by a similar method calcined at 700 °C without adding VOSO4. Pure VN was collected by direct pyrolysis of VOSO4 at 700 °C under a NH3 atmosphere.Materials characterization
X-ray powder diffraction (XRD) was conducted using a Bruker D8-Advance diffractometer with Cu-Ka radiation (λ = 0.1504 nm). Scanning electron microscopy (SEM) was performed with a S4800 HSD electron microscope (Hitachi). Transmission electron microscopy (TEM) and high resolution transmission electron micrograph (HRTEM) images were recorded with a Tecnai G2 F20 electron microscope (FEI). X-ray photoelectron spectroscopy (XPS) spectra were characterized with a ESCALAB 250Xi spectrometer. Nitrogen adsorption/desorption isotherm measurements were carried out by the Brunauer–Emmett–Teller (BET) method using an ASAP 2020 V3.04 H analyzer. Thermogravimetric analysis (TGA) was performed in air, and in nitrogen from room temperature to 1000 °C with a heating rate of 5 °C min−1 on a STA449F3 apparatus, respectively. Atomic force microscopy (AFM) was conducted using a Dimension Fastscan microscope.Electrochemical measurements
The electrochemical experiments were carried out in 2 M KOH aqueous solution on a CHI 660E electrochemical workstation (CH Instruments). The working electrode was prepared by coating a slurry onto nickel foam (1 cm2). The slurry was made by mixing the active material, acetylene black, and polytetrafluoroethylene at a mass ratio of 8![[thin space (1/6-em)]](https://www.rsc.org/images/entities/char_2009.gif) :
:![[thin space (1/6-em)]](https://www.rsc.org/images/entities/char_2009.gif) 1
1![[thin space (1/6-em)]](https://www.rsc.org/images/entities/char_2009.gif) :
:![[thin space (1/6-em)]](https://www.rsc.org/images/entities/char_2009.gif) 1 in ethanol. Then the working electrode was dried at 80 °C and pressed into a piece. The mass loading of the active material in each electrode is about 2 mg. In the three-electrode system, Pt foil and a Hg/HgO electrode were used as the counter and reference electrodes, respectively. Cyclic voltammetry (CV) and galvanostatic charge–discharge (GCD) tests were applied to characterize the electrochemical performance of electrode materials. The electrochemical impedance spectroscopy (EIS) measurements were performed at an open-circuit potential at an amplitude of 5 mV in a frequency range from 0.01 Hz to 100 kHz. The specific capacitance of the electrode material (C, F g−1) was calculated from the GCD curves according to the following equation.27
1 in ethanol. Then the working electrode was dried at 80 °C and pressed into a piece. The mass loading of the active material in each electrode is about 2 mg. In the three-electrode system, Pt foil and a Hg/HgO electrode were used as the counter and reference electrodes, respectively. Cyclic voltammetry (CV) and galvanostatic charge–discharge (GCD) tests were applied to characterize the electrochemical performance of electrode materials. The electrochemical impedance spectroscopy (EIS) measurements were performed at an open-circuit potential at an amplitude of 5 mV in a frequency range from 0.01 Hz to 100 kHz. The specific capacitance of the electrode material (C, F g−1) was calculated from the GCD curves according to the following equation.27 | (1) |
For the symmetrical capacitor devices, the electrochemical measurements were performed using a two-electrode sandwich-type construction in a 2 M KOH aqueous electrolyte. Cycle life measurements were performed on a battery testing system (LANHE CT2001A). The energy density (Ecell, W h kg−1) and power density (Pcell, W kg−1) were calculated by the following equations.
 | (2) |
 | (3) |
Results and discussion
Characterization of VN, N-Gr, and VN/N-Gr nanocomposites
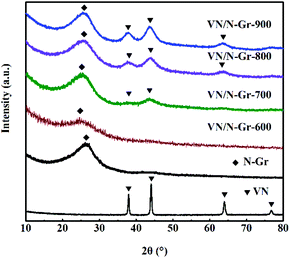
The composition of VN, N-Gr, and VN/N-Gr nanocomposites were characterized by XRD as shown in Fig. 1. The VN shows strong diffraction peaks at 2θ values of ∼37.9°, ∼44.1°, ∼64.0°, and ∼70.8°, corresponding to the (111), (200), (220), and (311) planes of cubic VN (JCPDS Card No. 35-0768). For N-Gr, the AFM results demonstrate the presence of graphene with three or four layers of a carbon lattice (Fig. S1†), and the XRD pattern exhibits a broad peak located at around 26°, corresponding to the graphite (002) plane. The characteristic peaks of VN and N-Gr can both be found in the XRD pattern of VN/N-Gr-700, VN/N-Gr-800, and VN/N-Gr-900. But no characteristic peak of VN is observed in VN/N-Gr-600. Additionally, there is no existence of any form of vanadium oxide in the VN/N-Gr nanocomposites. These results indicate that VN/N-Gr nanocomposites can be successfully prepared at a high calcination temperature (above 700 °C). With the increasing calcination temperature from 700 to 900 °C, the characteristic peaks of VN become stronger and sharper, which demonstrate that the crystallinity of VN has improved. According to the XRD analysis, no VN is formed at a calcination temperature of 600 °C, thus the following characterization studies of VN/N-Gr nanocomposites were carried out on VN/N-Gr-700, VN/N-Gr-800, and VN/N-Gr-900.The morphology of N-Gr, VN, and VN/N-Gr nanocomposites were characterized by SEM, TEM, and HRTEM. As shown in Fig. S2(a–e),† the SEM image of pure VN clearly displays an agglomerated morphology with an average size of about 50 nm. N-Gr exhibits an ultrathin two-dimensional (2D) structure with a smooth surface. In contrast, the VN/N-Gr-700, VN/N-Gr-800, and VN/N-Gr-900 nanocomposites possess a similar 2D structure but with a rough surface, which can be attributed to the formation of VN nanoparticles in the N-Gr skeleton. Theirmorphologies show no obvious difference under an SEM. Therefore, TEM and HRTEM measurements were performed to further investigate the differences. The TEM image of N-Gr (Fig. S3†) shows transparent freestanding 2D sheets with typical wrinkles. Fig. 2(a–f) represent the TEM and HRTEM images of VN/N-Gr-700, VN/N-Gr-800, and VN/N-Gr-900. From the low-resolution TEM images, we found that the VN nanoparticles were successfully anchored on the transparent graphene skeleton. VN nanoparticles become more observable with increasing the calcination temperature. It can be further found that VN nanoparticles (dotted circle) with an average size of about 4 nm were evenly encapsulated into the graphene skeleton from the HRTEM images. Moreover, no obvious lattice fringe can be found in VN/N-Gr-700. With increasing the calcination temperature, the lattice fringe of VN gradually becomes apparent, indicating improved crystallinity, well consistent with the previous XRD analysis. From the inset in Fig. 2f, it can be seen that VN/N-Gr-900 exhibits a lattice spacing of 0.206 nm, corresponding to the (200) plane of VN.11
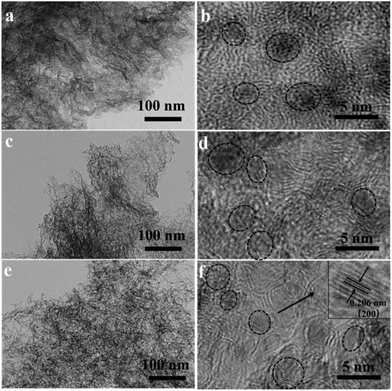 | ||
| Fig. 2 TEM and HRTEM images of VN/N-Gr-700 (a and b), VN/N-Gr-800 (c and d), and VN/N-Gr-900 (e and f). | ||
XPS characterization was used to further illustrate the elemental composition and content in VN/N-Gr nanocomposites. The existence of V, N, O, and C species in VN/N-Gr nanocomposites can be clearly observed in the survey spectra (Fig. S4†). As illustrated in Table 1, the N/V atomic ratio is determined to be larger than 1, which proves that N is also doped into graphene during the calcination process. The content of V and N decreased with increasing the calcination temperature from 700 to 900 °C, demonstrating that the concentration of V and N in VN/N-Gr nanocomposites can be adjusted using the calcination temperature. Notably, VN/N-Gr-700 shows the highest N content featuring good wettability, which can increase the ion-accessible surface area, promote the electron transfer, and deliver high electrochemical performance. The high-resolution V 2p peaks in Fig. 3a could be fitted to three sub-peaks at 513.7, 515.2, and 517.0 eV, corresponding to V3+ in V–N, V3+ and V5+ in the oxidation states of vanadium, respectively.28 Typical signals of V–N imply the successful formation of VN during the calcination process. Considering that VN can be easily oxidized, the oxidation states of vanadium in the V 2p spectrum confirm that VOx layers are formed on the surface of VN. Thus, the existence form of VN in VN/N-Gr could be VNxOy. Therefore, the highest V and N content in VN/N-Gr-700 proves the highest VNxOy and doping N content. On the other hand, as shown in Fig. 3b, the high-resolution N 1s spectra show four signals at 397.5, 398.7, 400.0, and 401.2 eV, corresponding to N–V, pyridinic-N, pyrrolic-N, and graphitic-N, respectively. Moreover, the V–N content in VNxOy increased with rising the calcination temperature, confirming that VOx layers transformed into VN at high temperature. These results prove that VN/N-Gr-700 possesses not only the highest VNxOy and doping N content but also the highest VOx content in VNxOy, well agreed with the XRD and HRTEM analysis. Due to the highest VOx content in VNxOy, the characteristic diffraction peaks of VN from XRD is the weakest, and the lattice fringe of VN from HRTEM is the least clear. The electrochemically active VNxOy can improve the capacitance performance of VN/N-Gr, while the VOx content in VNxOy could lead to electrochemical instability during cycling performance.
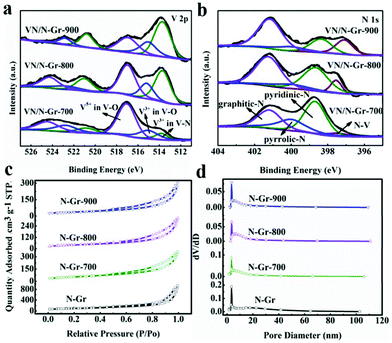 | ||
| Fig. 3 (a) High-resolution V 2p XPS. (b) High-resolution O 1s XPS spectra of VN/N-Gr. (c) Nitrogen adsorption/desorption isotherms. (d) Pore size distribution of N-Gr. | ||
| Sample | w (at%) | N (at %) | O (at %) | C (at%) |
|---|---|---|---|---|
| VN/N-Gr-700 | 2.04 | 10.48 | 7.71 | 79.77 |
| VN/N-Gr-800 | 1.56 | 5.9 | 4.55 | 87.99 |
| VN/N-Gr-900 | 1.08 | 5.28 | 3.23 | 90.41 |
N2 adsorption and desorption isotherm measurements were performed to investigate the specific surface area and pore distribution of N-Gr and VN/N-Gr nanocomposites. As shown in Fig. 3c, typical type IV isotherms with the hysteresis loop in the range of 0.5–1.0 P/P0 are observed, which reveal the presence of mesoporous structures in the materials. Fig. 3d shows the pore size distribution of the samples, and it further confirms the mesoporous pores. The specific surface areas of N-Gr, VN/N-Gr-700, VN/N-Gr-800, and VN/N-Gr-900 were calculated to be 350.7, 194.2, 139.7, and 126.8 m2 g−1, respectively. It can be seen that with the formation of VN nanoparticles, the specific surface area of VN/N-Gr nanocomposites decreases compared to pure N-Gr. Notably, it is the surface areas that make direct contact with the electrolyte ions that could contribute to the capacitance. Based on the results from TEM, VN/N-Gr-700, VN/N-Gr-800, and VN/N-Gr-900 show similar morphology to VN nanoparticles encapsulated into a graphene matrix, indicating that VN/N-Gr-700 possesses the largest surface area that comes into contact with the electrolyte ions. The average pore size of VN/N-Gr nanocomposites also decreases compared to N-Gr (13.2 nm), which have a similar average pore size about 10 nm (VN/N-Gr-700, 9.1 nm, VN/N-Gr-800, 10.8 nm, and VN/N-Gr-900, 10.9 nm).
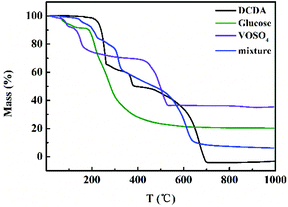
The content of VN (wt%) in different VN/N-Gr samples was calculated from the TGA curves measured in air (Fig. S5†). The results show that the content of VN in VN/N-Gr-700, VN/N-Gr-800, and VN/N-Gr-900 is 16.9 wt%, 19.3 wt%, and 23.2 wt%, respectively, which agree well with the XRD and XPS analysis. On the other hand, the TGA curves of DCDA, glucose, VOSO4, and their mixture obtained under N2 flow were used to illustrate the preparation process of VN/N-Gr. As shown in Fig. 4, it can be seen that the TGA curves of DCDA, glucose, and VOSO4 undergo severe mass loss before 700 °C. There is no obvious mass loss after 700 °C, indicating the thorough reactions at a temperature higher than 700 °C. With the increase of temperature, DCDA gradually condensed to melamine, tris-s-triazine, and C3N4. Finally, C3N4 decomposed completely after 700 °C.29 The mass loss of glucose took place owing to the pyrolysis of glucose and the final carbon material formed at high temperature (>600 °C). As for VOSO4, it decomposed into vanadium oxide before 500 °C. The TGA of its mixture was further used to simulate the preparation process of VN/N-Gr. The TGA curve of the mixture gives the combination of features from pure DCDA, glucose, and VOSO4. When the temperature increased to 150 °C, the slow mass loss can be attributed to the loss of small molecules and crystal water until the temperature increased to 220 °C. Then, in the next stage, DCDA condensed into melamine combined with the pyrolysis of glucose and the preliminary decomposition of VOSO4 until 320 °C. With the increase of temperature, the melamine gradually transformed into tris-s-triazine in the range of 320–480 °C. Condensation of the tris-s-triazine into C3N4 occurred at around 500 °C, along with the further pyrolysis of glucose and decomposition of VOSO4. C3N4 became unstable above 600 °C and the decomposition took place. Meanwhile, NH3, N2, and other cyanides were released, which resulted in the reduction and nitridation of vanadium oxide at around 620 °C.23,26 Simultaneously, nitrogen was introduced into the residual carbon framework.
Based on the above-mentioned analysis, we could further understand the formation process of the VN/N-Gr nanocomposites and the effect of calcination temperature. Typically, by heating the mixture containing DCDA, glucose, and VOSO4 at 550 °C, g-C3N4 was obtained and VOSO4 slowly decomposed.29–31 Meanwhile, the carbon source from glucose and vanadium source from VOSO4 were bound into the g-C3N4 interlayer gaps. Then, the intermediate was further calcined at different high temperatures and maintained for 2 h to form VN/N-Gr nanocomposites. During this process, g-C3N4 acted both as the sacrifice template and doping N precursor. After thermolysis of g-C3N4 at high temperature, the latest N-doped graphene sheets were liberated.29 At the same time, NH3, N2 and other cyanides were released and the formation of VN gradually occurred. The release of gas was favorable for introducing the porous structure. Finally, VN nanoparticles encapsulated into the porous N-doped graphene skeleton were obtained. According to XPS analysis, VOx layers formed on the surface of VN and gradually transformed into VN with increasing the calcination temperature. The electrochemical reaction involved in the charge storage mechanism of VN/N-Gr nanocomposites is given in eqn (4).19
| VNxOy + OH− ↔ VNxOy∥OH− + VNxOy-OH | (4) |
Electrochemical performance of VN, N-Gr, and VN/N-Gr electrodes
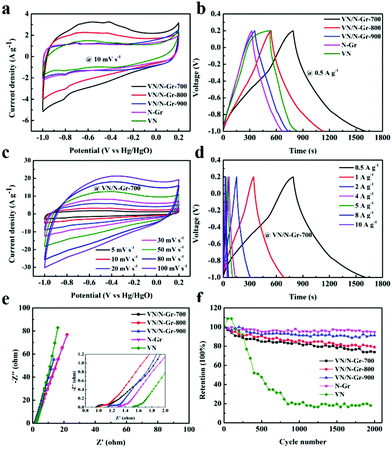
To investigate the energy storage applications of VN, N-Gr, and VN/N-Gr, their electrochemical performances were tested in 2 M KOH aqueous solution using a three-electrode system. Fig. 5a shows the CV curves of VN, N-Gr, and VN/N-Gr nanocomposites measured at a scan rate of 10 mV s−1 in the potential window of −1.0–0.2 V. The N-Gr displays a rectangle-like shape with a pair of weak redox peaks, which can be ascribed to the pseudocapacitance behavior of the doping N in graphene. VN and VN/N-Gr show distorted rectangular shapes with pairs of redox peaks. The pseudocapacitance performance not only comes from the doping N in graphene but also from VNxOy. It is observed that the integrated area of the CV curve from VN/N-Gr-700 is obviously larger than those of VN, N-Gr, VN/N-Gr-800, and VN/N-Gr-900 indicating higher capacitance than other samples. As seen in Fig. 5b, the GCD curves of VN, N-Gr, and VN/N-Gr were measured at a current density of 0.5 A g−1. The VN curve illustrates a severely distorted triangular shape, while the N-Gr curve exhibits a nearly triangular shape. All the GCD curves of VN/N-Gr nanocomposites are similar to a triangular shape with slight distortion. These results agree well with the analysis from the CV curves. Compared to other samples, VN/N-Gr-700 shows the longest charge–discharge time, indicating a largest charge storage. It can be explained by the fact that VN/N-Gr-700 possesses the highest electrochemically active VNxOy and doping N content.Moreover, there is no marked iR drop in the GCD curve of VN/N-Gr-700, which also reveals its excellent capacitive performance. Indeed, the specific capacitance values of the four samples calculated from the GCD curves at 0.5 A g−1 are 342.1 F g−1 (VN/N-Gr-700), 246.3 F g−1 (VN/N-Gr-800), 156.7 F g−1 (VN/N-Gr-900), 144.0 F g−1 (N-Gr), and 131.3 F g−1 (VN), respectively.
Fig. 5c displays the CV curves of VN/N-Gr-700 at different scan rates from 5–100 mV s−1. Even at high scan rates up to 100 mV s−1, the CV loops maintain their nearly rectangular shapes, indicating very small polarization. Besides, the GCD curves of VN/N-Gr-700 at different current densities between 0.5 and 10 A g−1 are shown in Fig. 5d. All curves exhibit symmetrical triangular shapes but slightly distorted. By calculation, the specific capacitance of VN/N-Gr-700 is 342.1 F g−1, 285.4 F g−1, 255.5 F g−1, 230.4 F g−1, 223.5 F g−1, 206.7 F g−1, and 197.3 F g−1 at 0.5, 1, 2, 4, 5, 8, and 10 A g−1, respectively. The high specific capacitance of the VN/NGr-700 could be mainly ascribed to the following three reasons. (1) N-Gr serves as a stabilizer and provides a synergistic effect for the VN/N-Gr nanocomposite, which shows more activity sites than pure N-Gr and leads to higher capacitive performance.25,26 (2) VN/NGr-700 with the highest VNxOy loading mass could provide faster electron transfer caused by successive oxidation by OH− adsorbed on the VNxOy surface.19,32 (3) VN/N-Gr-700 shows the highest doping N content compared with VN/N-Gr-800 and VN/N-Gr-900. The doping of pyridinic-N can provide excellent pseudocapacitive performance and graphitic-N would enhance the electrical conductivity of the VN/N-Gr nanocomposites, which results in excellent electrochemical performance.33,34 The recently reported vanadium-based/carbon hybrids and their electrochemical properties tested in three-electrode configurations are summarized in Table S1.† It is clear that our sample exhibits relatively high capacitive performance among these recently reported vanadium-based/carbon hybrid materials.
The Nyquist plots of the five electrodes are illustrated in Fig. 5e. The electrodes exhibit the characteristic distorted semicircles in the high-frequency region and have oblique straight lines in the low-frequency region.35 From the x axis intercept, the equivalent series resistance (Rs) of VN/N-Gr-700 was calculated to be 0.92 Ω, which is lower than that of VN/N-Gr-800 (0.97 Ω), VN/N-Gr-900 (1.10 Ω), N-Gr (1.27 Ω), and VN (1.49 Ω). In addition, the radii of the semicircles of the VN/N-Gr nanocomposites, representing the charge transfer resistance (Rct), are smaller than those of VN and N-Gr. This indicates a fast adsorption/desorption rate on the VN/N-Gr electrodes. To sum up, such a low Rct and Rs eventually result in great promotion in the electrochemical performance. The cycling stability of the VN, N-Gr, and VN/N-Gr nanocomposites were measured using a two-electrode system at a current density of 2 A g−1 to further evaluate the influence from the calcination temperature. As demonstrated in Fig. 5f, after 2000 cycles, the corresponding capacity retentions of VN/N-Gr-700, VN/N-Gr-800, VN/N-Gr-900, N-Gr, and VN are about 73.9%, 79.1%, 91.4%, 94.8% and 18.1%, respectively. Apparently, pure VN exhibits serious capacitance decay. Fortunately, the introduction of graphene greatly improves the cycling stability of VN/N-Gr. The enhanced cycling stability is ascribed to the fact that VN nanoparticles are embedded into the N-Gr skeleton, which can avoid the VN structural damage or even collapse.26 The cycling stability of VN/N-Gr-700 is a little inferior to those of VN/N-Gr-800 and VN/N-Gr-900. It is reasonable because VN/N-Gr-700 possesses the highest VOx content in VNxOy, which is unfavorable for cycling stability. The inevitable capacitance fade of the VN/N-Gr nanocomposites can be attributed to the structural damage combined with the partial oxidation of VN.25,32,36
Electrochemical performance of the device based on VN/N-Gr-700
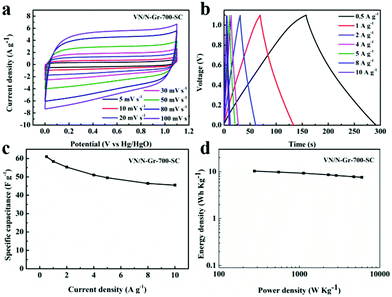
Based on the above-mentioned results, VN/N-Gr-700 exhibits excellent capacitance behavior, thus a symmetrical capacitor based on VN/N-Gr-700 (marked as VN/N-Gr-700-SC) was further studied to demonstrate a practical application of the VN/N-Gr nanocomposites. Fig. 6(a and b) show the CV and GCD curves of the assembled symmetrical devices in a potential window of 0–1.1 V under various scan rates and current densities. It can be seen that the CV curves display nearly rectangular shapes at scan rates from 5 to 100 mV s−1. The CV curves retain the relatively rectangular shape with an increase in the scan rate, indicating a superior capacitive behavior and electrochemical reversibility. All the GCD curves of VN/N-Gr-700 show analogously triangular shapes with a negligible curvature. The nearly symmetrical shapes of VN/N-Gr-700 indicate a fast I–V response and an outstanding electrochemical reversibility. There is no obvious iR drop, further demonstrating the excellent capacitive performance. Calculated from the GCD curves of VN/N-Gr-700-SC, the total specific capacitance of VN/N-Gr-700-SC reaches a maximum of 61.0 F g−1 at 0.5 A g−1 and remains at 45.5 F g−1 at 10 A g−1 (Fig. 6c). When the current density increases from 0.5 A g−1 to 10 A g−1, the total specific capacitance of VN/N-Gr-700-SC retains 74.6%, exhibiting a great rate capability.37 Energy density and power density are two important parameters in evaluating the applications of the entire device.38Fig. 6d shows the Ragone plot of the VN/N-Gr-700-SC. The VN/N-Gr-700-SC delivers an energy density of 10.3 W h kg−1 at a power density of 276.3 W kg−1 and remains 7.6 W h kg−1 at a power density of 5484.2 W kg−1.Conclusion
In summary, we have successfully prepared VN/N-Gr nanocomposites through an in situ heating method by pyrolysis of a mixture of DCDA, glucose, and VOSO4 at 600, 700, 800, and 900 °C under a N2 atmosphere. VN nanoparticles (∼4 nm) are uniformly encapsulated into the graphene skeleton. It is found that calcination temperature has enormous effects on the VN microstructure, which greatly influences the electrochemical performance. With increasing the calcination temperature, VNxOy and the doping N content in VN/N-Gr gradually decreases, demonstrating decayed capacitance performance. Thus, the VN/N-Gr calcined at 700 °C shows better capacitance performance than those of the others. It exhibits a maximum specific capacitance of 342.1 F g−1 at 0.5 A g−1, which is much higher than those of pure N-Gr, VN, and other VN/N-Gr nanocomposites. Furthermore, the assembled symmetrical supercapacitor delivers an energy density of 10.3 W h kg−1 at a power density of 276.3 W kg−1 and retains 7.6 W h kg−1 at a power density of 5484.2 W kg−1.Conflicts of interest
There are no conflicts to declare.Acknowledgements
We are grateful for the financial support of this research from the National Natural Science Foundation of China (51779065 and 51579057), and State Key Laboratory of Urban Water Resource and Environment, Harbin Institute of Technology (2016DX07).Notes and references
- P. Simon and Y. Gogotsi, Nat. Mater., 2008, 7, 845–854 CrossRef CAS PubMed.
- T. Q. Lin, I. W. Chen, F. X. Liu, C. Y. Yang, H. Bi, F. F. Xu and F. Q. Huang, Science, 2015, 350, 1508–1513 CrossRef CAS PubMed.
- Y. G. Wang, Y. F. Song and Y. Y. Xia, Chem. Soc. Rev., 2016, 45, 5925–5950 RSC.
- J. J. Xu, F. Xu, M. Qian, F. F. Xu, Z. L. Hong and F. Q. Huang, Adv. Mater., 2017, 29, 1701674 CrossRef PubMed.
- D. Tian, X. F. Lu, G. D. Nie, M. Gao and C. Wang, Inorg. Chem. Front., 2018, 5, 635–642 RSC.
- Y. P. Wu, N. B. Yi, L. Huang, T. F. Zhang, S. L. Fang, H. C. Chang, N. Li, J. Oh, J. A. Lee, M. Kozlov, A. C. Chipara, H. Terrones, P. Xiao, G. K. Long, Y. Huang, F. Zhang, L. Zhang, X. Lepro, C. Haines, M. D. Lima, N. P. Lopez, L. P. Rajukumar, A. L. Elias, S. M. Feng, S. J. Kim, N. T. Narayanan, P. M. Ajayan, M. Terrones, A. Aliev, P. F. Chu, Z. Zhang, R. H. Baughman and Y. S. Chen, Nat. Commun., 2015, 6, 6141 CrossRef CAS PubMed.
- A. Burke, J. Power Sources, 2000, 91, 37–50 CrossRef CAS.
- Z. N. Yu, L. Tetard, L. Zhai and J. Thomas, Energy Environ. Sci., 2015, 8, 702–730 RSC.
- P. Zhang, B. Y. Guan, L. Yu and X. W. Lou, Angew. Chem., Int. Ed., 2017, 56, 7141–7145 CrossRef CAS PubMed.
- R. T. Wang, X. B. Yan, J. W. Lang, Z. M. Zheng and P. Zhang, J. Mater. Chem. A, 2014, 2, 12724–12732 RSC.
- L. Wang, J. G. Sun, R. R. Song, S. B. Yang and H. H. Song, Adv. Energy Mater., 2016, 6, 1502067 CrossRef.
- F. L. Meng, H. X. Zhong, Q. Zhang, K. H. Liu, J. M. Yan and Q. Jiang, J. Mater. Chem. A, 2017, 5, 18972–18976 RSC.
- P. Qin, X. X. Li, B. Gao, J. J. Fu, L. Xia, X. M. Zhang, K. F. Huo, W. L. Shen and P. K. Chu, Nanoscale, 2018, 10, 8728–8734 RSC.
- H. Y. Wang, B. Li, J. X. Teng, H. L. Zhu, Y. X. Qi, L. W. Yin, H. Li, N. Lun and Y. J. Bai, Electrochim. Acta, 2017, 257, 56–63 CrossRef CAS.
- A. Sliwak, A. Moyseowicz and G. Gryglewicz, J. Mater. Chem. A, 2017, 5, 5680–5684 RSC.
- C. R. Zhu, Y. F. Sun, D. L. Chao, X. H. Wang, P. H. Yang, X. Zhang, H. Huang, H. Zhang and H. J. Fan, Nano Energy, 2016, 26, 1–6 CrossRef CAS.
- X. Xiao, H. M. Yu, H. Y. Jin, M. H. Wu, Y. S. Fang, J. Y. Sun, Z. M. Hu, T. Q. Li, J. B. Wu, L. Huang, Y. Gogotsi and J. Zhou, ACS Nano, 2017, 11, 2180–2186 CrossRef CAS PubMed.
- S. Vadahanambi and H. Park, New J. Chem., 2018, 42, 5668–5673 RSC.
- D. Choi, G. E. Blomgren and P. N. Kumta, Adv. Mater., 2006, 18, 1178–1182 CrossRef CAS.
- D. Shu, H. H. Cheng, C. J. Lv, M. Abou Asi, L. Long, C. He, X. P. Zou and Z. X. Kang, Int. J. Hydrogen Energy, 2014, 39, 16139–16150 CrossRef CAS.
- Z. Q. Hou, K. Guo, H. Q. Li and T. Y. Zhai, CrystEngComm, 2016, 18, 3040–3047 RSC.
- X. Xiao, X. Peng, H. Y. Jin, T. Q. Li, C. C. Zhang, B. Gao, B. Hu, K. F. Huo and J. Zhou, Adv. Mater., 2013, 25, 5091–5097 CrossRef CAS PubMed.
- Y. L. Yang, K. W. Shen, Y. Liu, Y. T. Tan, X. N. Zhao, J. Y. Wu, X. Q. Niu and F. Ran, Nano-Micro Lett., 2017, 9, UNSP 6 CrossRef PubMed.
- B. Long, M. S. Balogun, L. Luo, Y. Luo, W. T. Qiu, S. Q. Song, L. Zhang and Y. X. X. Tong, Small, 2017, 13, UNSP 1702081 CrossRef PubMed.
- J. Balamurugan, G. Karthikeyan, T. D. Thanh, N. H. Kim and J. H. Lee, J. Power Sources, 2016, 308, 149–157 CrossRef CAS.
- H. H. Liu, H. L. Zhang, H. B. Xu, T. P. Lou, Z. T. Sui and Y. Zhang, Nanoscale, 2018, 10, 5246–5253 RSC.
- G. H. Yu, X. Xie, L. J. Pan, Z. N. Bao and Y. Cui, Nano Energy, 2013, 2, 213–234 CrossRef CAS.
- G. H. An, D. Y. Lee and H. J. Ahn, J. Mater. Chem. A, 2017, 5, 19714–19720 RSC.
- X. H. Li, S. Kurasch, U. Kaiser and M. Antonietti, Angew. Chem., Int. Ed., 2012, 51, 9689–9692 CrossRef CAS PubMed.
- W. Yang, L. Q. Hou, X. W. Xu, Z. H. Li, X. L. Ma, F. Yang and Y. F. Li, Carbon, 2018, 130, 325–332 CrossRef CAS.
- S. D. Sun and S. H. Liang, Nanoscale, 2017, 9, 10544–10578 RSC.
- P. J. Hanumantha, M. K. Datta, K. Kadakia, C. Okoli, P. Patel and P. N. Kumta, Electrochim. Acta, 2016, 207, 37–47 CrossRef CAS.
- M. Yang and Z. Zhou, Adv. Sci., 2017, 4, UNSP 1600408 CrossRef PubMed.
- S. W. Liu, M. Y. Tong, G. Q. Liu, X. Zhang, Z. M. Wang, G. Z. Wang, W. P. Cai, H. M. Zhang and H. J. Zhao, Inorg. Chem. Front., 2017, 4, 491–498 RSC.
- Y. M. Yao, Y. Q. Zhang, L. Li, S. L. Wang, S. X. Dou and X. Liu, ACS Appl. Mater. Interfaces, 2017, 9, 34944–34953 CrossRef CAS PubMed.
- X. H. Lu, M. H. Yu, T. Zhai, G. M. Wang, S. L. Xie, T. Y. Liu, C. L. Liang, Y. X. Tong and Y. Li, Nano Lett., 2013, 13, 2628–2633 CrossRef CAS PubMed.
- Y. N. Hou, Z. B. Zhao, Z. F. Yu, S. Zhang, S. F. Li, J. Yang, H. Zhang, C. Liu, Z. Y. Wang and J. S. Qiu, Chem. – Eur. J., 2018, 24, 2681–2686 CrossRef CAS PubMed.
- S. L. Zhang and N. Pan, Adv. Energy Mater., 2015, 5, 1401401 CrossRef.
Footnote |
| † Electronic supplementary information (ESI) available: Fig. S1–S3. See DOI: 10.1039/c8qi01071d |
| This journal is © the Partner Organisations 2019 |

