Electrochemical detection of an antibiotic drug chloramphenicol based on a graphene oxide/hierarchical zinc oxide nanocomposite
Neethu
Sebastian
 a,
Wan-Chin
Yu
 *a and
Deepak
Balram
 b
b
aInstitute of Organic and Polymeric Materials, National Taipei University of Technology, No. 1, Section 3, Chung-Hsiao East Road, Taipei 106, Taiwan, Republic of China. E-mail: wanchin@ntut.edu.tw; Fax: +886-2-2731-7174; Tel: +886-2-2771-2171 ext. 2411
bDepartment of Electrical Engineering, National Taipei University of Technology, No. 1, Section 3, Chung-Hsiao East Road, Taipei 106, Taiwan Republic of China
First published on 2nd November 2018
Abstract
A novel electrochemical sensor based on a graphene oxide (GO)/three-dimensional (3D) hierarchical zinc oxide (ZnO) nanocomposite was developed for the efficient determination of the antibiotic drug chloramphenicol (CAP). The hierarchical ZnO structure consisting of nanosheets was synthesized by a green aqueous solution procedure and then composited with GO through a simple sonochemical method. The synthesized ZnO and GO/ZnO nanomaterials were characterized by scanning electron microscopy (SEM), elemental mapping, X-ray diffraction (XRD), UV-Visible spectroscopy, Fourier transform infrared spectroscopy (FT-IR), and Raman spectroscopy. The electrochemical performance of the prepared GO/ZnO/glassy carbon electrode (GCE) was evaluated using cyclic voltammetry (CV) and differential pulse voltammetry (DPV) techniques. The GO/ZnO/GCE shows a low CAP detection limit of 0.01 μM, a high sensitivity of 7.27 μA μM−1 cm−2, and a linear response in the range of 0.2 to 7.2 μM. Moreover, it exhibits excellent stability, reproducibility and repeatability. Practicality of the sensor has further been demonstrated with honey, milk and eye drop samples.
1 Introduction
Antibiotics are used to treat and prevent bacterial infection for humans and animals, but improper use and disposal of antibiotics adversely affect the ecology and environment.1 The World Health Organization (WHO) in a statement says “the world urgently needs to change the way it prescribes and uses antibiotics”, and this statement is a clear indication of the need for the correct use of antibiotics to minimize the problem of antibiotic resistance, a global threat to public health. Accumulation of antibiotics in foods and water also causes growing concerns over food and environmental safety, urging researchers to develop more efficient methods to analyze residual antibiotics in food and water samples.2–5 Chloramphenicol (CAP) is a broad-spectrum antibiotic effective against both Gram-negative and Gram-positive bacteria. It is used to ward off infections in small wounds, as well as to treat many diseases including cystic fibrosis,6 conjunctivitis,7 cholera,8 typhoid fever,9 plague,10 and ear and skin infection.11 CAP is also widely used in aquaculture and veterinary medicines.12,13 However, CAP can cause some serious side effects in humans, including aplastic anemia, leukemia, neurotoxic reactions, gray baby syndrome, bone marrow suppression, and hypersensitivity reactions.14 As a result, CAP is banned for the treatment of food-producing animals in the European Union (EU) and many other countries.15,16 However, CAP is still widely used in developing countries because of its high efficacy, relatively low cost and availability. It is also used to treat and prevent some infectious diseases in bees, birds and aquaculture. In addition, studies have shown that products of animal origin can contain residual CAP due to naturally occurring CAP in the plant materials that the animals feed on.17,18 For these reasons, accurate and sensitive analytical methods for CAP detection are needed. Among the different detection techniques, electrochemical methods have the advantages of high accuracy, miniaturization practicality, wide analysis range, low cost, fast response, and less complexity,19 making them more suited to routine monitoring of CAP.ZnO nanomaterials have a wide range of applications in various fields, for instance nanolasers, light emitting diodes, heterogeneous catalysis, gas sensing and storage media.20–29 Moreover, the excellent biocompatibility and non-toxic nature of ZnO led to the development of a variety of electrochemical sensors.30,31 ZnO nanostructures of different morphologies have been synthesized, including nanowires,32,33 nanorods,34,35 nanotubes,36 nanoneedles,37 nanoflowers,38 and hollow spheres.39 Among the various morphologies of ZnO, nanosheet-based hierarchical structures exhibit a comparatively better performance in the field of electrochemistry due to the large surface area and better catalytic activity as a result of exposed crystal facets.40–43
Graphene oxide (GO) is applicable in diverse fields due to its excellent electrical, optical, thermal, and mechanical properties.44–47 GO has attained immense interest in the field of electrochemistry for different applications such as sensors, water splitting, and energy storage.48–52 The high surface area to volume ratio, good adsorption properties, good compatibility with living tissues, and non-toxic nature of GO make it suitable for various electrochemical sensor applications.53,54 Additionally, GO exhibits very good hydrophilicity because of the presence of a variety of hydrophilic functional groups, specifically, –COOH, –OH, and epoxides on the sheet brink and basal planes. This hydrophilic nature of GO enhances its dispersion in various solvents with good stability. Moreover, GO can undergo functionalization or chemical modification on the surface because of the presence of –OH functional group, thereby enriching the sensing ability and catalytic activity.55,56 To make use of all the excellent properties of GO and enable the development of outstanding electrochemical sensors, GO is often paired with another compatible material. The literature survey shows that GO has been combined with different semiconductor materials such as ZnO, TiO2, and CuO for the efficient detection of small molecules.57–59
In the present work, we report the development of a sensitive electrochemical sensor for CAP by combining the advantages of GO and nanosheet-based hierarchical ZnO. A three-dimensional flower-like ZnO structure consisting of nanosheet subunits was synthesized by an aqueous solution method and composited with GO through a simple sonochemical method. The as-prepared GO/ZnO nanocomposite was used to modify a glassy carbon electrode (GCE) and evaluated for the detection of CAP.
2 Experimental section
2.1 Materials
Zinc nitrate hexahydrate [Zn(NO3)2·6H2O], and sodium citrate dihydrate (HOC(COONa)(CH2COONa)2·2H2O) were obtained from J.T Baker, Taiwan. Sodium hydroxide (NaOH), chloramphenicol, graphite and all other chemicals were obtained from Sigma Aldrich. All the chemicals were of analytical grade and used without further purification. All the required solutions were prepared using deionized water, and phosphate buffer solutions (0.1 M sodium dihydrogen phosphate and disodium monohydrogen phosphate and sodium hydroxide, PBS) of varying pH values were used in this study.2.2 Instruments
The morphology, size and shape of the ZnO nanostructures were analysed by using a Hitachi S-4800 scanning electron microscope operated at 15 keV. The morphology of the GO/ZnO nanocomposite modified GCE was examined with a JSM 7610F scanning electron microscope operated at 15 keV. For elemental mapping of GO and GO/ZnO nanocomposites, we have used a Hitachi S-3000H SEM attached with an energy dispersive X-ray analyser. Transmission electron microscopy (TEM) of GO was taken from Hitachi-7100 TEM. The X-ray diffraction (XRD) studies were performed by using a Bruker D8 Advance X-ray diffractometer using monochromatic Cu-Kα radiation (λ = 1.5406 Å). The Fourier transform infrared (FT-IR) spectroscopy was carried out using a JASCO FTIR-6600 spectrometer in the range of 400–4000 cm−1. A Jasco V-770 UV-Vis spectrophotometer was used to obtain UV-Vis spectra and Raman spectra were recorded using a Dong Woo 500i (Korea). The electrochemical studies including cyclic voltammetry (CV) and differential pulse voltammetry (DPV) were performed with the CHI 410A workstation. We have used the typical three electrode system with the GCE acting as the working electrode, Ag/AgCl as the reference electrode and a platinum wire as the counter electrode for the electrochemical analyses.2.3 Preparation of GO
We have used the modified Hummers method for the preparation of GO. Briefly, 10 g of graphite flakes and 5 g of sodium nitrate were added into concentrated sulphuric acid under stirring in an ice bath. Then, 30 g of potassium permanganate solution was added steadily to the prepared mixture, followed by stirring at 30 °C for 2 h. Subsequently, 460 mL of distilled water was added to the above mixture, and the suspension was brought to 95 °C and stirred for 30 min. Finally, 940 mL of distilled water was added to the solution, followed by the addition of 30 mL of hydrogen peroxide. The resultant dark brown coloured GO was centrifuged, washed many times using distilled water and dried at 60 °C overnight in an oven.2.4 Synthesis of 3D hierarchical ZnO nanostructures
In the synthesis of 3D hierarchical ZnO nanostructures, 1.48 g of zinc nitrate hexahydrate (0.05 M) and 5.29 g of sodium citrate dehydrate (0.18 M) were dissolved in 100 mL of water under mild stirring. This was followed by the immediate addition of 1 g of sodium hydroxide (0.25 M) to the solution under vigorous stirring, and the reaction was allowed to continue for 2 h. The resulting white coloured product was centrifuged, washed many times using pure water, and dried at 60 °C for 12 h in an oven.2.5 Fabrication of the GO/ZnO modified GCE
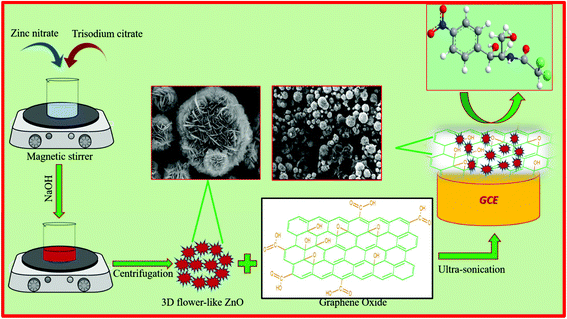
The as-prepared GO (10 mg) was mixed with 10 mL of water and subjected to sonication for 1 h to form a homogeneous suspension. Then, 30 mg of ZnO was added to the above suspension under magnetic stirring. Ultrasonication of the resultant solution was carried out for 2 h and then used for the electrochemical studies. For the fabrication of an electrode, the GCE was first polished with 0.05 mm alumina slurry. Then, 8 μL of the GO/ZnO suspension was casted on the GCE surface and dried at room temperature. The schematic representation of the preparation of the GO/ZnO modified GCE is shown in Scheme 1. The GO/ZnO modified GCE was further used for electrochemical investigations.3 Results and discussion
3.1 Characterization
The morphology and microstructure of the ZnO nanostructure and the GO/ZnO nanocomposite modified GCE were examined with SEM. Fig. 1A depicts the low-magnification SEM image of pure ZnO nanostructures, which exhibit a 3D hierarchical flower-like morphology with an average diameter of 2–4 μm. The hierarchical ZnO consists of numerous layers of nanosheets with varied sizes. As the high-magnification SEM image in Fig. 1B shows, the nanosheets connect with each other, producing a 3D flower-like structure with gaps between the nanosheets. Fig. 1C shows the TEM image of GO, which displays a rumpled sheet-like structure. The SEM images of the GO/ZnO nanocomposite modified GCE in Fig. 1D and E show that the 3D flower-like morphology is preserved even after ultrasonication treatment. Moreover, the GO sheets are clearly visible and connected well to the flower-like ZnO.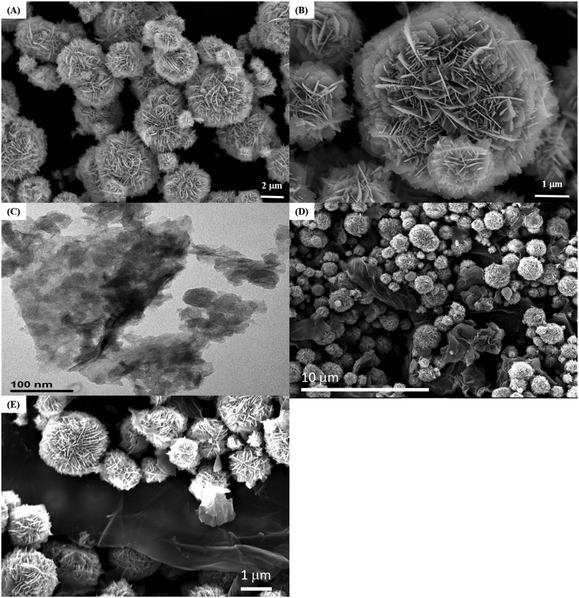 | ||
| Fig. 1 SEM images of 3D hierarchical ZnO (A and B); TEM image of GO (C); SEM images of the GO/ZnO nanocomposite modified GCE (D and E). | ||
To examine the elemental composition of the GO/ZnO nanocomposite, elemental mapping was performed. Fig. 2A displays the SEM image of the GO/ZnO nanocomposite, and Fig. 2B–D show the corresponding elemental mapping of carbon, zinc and oxygen, respectively. As shown, the presence of zinc, oxygen and carbon in the GO/ZnO nanocomposite is demonstrated.
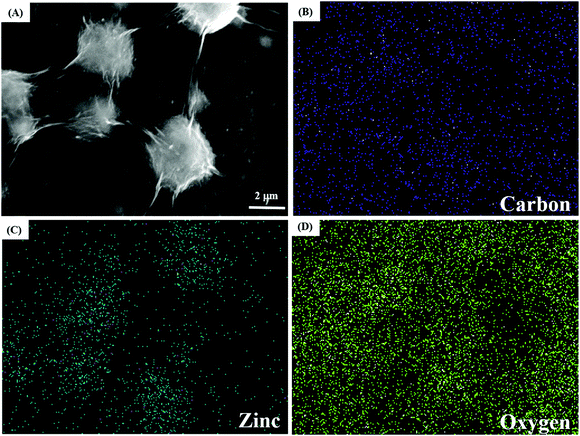 | ||
| Fig. 2 SEM image of the GO/ZnO nanocomposite (A); corresponding elemental mapping of carbon (B), zinc (C) and oxygen (D). | ||
For the determination of crystallinity and phase of the as-prepared 3D hierarchical ZnO nanostructures, we performed powder XRD analyses. Fig. 3A depicts the XRD pattern of 3D hierarchical ZnO, which matches well with the diffraction pattern of the wurtzite structure of ZnO according to JCPDS Card No. 36–1451.60 The peaks at 2θ = 31.7°, 34.5°, 36.3°, 47.4°, 56.6°, 62.7°, 66.4°, 67.9°, 69.1°, 72.5°, and 77.2° correspond to the diffraction planes of (100), (002), (101), (102), (110), (103), (200), (112), (201), (004), and (202) of hexagonal ZnO, respectively. No other diffraction peaks were detected, indicating that the synthesized hierarchical nanostructures are composed of pure ZnO.
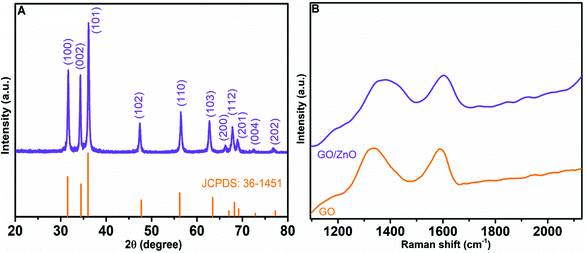 | ||
| Fig. 3 The XRD pattern of as-prepared 3D hierarchical flower-like ZnO (A). Raman spectra of GO and GO/ZnO (B). | ||
Raman spectroscopy, a non-contact and non-destructive analysis, is an efficient method to study the quality and structure of carbon containing materials. Fig. 3B presents the Raman spectra of GO and the GO/ZnO nanocomposite. The Raman spectrum of GO shows intense Raman peaks representing D and G bands at 1335.8 cm−1 and 1590.3 cm−1, respectively. The D band of GO corresponds to the breathing mode of k-point phonons of A1g symmetry, and the G band corresponds to the E2g phonon of sp2 hybridized carbon atoms. The Raman spectrum of the GO/ZnO nanocomposite also shows D and G bands at 1375.1 cm−1 and 1600.2 cm−1, respectively, which are assigned to the in-plane vibrations of sp2 carbon atom in GO. Furthermore, the bands show a shift towards a higher wave number, which may be due to the size reduction of graphitic sheets and the chemical interaction between GO and ZnO.61 The intensity variation of D and G bands can be used to assess the defects in GO; a low ID/IG intensity ratio indicates reduced defects in graphitic sheets. The ID/IG intensity ratio of GO was determined to be 1.001, while that of GO/ZnO was 0.997. The similarity of their ID/IG ratios indicates that the incorporation of ZnO had little effects on the defects of graphitic sheets.57
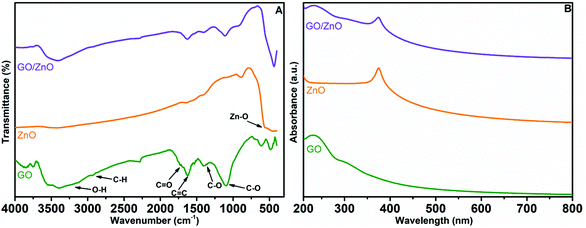
The results of FT-IR spectroscopic studies of GO, ZnO and the GO/ZnO nanocomposite are displayed in Fig. 4A. For GO, –OH stretching and bending vibrations are noticed at 3443 cm−1 and 1525 cm−1, respectively, because of the presence of water molecules in GO.62 The lower intensity peaks at 1750 cm−1 and 1482 cm−1 correspond to –C![[double bond, length as m-dash]](https://www.rsc.org/images/entities/char_e001.gif) O and C–O vibrations from the COOH group situated at the surface of the GO sheet. In general, ZnO nanoparticles have vibrational peaks resulting from inter atomic vibrations at finger print regions (wavenumber < 1000 cm−1). We have observed the –O–H stretching peaks at 3432 cm−1 and 1271 cm−1 due to the presence of water molecules on the surface of ZnO. Moreover, the Zn–O stretching and deformation peaks are also identified at 1612 cm−1 and 583 cm−1.63 In the case of the GO/ZnO nanocomposite, peaks appeared at 3431 cm−1 and 1607 cm−1 representing both stretching and bending vibrations of water, which were predominantly ascribed to water present in GO. Furthermore, carboxyl group peaks occurred at 1685 cm−1 and 1412 cm−1, while the absorption band at 1635 cm−1 was mainly due to C
O and C–O vibrations from the COOH group situated at the surface of the GO sheet. In general, ZnO nanoparticles have vibrational peaks resulting from inter atomic vibrations at finger print regions (wavenumber < 1000 cm−1). We have observed the –O–H stretching peaks at 3432 cm−1 and 1271 cm−1 due to the presence of water molecules on the surface of ZnO. Moreover, the Zn–O stretching and deformation peaks are also identified at 1612 cm−1 and 583 cm−1.63 In the case of the GO/ZnO nanocomposite, peaks appeared at 3431 cm−1 and 1607 cm−1 representing both stretching and bending vibrations of water, which were predominantly ascribed to water present in GO. Furthermore, carboxyl group peaks occurred at 1685 cm−1 and 1412 cm−1, while the absorption band at 1635 cm−1 was mainly due to C![[double bond, length as m-dash]](https://www.rsc.org/images/entities/char_e001.gif) C vibrations of graphene sheets. The peaks around 516 cm−1 correspond to the Zn–O vibrations in the GO/ZnO nanocomposite. As the vibrational peaks of both GO and ZnO are present in the FT-IR result of the prepared GO/ZnO nanocomposite, we can confirm the successful formation of the GO/ZnO nanocomposite.
C vibrations of graphene sheets. The peaks around 516 cm−1 correspond to the Zn–O vibrations in the GO/ZnO nanocomposite. As the vibrational peaks of both GO and ZnO are present in the FT-IR result of the prepared GO/ZnO nanocomposite, we can confirm the successful formation of the GO/ZnO nanocomposite.
UV-Vis spectra of GO, ZnO and the GO/ZnO nanocomposite are shown in Fig. 4B. For all the materials significant absorption peaks were recorded in the wavelength range of 200–500 nm. From the UV-Vis spectrum of GO, we can observe a peak at 230 nm indicating π–π* transitions of C![[double bond, length as m-dash]](https://www.rsc.org/images/entities/char_e001.gif) C groups in the aromatic ring of GO.64 The spectrum of pure ZnO displays a characteristic peak for ZnO at 370 nm because of electron transfer from the valence band to the conduction band or the band gap absorption peak from O 2p–Zn 3d.65 We have noticed two peaks for the GO/ZnO nanocomposite at 230 nm and 372 nm representing the π–π* excitation of the GO structure and the characteristic absorption peak for ZnO. The aforementioned UV-Vis spectral results provide further support for the successful formation of the GO/ZnO nanocomposite.
C groups in the aromatic ring of GO.64 The spectrum of pure ZnO displays a characteristic peak for ZnO at 370 nm because of electron transfer from the valence band to the conduction band or the band gap absorption peak from O 2p–Zn 3d.65 We have noticed two peaks for the GO/ZnO nanocomposite at 230 nm and 372 nm representing the π–π* excitation of the GO structure and the characteristic absorption peak for ZnO. The aforementioned UV-Vis spectral results provide further support for the successful formation of the GO/ZnO nanocomposite.
3.2 Electrochemical performance
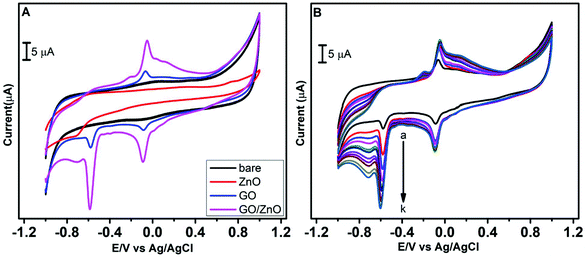
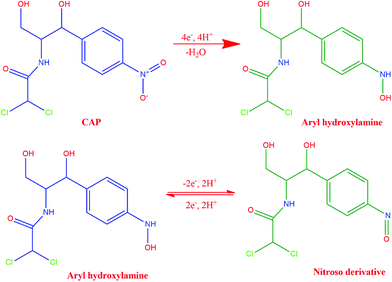
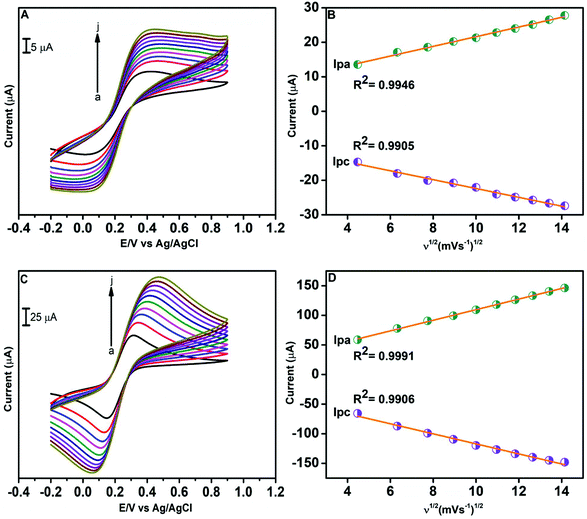
As the initial step of the electrochemical performance analysis, the electrochemical behavior of CAP at the modified and unmodified GCE was examined using the cyclic voltammetry technique. The cyclic voltammetric studies were performed with 0.05 M PBS at pH 7.0, and the scan rate was kept constant at 100 mV s−1. Fig. 5A depicts the electrochemical behavior of CAP on the bare GCE, GO/GCE, ZnO/GCE and GO/ZnO/GCE in the presence of 100 μM CAP, and Scheme 2 shows the electrochemical reduction process of CAP. The GO/ZnO nanocomposite modified GCE showed the highest cathodic and anodic peak currents compared to the other electrodes. Moreover, the GO/ZnO/GCE exhibited the lowest reduction potential value of −0.58 V. The well-defined cathodic peak at −0.58 V for the GO/ZnO/GCE corresponds to the direct reduction of the nitro group to phenylhydroxylamine, which is a four electron and four proton transfer mechanism.66 During the reverse scan, one anodic peak at −0.05 V and one cathodic peak at −0.08 V were obtained. The anodic peak indicates the oxidation of hydroxylamine to the nitroso group derivative, whereas the cathodic peak represents the reduction of the nitroso group derivative to hydroxylamine. This redox process follows a two electron and two proton transfer mechanism.67 It is to be noted that the peak current of the reduction process at −0.58 V is higher than the oxidation peak current at −0.05 V and the reduction peak current at −0.08 V, indicating the reduction of CAP at the GO/ZnO/GCE shows greater tendency to form hydroxylamine under neutral conditions. As Fig. 5A shows, the GO/ZnO modified GCE displayed higher peak currents and lower reduction potential than the other electrodes. For the bare GCE, a very low peak current was observed, which is an indication of the poor electrocatalytic activity of the bare GCE towards CAP detection. By modifying the bare GCE with the hierarchical ZnO, a small reduction peak was recorded at −0.71 V, showing some improvement in the electrocatalytic activity. Similarly, when the bare GCE was modified with GO, a small reduction peak at −0.59 V and a small redox peak were observed. The GO/ZnO/GCE, on the other hand, exhibited a sharp reduction peak at −0.58 V and a redox peak with considerably higher currents. The cathodic peak current of the GO/ZnO/GCE is 8 times higher than that of the bare GCE in the presence of CAP. Apparently, the combination of GO with the hierarchical ZnO nanostructures has significantly increased the electrocatalytic activity of the nanocomposite modified GCE. GO is a conductive material with a high specific surface area. Highly functionalized GO also provides active sites for the immobilization of other nanomaterials. By hybridizing GO with the hierarchical ZnO nanostructure, the GO in the composite acts like bridges connecting the individual ZnO nanostructure into a continuous network, thereby facilitating electron transfer within the nanocomposite, as well as between the electrode surface and the electrolyte. The synergetic effects of ZnO and GO sheets thus result in a significant improved electrocatalytic activity towards the detection of CAP.57,68Further CV studies were carried out for the GO/ZnO/GCE with the successive addition of CAP in 0.05 M PBS to investigate the correlation between peak currents and CAP concentration. As shown in Fig. 5B, when the CAP concentration was increased from 50 to 500 μM, a linear increase in the oxidation and reduction peak currents was observed. The rise in the peak current with CAP concentration indicates the outstanding catalytic activity of the GO/ZnO modified GCE for CAP sensing. This high electrocatalytic activity towards CAP detection is the result of ZnO surface active site enhancement by GO sheets.
| Ip = 20.69 × 10⁵ACn3/2D1/2ν1/2 |
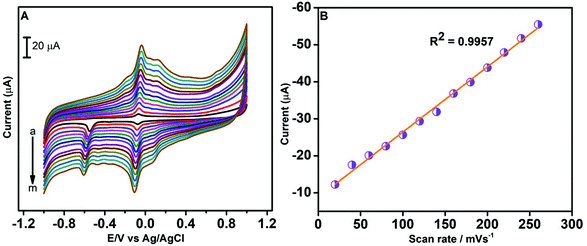 | ||
| Fig. 7 CV curves of the GO/ZnO/GCE in 0.05 M PBS containing 100 μM CAP at different scan rates from 10 to 260 mV s−1 (A). Linear plot of reduction peak current vs. scan rate (B). | ||
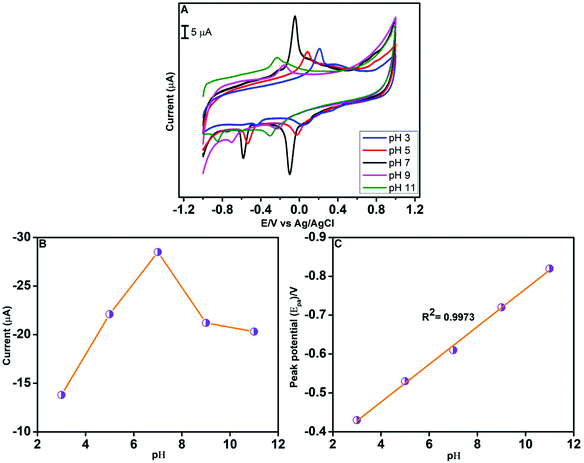
The electrochemical behaviour of CAP is markedly influenced by the pH of the electrolyte solution. Hence, we have investigated the effect of pH on the reduction of CAP using CV in the presence of 100 μM CAP (Fig. 8A). The pH was varied from 3.0 to 11.0, while the scan rate was fixed at 100 mV s−1. As Fig. 8B shows, when the pH increases from 3.0 to 7.0, the reduction peak current also increases. But, beyond the pH value of 7.0, a decrease in the cathodic peak current was observed. Consequently, the highest cathodic peak current occurs at pH 7.0. The relationship between the reduction peak potential and pH is depicted in Fig. 8C. A negative shift in the cathodic peak potential of CAP was noted when the pH of the electrolyte solution increases from 3.0 to 11.0. The linear regression equation obtained from the cathodic peak potential vs. pH plot is Epc(V) = −0.0485 pH − 0.2825; R2 = 0.9973. In other words, the slope value from the linear graph is 48.5 mV pH−1, and this indicates that CAP reduction at the GO/ZnO/GCE surface involves the transfer of equal number of protons and electrons.71 Based on the aforementioned observations, we have selected pH 7.0 for the electrochemical detection of CAP.
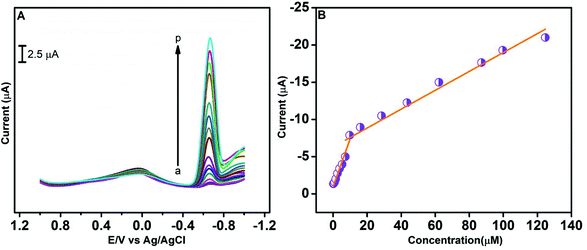 | ||
| Fig. 9 DPV curves at the GO/ZnO/GCE for different concentrations of CAP in 0.05 M PBS (pH 7.0) at a scan rate of 100 mV s−1 (A). The plot of cathodic peak current vs. concentration of CAP (B). | ||
| Electrode material | LOD (μM) | Linear range (μM) | Method | Ref. |
|---|---|---|---|---|
| AuMMB | 44 | 0.050–1 | Amperometry | 73 |
| Au/N–G/GCE | 0.59 | 2–80 | LSV | 74 |
| 3D-RGO/GCE | 0.15 | 1–113 | DPV | 75 |
| MIP/c-MWCNTs–AuNPs/GCE | 0.074 | 0.3–310 | DPV | 76 |
| MoS2/PANI/GCE | 0.069 | 0.1–10 | DPV | 77 |
| MoS2/SPAN | 0.065 | 0.1–10 | DPV | 78 |
| CFMEs | 0.047 | 1–10 | SWV | 79 |
| BDD | 0.03 | 0.1–50 | Amperometry | 80 |
| TiN/RGO | 0.02 | 0.05–100 | CV | 66 |
| GO/ZnO/GCE | 0.01 | 0.2–124 | DPV | This work |
The repeatability studies of GO/ZnO were carried out in the presence of 100 μM CAP for 8 successive measurements, and an RSD value of 3.24% was obtained. Furthermore, to evaluate reproducibility, we have prepared 8 GO/ZnO/GCE for the detection of CAP; the resulting 2.84% RSD indicates excellent reproducibility. The operational stability of the GO/ZnO/GCE was investigated by analysing the current response of the modified electrode for 24 consecutive days. It is noted that 93.89% of the initial current response was retained after 24 days of storage, indicating excellent stability of the proposed sensor. The aforementioned results indicate good stability, repeatability and reproducibility of the GO/ZnO modified GCE for the CAP detection.
4 Conclusions
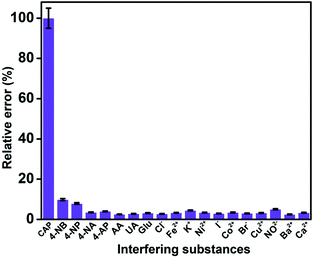
We have successfully performed sensitive and selective electrochemical detection towards CAP using a novel GO/ZnO nanocomposite. The GO/ZnO nanocomposite, consisting of a sheet-based ZnO hierarchical architecture, was prepared using a simple sonochemical method. The GO/ZnO/GCE-based sensor displays high sensitivity with a detection limit of 0.01 μM, surpassing the LOD of various electrodes reported previously. It works in the linear range of 0.2 to 7.2 μM and exhibits high stability, repeatability and reproducibility. Practicality of the proposed sensor has been demonstrated with real food and eye drop samples. Its anti-interference capability has also been verified with common interfering species. In conclusion, the proposed GO/ZnO-modified GCE shows great promise for the sensitive and efficient determination of CAP.Abbreviations
| Au | Gold |
| MMB | 2-Mercapto-5-methyl benzimidazole |
| N–G | Nitrogen doped graphene nanosheet |
| GCE | Glassy carbon electrode |
| AuNPs | Gold nanoparticles |
| GO | Graphene oxide |
| 3D-RGO | Three-dimensional reduced graphene oxide |
| MIP | Molecularly imprinted polymer |
| c-MWCNTs | Carboxyl acid functionalized multiwall carbon nanotubes |
| MoS2 | Molybdenum disulfide |
| PANI | Polyaniline |
| SPAN | Self-doped polyaniline |
| CFMEs | Cylindrical carbon fibre microelectrodes |
| BDD | Boron doped diamond thin-film |
| TiN | Titanium nitride |
| ZnO | Zinc oxide |
| DPV | Differential pulse voltammetry |
| SWV | Square wave voltammetry |
| CV | Cyclic voltammetry |
| LSV | Linear sweep voltammetry |
Conflicts of interest
The authors declare no conflicts of interest.Acknowledgements
This work was financially supported by the Ministry of Science and Technology, Taiwan, ROC under the grant MOST 106-2221-E-027-107.References
- A. B. Boxall, EMBO Rep., 2004, 5, 1110–1116 CrossRef CAS.
- M. Seifrtová, L. Nováková, C. Lino, A. Pena and P. Solich, Anal. Chim. Acta, 2009, 649, 158–179 CrossRef.
- X. Chang, M. T. Meyer, X. Liu, Q. Zhao, H. Chen, J.-A. Chen, Z. Qiu, L. Yang, J. Cao and W. Shu, Environ. Pollut., 2010, 158, 1444–1450 CrossRef CAS.
- D. S. Aga, M. Lenczewski, D. Snow, J. Muurinen, J. B. Sallach and J. S. Wallace, J. Environ. Qual., 2016, 45, 407–419 CrossRef CAS.
- B. Wang, X.-L. Lv, D. Feng, L.-H. Xie, J. Zhang, M. Li, Y. Xie, J.-R. Li and H.-C. Zhou, J. Am. Chem. Soc., 2016, 138, 6204–6216 CrossRef CAS PubMed.
- A. V. Lloyd, G. Grimes, K.-T. Khaw and H. Shwachman, J. Am. Med. Assoc., 1963, 184, 1001–1006 CrossRef CAS.
- P. W. Rose, A. Harnden, A. B. Brueggemann, R. Perera, A. Sheikh, D. Crook and D. Mant, Lancet, 2005, 366, 37–43 CrossRef CAS.
- J. Lindenbaum, W. B. Greenough and M. Islam, Bull. W. H. O., 1967, 36, 871 CAS.
- T. Butler, K. Arnold, N. Linh and M. Pollack, Lancet, 1973, 302, 983–985 CrossRef CAS.
- F. McCrumb Jr., S. Mercier, J. Robic, M. Bouillat, J. Smadel, T. Woodward and K. Goodner, Am. J. Med., 1953, 14, 284–293 CrossRef CAS.
- B. E. Hirsch, Am. J. Otolaryngol., 1992, 13, 145–155 CrossRef CAS.
- H. Alemu and L. Hlalele, Bull. Chem. Soc. Ethiop., 2007, 21, 1–12 CrossRef CAS.
- S. Schwarz and E. Chaslus-Dancla, Vet. Res., 2001, 32, 201–225 CrossRef CAS.
- J. Turton, A. Havard, S. Robinson, D. Holt, C. Andrews, R. Fagg and T. Williams, Food Chem. Toxicol., 2000, 38, 925–938 CrossRef CAS.
- A. Gilmore, Can. Med. Assoc. J., 1986, 134, 423 CAS.
- A. Chatzitakis, C. Berberidou, I. Paspaltsis, G. Kyriakou, T. Sklaviadis and I. Poulios, Water Res., 2008, 42, 386–394 CrossRef CAS.
- B. J. Berendsen, T. Zuidema, J. De Jong, L. A. A. Stolker and M. W. Nielen, Anal. Chim. Acta, 2011, 700, 78–85 CrossRef CAS.
- B. Berendsen, L. Stolker, J. de Jong, M. Nielen, E. Tserendorj, R. Sodnomdarjaa, A. Cannavan and C. Elliott, Anal. Bioanal. Chem., 2010, 397, 1955–1963 CrossRef CAS.
- P. Jakubec, V. Urbanová, Z. Medříková and R. Zbořil, Chem. – Eur. J., 2016, 22, 14279–14284 CrossRef CAS.
- G. Visimberga, E. Yakimov, A. Redkin, A. Gruzintsev, V. Volkov, S. Romanov and G. Emelchenko, Phys. Status Solidi C, 2010, 7, 1668–1671 CrossRef CAS.
- D. C. Reynolds, D. C. Look and B. Jogai, Solid State Commun., 1996, 99, 873–875 CrossRef CAS.
- K.-H. Wu, L.-Y. Peng, M. Januar, K.-C. Chiu and K.-C. Liu, Thin Solid Films, 2014, 570, 417–422 CrossRef CAS.
- H. Sachdeva and R. Saroj, Sci. World J., 2013, 2013, 671–680 Search PubMed.
- S. J. T. Rezaei, M. R. Nabid, S. Z. Hosseini and M. Abedi, Synth. Commun., 2012, 42, 1432–1444 CrossRef CAS.
- R. Kumar, O. Al-Dossary, G. Kumar and A. Umar, Nano-Micro Lett., 2015, 7, 97–120 CrossRef PubMed.
- K. Suematsu, K. Watanabe, A. Tou, Y. Sun and K. Shimanoe, Anal. Chem., 2018, 90, 1959–1966 CrossRef CAS.
- O. Lupan, V. Postica, J. Grottrup, A. Mishra, N. H. de Leeuw, J. Carreira, J. Rodrigues, N. Ben Sedrine, M. R. Correia and T. Monteiro, ACS Appl. Mater. Interfaces, 2017, 9, 4084–4099 CrossRef CAS.
- C. Kim, J. W. Kim, H. Kim, D. H. Kim, C. Choi, Y. S. Jung and J. Park, Chem. Mater., 2016, 28, 8498–8503 CrossRef CAS.
- P. Balakrishna Pillai, A. Kumar, X. Song and M. M. De Souza, ACS Appl. Mater. Interfaces, 2018, 10, 9782–9791 CrossRef CAS PubMed.
- L. Xie, Y. Xu and X. Cao, Colloids Surf., B, 2013, 107, 245–250 CrossRef CAS PubMed.
- S. Chawla and C. S. Pundir, Anal. Biochem., 2012, 430, 156–162 CrossRef CAS.
- T.-J. Kuo, C.-N. Lin, C.-L. Kuo and M. H. Huang, Chem. Mater., 2007, 19, 5143–5147 CrossRef CAS.
- X. Li, C. Zhao and X. Liu, Microsyst. Nanoeng., 2015, 1, 15014 CrossRef.
- M. Marie, S. Mandal and O. Manasreh, Sensors, 2015, 15, 18714–18723 CrossRef CAS.
- R. Ahmad, N. Tripathy, M.-S. Ahn, K. S. Bhat, T. Mahmoudi, Y. Wang, J.-Y. Yoo, D.-W. Kwon, H.-Y. Yang and Y.-B. Hahn, Sci. Rep., 2017, 7, 5715 CrossRef PubMed.
- T.-J. Hsueh, S.-J. Chang, C.-L. Hsu, Y.-R. Lin and I.-C. Chen, J. Electrochem. Soc., 2008, 155, K152–K155 CrossRef CAS.
- J. Gonzalez-Chavarri, L. Parellada-Monreal, I. Castro-Hurtado, E. Castaño and G. G. Mandayo, Sens. Actuators, B, 2018, 255, 1244–1253 CrossRef CAS.
- Y. Ya, C. Jiang, T. Li, J. Liao, Y. Fan, Y. Wei, F. Yan and L. Xie, Sensors, 2017, 17, 545 CrossRef.
- B. Fang, C. Zhang, G. Wang, M. Wang and Y. Ji, Sens. Actuators, B, 2011, 155, 304–310 CrossRef CAS.
- H. G. Yang, C. H. Sun, S. Z. Qiao, J. Zou, G. Liu, S. C. Smith, H. M. Cheng and G. Q. Lu, Nature, 2008, 453, 638 CrossRef CAS.
- J. Zhang, J. Yu, Y. Zhang, Q. Li and J. R. Gong, Nano Lett., 2011, 11, 4774–4779 CrossRef CAS.
- X. Wang, M. Ahmad and H. Sun, Materials, 2017, 10, 1304 CrossRef.
- L. Fang, B. Liu, L. Liu, Y. Li, K. Huang and Q. Zhang, Sens. Actuators, B, 2016, 222, 1096–1102 CrossRef CAS.
- E. Morales-Narváez and A. Merkoçi, Adv. Mater., 2012, 24, 3298–3308 CrossRef.
- S. Park and R. S. Ruoff, Nat. Nanotechnol., 2009, 4, 217 CrossRef CAS.
- K. P. Loh, Q. Bao, G. Eda and M. Chhowalla, Nat. Chem., 2010, 2, 1015 CrossRef CAS PubMed.
- N. A. Zubir, C. Yacou, J. Motuzas, X. Zhang and J. C. D. Da Costa, Sci. Rep., 2014, 4, 4594 CrossRef.
- F. H. Cincotto, D. L. Golinelli, S. A. Machado and F. C. Moraes, Sens. Actuators, B, 2017, 239, 488–493 CrossRef CAS.
- M. Baccarin, F. A. Santos, F. C. Vicentini, V. Zucolotto, B. C. Janegitz and O. Fatibello-Filho, J. Electroanal. Chem., 2017, 799, 436–443 CrossRef CAS.
- T.-F. Yeh, J. Cihlář, C.-Y. Chang, C. Cheng and H. Teng, Mater. Today, 2013, 16, 78–84 CrossRef CAS.
- J. Yang, X. Zeng, L. Chen and W. Yuan, Appl. Phys. Lett., 2013, 102, 083101 CrossRef.
- F. Li, X. Jiang, J. Zhao and S. Zhang, Nano Energy, 2015, 16, 488–515 CrossRef CAS.
- J. Li, D. Kuang, Y. Feng, F. Zhang, Z. Xu and M. Liu, J. Hazard. Mater., 2012, 201, 250–259 CrossRef.
- D. Chen, H. Feng and J. Li, Chem. Rev., 2012, 112, 6027–6053 CrossRef CAS.
- H. Wu, X. Li, M. Chen, C. Wang, T. Wei, H. Zhang and S. Fan, Electrochim. Acta, 2018, 259, 355–364 CrossRef CAS.
- N. R. Devi, M. Sasidharan and A. K. Sundramoorthy, J. Electrochem. Soc., 2018, 165, B3046–B3053 CrossRef CAS.
- T. Arfin and S. N. Rangari, Anal. Methods, 2018, 10, 347–358 RSC.
- M. A. Mohamed, S. A. Atty, H. A. Merey, T. A. Fattah, C. W. Foster and C. E. Banks, Analyst, 2017, 142, 3674–3679 RSC.
- J. Song, L. Xu, C. Zhou, R. Xing, Q. Dai, D. Liu and H. Song, ACS Appl. Mater. Interfaces, 2013, 5, 12928–12934 CrossRef CAS PubMed.
- H.-S. Chen, W.-C. Yu, W.-C. Chang and Y.-W. Lu, Electrochim. Acta, 2016, 187, 655–661 CrossRef CAS.
- X. Gao, J. Jang and S. Nagase, J. Phys. Chem. C, 2009, 114, 832–842 CrossRef.
- C. Nethravathi and M. Rajamathi, Carbon, 2008, 46, 1994–1998 CrossRef CAS.
- D. Yan, G. Yin, Z. Huang, M. Yang, X. Liao, Y. Kang, Y. Yao, B. Hao and D. Han, J. Phys. Chem. B, 2009, 113, 6047–6053 CrossRef CAS.
- T. Arfin, R. Bushra and F. Mohammad, Graphene Technol., 2016, 1, 1–15 CrossRef.
- A. K. Zak, M. E. Abrishami, W. A. Majid, R. Yousefi and S. Hosseini, Ceram. Int., 2011, 37, 393–398 CrossRef CAS.
- S. Chuanuwatanakul, O. Chailapakul and S. Motomizu, Anal. Sci., 2008, 24, 493–498 CrossRef CAS.
- M. Feng, D. Long and Y. Fang, Anal. Chim. Acta, 1998, 363, 67–73 CrossRef CAS.
- E. Salih, M. Mekawy, R. Y. Hassan and I. M. El-Sherbiny, J. Nanostruct. Chem., 2016, 6, 137–144 CrossRef.
- C. O. Laoire, S. Mukerjee, K. Abraham, E. J. Plichta and M. A. Hendrickson, J. Phys. Chem. C, 2009, 113, 20127–20134 CrossRef CAS.
- J. Borowiec, R. Wang, L. Zhu and J. Zhang, Electrochim. Acta, 2013, 99, 138–144 CrossRef CAS.
- K. Kurzątkowska, S. Sayin, M. Yilmaz, H. Radecka and J. Radecki, Sensors, 2017, 17, 1368–1381 CrossRef PubMed.
- W.-H. Zhou, H.-H. Wang, W.-T. Li, X.-C. Guo, D.-X. Kou, Z.-J. Zhou, Y.-N. Meng, Q.-W. Tian and S.-X. Wu, J. Electrochem. Soc., 2018, 165, G3001–G3007 CrossRef CAS.
- L. Codognoto, E. Winter, K. M. Doretto, G. B. Monteiro and S. Rath, Microchim. Acta, 2010, 169, 345–351 CrossRef CAS.
- J. Borowiec, R. Wang, L. Zhu and J. Zhang, Electrochim. Acta, 2013, 99, 138–144 CrossRef CAS.
- X. Zhang, Y.-C. Zhang and J.-W. Zhang, Talanta, 2016, 161, 567–573 CrossRef CAS PubMed.
- H. Zhao, Y. Chen, J. Tian, H. Yu and X. Quan, J. Electrochem. Soc., 2012, 159, J231–J236 CrossRef CAS.
- T. Yang, H. Chen, T. Ge, J. Wang, W. Li and K. Jiao, Talanta, 2015, 144, 1324–1328 CrossRef CAS PubMed.
- R. Yang, J. Zhao, M. Chen, T. Yang, S. Luo and K. Jiao, Talanta, 2015, 131, 619–623 CrossRef CAS.
- L. Agüí, A. Guzmán, P. Yáñez-Sedeño and J. M. Pingarrón, Anal. Chim. Acta, 2002, 461, 65–73 CrossRef.
- F.-Y. Kong, T.-T. Chen, J.-Y. Wang, H.-L. Fang, D.-H. Fan and W. Wang, Sens. Actuators, B, 2016, 225, 298–304 CrossRef CAS.
| This journal is © the Partner Organisations 2019 |

