 Open Access Article
Creative Commons Attribution 3.0 Unported Licence
Hyperbranched phosphorus flame retardants: multifunctional additives for epoxy resins†
Alexander
Battig‡
 a,
Jens C.
Markwart‡
bc,
Frederik R.
Wurm
 *b and
Bernhard
Schartel
 *a
*a
aBundesanstalt für Materialforschung und -prüfung (BAM), Unter den Eichen 87, 12205 Berlin, Germany. E-mail: bernhard.schartel@bam.de
bMax Planck Institute for Polymer Research, Ackermannweg 10, 55128 Mainz, Germany. E-mail: wurm@mpip-mainz.mpg.de
cGraduate School Materials Science in Mainz, Staudinger Weg 9, 55128 Mainz, Germany
First published on 6th July 2019
Abstract
We successfully synthesized multifunctional P-based hyperbranched polymeric flame retardants (hb-FRs) with varying oxygen-to-nitrogen (O![[thin space (1/6-em)]](https://www.rsc.org/images/entities/char_2009.gif) :
:![[thin space (1/6-em)]](https://www.rsc.org/images/entities/char_2009.gif) N) content and characterized them via1H and 31P NMR and GPC. Their miscibility in epoxy resins (EP) and impact on glass-transition temperatures (Tg) were determined via differential scanning calorimetry (DSC). Using thermogravimetric and evolved gas analysis (TGA, TG-FTIR), pyrolysis gas chromatography/mass spectrometry (Py-GC-MS), hot stage FTIR, flammability tests UL-94 and LOI, fire testing via cone calorimetry, residue analysis via scanning electron microscopy (SEM) and elemental analysis, detailed decomposition mechanisms and modes of action are proposed. hb-polymeric FRs have improved miscibility and thermal stability, leading to high FR performance even at low loadings. Polymeric, complex FRs increase flame retardancy, mitigate negative effects of low molecular weight variants, and can compete with commercial aromatic FRs. The results illustrate the role played by the chemical structure in flame retardancy and highlight the potential of hb-FRs as multifunctional additives.
N) content and characterized them via1H and 31P NMR and GPC. Their miscibility in epoxy resins (EP) and impact on glass-transition temperatures (Tg) were determined via differential scanning calorimetry (DSC). Using thermogravimetric and evolved gas analysis (TGA, TG-FTIR), pyrolysis gas chromatography/mass spectrometry (Py-GC-MS), hot stage FTIR, flammability tests UL-94 and LOI, fire testing via cone calorimetry, residue analysis via scanning electron microscopy (SEM) and elemental analysis, detailed decomposition mechanisms and modes of action are proposed. hb-polymeric FRs have improved miscibility and thermal stability, leading to high FR performance even at low loadings. Polymeric, complex FRs increase flame retardancy, mitigate negative effects of low molecular weight variants, and can compete with commercial aromatic FRs. The results illustrate the role played by the chemical structure in flame retardancy and highlight the potential of hb-FRs as multifunctional additives.
Introduction
Polymeric materials are pervasive throughout almost all aspects of modern life. Their tunable properties promote a wide range of applications, from packaging, transport, and construction to consumer electronics, automotive, and aeronautics. In particular, high-performance polymers are increasingly used to reduce weight and improve fuel efficiency in aviation and automobiles, and their material properties are paramount to their effective use. However, plastics are intrinsically flammable and carry a large fire load, consequently prompting the use and continued research into flame retardants (FRs). Due to environmental and toxicological concerns,1 efforts into developing halogen-free alternatives to improve safety and reduce risks have led to the formulation of effective phosphorus-based FRs (P-FRs).2–5Moreover, there exists a trend towards polymeric FRs, as the blooming out or leaching of low molar mass FRs is undesirable in consumer products.6 Low molar mass FRs usually possess low thermal stability, thus limiting their processability. Furthermore, the overlap between the decomposition temperatures of the FR and matrix is crucial to achieving good performance.7,8 In comparison, oligomeric or polymeric FRs are more effective due to their increased thermal stability which leads to improved chemical interactions during decomposition, yielding higher char yields and better overall flame retardancy.9,10 In addition, FRs with novel architectures have been investigated, highlighting the impact of the complex chemical structure on the mechanical properties and glass-transition temperature (Tg) of the polymer matrix.
One group of polymers which has the potential to merge the approaches of utilizing high molar mass and complex molecular architecture is hyperbranched (hb) polymers. hb polymers are a group of specialized macromolecules that exhibit a high branching density and are more easily synthesized via a one-pot synthesis than other complex polymers.11,12 A wide array of synthesis routes and applications has been extensively investigated.13–15
Due to their unique characteristics, these complex macromolecules have found use in the biomedical field,16–18 and recently, they have been proposed as FRs for polymers.19–21hb flame retardants (hb-FRs) combine the potential of polymeric FRs with the advantages of complex geometries.22,23 Their high molar mass and complex architecture lead to high solubility and miscibility with other materials.24 Chiefly among hb-FRs, hb-polyphosphoesters have been recently proposed as effective FRs,25 also in epoxy resins (EP).26 Additionally, phosphorus (P) and nitrogen (N) containing hb-FRs have been investigated,27,28 as the synergistic qualities of P–N compounds have been widely discussed.29,30
In a recent study, we have investigated the flame retardancy effect of P-FRs by systematically varying the structure, namely phosphates, phosphoramidates, phosphorodiamidates, and phosphoramides, and have proven the differences in the decomposition mechanism and mode of action.31
In this article, we synthesized hb-FRs from the previously investigated corresponding monomeric FRs by a radical A2 + B3 thiol–ene polyaddition (Scheme 1) and investigated their decomposition mechanism. The aim is to compare the FR potential of hb-FRs with varying P–O and P–N contents, and the high molar mass variants are compared to their monomers in terms of flame retardancy mechanisms, mode of action, and efficacy in epoxy resins. The A2 + B3 strategy was chosen due to its ease of synthesis and potential for up-scaling.32,33 As P–O and P–N-bonds possess different stabilities and degradation pathways, an optimized FR performance can be obtained by a precise synthesis of P-FRs.31
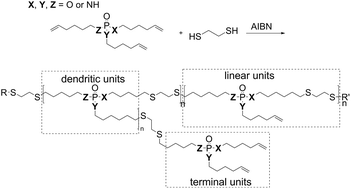 | ||
| Scheme 1 Synthesis of hb-FRs via an A2 + B3 thiol–ene polyaddition, and schematic representation of dendritic, linear, and terminal units of the hb-structure. | ||
However, the polymerization process alters the end-group functionality and may affect gas-phase activity. It is unclear which flame-retardant affects the hb polymeric variants of previously investigated P-FRs. Moreover, the role of complex molecular architecture in the FR's chemical mechanism remains unclear. With this study, investigating the decomposition pathway of distinctively different hb-FRs and their mode of action in EP becomes possible, allowing for a deeper understanding of these multifunctional additives as effective FRs for high-performance polymers. Crucially, the material properties of epoxy resins must be conserved, and by comparing these aliphatic hb-FRs to a state-of-the-art, commercially available benchmark FR, their performance can be more accurately estimated. While there have been many reports on P-FR formulations for epoxy resins,34 of which some studied one type of hb-FR,35,36 this study aims at investigating four high-molar mass hb P-FRs with systematically varying P–O and P–N contents which are able to retain the material properties of DGEBA-based EP. The results of material and flame retardancy studies aid in optimizing future design of P-FRs.
Results and discussion
Hyperbranched flame retardants (hb-FRs)
![[thin space (1/6-em)]](https://www.rsc.org/images/entities/char_2009.gif) :
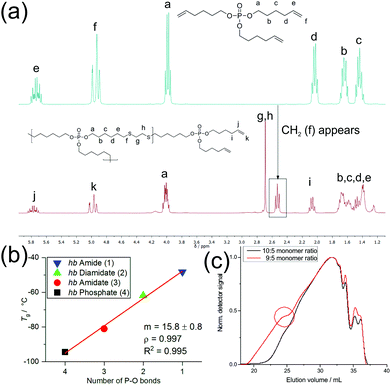
:![[thin space (1/6-em)]](https://www.rsc.org/images/entities/char_2009.gif) N) ratios. The spectrum of the monomeric phosphate in Fig. 1a highlights the change from the monomeric to polymeric structure. Here, the appearance of a CH2 group (triplet) at 2.55 ppm signified a successful polymerization, as it corresponds to the methylene group adjacent to the thioether. The singlet at 2.71 ppm belongs to the two methylene groups between the two thioether linkages. The signals from 1.70 to 1.38 ppm were attributed to the methylene groups of the alkyl chain. Fig. S4–S7† show the 31P {H} NMR spectra of the hyperbranched polymers with varying O
N) ratios. The spectrum of the monomeric phosphate in Fig. 1a highlights the change from the monomeric to polymeric structure. Here, the appearance of a CH2 group (triplet) at 2.55 ppm signified a successful polymerization, as it corresponds to the methylene group adjacent to the thioether. The singlet at 2.71 ppm belongs to the two methylene groups between the two thioether linkages. The signals from 1.70 to 1.38 ppm were attributed to the methylene groups of the alkyl chain. Fig. S4–S7† show the 31P {H} NMR spectra of the hyperbranched polymers with varying O![[thin space (1/6-em)]](https://www.rsc.org/images/entities/char_2009.gif) :
:![[thin space (1/6-em)]](https://www.rsc.org/images/entities/char_2009.gif) N ratios. The resonance of the P-atom shifted depending on its chemical surroundings to lower field with increasing nitrogen content surrounding P (from 17.13 ppm for 1 to −0.66 ppm for 4).
N ratios. The resonance of the P-atom shifted depending on its chemical surroundings to lower field with increasing nitrogen content surrounding P (from 17.13 ppm for 1 to −0.66 ppm for 4).
As an A2 + B3 polymerization can produce both cross-linked and soluble hb-polymers,24 depending on the polymerization conditions and monomer feed ratios, we optimized the polymerization conditions using 4 as an example. Table S1† summarizes the conditions which were varied to produce soluble polymers compared to cross-linking, yield and molecular weights for different monomer feed ratios. For all molar feed ratios up to 8![[thin space (1/6-em)]](https://www.rsc.org/images/entities/char_2009.gif) :
:![[thin space (1/6-em)]](https://www.rsc.org/images/entities/char_2009.gif) 5 (thiols of the A2vs. double bonds of the B3), cross-linking was observed. For molar ratios 5
5 (thiols of the A2vs. double bonds of the B3), cross-linking was observed. For molar ratios 5![[thin space (1/6-em)]](https://www.rsc.org/images/entities/char_2009.gif) :
:![[thin space (1/6-em)]](https://www.rsc.org/images/entities/char_2009.gif) 9, 5
9, 5![[thin space (1/6-em)]](https://www.rsc.org/images/entities/char_2009.gif) :
:![[thin space (1/6-em)]](https://www.rsc.org/images/entities/char_2009.gif) 10 and 5
10 and 5![[thin space (1/6-em)]](https://www.rsc.org/images/entities/char_2009.gif) :
:![[thin space (1/6-em)]](https://www.rsc.org/images/entities/char_2009.gif) 11, no gelation occurred, and soluble polymers were obtained. The molecular weights decreased with increasing excess of the B3-monomer. Also, the 5
11, no gelation occurred, and soluble polymers were obtained. The molecular weights decreased with increasing excess of the B3-monomer. Also, the 5![[thin space (1/6-em)]](https://www.rsc.org/images/entities/char_2009.gif) :
:![[thin space (1/6-em)]](https://www.rsc.org/images/entities/char_2009.gif) 9 ratio did not always prevent cross-linking, most probably due to variations in the mixing process by the mechanical stirrer. GPC elugrams also sometimes exhibited shoulders to lower elution volumes, indicating an onset of gelation under these conditions (Fig. 1c). Although the 5
9 ratio did not always prevent cross-linking, most probably due to variations in the mixing process by the mechanical stirrer. GPC elugrams also sometimes exhibited shoulders to lower elution volumes, indicating an onset of gelation under these conditions (Fig. 1c). Although the 5![[thin space (1/6-em)]](https://www.rsc.org/images/entities/char_2009.gif) :
:![[thin space (1/6-em)]](https://www.rsc.org/images/entities/char_2009.gif) 9 ratio provided the highest molecular weights after 24 h of polymerization, the broadest molar mass dispersity with ca. Mw/Mn = 12 was obtained. The 5
9 ratio provided the highest molecular weights after 24 h of polymerization, the broadest molar mass dispersity with ca. Mw/Mn = 12 was obtained. The 5![[thin space (1/6-em)]](https://www.rsc.org/images/entities/char_2009.gif) :
:![[thin space (1/6-em)]](https://www.rsc.org/images/entities/char_2009.gif) 11 and 5
11 and 5![[thin space (1/6-em)]](https://www.rsc.org/images/entities/char_2009.gif) :
:![[thin space (1/6-em)]](https://www.rsc.org/images/entities/char_2009.gif) 10 ratios both prevented gelation and resulted in lower molar masses. We chose the 5
10 ratios both prevented gelation and resulted in lower molar masses. We chose the 5![[thin space (1/6-em)]](https://www.rsc.org/images/entities/char_2009.gif) :
:![[thin space (1/6-em)]](https://www.rsc.org/images/entities/char_2009.gif) 10 ratio for the following studies as it prevented gelation effectively and resulted in higher molar masses than the 5
10 ratio for the following studies as it prevented gelation effectively and resulted in higher molar masses than the 5![[thin space (1/6-em)]](https://www.rsc.org/images/entities/char_2009.gif) :
:![[thin space (1/6-em)]](https://www.rsc.org/images/entities/char_2009.gif) 11 ratio. All polymers were obtained in yields of 76–89% as off-white and viscous oils.
11 ratio. All polymers were obtained in yields of 76–89% as off-white and viscous oils.
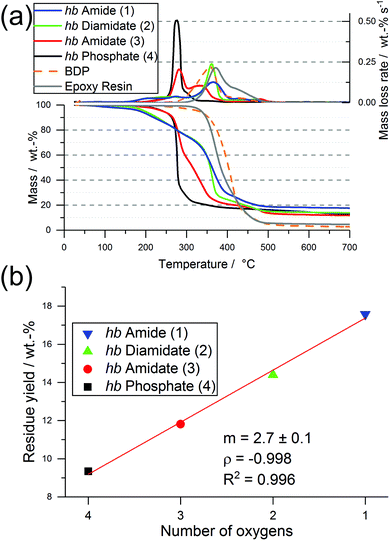
Interestingly, the residue amount after pyrolytic decomposition increased with increasing N content by approx. 2.7 wt%, and Fig. 2b illustrates the linear increase between the number of O in the P-binding sphere and the residue yield. The increase in residue yield with increasing P–N bonds in the hb-FRs results from the formation of thermally stable intermediates that decompose over a broad temperature range. When comparing 3 and 4, the replacement of a P–O bond with a P–N bond increased residue yield and introduced an additional decomposition step at elevated temperatures. When comparing 1 and 2 to 3 and 4, the mass loss behavior changed drastically from a single-step decomposition with a shoulder to a multi-step decomposition over a large temperature range, pointing to a crucial influence of the number of P–N bonds in the polymer on its decomposition pathway.
To better understand the decomposition mechanisms of the FRs under pyrolytic conditions, the materials were investigated via evolved gas analysis using TGA-FTIR (Fig. 3a–d) and pyrolysis gas chromatography/mass spectrometry (Py-GC/MS) (Fig. 4). The evolved gas FTIR spectra of decomposition products correspond to specific decomposition steps during pyrolysis of hb-FRs. For hb-FRs, either 5-hexene-1-ol and/or 5-hexene-1-amine was detected during the decomposition, depending on the O![[thin space (1/6-em)]](https://www.rsc.org/images/entities/char_2009.gif) :
:![[thin space (1/6-em)]](https://www.rsc.org/images/entities/char_2009.gif) N ratio, which correlates well with previous investigations for low molar mass P-FRs.31 5-Hexene-1-ol was identified via the vibration band at 1054 cm−1 from the stretching vibration of (C–O). 5-Hexene-1-amine was identified via the stretching vibration band at 1068 cm−1 from (C–N) and the wagging deformation band at 769 cm−1 from (N–H). Additionally, 1,5-hexadiene was identified as a decomposition product (via a β-elimination) for all hb-FRs via the bands at 3082 cm−1 from unsaturated hydrocarbons and those at 1642 cm−1, 1452 cm−1, 998 cm−1 and 917 cm−1 belonging to various C–H vibrations of the hexene moiety, which were also observed in 5-hexene-1-amine and 5-hexene-1-ol. Interestingly, at T > 330 °C, all spectra showed few if any bands for unsaturated hydrocarbons (bands > 3000 cm−1). Furthermore, 2, 3, and 4 exhibited the production of a P-species at T = 260–280 °C: for 2 and 3, the bands at 1330–1300 cm−1 from the overlapping stretching vibrations of P
N ratio, which correlates well with previous investigations for low molar mass P-FRs.31 5-Hexene-1-ol was identified via the vibration band at 1054 cm−1 from the stretching vibration of (C–O). 5-Hexene-1-amine was identified via the stretching vibration band at 1068 cm−1 from (C–N) and the wagging deformation band at 769 cm−1 from (N–H). Additionally, 1,5-hexadiene was identified as a decomposition product (via a β-elimination) for all hb-FRs via the bands at 3082 cm−1 from unsaturated hydrocarbons and those at 1642 cm−1, 1452 cm−1, 998 cm−1 and 917 cm−1 belonging to various C–H vibrations of the hexene moiety, which were also observed in 5-hexene-1-amine and 5-hexene-1-ol. Interestingly, at T > 330 °C, all spectra showed few if any bands for unsaturated hydrocarbons (bands > 3000 cm−1). Furthermore, 2, 3, and 4 exhibited the production of a P-species at T = 260–280 °C: for 2 and 3, the bands at 1330–1300 cm−1 from the overlapping stretching vibrations of P![[double bond, length as m-dash]](https://www.rsc.org/images/entities/char_e001.gif) O or P–N, and for 4, the bands at 1299 cm−1 from the stretching vibration R2–(P
O or P–N, and for 4, the bands at 1299 cm−1 from the stretching vibration R2–(P![[double bond, length as m-dash]](https://www.rsc.org/images/entities/char_e001.gif) O)–OH, and 1034 cm−1 from R2–(P–OH)
O)–OH, and 1034 cm−1 from R2–(P–OH)![[double bond, length as m-dash]](https://www.rsc.org/images/entities/char_e001.gif) O or the stretching vibration of (P–O–C). During the decomposition of the hb-FRs with P–N bonds, the evolution of ammonia at T = 330–360 °C and temperatures above 440 °C was identified by the bands at 3334 cm−1, 1642 cm−1, 966 cm−1, 931 cm−1, and 629 cm−1.
O or the stretching vibration of (P–O–C). During the decomposition of the hb-FRs with P–N bonds, the evolution of ammonia at T = 330–360 °C and temperatures above 440 °C was identified by the bands at 3334 cm−1, 1642 cm−1, 966 cm−1, 931 cm−1, and 629 cm−1.
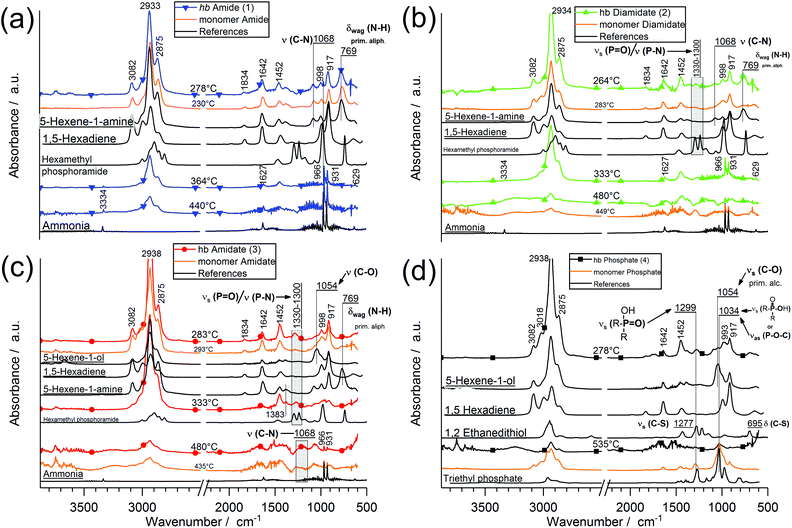 | ||
| Fig. 3 Evolved gas analysis via FTIR (TG-FTIR) of hb-FRs: (a–d) FTIR spectra of hb-FRs at specific decomposition steps, their monomeric variants (orange) and comparative spectra. | ||
The FTIR spectra, TGA mass loss curves, and residue amounts after pyrolysis point toward a certain behavior during pyrolysis: all units of the hb-FR undergo several types of decomposition reactions, and several mechanisms occur simultaneously or in tandem with one another. A general decomposition pathway is described in Scheme 2, and hydrolysis (Scheme S1†), elimination (Scheme S2†), and intra- or intermolecular reactions (Scheme S3†) are described more in depth in the ESI.†
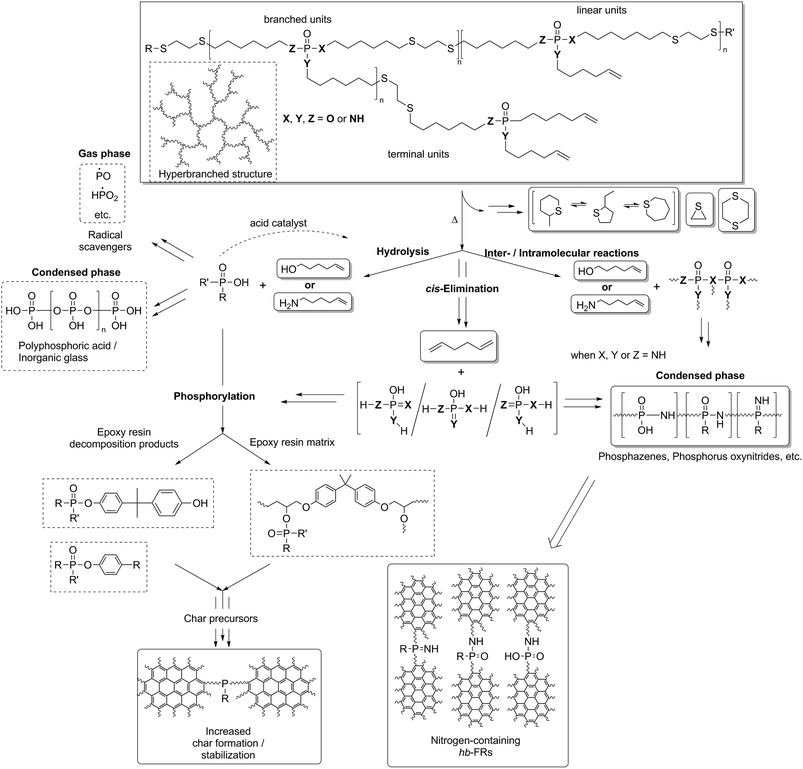 | ||
| Scheme 2 Proposed decomposition mechanism of hb-FRs and FR interaction with EP during thermal decomposition of EP-hb-FRs. Solid squares: identified products (TG-FTIR, hot stage FTIR, etc.). | ||
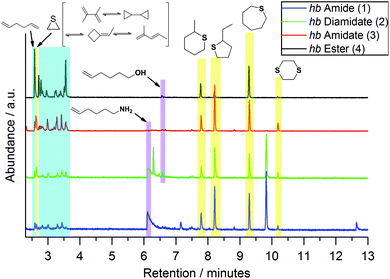
For Py-GC/MS, μg samples were pyrolyzed at a specific temperature and the evolved gases passed through a GC separation column and an MS detector. Measurements at 500 °C (Fig. 4) revealed additional information on the decomposition mechanism of hb-FRs: the production of 1,5-hexadiene was identified by the mass spectrum at 2.6 min (Fig. S8†) and the signals at retention times of 2.7–3.7 min (areas highlighted in blue) were assigned to various C6H10-species formed by the high-temperature rearrangement of 1,5-hexadiene. Moreover, 5-hexene-1-amine and 5-hexene-1-ol (areas highlighted in purple) were observed at retention times of 6.1 min (Fig. S10†) and 6.6 min (Fig. S11†), respectively. Additionally, all hb-FRs formed cyclic sulfur-containing compounds (areas highlighted in yellow). The mass spectra of all hb-FRs at retention times of 2.63 min (corresponding to thiirane), 7.8 min (corresponding to 4-methylthiane), 8.2 min (corresponding to 2-ethylthiophane), 9.3 min (corresponding to thiepane), and 10.2 min (corresponding to 1,4-dithiane) are summarized in Fig. S9, S12, S13, S14 and S15,† respectively. A mechanism leading to the production of these products is proposed in Scheme S4.†
Flame retardant epoxy resins (EP-FRs)
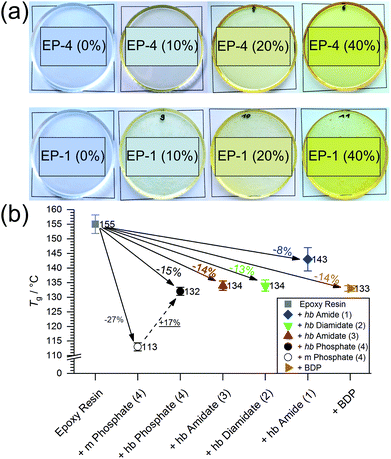
All hb-FRs were used as additive flame retardants and under the curing conditions no side-reactions of the phosphoramide-bond with the epoxy were reported.31 The impact of hb-FRs on the Tg of EP (Fig. S18†) is presented in Fig. 5b, and the change of Tg relative to EP is noted. When comparing the Tg of EP with the monomer of 4 with the Tg of EP-4, the hb-FR exhibited a relative increase of 17%, which showcases the decreased effect of hb-FRs over their low molecular weight P-FR counterparts. All hb-FRs except 1 lowered Tg of EP at a similar level to the benchmark material BDP, i.e. by 14%. 1 had the lowest impact on Tg compared to the other FRs, lowering Tg by only 8% to 142.5 °C. The Tg values are ordered 4 < 3 < 2 < 1, following the trend visible in the Tg of pure hb-FRs. It should be noted that hb-FRs are composed of aliphatic hydrocarbons as opposed to BDP, which contains aromatic rings. The reduced effect on Tg that these aliphatic FRs exhibit is comparable to that by aromatic compounds, which speaks for the ability of hb-FRs to mitigate the plasticizing effect of conventional aliphatic FRs. The hb-polymers present significantly higher Tg values in EP than their monomeric analogues (16–21% increase),31 highlighting their character as multifunctional FRs.
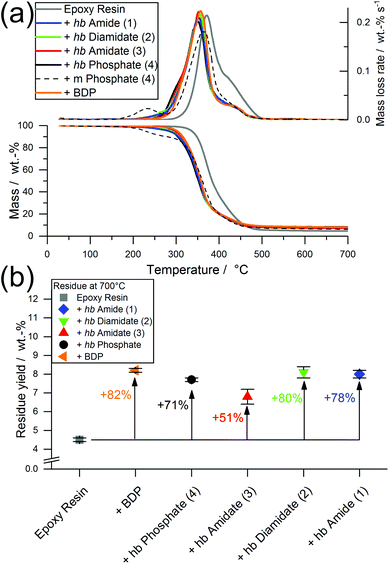
All EP-hb-FRs exhibited a similar decomposition behavior to EP-BDP: T5% was lower than EP by an average of approx. 47 °C, while Tmax was lowered by an average of approx. 21 °C. The residue yields of the EP-hb-FRs varied depending on the O![[thin space (1/6-em)]](https://www.rsc.org/images/entities/char_2009.gif) :
:![[thin space (1/6-em)]](https://www.rsc.org/images/entities/char_2009.gif) N ratio of the hb-FRs (Fig. 6b): EP with hb-phosphate (EP-4) and EP with hb-amidate (EP-3) showed a similar residue yield (7.7 and 6.8 wt%, respectively), while EP with hb-diamidate (EP-2) and hb-amide (EP-1) exhibited residue yields similar to EP-BDP (8.1 wt% and 8.0 wt%, respectively). Although EP-3 exhibited a lower residue yield, all hb-FRs increased residue yields by the same margin as the benchmark FR, signifying their ability to interact with the decomposing matrix, forming thermally stable residues. The mass loss of hb-FRs in EP was strikingly different from their monomeric FR variants: whereas the latter exhibited a mass loss equal to approx. 10 wt% near 220 °C (Fig. 3b, dotted line), all hb-FRs are significantly more thermally stable than their low molar mass counterparts in this temperature range and exhibited only minor decomposition.31 This higher decomposition temperature increased the overlap of FRs and matrix decomposition, leading to higher reactivity and interaction during pyrolysis,9,40 further illustrating the multifunctional capabilities of hb-FRs and the ability of polymeric FRs to overcome the impediments of their monomeric FR variants as well as perform equally to aromatic compounds.
N ratio of the hb-FRs (Fig. 6b): EP with hb-phosphate (EP-4) and EP with hb-amidate (EP-3) showed a similar residue yield (7.7 and 6.8 wt%, respectively), while EP with hb-diamidate (EP-2) and hb-amide (EP-1) exhibited residue yields similar to EP-BDP (8.1 wt% and 8.0 wt%, respectively). Although EP-3 exhibited a lower residue yield, all hb-FRs increased residue yields by the same margin as the benchmark FR, signifying their ability to interact with the decomposing matrix, forming thermally stable residues. The mass loss of hb-FRs in EP was strikingly different from their monomeric FR variants: whereas the latter exhibited a mass loss equal to approx. 10 wt% near 220 °C (Fig. 3b, dotted line), all hb-FRs are significantly more thermally stable than their low molar mass counterparts in this temperature range and exhibited only minor decomposition.31 This higher decomposition temperature increased the overlap of FRs and matrix decomposition, leading to higher reactivity and interaction during pyrolysis,9,40 further illustrating the multifunctional capabilities of hb-FRs and the ability of polymeric FRs to overcome the impediments of their monomeric FR variants as well as perform equally to aromatic compounds.
When comparing the FTIR spectra of evolved gases near T5% for EP-hb-FRs with monomeric FR variants in EP (Fig. 7a), the distinct similarities in the spectra indicate analogous decomposition products, namely 5-hexene-1-ol, 5-hexene-1-amine, cyclohexene, 1,5-hexadiene, and acetaldehyde. The spectra of EP-2, EP-3, and EP-4 exhibited the (C–O) stretching vibration band at 1054 cm−1 assigned to 5-hexene-1-ol. EP-2 and EP-3 produced cyclohexene as identified via the C–H bending vibration at 1140 cm−1. The spectra of EP-1 showed the (C–N) vibration band of aliphatic hydrocarbons at 1068 cm−1 and the (N–H) wagging deformation of primary amines of aliphatic molecules at 769 cm−1, pointing to the production of 5-hexene-1-amine. Moreover, the (C![[double bond, length as m-dash]](https://www.rsc.org/images/entities/char_e001.gif) O) stretching vibration at 1730 cm−1, corresponding to acetaldehyde, was visible for EP-1, EP-3, and EP-4, while it was concealed under noise for EP-2. Acetaldehyde is a product of the decomposition of unreacted epoxide groups from EP.39 The band at 3082 cm−1 belonging to the (C
O) stretching vibration at 1730 cm−1, corresponding to acetaldehyde, was visible for EP-1, EP-3, and EP-4, while it was concealed under noise for EP-2. Acetaldehyde is a product of the decomposition of unreacted epoxide groups from EP.39 The band at 3082 cm−1 belonging to the (C![[double bond, length as m-dash]](https://www.rsc.org/images/entities/char_e001.gif) C) stretching vibration was visible in all EP-hb-FR spectra at T5% and indicated that the decomposition products are unsaturated. When investigating the evolved gas spectra of EP, EP-hb-FRs, and EP-BDP at Tmax (Fig. 7b), all spectra were identical to the spectrum of EP, signifying that EP-hb-FRs did not exhibit gas evolvement at this point. This correlates well with the mass loss curves of the hb-FRs under pyrolytic conditions (Fig. 2a), as the hb-FRs have nearly completely decomposed at the Tmax of EP. These FTIR spectra provide further evidence that terminal and linear units of the hb structure decomposed near T5% as evidenced by the presence of unsaturated hydrocarbons present solely on these units and 5-hexene-1-ol and/or 5-hexene-1-amine, respectively. As previously mentioned, this can be rationalized by the lower thermal stability of the ω-hexenyl side chains compared to the thiol-linked main chain.
C) stretching vibration was visible in all EP-hb-FR spectra at T5% and indicated that the decomposition products are unsaturated. When investigating the evolved gas spectra of EP, EP-hb-FRs, and EP-BDP at Tmax (Fig. 7b), all spectra were identical to the spectrum of EP, signifying that EP-hb-FRs did not exhibit gas evolvement at this point. This correlates well with the mass loss curves of the hb-FRs under pyrolytic conditions (Fig. 2a), as the hb-FRs have nearly completely decomposed at the Tmax of EP. These FTIR spectra provide further evidence that terminal and linear units of the hb structure decomposed near T5% as evidenced by the presence of unsaturated hydrocarbons present solely on these units and 5-hexene-1-ol and/or 5-hexene-1-amine, respectively. As previously mentioned, this can be rationalized by the lower thermal stability of the ω-hexenyl side chains compared to the thiol-linked main chain.
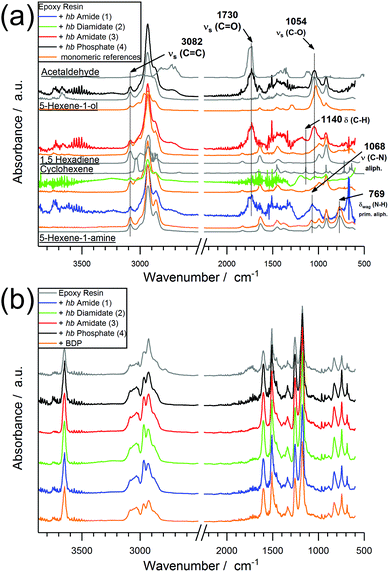 | ||
| Fig. 7 Evolved gas spectra of EP-hb-FRs via TG-FTIR at T5%; (orange: monomeric FR spectra at Tmax; gray: comparative spectra) (b) evolved gas spectra of EP and EP-hb-FRs via TG-FTIR at Tmax. | ||
The decomposition pathway is a complex interaction of the FR, the matrix and the decomposition species thereof.40 The detection of various P-species in the condensed phase (Fig. S19†) confirms that hb-FRs interact with the decomposing matrix. The incorporation of P into the residue increases charring via enhanced cyclization of the hydrocarbon chains and stabilizes the carbonaceous char by acting as cross-linking points between the polyaromatic hydrocarbons.41 The proposed mechanism is presented in Scheme 2: the decomposition of hb-FRs leads to the formation of O![[double bond, length as m-dash]](https://www.rsc.org/images/entities/char_e001.gif) (P–OH) groups via hydrolysis of the (P–N) or (P–O) bond, respectively, resulting in the production of phosphoric acid and acid derivatives. These P-based acids interact with EP in three ways: acting as acid catalysts for further hydrolysis,42 aiding in the phosphorylation process of the EP matrix via esterification and dehydration,43 and forming an inorganic glass via polyphosphoric acid, thus affording thermal stability to the residue.7,44 For N-containing hb-FRs, the formation of phosphazenes, phosphorus oxynitrides, and other PxNyOz species further increased cross-linking of the aromatic char, and the presence of N can accelerate phosphorylation through synergy.45–47
(P–OH) groups via hydrolysis of the (P–N) or (P–O) bond, respectively, resulting in the production of phosphoric acid and acid derivatives. These P-based acids interact with EP in three ways: acting as acid catalysts for further hydrolysis,42 aiding in the phosphorylation process of the EP matrix via esterification and dehydration,43 and forming an inorganic glass via polyphosphoric acid, thus affording thermal stability to the residue.7,44 For N-containing hb-FRs, the formation of phosphazenes, phosphorus oxynitrides, and other PxNyOz species further increased cross-linking of the aromatic char, and the presence of N can accelerate phosphorylation through synergy.45–47
HRR = χ·θ(t)·(1 − μ)·(h0c/hg)·![[q with combining dot above]](https://www.rsc.org/images/entities/i_char_0071_0307.gif) ′′eff ′′eff | (1) |
![[q with combining dot above]](https://www.rsc.org/images/entities/i_char_0071_0307.gif) ′′eff = ( ′′eff = (![[q with combining dot above]](https://www.rsc.org/images/entities/i_char_0071_0307.gif) ′′ex + ′′ex + ![[q with combining dot above]](https://www.rsc.org/images/entities/i_char_0071_0307.gif) ′′flame − ′′flame − ![[q with combining dot above]](https://www.rsc.org/images/entities/i_char_0071_0307.gif) ′′rerad − ′′rerad − ![[q with combining dot above]](https://www.rsc.org/images/entities/i_char_0071_0307.gif) ′′loss) ′′loss) | (2) |
![[q with combining dot above]](https://www.rsc.org/images/entities/i_char_0071_0307.gif) ′′eff is the effective heat flux,
′′eff is the effective heat flux, ![[q with combining dot above]](https://www.rsc.org/images/entities/i_char_0071_0307.gif) ′′ex is the external heat flux,
′′ex is the external heat flux, ![[q with combining dot above]](https://www.rsc.org/images/entities/i_char_0071_0307.gif) ′′flame is the heat flux due to thermal feedback,
′′flame is the heat flux due to thermal feedback, ![[q with combining dot above]](https://www.rsc.org/images/entities/i_char_0071_0307.gif) ′′rerad is the heat flux from reradiation, and
′′rerad is the heat flux from reradiation, and ![[q with combining dot above]](https://www.rsc.org/images/entities/i_char_0071_0307.gif) ′′loss is the loss of heat flux out of the flame.
′′loss is the loss of heat flux out of the flame.
The results of the cone calorimeter experiments are summarized in Table 1 and Fig. 8 plots the HRR and total heat released (THR) as functions of time. The shape of the HRR-curves gives insight into the behavior of the material during flaming combustion and highlights the modes of action of the FRs.49 For EP, the shape was typical of non-charring, thermally intermediately thick samples: after ignition, the material began to decompose with a strong initial increase in the HRR. The quasi-static HRR corresponding to the steady state HRR is marked only by a shoulder and disappears near the peak of heat release rate (PHRR). The peak results from a reduction of ![[q with combining dot above]](https://www.rsc.org/images/entities/i_char_0071_0307.gif) ′′loss caused by the glass wool under the sample preventing heat transfer to the sample holder as the pyrolysis zone approaches. EP had a PHRR of 1696 kW m−2 and a total heat evolved (THE = THR at flame-out) of 108.4 MJ m−2. It exhibited an effective heat of combustion (EHC = total heat evolved/total mass loss) of 26.9 MJ kg−1 and a residue yield of 0.7 wt%. For EP-BDP, the HRR-curve resembled a mixture of thermally thick charring materials and thermally intermediately thick non-charring materials: while it retained the characteristic shape of EP, the addition of a charring mode of action was visible, resulting in a 30% reduction of the PHRR (1180 kW m−2). THE and EHC were also 19% and 16% lower than EP (THE = 87.5 MJ m−2; EHC = 22.7 MJ kg−1), respectively. The residue yield was 3.1 wt%.
′′loss caused by the glass wool under the sample preventing heat transfer to the sample holder as the pyrolysis zone approaches. EP had a PHRR of 1696 kW m−2 and a total heat evolved (THE = THR at flame-out) of 108.4 MJ m−2. It exhibited an effective heat of combustion (EHC = total heat evolved/total mass loss) of 26.9 MJ kg−1 and a residue yield of 0.7 wt%. For EP-BDP, the HRR-curve resembled a mixture of thermally thick charring materials and thermally intermediately thick non-charring materials: while it retained the characteristic shape of EP, the addition of a charring mode of action was visible, resulting in a 30% reduction of the PHRR (1180 kW m−2). THE and EHC were also 19% and 16% lower than EP (THE = 87.5 MJ m−2; EHC = 22.7 MJ kg−1), respectively. The residue yield was 3.1 wt%.
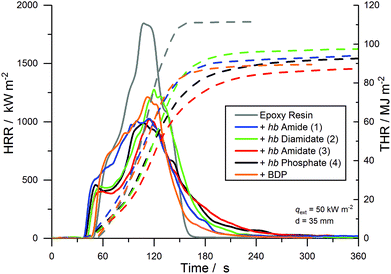 | ||
| Fig. 8 Heat release rate (HRR, full line) and total heat released (THR, dotted line) over t of EP and EP-FRs. | ||
| EP | EP-1 | EP-2 | EP-3 | EP-4 | EP-BDP | |
|---|---|---|---|---|---|---|
| THE = total heat evolved (=THR at flame-out). | ||||||
| THE [MJ m−2] | 108.4 ± 2.6 | 95.5 ± 2.3 | 99.1 ± 2.7 | 86.6 ± 0.1 | 89.8 ± 3.0 | 87.5 ± 1.2 |
| PHRR [kW m−2] | 1696 ± 180 | 1189 ± 155 | 1325 ± 10 | 1019 ± 17 | 953 ± 41 | 1180 ± 41 |
| Residue [wt%] | 0.7 ± 0.1 | 12.1 ± 2.7 | 7.0 ± 0.1 | 13.6 ± 0.5 | 7.5 ± 0.6 | 3.1 ± 0.2 |
| EHC [MJ kg−1] | 26.9 ± 1.0 | 25.5 ± 0.5 | 26.8 ± 0.8 | 25.1 ± 0.1 | 24.3 ± 0.6 | 22.7 ± 0.2 |
All EP-hb-FRs reduced the fire load of EP by 9–20% and the PHRR by 22–44% and increased residue yields in the order EP-2 < EP-4 < EP-1 < EP-3. EP-2 showed the lowest residue amount (7.0 wt%) and EP-3 exhibited the highest amount (13.6 wt%). EP-3 and EP-4 displayed the greatest reduction in PHRR and THE, while EP-1 and EP-2 did not achieve the same reduction in these indices. Nearly all hb-FRs exhibited a plateau-like shape approx. 20–30 s after ignition, which was caused by the formation of a protective char layer on the sample surface, shielding the underlying material from irradiation and reducing the PHRR. Additionally, the release of P-containing volatiles, observed in pyrolysis investigations (Fig. 2), acted in the gas phase as radical scavengers or fuel diluters, thus reducing THE. As combustion continued, the protective layer effect rescinded, and the decomposition of the underlying material increased towards the PHRR. After flame-out, the char layer underwent thermo-oxidation as evidenced by the slow increase of THR over time in the plateau-state at t > 240 s.
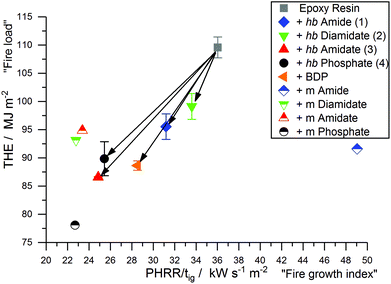
Petrella-plots are a way to assess fire behavior and flame retardancy:50 the fire load (THE) is plotted over the fire growth index (PHRR/tig), as THE quantitatively describes heat released but lacks a description of release rate, while PHRR/tig describes the flashover potential (severity of a fire, or peak heat release potential) but is not quantitative. The Petrella-plot of EP and EP-FRs (Fig. 9) displays that, while the PHRR/tig of EP was 36 kW m−2 s−1 and the THE was 109.6 MJ m−2, all EP-FRs exhibited a lower PHRR/tig and THE, as indicated by the shift to the lower left corner of the coordinate system. 2 displayed the lowest flame retardancy, lowering THE by only 10% to 99.1 kW m−2 s−1 and PHRR/tig by only 7% to 33.6 MJ m−2, while 3 showed the greatest reduction in both THE (21% reduction to 86.6 MJ m−2) and PHRR/tig (31% reduction to 24.9 kW m−2 s−1). The plot visualizes the ability of 3 and 4 to act more effectively in forced-flaming conditions than 1 and 2, providing further evidence that a critical O![[thin space (1/6-em)]](https://www.rsc.org/images/entities/char_2009.gif) :
:![[thin space (1/6-em)]](https://www.rsc.org/images/entities/char_2009.gif) N ratio determines decomposition behavior due to changes in the flame-retardancy mechanism and mode of action. Moreover, 3 and 4 outperform BDP, providing further evidence that hb-FRs can compete with aromatic compounds.
N ratio determines decomposition behavior due to changes in the flame-retardancy mechanism and mode of action. Moreover, 3 and 4 outperform BDP, providing further evidence that hb-FRs can compete with aromatic compounds.
Furthermore, Fig. 9 also visualizes the change in fire behavior from the monomer to polymer: the low molar mass variants exhibited very scattered results, where the monomer of 4 had a very different impact compared to the monomer of 1 in terms of lowering the fire load and fire growth index of EP. Although the hb-FRs presented varied results based on their O![[thin space (1/6-em)]](https://www.rsc.org/images/entities/char_2009.gif) :
:![[thin space (1/6-em)]](https://www.rsc.org/images/entities/char_2009.gif) N ratio, in general they displayed significantly less disperse values for fire growth and fire load, the result of a more pronounced chemical interaction between the FR and matrix during decomposition.
N ratio, in general they displayed significantly less disperse values for fire growth and fire load, the result of a more pronounced chemical interaction between the FR and matrix during decomposition.
Experimental
Materials
Methods
![[thin space (1/6-em)]](https://www.rsc.org/images/entities/char_2009.gif) :
:![[thin space (1/6-em)]](https://www.rsc.org/images/entities/char_2009.gif) 300. Peak assignments were made using the NIST14 MS library as a reference.
300. Peak assignments were made using the NIST14 MS library as a reference.
Structure characterization
31P {H} NMR (121 MHz, chloroform-d1): δ [ppm] = −0.66 (s) (Fig. S4†).
31P {H} NMR (121 MHz, chloroform-d): δ [ppm] = 9.24 (s) (Fig. S5†).
31P {H} NMR (121 MHz, chloroform-d): δ [ppm] = 15.49 (s) (Fig. S6†).
31P {H} NMR (121 MHz, chloroform-d): δ [ppm] = 17.13 (s) (Fig. S7†).
![[thin space (1/6-em)]](https://www.rsc.org/images/entities/char_2009.gif) :
:![[thin space (1/6-em)]](https://www.rsc.org/images/entities/char_2009.gif) 35), and 10 wt% of the total batch size was replaced with hb-FRs or the benchmark FR Bisphenol A bis(diphenyl phosphate) (BDP) (ICL-IP, Tel-Aviv, Israel). All samples needed for measurements were prepared in one batch in the following manner: the respective hb-FR was placed in a 1 L polypropylene cup, then DGEBA was added and the chemicals were blended with a wooden spatula until they became homogeneous. DMC was added, and the mixture was thoroughly mixed. Any resulting bubbles were removed in vacuo. The compounds were poured into prepared aluminum molds, and then cured in an oven at 90 °C for 30 minutes, at 120 °C for 30 minutes, and at 150 °C for 1 hour. UL-94 and LOI samples were cut into specified dimensions and stored under climate control prior to testing for at least 48 hours according to the respective standards.
35), and 10 wt% of the total batch size was replaced with hb-FRs or the benchmark FR Bisphenol A bis(diphenyl phosphate) (BDP) (ICL-IP, Tel-Aviv, Israel). All samples needed for measurements were prepared in one batch in the following manner: the respective hb-FR was placed in a 1 L polypropylene cup, then DGEBA was added and the chemicals were blended with a wooden spatula until they became homogeneous. DMC was added, and the mixture was thoroughly mixed. Any resulting bubbles were removed in vacuo. The compounds were poured into prepared aluminum molds, and then cured in an oven at 90 °C for 30 minutes, at 120 °C for 30 minutes, and at 150 °C for 1 hour. UL-94 and LOI samples were cut into specified dimensions and stored under climate control prior to testing for at least 48 hours according to the respective standards.
| Material | Content [g] | ||||
|---|---|---|---|---|---|
| EP | EP-1 | EP-2 | EP-3 | EP-4 | |
| DGEBA | 222.2 | 200 | 200 | 200 | 200 |
| DMC | 77.8 | 70 | 70 | 70 | 70 |
| 1 | — | 30 | — | — | — |
| 2 | — | — | 30 | — | — |
| 3 | — | — | — | 30 | — |
| 4 | — | — | — | 30 | |
Conclusions
Phosphorus-containing hyperbranched polymers for use as multifunctional flame-retardant additives for epoxy resins were synthesized via A2 + B3 thiol–ene polymerization. A systematic library of P–O and P–N containing polymers allowed the adjustment of the decomposition mechanism. Results from DSC and TGA experiments showed that Tg and residue yield after pyrolysis increased linearly with the N-content of the hb-FRs, and those FRs with a higher N-content were thermally more stable than those with a higher O-content. This was determined to result from a change in the decomposition mechanism which was proposed herein, and that a crucial O![[thin space (1/6-em)]](https://www.rsc.org/images/entities/char_2009.gif) :
:![[thin space (1/6-em)]](https://www.rsc.org/images/entities/char_2009.gif) N-ratio determined the pathway. Investigations of flame-retardant epoxy resins provided further evidence of the shift in the chemical decomposition mechanism and ultimately mode of action: all materials exhibited a condensed phase mechanism, as exemplified by the appearance of P-signals in hot stage FTIR measurements, the increase in residue yields in cone calorimeter measurements, and the high amount of the P-content in these residues as determined by elemental analysis. However, hb-FRs with a higher O-content exhibited a stronger reduction in the effective heat of combustion, signifying a more pronounced gas phase mechanism. This was supported by CO-yield comparison (see the ESI†) which showed that hb-FRs with a higher N-content more strongly affected the combustion efficiency. SEM and residue analysis also illustrated the intumescent characteristic of these FR additives. All hb-FRs were compared to the benchmark FR BDP and the results from all measurements demonstrated the ability of these aliphatic FRs to perform at a similar or superior level to an aromatic compound, even at low loadings (P-content in EP < 1%). The hb-FRs’ ability to mitigate some of the drawbacks of low molecular weight aliphatic FR additives, such as high volatility, low miscibility, poor cohesion in the matrix (leaching or blooming), or strong impact on Tg, speaks for their practical use as multifunctional flame retardant additives and showcases the enormous potential hyperbranched polymers can have in developing future materials in the field of flame retardancy.
N-ratio determined the pathway. Investigations of flame-retardant epoxy resins provided further evidence of the shift in the chemical decomposition mechanism and ultimately mode of action: all materials exhibited a condensed phase mechanism, as exemplified by the appearance of P-signals in hot stage FTIR measurements, the increase in residue yields in cone calorimeter measurements, and the high amount of the P-content in these residues as determined by elemental analysis. However, hb-FRs with a higher O-content exhibited a stronger reduction in the effective heat of combustion, signifying a more pronounced gas phase mechanism. This was supported by CO-yield comparison (see the ESI†) which showed that hb-FRs with a higher N-content more strongly affected the combustion efficiency. SEM and residue analysis also illustrated the intumescent characteristic of these FR additives. All hb-FRs were compared to the benchmark FR BDP and the results from all measurements demonstrated the ability of these aliphatic FRs to perform at a similar or superior level to an aromatic compound, even at low loadings (P-content in EP < 1%). The hb-FRs’ ability to mitigate some of the drawbacks of low molecular weight aliphatic FR additives, such as high volatility, low miscibility, poor cohesion in the matrix (leaching or blooming), or strong impact on Tg, speaks for their practical use as multifunctional flame retardant additives and showcases the enormous potential hyperbranched polymers can have in developing future materials in the field of flame retardancy.
Conflicts of interest
There are no conflicts to declare.Acknowledgements
The authors thank the Deutsche Forschungsgemeinschaft (DFG) for funding (DFG SCHA 730/15-1; WU 750/8-1).Alexander Battig thanks Patrick Klack for his assistance with the cone calorimeter measurements, Martin Günther, and Michael Morys for their help with SEM images, Dr Katharina Kebelmann for her help with Py-GC-MS measurements, and Letícia V. Lima for her aid in sample preparation and measurements. Jens C. Markwart is the recipient of a fellowship through funding of the Excellence Initiative (DFG/GSC 266) in the context of the graduate school of excellence “MAINZ” (Materials Science in Mainz”). Frederik R. Wurm and Jens C. Markwart thank Prof. Dr Katharina Landfester (MPI-P, Germany). Open Access funding provided by the Max Planck Society.
Notes and references
- S. Shaw, Rev. Environ. Health, 2010, 25, 261–306 CAS.
- M. M. Velencoso, A. Battig, J. C. Markwart, B. Schartel and F. R. Wurm, Angew. Chem., Int. Ed., 2018, 57, 10450–10467 CrossRef CAS.
- X. Wang, W. Xing, X. Feng, B. Yu, L. Song and Y. Hu, Polym. Chem., 2014, 5, 1145–1154 RSC.
- S. V. Levchik and E. D. Weil, J. Fire Sci., 2006, 24, 345–364 CrossRef CAS.
- B. Perret, B. Schartel, K. Stöβ, M. Ciesielski, J. Diederichs, M. Döring, J. Krämer and V. Altstädt, Eur. Polym. J., 2011, 47, 1081–1089 CrossRef CAS.
- M. Rakotomalala, S. Wagner and M. Döring, Materials, 2010, 3, 4300–4327 CrossRef CAS.
- G. Camino, L. Costa and M. P. Luda di Cortemiglia, Polym. Degrad. Stab., 1991, 33, 131–154 CrossRef CAS.
- S. K. Brauman, J. Fire Retard. Chem., 1977, 4, 38–58 CAS.
- B. Perret, K. H. Pawlowski and B. Schartel, J. Therm. Anal. Calorim., 2009, 97, 949–958 CrossRef CAS.
- K. H. Pawlowski and B. Schartel, Polym. Int., 2007, 56, 1404–1414 CrossRef CAS.
- B. I. Voit and A. Lederer, Chem. Rev., 2009, 109, 5924–5973 CrossRef CAS.
- C. J. Hawker, R. Lee and J. M. J. Frechet, J. Am. Chem. Soc., 1991, 113, 4583–4588 CrossRef CAS.
- A. Sunder, R. Hanselmann, H. Frey and R. Mülhaupt, Macromolecules, 1999, 32, 4240–4246 CrossRef CAS.
- C. Chen, G. Liu, X. Liu, S. Pang, C. Zhu, L. Lv and J. Ji, Polym. Chem., 2011, 2, 1389–1397 RSC.
- R. Hu, J. W. Y. Lam, J. Liu, H. H. Y. Sung, I. D. Williams, Z. Yue, K. S. Wong, M. M. F. Yuen and B. Z. Tang, Polym. Chem., 2012, 3, 1481–1489 RSC.
- S. E. Stiriba, H. Frey and R. Haag, Angew. Chem., Int. Ed., 2002, 41, 1329–1334 CrossRef CAS.
- M. Calderon, M. A. Quadir, S. K. Sharma and R. Haag, Adv. Mater., 2010, 22, 190–218 CrossRef CAS.
- K. Y. Pu, K. Li, J. B. Shi and B. Liu, Chem. Mater., 2009, 21, 3816–3822 CrossRef CAS.
- P. Y. Wen, X. F. Wang, W. Y. Xing, X. M. Peng, B. Yu, Y. Q. Shi, G. Tang, L. Song, Y. Hu and R. K. K. Yuen, Ind. Eng. Chem. Res., 2013, 52, 17015–17022 CrossRef CAS.
- J. Li, C. H. Ke, L. Xu and Y. Z. Wang, Polym. Degrad. Stab., 2012, 97, 1107–1113 CrossRef CAS.
- K. C. Cheng, C. C. Wang, J. L. Ruan, C. H. Wu and C. W. Li, Polym. Adv. Technol., 2018, 29, 2529–2536 CrossRef CAS.
- L. Zang, S. Wagner, M. Ciesielski, P. Müller and M. Döring, Polym. Adv. Technol., 2011, 22, 1182–1191 CrossRef CAS.
- B. Schartel and J. H. Wendorff, Polym. Eng. Sci., 1999, 39, 128–151 CrossRef CAS.
- F. Wurm and H. Frey, in Polymer Science: A Comprehensive Reference, ed. K. Matyjaszewski and M. Möller, Elsevier, Amsterdam, 2012, ch. 6.05, vol. 6, pp. 177–198 Search PubMed.
- D. H. Zhang, H. Y. Wu, T. C. Li, A. Q. Zhang, Y. L. Peng and F. X. Jing, Polym. Compos., 2011, 32, 36–43 CrossRef CAS.
- X. L. Chen, C. M. Jiao, S. X. Li and J. Sun, J. Polym. Res., 2011, 18, 2229–2237 CrossRef CAS.
- L. J. Duan, H. Y. Yang, L. Song, Y. B. Hou, W. Wang, Z. Gui and Y. Hu, Polym. Degrad. Stab., 2016, 134, 179–185 CrossRef CAS.
- Z. Li, P. Wei, Y. Yang, Y. G. Yan and D. A. Shi, Polym. Degrad. Stab., 2014, 110, 104–112 CrossRef CAS.
- S. Gaan, G. Sun, K. Hutches and M. H. Engelhard, Polym. Degrad. Stab., 2008, 93, 99–108 CrossRef CAS.
- G. F. Levchik, Y. V. Grigoriev, A. I. Balabanovich, S. V. Levchik and M. Klatt, Polym. Int., 2000, 49, 1095–1100 CrossRef CAS.
- J. C. Markwart, A. Battig, L. Zimmermann, M. Wagner, J. Fischer, B. Schartel and F. R. Wurm, ACS Appl. Polym. Mater., 2019, 1, 1118–1128 CrossRef CAS.
- H. Chen and J. Kong, Polym. Chem., 2016, 7, 3643–3663 RSC.
- T. Emrick, H. T. Chang and J. M. J. Frechet, Macromolecules, 1999, 32, 6380–6382 CrossRef CAS.
- M. Ciesielski, B. Burk, C. Heinzmann and M. Döring, in Novel Fire Retardant Polymers and Composite Materials, ed. D.-Y. Wang, Woodhead Publishing, 2017, ch. 2, pp. 3–51, DOI:10.1016/B978-0-08-100136-3.00002-9.
- J. Deng and W. F. Shi, Eur. Polym. J., 2004, 40, 1137–1143 CrossRef CAS.
- K. Täuber, F. Marsico, F. R. Wurm and B. Schartel, Polym. Chem., 2014, 5, 7042–7053 RSC.
- F. L. Meng, S. X. Zheng and T. X. Liu, Polymer, 2006, 47, 7590–7600 CrossRef CAS.
- L.-H. Lee, J. Polym. Sci., Part A: Gen. Pap., 1965, 3, 859–882 CrossRef CAS.
- D. P. Bishop and D. A. Smith, J. Appl. Polym. Sci., 1970, 14, 205–223 CrossRef CAS.
- B. Schartel, B. Perret, B. Dittrich, M. Ciesielski, J. Krämer, P. Müller, V. Altstädt, L. Zang and M. Döring, Macromol. Mater. Eng., 2016, 301, 9–35 CrossRef CAS.
- U. Braun, A. I. Balabanovich, B. Schartel, U. Knoll, J. Artner, M. Ciesielski, M. Döring, R. Perez, J. K. W. Sandler, V. Altstädt, T. Hoffmann and D. Pospiech, Polymer, 2006, 47, 8495–8508 CrossRef CAS.
- M. Steinmann, M. Wagner and F. R. Wurm, Chem. - Eur. J., 2016, 22, 17329–17338 CrossRef CAS.
- J. W. Lyons, J. Fire Flammability, 1970, 1, 302–311 CAS.
- B. Schartel, Materials, 2010, 3, 4710–4745 CrossRef CAS.
- S. V. Levchik, in Flame Retardant Polymer Nanocomposites, ed. A. B. Morgan and C. A. Wilkie, John Wiley & Sons, Inc., 2006, pp. 1–29, DOI:10.1002/9780470109038.ch1.
- E. D. Weil, Fire Retard. Polym. Mater., 2000, 115–145 Search PubMed.
- S. V. Levchik, G. F. Levchik, A. I. Balabanovich, E. D. Weil and M. Klatt, Angew. Makromol. Chem., 1999, 264, 48–55 CrossRef CAS.
- R. Lyon, in Handbook of Building Materials for Fire Protection, ed. C. Harper, McGraw-Hill, New York, New York, 2004, pp. 3.1–3.51 Search PubMed.
- B. Schartel and T. R. Hull, Fire Mater., 2007, 31, 327–354 CrossRef CAS.
- R. Petrella, J. Fire Sci., 1994, 12, 14–43 CrossRef CAS.
- B. Schartel, M. Bartholmai and U. Knoll, Polym. Degrad. Stab., 2005, 88, 540–547 CrossRef CAS.
Footnotes |
| † Electronic supplementary information (ESI) available: NMR spectra (Fig. S1–S7); polymerization study (Table S1); DSC results (Table S2); TGA results of hb-FRs (Table S3); hydrolysis decomposition (Scheme S1); elimination decomposition (Scheme S2); inter- and intramolecular decomposition (Scheme S3); sulfur decomposition (Scheme S4); mass spectra of Py-GC-MS (Fig. S8–15); surface etching (Fig. S16); DSC (Fig. S17 and 18); TGA results of EP-hb-FRs (Table S4); condensed phase FTIR (Fig. S19 and Table S5); LOI & UL-94 measurements (Table S6); MARHE & FIGRA of cone calorimeter (Table S7); CO-yields (Fig. S20 and Table S8); residue analysis (Fig. S21). See DOI: 10.1039/c9py00737g |
| ‡ These authors contributed equally. |
| This journal is © The Royal Society of Chemistry 2019 |

