 Open Access Article
Creative Commons Attribution 3.0 Unported Licence
On-line SEC-MR-NMR hyphenation: optimization of sensitivity and selectivity on a 62 MHz benchtop NMR spectrometer
Carlo
Botha
 ,
Johannes
Höpfner
,
Britta
Mayerhöfer
and
Manfred
Wilhelm
*
,
Johannes
Höpfner
,
Britta
Mayerhöfer
and
Manfred
Wilhelm
*
Karlsruhe Institute of Technology (KIT), Institute for Chemical Technology and Polymer Chemistry, Engesserstraße 18, 76131 Karlsruhe, Germany. E-mail: manfred.wilhelm@kit.edu; Tel: +49 721 608 43150
First published on 9th April 2019
Abstract
The development of sophisticated synthetic routes for polymeric materials and more complex formulations used in current products require more advanced analytical techniques. As simple 1D experiments do not suffice to provide the necessary information. The development of coupled techniques, especially liquid chromatography (LC) in conjunction with molecular spectroscopy, is one promising approach to fit these requirements. The focus of this article is the optimization of a medium resolution (MR), benchtop 1H-NMR spectrometer coupled to a SEC instrument, where the NMR acts as an on-line chemical selective detector. The approach is to retain typical SEC selectivity while obtaining NMR on-line data with the highest possible sensitivity through full optimization of the entire set-up, pulse sequence and numerical data evaluation. A detailed description will be provided on how each part has been improved, including instrumental demands e.g. custom designed flow cells. Application examples of a PS/PMMA blend and PS-b-PMMA block copolymer are given to illustrate the potential of the hyphenated technique and the necessity of optimization. It is shown that the MR-NMR can be successfully hyphenated to SEC as an information rich chemical detector, providing the average chemical composition (CC) as a function of molar mass distribution (MMD), for polymers at isocratic mobile phase conditions.
Introduction
The on-line coupling of chromatographic methods to spectroscopy techniques, also known as hyphenated techniques,1,2 has shown great potential for the analysis of complex samples displaying a non-uniform distribution of chemical composition. Among these hyphenated techniques, liquid chromatography coupled to Fourier transform infrared- (FT-IR), quantum cascade laser- (QCL) and NMR-spectroscopy (LC-IR/QCL/NMR), are versatile and powerful combinations.1,3,4 High performance liquid chromatography (HPLC) has become a powerful analytical tool for the separation of compounds since its introduction in the 1960s.5 HPLC consists of three main modes of separation, namely (1) liquid adsorption chromatography (LAC), (2) liquid chromatography at critical conditions (LC-CC) and (3) size exclusion chromatography (SEC). SEC is the most widely employed technique for the analysis of molar mass distribution (MMD) of polymeric materials and is of high value since molar mass information generally has a direct correlation to the final mechanical properties. However, for the molecular analysis of polymeric materials there are three main characteristics to consider: (1) molar mass distribution (MMD), (2) chemical composition (CC) and (3) topology, facilitating the need for 2D (or even 3D) analysis (Fig. 1).3 As the MMD is quantified by SEC, the chemical composition can be recorded using spectroscopic techniques, where infrared spectroscopy (IR), mass spectrometry (MS) and nuclear magnetic resonance spectroscopy (NMR) are among the most sought after methods.6 Due to ever-evolving application requirements, polymeric materials are no longer just simple linear homo-polymers but are often functional polymers consisting of different topologies such as branched systems and/or different monomer units as either copolymers or polymer blends, resulting in complex polymeric mixtures. There is always a distribution with respect to the three main polymer characteristics e.g. molar mass, chemical composition and topology as there are no perfect polymer synthesis routes, unlike e.g. protein synthesis in nature. The measurement of single or all characteristics in individual, uncorrelated experiments, is not always sufficient in providing a complete picture of the material. To obtain a more in-depth understanding of the molecular characteristics, correlated techniques are required.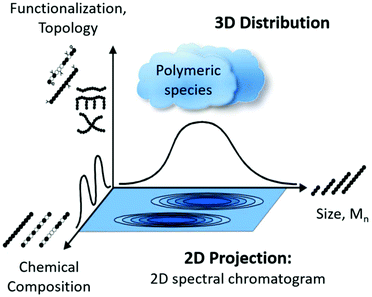 | ||
| Fig. 1 Illustration of the distribution of the three important molecular characteristics of a polymeric material in 3D space projected as a 2D spectral chromatogram, reproduced with permission from Polymer Chemistry from ref. 3. | ||
The on-line hyphenation of NMR with liquid chromatography (LC) has been reviewed7,8 and the technique applied to homopolymers,9,10 and copolymers.11–14 The use of high field (HF) NMR spectrometers (e.g. magnetic field strength, B0 = 7–21 T, 300–900 MHz, 1H) is the method of choice for on-line analysis due to the inherent problem associated to both NMR and SEC. In general, NMR is lacking sensitivity, while providing superior selectivity, compared to other techniques,15 and requires relatively large sample concentrations. For LC-NMR the detection sensitivity can be improved by sample concentration, i.e. to reach the highest possible sample concentration in a minimum volume.10,15 Furthermore, the signal-to-noise (S/N) ratio of an NMR spectrum is directly related to the magnetic field strength (B0), where S/N scales approximately as B0 raised to 1.5.15 High fields have been the hallmark of LC-NMR couplings and the sensitivity is generally the main obstacle to overcome using low- to medium-field (e.g. B0 = 0.5–1.5 T, 20–60 MHz, 1H) magnets. As a result, the general trend is to use high field magnets (400 MHz or higher).11,12,16–19 The drawbacks of employing high field instruments are that they are costly in acquisition and operation and normally require a vast amount of experience, making it a less feasible option for industry and non-dedicated NMR research groups. Although NMR is able to determine the composition of a copolymer fraction (independent of its molar mass value), it can also provide reliable molar mass estimates via end-group analysis of up to 20![[thin space (1/6-em)]](https://www.rsc.org/images/entities/char_2009.gif) 000 g mol−1.20,21 Furthermore, the hyphenation to SEC results in the reduction of sample concentration after chromatographic separation, with the intrinsic drawback that SEC has a restriction to the maximum possible injected analyte concentration. Due to the separation mechanism, SEC columns can only separate dilute solutions without losing the integrity of the chromatographic separation. For analytical (typically 300 × 8 mm internal diameter, i.d.) and semi-preparative SEC columns (typically 300 × 20 mm i.d.) injected sample concentrations of 1 g L−1 and 3 g L−1 (with 80 and 500 μL injection volumes), respectively, are typically used. As a result, the solvent-to-analyte ratio is in favor of the solvent by typically a factor of 1000, resulting in a substantial unwanted solvent signals measured by the spectrometer in case protonated solvents are used. The conventional way of overcoming such a problem, was to perform a two-step analytical process, where the fractionation was performed via SEC followed by the evaporation of the solvent, demonstrated for the combination with IR spectroscopy.7,8 The principle of solvent evaporation is also exploited in HPLC electro spray ionization-mass spectrometry (ESI-MS), but is limited to the lower molar mass end (<5000 g mol−1) of polymers.3,22 It also has the drawback of producing complex mass spectra, making data evaluation challenging. The second approach is to use so-called ‘spectroscopic-transparent’ solvents, for example in NMR, the use of deuterated solvents is a possibility for the on-line hyphenation of SEC to NMR. However, the use of deuterated solvents is not an economically viable option as these solvents are generally expensive and, therefore, are not suitable for routine analysis. Deuterated solvents are normally ‘contaminated’ with small amounts of protonated solvents, which may cause false-positive results if they overlap with polymer signals. Nevertheless, the hyphenation of high field10–12 and low field (based on permanent magnets with low S/N)13,14 NMR has been successfully attempted.
000 g mol−1.20,21 Furthermore, the hyphenation to SEC results in the reduction of sample concentration after chromatographic separation, with the intrinsic drawback that SEC has a restriction to the maximum possible injected analyte concentration. Due to the separation mechanism, SEC columns can only separate dilute solutions without losing the integrity of the chromatographic separation. For analytical (typically 300 × 8 mm internal diameter, i.d.) and semi-preparative SEC columns (typically 300 × 20 mm i.d.) injected sample concentrations of 1 g L−1 and 3 g L−1 (with 80 and 500 μL injection volumes), respectively, are typically used. As a result, the solvent-to-analyte ratio is in favor of the solvent by typically a factor of 1000, resulting in a substantial unwanted solvent signals measured by the spectrometer in case protonated solvents are used. The conventional way of overcoming such a problem, was to perform a two-step analytical process, where the fractionation was performed via SEC followed by the evaporation of the solvent, demonstrated for the combination with IR spectroscopy.7,8 The principle of solvent evaporation is also exploited in HPLC electro spray ionization-mass spectrometry (ESI-MS), but is limited to the lower molar mass end (<5000 g mol−1) of polymers.3,22 It also has the drawback of producing complex mass spectra, making data evaluation challenging. The second approach is to use so-called ‘spectroscopic-transparent’ solvents, for example in NMR, the use of deuterated solvents is a possibility for the on-line hyphenation of SEC to NMR. However, the use of deuterated solvents is not an economically viable option as these solvents are generally expensive and, therefore, are not suitable for routine analysis. Deuterated solvents are normally ‘contaminated’ with small amounts of protonated solvents, which may cause false-positive results if they overlap with polymer signals. Nevertheless, the hyphenation of high field10–12 and low field (based on permanent magnets with low S/N)13,14 NMR has been successfully attempted.
The high selectivity of NMR spectroscopy, resulting in the elucidation of molecular-level structural information, has an advantage over other common LC detectors. The first reported on-line HPLC-NMR measurement recorded was by Watanabe and Niki in 1978,23 where isomeric dimethylphenols were investigated using a 60 MHz spectrometer, in a stop-flow NMR experiment. The first recorded continuous-flow experiment was reported by Bayer et al. in 1979.24 The following technical aspects have contributed to the improvement of the SEC-NMR: (1) low sensitivity is tackled using ultrahigh-field NMR spectrometers (>600 MHz for proton nuclei). (2) The use of deuterated solvents, especially for on-line hyphenation was attempted, but not broadly used.25,26 Furthermore, protonated solvents also overlap with regions of interest in polymer analysis. The use of protonated solvents is more accessible to use due to effective solvent signal suppression techniques using frequency selective pulses.27,28 (3) The optimization of on-line flow cells for dedicated LC-NMR probes have made on-line hyphenation more sensitive. (4) Improvements in computing power has enabled the handling of large LC-NMR data sets by sophisticated software and operating systems, which was once not possible.
In this publication, the optimization of a MR-NMR spectrometer (62 MHz carrier frequency, benchtop, 1.45 T, Halbach magnet array) hyphenated to SEC for improved S/N using protonated solvents is presented. The basic idea of this on-line technique was already presented,29 with improved results on work previously conducted in our group on a low field (20 MHz, benchtop) NMR spectrometer.13,14,30 Further optimization with respect to sample concentration, chromatographic columns, flow rates, flow cells, a pulse program (for solvent suppression), the use of a 60 MHz spectrometer and data evaluation will be described in full detail within this article. The main idea is to obtain maximum chemical composition information on the polymer eluent from SEC. In the first dimension, SEC separates the molecules according to their hydrodynamic radius in solution,22,31 from which molar mass and molar mass distributions can be calculated (after appropriate calibration) and in the second dimension 1H-NMR detection provides the corresponding chemical composition of the analyte. Numerical solvent subtraction and data processing of SEC-MR-NMR measurements is performed on an in-house written MATLAB™ script (Time-resolved nuclear Magnetic Detection of Eluates, TMDE).
Experimental section
Materials
Polystyrene (PS) and polymethylmethacrylate (PMMA) calibration standards were used as received from PSS GmbH (Mainz, Germany). The PS calibration standards comprised of the following weight-average molar masses (![[M with combining macron]](https://www.rsc.org/images/entities/i_char_004d_0304.gif) w): 162, 685, 1470, 4700, 9130, 19
w): 162, 685, 1470, 4700, 9130, 19![[thin space (1/6-em)]](https://www.rsc.org/images/entities/char_2009.gif) 600, 34
600, 34![[thin space (1/6-em)]](https://www.rsc.org/images/entities/char_2009.gif) 800, 100
800, 100![[thin space (1/6-em)]](https://www.rsc.org/images/entities/char_2009.gif) 000, 238
000, 238![[thin space (1/6-em)]](https://www.rsc.org/images/entities/char_2009.gif) 000, 526
000, 526![[thin space (1/6-em)]](https://www.rsc.org/images/entities/char_2009.gif) 000, 851
000, 851![[thin space (1/6-em)]](https://www.rsc.org/images/entities/char_2009.gif) 000, 1
000, 1![[thin space (1/6-em)]](https://www.rsc.org/images/entities/char_2009.gif) 800
800![[thin space (1/6-em)]](https://www.rsc.org/images/entities/char_2009.gif) 000 g mol−1. Samples of PS-b-PMMA were synthesized in-house by anionic polymerization. The eluents were SEC-grade chloroform (CHCl3) stabilized with 2-methyl-2-butene, and cyclohexane (C6H12) used as received from VWR chemicals (Bruchsal, Germany). Tetrahydrofuran (THF) multisolvent GPC grade, ACS, stabilized with 250 ppm of butylhydroxytoluol (BHT) used as received from Scharlau GmbH (Hamburg, Germany).
000 g mol−1. Samples of PS-b-PMMA were synthesized in-house by anionic polymerization. The eluents were SEC-grade chloroform (CHCl3) stabilized with 2-methyl-2-butene, and cyclohexane (C6H12) used as received from VWR chemicals (Bruchsal, Germany). Tetrahydrofuran (THF) multisolvent GPC grade, ACS, stabilized with 250 ppm of butylhydroxytoluol (BHT) used as received from Scharlau GmbH (Hamburg, Germany).
Size exclusion chromatography (SEC)
An Agilent 1260 Infinity SEC system (PSS GmbH, Mainz, Germany), consisting of an isocratic pump, in-line degasser, manual injector (Rheodyne 7725i, 100 and 500 μL sample loops, 6 ports) and differential refractive index (DRI) detector was used for the SEC experiments (Fig. 2). The chromatographic separations were performed with a PSS SDV linear M semi-preparative column (300 × 20 mm i.d., 10 μm particle size, mixed bed) and PSS SDV Linear M analytical column (300 × 8 mm i.d., 5 μm particle size, mixed bed). The sample concentration for the SEC-MR-NMR measurements was 4 g L−1 and 1 g L−1 for the semi-preparative and analytical column, respectively (unless otherwise stated). Injection volumes of either 100 or 500 μL were employed [inj. mass = sample conc. × inj. volume]. Measurements were performed in protonated CHCl3 or THF as mobile phase with a volumetric flow rate of 1 mL min−1. Unless otherwise noted, all SEC components were connected by 0.25 mm i.d. polytetrafluoroethylene (PTFE) tubing.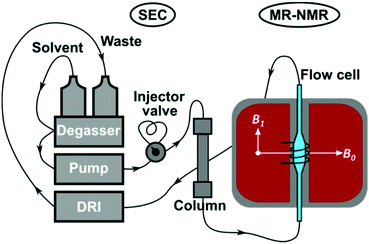 | ||
| Fig. 2 Schematic illustration of the SEC-MR-NMR set-up, comprising of a 62 MHz, 1H-NMR spectrometer, see Fig. 4. | ||
Medium resolution nuclear magnetic resonance (MR-NMR) spectroscopy
The SEC instrument was connected to a medium resolution 62 MHz, 1H (1.45 T) Spinsolve 60 NMR spectrometer (Magritek GmbH, Aachen, Germany) as an additional detector using a flow cell inside the NMR spectrometer, before the DRI detector (Fig. 2). To enable the use of protonated solvents, the instrument is equipped with an external fluorine lock system and allows for freely programmable pulse sequences. The spectrometer uses permanent magnets arranged in the Halbach array set-up with 15 dedicated shims (up to the 3rd order).32 To increase sensitivity it is equipped with a single channel 1H probe head, with the B0 magnetic field oriented perpendicular to the flow (x/y-plane) with a solenoidal radio frequency (rf) coil33 (Fig. 2). The single channel version of the Spinsolve 60 was used in this study due to the factor 2 higher S/N compared to the dual channel one, as indicated by the manufacturer's specification sheets. A typical 1H linewidth for CHCl3 is 0.4–0.5 Hz (full width at half maximum, FWHM, at static conditions) and 12–14 Hz at 0.55% of the peak height.29 Static 1H-NMR spectra were collected using standard 5 mm NMR tubes. Before every injection, the magnet was usually shimmed to a CHCl3 or THF line width of 0.7 Hz or 0.9 Hz (FWHM, on-flow), respectively. Additionally, the B1 frequency was set to the position of the (highest) solvent peak and the receiver phase was adjusted. These settings were then kept constant over the course of the chromatographic run.The pulse sequence shown in Fig. 3 consists of a 90° read pulse (12 μs at full power, 0 dB pulse damping and 100 μs dead time), followed by free induction decay (FID) acquisition (2k points for 409 ms, 200 μs dwell time), and a crusher gradient (20 ms duration at a strength of 5000 a.u. corresponding to a strength of roughly 0.5 mT m−1).29 The final delay is of variable length in the order of 70 ms to adjust the constant time for one cycle to 500 ms. Four scans with phase cycling of 90° pulses were averaged and the results stored as one FID. Consequently, an 85 min sample run consists of 2600 FIDs, with 2k points each (1 FID every 2 s). The first dimension of the data being NMR spectral dimension and the second the SEC elution time (Fig. 1). The pulse sequence works by exploiting the T1-relaxation difference between the polymer and solvent: the polymer relaxes ca. 5–7 times faster than the solvent, based on previous work.29
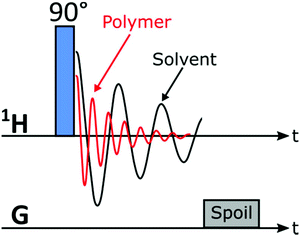 | ||
| Fig. 3 1-Pulse-spoil pulse sequence used to acquire data for SEC-MR-NMR experiments in this work (the linear shim coils were utilized as spoil gradients). | ||
NMR flow cells
The NMR flow cells were custom built in order to optimize sensitivity (S/N) and residence time distribution. The flow cell's volumes were varied between 320–1010 μL, and were built out of Duran glass capillaries. The following geometric factors were varied: length, internal diameter, and the entrance/exit geometry (or shape, Fig. 4). The flow cells had a total length of 500 mm (∼5.0 mm outer diameter), with the internal diameter of the capillaries being either 0.4 or 0.8 mm. The capillaries are widened (2.6, 3.4 or 4.0 mm internal diameter) at the coil region of the NMR, referred to as the active flow cell region, with lengths of either 15 or 45 mm. The transition between the narrow capillaries and the active region consisted of two types of geometries, with and without cones, where the cones have approximately an angle of 30° (Fig. 4). A series of nine different flow cells were compared to a standard flow cell provided by Magritek (Table 1).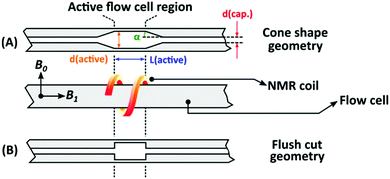 | ||
| Fig. 4 Two types of geometries for the diameter transition tested for the flow cells. (A) Conical shaped- and (B) flush cut geometry. The most important parameters are also listed on the figure as follows; d(cap.) – capillary region diameter, d(active) – active region diameter, L(active) – active region length and α – cone shape angle, see Fig. 2 and Table 1. | ||
| Flow cell | Capillary i.d. [mm] | Entrance/exit shape | NMR-active length [mm] | NMR-active region i.d. [mm] | V active [μL] | V total [μL] | FWHM DRI [min.] | T f DRI [—] | FWHM NMR [Hz] |
|---|---|---|---|---|---|---|---|---|---|
| a The standard Magritek flow cell. b Tailing factor (Tf) = (a + b)/2a, where a and b are the distances in mL of the peak edge relative to the mid-point of the peak at 1/20th of the peak height. c FC9 was found as the best current flow cell for the intended use. | |||||||||
| No FC | — | — | — | — | — | — | 0.05 | 1.06 | — |
| FC1a | 1.0 | Cone | 60 | 4.0 | 628 | 1013 | 0.25 | 3.01 | 7.33 |
| FC2 | 0.8 | No cone | 15 | 2.6 | 80 | 323 | 0.19 | 3.46 | 7.08 |
| FC3 | 0.8 | No cone | 15 | 3.4 | 136 | 380 | 0.19 | 3.12 | 6.89 |
| FC4 | 0.8 | No cone | 15 | 4.0 | 188 | 432 | 0.18 | 3.31 | 7.21 |
| FC5 | 0.8 | No cone | 45 | 4.0 | 565 | 794 | 0.27 | 2.48 | 7.24 |
| FC6 | 0.8 | Cone | 15 | 4.0 | 188 | 450 | 0.17 | 3.73 | 7.16 |
| FC7 | 0.4 | No cone | 15 | 4.0 | 188 | 250 | 0.51 | 1.53 | 7.67 |
| FC8 | 0.4 | No cone | 15 | 3.4 | 136 | 197 | 0.63 | 1.44 | 8.03 |
| FC9c | 0.8 | Cone | 15 | 4.23 | 211 | 496 | 0.08 | 1.63 | 6.87 |
| FC10 | 0.8 | Cone | 18 | 4.24 | 226 | 516 | 0.08 | 3.46 | 6.96 |
Benchmark experiments
As benchmark experiments, to test the residence time of the analyte in each flow cell, a 20 μL solution of a cyclohexane in chloroform (5/95 v/v%) was injecting into the SEC set-up, using chloroform as mobile phase, without any column at a volumetric flow rate of 1 mL min−1. The NMR and DRI data were then recorded over the following five minutes, and a three minute pre-recording for the NMR was also needed, to ensure timely data recording and reproducible results.The following NMR parameters were used: pulse width 90°, dwell time 100 μs, data points 2k, recycle delay 270 ms, number of transients 1 scan per spectrum, number of spectra 1650, conducted at room temperature.
Data evaluation
Data are stored as FIDs during measurement, since timing interferences with the pulse sequence prevent an immediate evaluation. Subsequently, the stored data are evaluated using a custom written MATLAB™ script, Time-resolved nuclear Magnetic Detection of Eluates (TMDE).The evaluation steps are: (1) Fourier transform, (2) apodization (e.g. Gauss) and zero-filling, (3) 0th and 1st order phase correction, (4) smoothing in the SEC dimension (e.g. Gauss), (5) subtraction of a reference spectrum, (6) peak finding, and (7) baseline correction in the SEC dimension (typically a 2nd order polynomial) as detailed previously for the SEC-NMR combination.29 The final step in the script reports, stores, and then visualizes data statistics for each peak. Variants of this evaluation are noted in the main text. Signal-to-noise (S/N) ratios are calculated from the ratio of the maximum peak height of interest (S) to the standard deviation (σ) of the noise (σ = N) in a signal free region (typically −15 to −30 ppm) of the spectrum after conducting the above described sequential corrections.
Numerical solvent suppression
Numerical solvent suppression is conducted in two steps. First, a reference spectrum containing the solvent signal (including trace components in the eluent, e.g. stabilizer) is calculated by averaging the spectra between 5 and 10 min elution time, before sample elution. This reference is subtracted from each spectrum after scaling it so that the highest peak in both spectra match to account for small intensity fluctuations (analog-to-digital converter, ADC, drift). In the second step, an individual second order polynomial is fitted to the baseline between 10 min and the system peak onset at ca. 72 min, excluding the peak region. This baseline is then subtracted from the data to remove drifts in solvent, traces and background noise. These two methods reduce the solvent signal intensity by a factor of ca. 30 and 2, respectively.The analyte peak regions must be identified prior to the second solvent suppression step, this is completed using MATLAB's findpeak function. The number of peaks is limited by a threshold (minimum intensity 6 times noise in peak free region). The area of each peak is computed by searching for the point where the peak intensity has decayed to within noise level in both dimensions. The signal-to-noise ratio of each peak is calculated as the maximum of the peak divided by the standard deviation of the data in the signal free region of the spectrum (e.g. −15 to −30 ppm). The peak shape is quantified by peak full width at half maximum and full width at tailing maximum corresponding to 1/10th of the peak height (FWHM and FWTM respectively).
Results and discussion
Flow cells
Flow cells used in SEC-NMR hyphenation need to fulfil both spectrometric needs (the highest possible signal) as well as chromatographic requirements (retained resolution, i.e. minimal peak broadening) and their optimization is highly important. This required that the volume of the NMR flow cell is as low as possible for minimal peak broadening, but still fulfils long enough residence time for NMR spectroscopy, with the inner geometry being fully optimized to the following conditions. From an NMR perspective the flow cell requirements are as follows; (1) it should be large enough to enable analyte detection, with an increase in volume lowering the resolution on the time axis of an on-line measurement, (2) long enough analyte residence time compared to the recycle delay of the pulse sequence to minimize in- and out-flow effects,27 (3) maximum sample volume in the coil region for highest S/N,34 but this can, to some degree, be offset by optimizing the receiver ADC gain before acquisition. These requirements are imperative as both the volume and the flow cell geometry can lead to artificial peak broadening, e.g. due to excess dead volume or backflow/back mixing. Magritek provides a flow cell which is aimed at reaction monitoring (labelled as FC1 in Table 1), however, the drawback of this flow cell is its large volume (Vtot = 1013 μL), especially when compared to the typical dead volume of a standard DRI detector, which is in the range of 60 μL.3 The main optimal specifications of the flow cell for SEC are the following; (1) should not result in artificial peak broadening, (2) should allow for maximum sample amount being delivered to the NMR and low B0 magnetic field interaction, and (3) should withstand backpressures of at least three bars. A set of nine different flow cells were designed, built and tested to obtain the best compromise between the first two requirements. The results are given in Table 1 together with the standard Magritek flow cell (FC1). The benchmark experimental approach was utilized here to quantify parameters.It was evident that in general, the larger the flow cell the more pronounced was the undesirable peak tailing in the SEC dimension. The FWHM for the NMR was in the same range for all the flow cells, as expected due to strong apodization being employed. Considering the FWHM of the DRI, three distinct groups appeared, (a) FC2–FC6 which all had the same FWHM range as the Magritek flow cell. (b) FC7 and FC8 which had a strongly increased FWHM, due to a reduction in the capillary section of the flow cell to 0.4 mm i.d. This was done to more closely match the PTFE SEC tubing used but has the adverse effect. (c) FC9 and FC10 which consist of the active region with cone shape geometry and 0.80 mm i.d. capillaries, produced improved results with respect to band broadening in both the SEC and NMR dimension. As the smaller capillaries did not match well with the active flow cell region of the flow cell, resulting in the formation of so-called ‘analyte jets’ occurring in the active flow cell region, producing poor results. Therefore, flow cells with capillaries of ≥0.80 mm i.d. are preferred to minimize in- and out-flow effects. It is assumed that the step increase (with respect to i.d.) from the SEC tubing (0.25 mm i.d.) to the capillary region of the flow cell (0.80/1.00 mm i.d.), assisted in minimizing undesired flow effects as the analyte flowed through the larger active region of the flow cell.
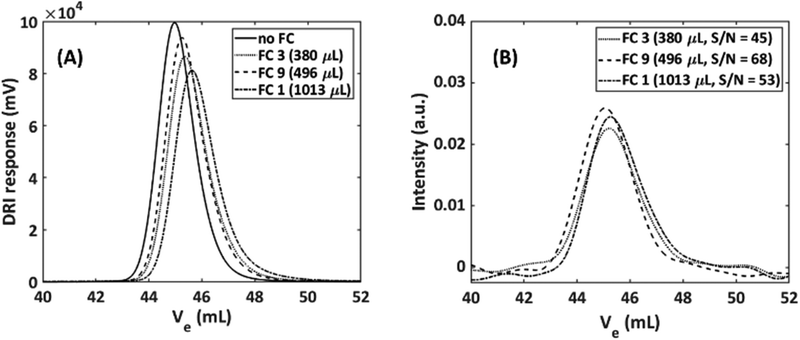
The FWHM in the spectroscopy dimension increased slightly with larger flow cell volumes. This can be attributed to less effective shimming. The S/N is a crucial parameter as there is already a limitation regarding sensitivity, however, it was not used as first estimate for flow cell performance as the results may be misleading due to the nature of the analyte being used in the benchmark experiment. The S/N is not the only parameter that should be considered as the in- and out-flow effects caused by the flow cells is just as important in the SEC-NMR hyphenation. FC9 provided the best compromise between peak broadening in both the chromatographic and spectroscopic dimensions and was a close match to the case where no flow cell is used. FC9 was chosen as the best design for the current application with a factor of 1.5 to 2.1 improvement in S/N depending on the sample dispersity (Đ). It must be noted that due to the lack of a column and differences in the longitudinal relaxation (T1) between polymer and solvent these results are not directly comparable to SEC-NMR experiments where polymeric species are used but provides an optimization mainly in terms of S/N, related to the FWHM. To validate the benchmark experiments, full SEC-NMR experiments were performed using a polystyrene standard (M = 30![[thin space (1/6-em)]](https://www.rsc.org/images/entities/char_2009.gif) 300 g mol−1, Đ = 1.03) in CHCl3. The influence of the total volume and geometry of the flow cell on the SEC peak broadening is illustrated in Fig. 5. The effect of the different flow cells on the SEC traces were compared to the absence of an NMR flow cell, as the best possible case with the set-up.
300 g mol−1, Đ = 1.03) in CHCl3. The influence of the total volume and geometry of the flow cell on the SEC peak broadening is illustrated in Fig. 5. The effect of the different flow cells on the SEC traces were compared to the absence of an NMR flow cell, as the best possible case with the set-up.
The results obtained are a measure of the actual peak broadening because of excess volume and flow behavior in the flow cell. The DRI response shown in Fig. 5(A) shows a clear increase in FWHM and tailing factor as the flow cell volume increases. The geometry with no cones caused more stagnant zones where (a) the analyte never reaches (low S/N) or (b) only slowly diffuse and thereby causing tailing, resulting in unwanted flow effects compared to the conical shaped geometry, which does not cause stagnant zones (Fig. 4). To quantify the peak broadening, the chromatograms were fitted and quantified via a Gaussian function. The signal intensity when compared to no flow cell decreases with 20%, 14% and 6.0% for FC1, FC3 and FC9, respectively. The FWHM increased 9.0%, 8.0% and 3.0% for FC1, FC3 and FC9, respectively. The total injected mass of the PS sample was 1 mg, to illustrate the relationship between the S/N more clearly. There is a 6.0% and 14% reduction in the S/N when using FC1 and FC3, respectively, compared to FC9 (same integral area but lower peak maximum). Furthermore, there is a 16% and 8.0% increase in the FWHM in the spectroscopic dimension compared to FC9 for FC1 and FC3, respectively. As expected, any additional detector leads to an increase in the peak broadening. Initially, the consensus was that a smaller flow cell would be a better compromise between NMR sensitivity, chromatographic resolution and peak broadening. It is clear that, the results followed a different trend and emphasized the importance of the flow cell geometry. The difference between the flow cells were significant for a sample of very narrow Đ, and the increased peak width (3.75%) for the best performing flow cell, FC9, was acceptable considering the accuracy of SEC. For samples with a broader molar mass distribution, e.g. Đ > 1.5, the effect of the flow cell volume and geometry should be less pronounced. In the case of static measurements (no flow), the cell size does not influence the NMR results as severely as in constant flow rate measurements, due to no in- and out-flow effects as well as longer analyte resident times. For constant flow rate measurements, increased peak broadening was accompanied by a decrease in the signal intensity, resulting in a reduction of the S/N. The deviation in the signal intensity is much larger for the NMR signal than for the DRI signal, due to peak broadening resulting in a localized reduction in analyte concentration and should, therefore, be considered when hyphenating SEC with NMR detection. Note, the expected signal loss for a sample with a broad Đ would be less severe than for the sample illustrated here, since the localized concentration of a sample with a broad Đ is considerably less than a sample with a narrow Đ.
Optimization of the SEC conditions
As SEC performs best with dilute polymer concentration, a contrast exists as spectroscopic sensitivity is better at higher concentrations. The limit between overloading and acceptable separation strongly depends on the sample; it is proportional to the concentration and MMD, as well as on the type of column and its pore size distribution. The best combination needs to be established for each hyphenated combination, but approximations for similar samples are possible. Therefore, two examples related to column diameter and loading will be provided.For the first example, the separations were conducted on a semi-preparative (20 mm i.d.) and an analytical (8 mm i.d.) column as comparison. Semi-preparative columns, while allowing a larger injected mass, deliver the same analyte concentration to the detector as an analytical column. The reason for this is that these columns are being operated at a factor 6.25 larger injected mass but also eluent volume. If both columns are run at flow rates that differ by a factor of 6.25, similar S/N in SEC-NMR experiments is found (see caption of Fig. 6). The NMR flow cell affected the peak height and width, resulting in a slight improvement for the semi-preparative column.
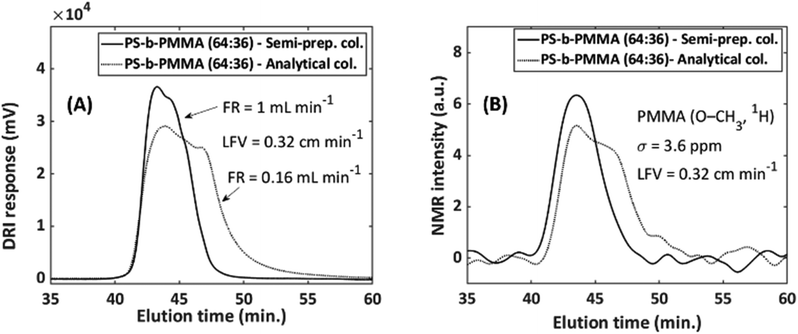 | ||
Fig. 6 Illustration of the effect of column-to-flow-cell mismatch and how it affects both the (A) DRI and (B) NMR signal. PS-b-PMMA (64![[thin space (1/6-em)]](https://www.rsc.org/images/entities/char_2009.gif) : :![[thin space (1/6-em)]](https://www.rsc.org/images/entities/char_2009.gif) 36 mol%, 230 36 mol%, 230![[thin space (1/6-em)]](https://www.rsc.org/images/entities/char_2009.gif) 000 g mol−1, Đ = 1.07), sample conc. = 2 g L−1 with injected volumes of 100 and 500 μL for the analytical and semi-preparative columns, respectively. This equates to an injected sample mass of 0.2 mg and 1 mg for the analytical and semi-preparative columns, respectively. FC9, with a total volume of 496 μL was employed (see Table 1). The S/N for the analytical and semi-preparative columns were 21.3 and 25.8, respectively. Where the FWHM were 6.02 min and 3.85 min in the SEC dimension and 5.5 Hz and 3.6 Hz in the spectroscopy dimension for the analytical and semi-preparative columns, respectively. 000 g mol−1, Đ = 1.07), sample conc. = 2 g L−1 with injected volumes of 100 and 500 μL for the analytical and semi-preparative columns, respectively. This equates to an injected sample mass of 0.2 mg and 1 mg for the analytical and semi-preparative columns, respectively. FC9, with a total volume of 496 μL was employed (see Table 1). The S/N for the analytical and semi-preparative columns were 21.3 and 25.8, respectively. Where the FWHM were 6.02 min and 3.85 min in the SEC dimension and 5.5 Hz and 3.6 Hz in the spectroscopy dimension for the analytical and semi-preparative columns, respectively. | ||
The main advantage of using a semi-preparative column, is the use of larger eluent volumes (factor 6.25). This is beneficial regarding the flow cell, since the NMR flow cell volume is much lower compared to the peak width. The custom build flow cells have a total volume ranging from ∼320–1020 μL, which corresponds to a detection cell of 50–161 μL for analytical columns (factor 6.25 smaller), which is in the range of the volume of standard SEC detectors (e.g. VDRI = 60 μL). Therefore, while the size of the flow cell volume for the NMR matches well with the size of the semi-preparative columns, it would be at the limit for the analytical columns.
To show this, a PS-b-PMMA (64/36 mol%, Mn = 230![[thin space (1/6-em)]](https://www.rsc.org/images/entities/char_2009.gif) 000 g mol−1, Đ = 1.07) with a concentration of 2 g L−1 was measured on both the analytical and semi-preparative columns using chloroform as solvent and an NMR flow cell with a volume of 496 μL (FC9, Table 1). The injection volume was 100 μL and 500 μL for the analytical and semi-preparative column, respectively. It was only possible to have a factor 5 difference with respect to injected volume, as this limit was imposed by the available injection loops. Nonetheless, the effect of the volume size difference of the analyte band will still be signified considerably. The flow rate was selected in such a way that the linear flow velocity (LFV, inside the column) is equal to 0.32 cm min−1 for both columns (FR = 1 mL min−1, semi-preparative column and 0.16 mL min−1, analytical column), the flow velocity within the active region of the flow cell will be slower. Fig. 6 illustrates how the column-to-flow-cell mismatch affects both the DRI and NMR traces.
000 g mol−1, Đ = 1.07) with a concentration of 2 g L−1 was measured on both the analytical and semi-preparative columns using chloroform as solvent and an NMR flow cell with a volume of 496 μL (FC9, Table 1). The injection volume was 100 μL and 500 μL for the analytical and semi-preparative column, respectively. It was only possible to have a factor 5 difference with respect to injected volume, as this limit was imposed by the available injection loops. Nonetheless, the effect of the volume size difference of the analyte band will still be signified considerably. The flow rate was selected in such a way that the linear flow velocity (LFV, inside the column) is equal to 0.32 cm min−1 for both columns (FR = 1 mL min−1, semi-preparative column and 0.16 mL min−1, analytical column), the flow velocity within the active region of the flow cell will be slower. Fig. 6 illustrates how the column-to-flow-cell mismatch affects both the DRI and NMR traces.
The semi-preparative column provides a better match to the NMR flow cell, due to improved performance over the analytical column with respect to the peak height and peak width (FWHM). This is due to the analytical column having an analyte band with less volume than the semi-preparative column. When this small analyte band31 from the SEC column passes through the NMR flow cell, which has a much larger volume, band broadening occurs, which is happening on a volume scale and not a time scale, the peaks have the same elution time but with more severe band broadening for the analytical column. SEC statistics such as the number of theoretical plates, asymmetric factor and tailing factor, were calculated from the DRI traces. The number of theoretical plates increased by 67% on the semi-preparative column, with a reduction of 14% and 28% in the asymmetry and tailing factor, respectively, when compared to the analytical column.31 The latter is valid for the combination of the column and flow cell under these specific conditions. These factors lead to an increase in signal height of 27% for the semi-preparative column. Therefore, the semi-preparative column was chosen as the column of choice when working with larger flow cell volumes, to avoid a column-to-flow-cell mismatch. The use of the semi-preparative column resulted in an improvement of a factor 1.5 in S/N.
In the hyphenation of SEC with NMR, sample concentration is an essential part of the analysis, since larger signals and improved S/N can be achieved by increasing the sample concentration or injected volume. In the case of NMR spectroscopy (or any other spectroscopic technique), ideally, the largest possible sample concentration should be used as this would increase the S/N ratio (almost linearly as a function of concentration).15,34 However, this is not the case for SEC, since larger sample concentrations prohibit accurate molar mass determination. Since two different techniques are combined with each other, it is of importance that an optimized compromise with respect to sample concentration is established. It is further important to note that the optimum concentration and injection volume is highly sample depended. First, the molar mass of the sample needs to be considered. A too high sample concentration of a high molar mass species will lead to a viscous injection band, which in turn will hinder the diffusion process in the column due to stationary phase overloading. This generally result in a shift to higher elution volumes, yielding in lower measured molar masses (and increased dispersities) when a conventional calibration curve is utilized, as has been described by Striegel et al.31 As a second point, the optimum concentration also varies for broadly distributed (e.g. industrial samples) and narrowly distributed samples (e.g. reference standards), since the localized concentration in the column is generally lower for broadly distributed samples and overloading or viscous fingering22,31,35 happens at much higher concentrations. Generally, the injected mass can be higher for low molecular weight and broadly distributed samples.
The injected mass affects both the elution volume (peak position) and the peak shape. To establish the optimum concentration for a given sample, at a specific injection volume, the sample concentration should be lowered until the peak position and shape remain constant. Only the peak area should change as a function of the injected mass or concentration. If the detector signal becomes too small because of the low concentration, the injected volume should be increased.22,31,36
Therefore, there is no universal limit before column overloading occurs. To obtain the best S/N for a specific sample on a hyphenated technique, the best method for determining the overloading limit can be conducted with the aid of a concentration series, see Fig. 8 in ref. 3. In the present study investigations with such a concentration series were conducted to obtain the overloading limit of the column. Two PS standards, narrow and broad dispersity indexes (Đ), were measured with SEC and a DRI detector. It was found that 4 mg (Đ = 1.03) and 10 mg (Đ = 1.65) injected mass were the upper limit for the narrowly and broadly distributed samples, respectively. It should be noted that the values given here can only be used as guideline, as these upper limit values are sample dependent. However, by performing measurements at or close to the overloading limit an improvement in S/N of a factor 2 was obtained within this work.
Flow rate and flow cell position
Another factor to quantify peak quality and separation in chromatography is the linear flow velocity of the mobile phase. According to the well-known Van Deemter equation36,37 an optimal flow rate exists for chromatography to achieve the highest possible resolution (i.e. separation efficiency). However, SEC resolution is less affected if compared to liquid adsorption chromatography (LAC) by using low flow rates.22,31 Therefore, lower flow rates in SEC should be exploited for NMR, as this would enable longer residence times (RT) inside the NMR flow cell, reduced in- and out-flow effects, higher S/N, and improved resolution and solvent suppression.In general, the NMR detection coil covers an active volume of 60–120 μL. Depending on the flow rate (linear velocity) employed, the analyte usually remains only for a small period (<30 s) within this active volume.
In the on-line SEC-NMR measurements, the NMR peak broadening depends on the flow rate. The effect of flow rate on the S/N ratios are summarized in Table 2 as examined by the benchmark experiment using FC3, as the same trend is true for all flow cells. The resolution of the spectrum decreased almost by a factor 1.3 after the onset of constant flow rate measurements and then decreased slightly as the flow rate increased up to 1 mL min−1, followed by an increased broadening of the peak at flow rates exceeding 1 mL min−1. The S/N ratio of the resonance decreased as a function of increased flow rate, due to the reduction in the residence time of the sample within the NMR active region of the flow cell before signal detection as well as a reduction in the pre-polarization. At flow rates >1 mL min−1, the S/N decreases to ca. 1/5th that of that in a static measurement, mainly due to insufficient pre-magnetization of the sample.
| Flow rate [mL min−1] | RTTheo![[thin space (1/6-em)]](https://www.rsc.org/images/entities/char_2009.gif) a [s] a [s] |
RTExp![[thin space (1/6-em)]](https://www.rsc.org/images/entities/char_2009.gif) b [s] b [s] |
FWHMc [Hz] | S/Nd (δ = 1.43 ppm) |
|---|---|---|---|---|
| a Residence time (theoretical) [= (detection volume)/(flow rate)]. b Residence time as determined experimentally by calculating the time difference between the peak start and end. c Full width at half maximum in the NMR dimension. d Signal-to-noise ratio in the NMR dimension. | ||||
| 0.0 | ∞ | ∞ | 2.36 | 273.3 |
| 0.1 | 81.6 | 60.0 | 4.43 | 214.8 |
| 0.2 | 40.8 | 34.2 | 4.29 | 194.5 |
| 0.5 | 16.3 | 24.6 | 4.19 | 179.8 |
| 1.0 | 8.16 | 17.4 | 4.45 | 179.7 |
| 2.0 | 4.08 | 7.80 | 6.02 | 48.9 |
As illustrated, the geometry of the flow cell plays a pivotal role in the S/N values obtained for each flow cell, mainly due to flow effects. Ideally, a plug flow of the analyte would be preferred with no stagnant zones in the flow cell, since the analyte would then pass the NMR coil in a more homogenous fashion, resulting in better resolution. However, due to the flow cell geometries, obtaining a plug flow is a highly improbable scenario. A laminar flow profile, however, would minimize in- and out-flow effects. A stable flow profile develops after some time in active flow cell region, due to the analyte and solvent moving through the capillary region as a step function, e.g. from smaller i.d. tubing after the capillary diameter changes and should be different at different positions in the active area of the flow cell.
Therefore, the effect of the position of the flow cell relative to the NMR coil was investigated for the optimum flow cell FC9, see Table 1. The mid-point of the flow cell was taken as the reference point of the measurements. The flow cell was then moved in 1 mm increments up and down relative to the coil, by first performing shims followed by an on-line measurement without a SEC column and then SEC-NMR measurements at both the optimum and midpoints as determined by the first test. For the first tests, the NMR magnets were shimmed at each incremental position under flow with a stock solution of PMMA (Mn = 38![[thin space (1/6-em)]](https://www.rsc.org/images/entities/char_2009.gif) 100 g mol−1, conc. = 2 g L−1) continuously pumped through the NMR spectrometer, followed by an on-line NMR measurement at each increment. The S/N and FWHM of the –OCH3 peak (PMMA) was recorded to quantify the effect of the flow cell position. To determine if the optimum position (i.e. highest S/N and lowest FWHM) out performs the midpoint position, a PMMA standard was analyzed, with the SEC column connected, to evaluate the effect. It was found that the S/N decreases significantly at the entrance and exit part of the flow cells. These effects can be attributed to two main reasons: (1) inhomogeneity in the glass at the entrance and exit positions of the flow cells accompanied by possible magnetic susceptibility, and (2) magnetic field distortions, which smear out the NMR lines, consequently reducing S/N and possibly change their shape, too. However, the overall improvement of the S/N at the optimum S/N position compared to the midpoint position had no overall improvement in a SEC-NMR measurement. For the –OCH3 peak a slightly higher S/N = 160 was achieved at the midpoint compared to an S/N value of 157 at the optimum position. At the aliphatic –CH2– peaks (S/Nopt = 38.0, S/Nmid = 37.7) and α-CH3 peaks (S/Nopt = 61.7, S/Nmid = 56.7) the S/N value at the optimum position improved slightly over that of the midpoint position. The midpoint position is an acceptable compromise between the best S/N and reproducibility. Since the flow cell inner geometry would vary from manufacturer to manufacturer, so would the optimum point for the flow cell position. This might require a new investigation for every flow cell. Thus, the flow cell position relative to the coil is still subject to further investigations.
100 g mol−1, conc. = 2 g L−1) continuously pumped through the NMR spectrometer, followed by an on-line NMR measurement at each increment. The S/N and FWHM of the –OCH3 peak (PMMA) was recorded to quantify the effect of the flow cell position. To determine if the optimum position (i.e. highest S/N and lowest FWHM) out performs the midpoint position, a PMMA standard was analyzed, with the SEC column connected, to evaluate the effect. It was found that the S/N decreases significantly at the entrance and exit part of the flow cells. These effects can be attributed to two main reasons: (1) inhomogeneity in the glass at the entrance and exit positions of the flow cells accompanied by possible magnetic susceptibility, and (2) magnetic field distortions, which smear out the NMR lines, consequently reducing S/N and possibly change their shape, too. However, the overall improvement of the S/N at the optimum S/N position compared to the midpoint position had no overall improvement in a SEC-NMR measurement. For the –OCH3 peak a slightly higher S/N = 160 was achieved at the midpoint compared to an S/N value of 157 at the optimum position. At the aliphatic –CH2– peaks (S/Nopt = 38.0, S/Nmid = 37.7) and α-CH3 peaks (S/Nopt = 61.7, S/Nmid = 56.7) the S/N value at the optimum position improved slightly over that of the midpoint position. The midpoint position is an acceptable compromise between the best S/N and reproducibility. Since the flow cell inner geometry would vary from manufacturer to manufacturer, so would the optimum point for the flow cell position. This might require a new investigation for every flow cell. Thus, the flow cell position relative to the coil is still subject to further investigations.
To further illustrate the effect of the flow rate on the S/N of both the DRI and NMR detector a flow rate comparison was performed at flow rates of 1–4 mL min−1 (0.32–1.3 cm min−1) for a full SEC-NMR experiments, see Fig. 7.
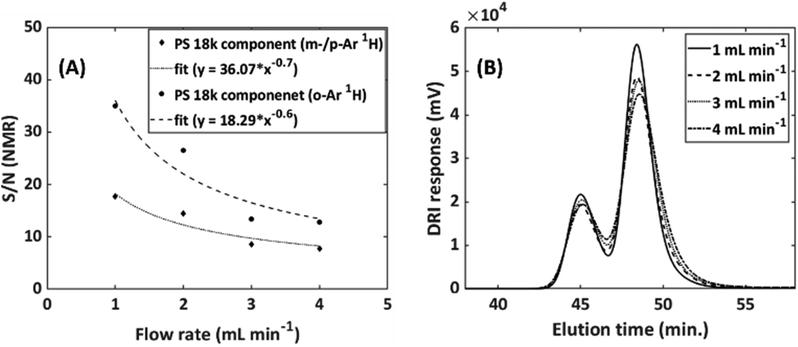 | ||
Fig. 7 Effect of flow rate on both the (A) NMR and (B) DRI response at the peak maximum of a SEC-NMR experiment. Sample: PS/PMMA blend (18![[thin space (1/6-em)]](https://www.rsc.org/images/entities/char_2009.gif) 000/48 000/48![[thin space (1/6-em)]](https://www.rsc.org/images/entities/char_2009.gif) 000 g mol−1), injected volume: 500 μL, NMR analysis only conducted on the PS component, DRI analysis on the entire blend, solvent: THF, flow cell, FC9, see Table 1. The SEC flow rate were limited to not below 1 mL min−1, see text for details. 000 g mol−1), injected volume: 500 μL, NMR analysis only conducted on the PS component, DRI analysis on the entire blend, solvent: THF, flow cell, FC9, see Table 1. The SEC flow rate were limited to not below 1 mL min−1, see text for details. | ||
Both the NMR and DRI responses decrease as a function of increased flow rate. This is due to the shorter residence time within the NMR flow cell, resulting in a reduction in the acquisition time for the specific peak. For the DRI detector, the reduction in signal intensity is due the broadening of the analyte band, as in- and out-flow effects are more severe at higher flow rates for the specific flow cell under investigation. In Fig. 7(A) the results were fitted with an empirical exponential function, to illustrate the reduction. In eqn (1) the idea of the relation between the flow rate and the S/N is presented.
 | (1) |
![[v with combining dot above]](https://www.rsc.org/images/entities/i_char_0076_0307.gif) the volumetric flow rate. A more in-depth view of this pre-diction would have to consider the influence of the recycle delay on the solvent suppression and amount of total noise, which was not further investigated in this work.
the volumetric flow rate. A more in-depth view of this pre-diction would have to consider the influence of the recycle delay on the solvent suppression and amount of total noise, which was not further investigated in this work.
The scattering is indicative of the variations in the flow profile in the flow cell. The flow profile is an important factor in obtaining good S/N, since it dictates how much of the sample passes by the NMR coil per time unit. Furthermore, if jets were formed within the active region of the flow cell this would also reduce the S/N. Since a reduced flow rate increased the quality of the NMR spectra and did not affect the SEC resolution and is still within acceptable measurement time, a flow rate of 1 mL min−1 was selected for SEC-NMR hyphenation. Furthermore, operating at ![[v with combining dot above]](https://www.rsc.org/images/entities/i_char_0076_0307.gif) = 1 mL min−1 compared to
= 1 mL min−1 compared to ![[v with combining dot above]](https://www.rsc.org/images/entities/i_char_0076_0307.gif) = 4 mL min−1 had an increase of a factor 2.3 in S/N.
= 4 mL min−1 had an increase of a factor 2.3 in S/N.
Optimization of NMR data acquisition
To improve NMR sensitivity in the most efficient way is to increase the number of scans of the recorded spectra as the , where n is the number of averaged transients. However, fast repetition (time between the start of two scans) implies recording shorter FIDs and decreases NMR selectivity. Hence, selectivity and sensitivity must always be viewed together.38,39
The pulse sequence including variable pulses and waiting time is fixed for a given case. The 1-Pulse-spoil (Fig. 3) sequence is the shortest NMR sequence possible; all other solvent suppression techniques have much longer pulse trains. Shortening the FID acquisition results in both reduced selectivity which can only partially be recovered by zero filling or an appropriate apodization function, and a large residual magnetization in the x/y-plane after the end of acquisition. Therefore, a crusher gradient from the shim coils is needed to dephase the remaining coherences. The effect of the crusher gradient is not visible in an individual spectrum but over the course of a SEC-NMR experiment, mainly the solvent signal fluctuations lead to strong solvent peak distortions. A final but possibly not reproducible waiting period is needed for data transfer and storage and is hardware dependent. The waiting time should be as short as possible to allow fast cycling and solvent suppression (see below) but this distorts the analyte signal intensities due to non-complete relaxation for each resonance with potentially different T1 times, typically a factor 5 difference between solvent and analyte.19
The effect of decreasing the repetition time was investigated by a series of SEC-NMR experiments of PMMA (Mn = 31![[thin space (1/6-em)]](https://www.rsc.org/images/entities/char_2009.gif) 000 g mol−1, Đ = 1.08) in CHCl3 with constant SEC parameters where the S/N and the width of the peaks were recorded (Fig. 8). The expected trend shows a strong increase of S/N with shorter repetition times while the peak width is also increasing but by a lower factor. This is much more pronounced for the solvent peak than for the analyte peaks as these are already broadened by the isotropic dispersion of chemical shifts. As the focus is on the analysis of polymers, typically the use of a short repetition time of 0.5 s as NMR peak broadening is the smaller concern, and amounts to an improvement factor of 1.12 in S/N.
000 g mol−1, Đ = 1.08) in CHCl3 with constant SEC parameters where the S/N and the width of the peaks were recorded (Fig. 8). The expected trend shows a strong increase of S/N with shorter repetition times while the peak width is also increasing but by a lower factor. This is much more pronounced for the solvent peak than for the analyte peaks as these are already broadened by the isotropic dispersion of chemical shifts. As the focus is on the analysis of polymers, typically the use of a short repetition time of 0.5 s as NMR peak broadening is the smaller concern, and amounts to an improvement factor of 1.12 in S/N.
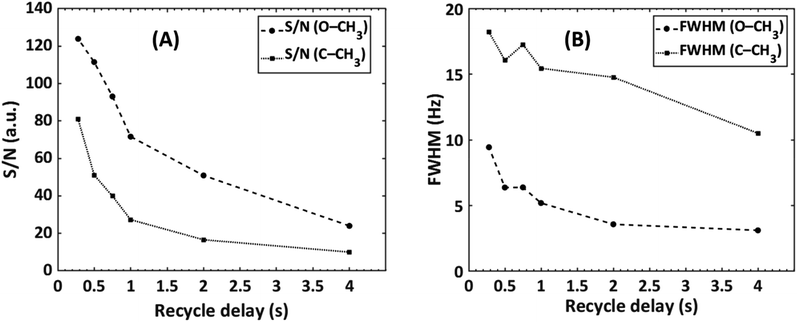 | ||
Fig. 8 The effect of recycle delay on the (A) S/N and (B) full width at half maximum of a PMMA sample (Mn = 31![[thin space (1/6-em)]](https://www.rsc.org/images/entities/char_2009.gif) 000 g mol−1, Đ = 1.08), looking at the –OCH3 (δ = 3.58 ppm) and α-CH3 (δ = 0.85 ppm) NMR peaks, see Fig. 3. 000 g mol−1, Đ = 1.08), looking at the –OCH3 (δ = 3.58 ppm) and α-CH3 (δ = 0.85 ppm) NMR peaks, see Fig. 3. | ||
As a second parameter, the receiver gain was adjusted to match the FID intensity to the ADC window (16 bit) after the first solvent suppression. The resulting S/N as a function of gain in static and SEC-NMR experiments is shown in Fig. 9.
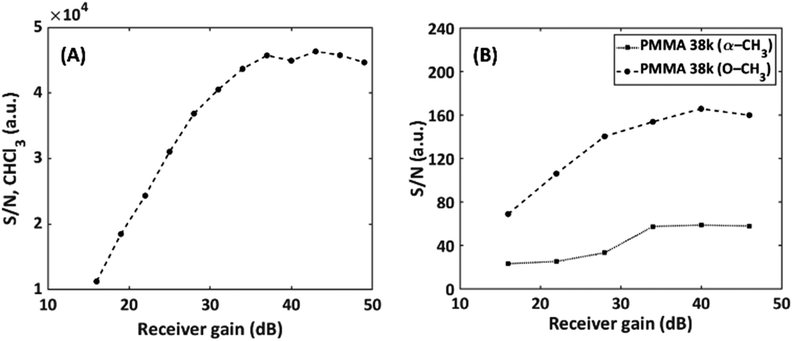 | ||
Fig. 9 Effect of the receiver gain on S/N on (A) static measurements of CHCl3 and (B) on-flow SEC-NMR measurements of a PMMA (Mn = 38![[thin space (1/6-em)]](https://www.rsc.org/images/entities/char_2009.gif) 100 g mol−1, Đ = 1.06) sample. 100 g mol−1, Đ = 1.06) sample. | ||
The S/N increased strongly up to a value of about 35 dB in both cases, after this no pronounced effect is observed before overloading occurs and the obtained spectra are severely distorted. It is recommended measuring above a gain of 35 dB for this specific instrument. Operating the instrument above 35 dB result in an increased S/N by a factor of 1.2 compared to the previous standard receiver gain setting of 28 dB. It is worth mentioning that this depends on spectrometer electronics. This parameter and the interplay with solvent suppression pulse sequences using gradients will be detailed in a forthcoming publication. Furthermore, phase cycling was also explored, to determine whether the removal of unwanted coherent signals in the NMR experiments would assist in reducing noise and avoid artifacts from an ADC zero point off-set and as a result increase the S/N value. It was found that the phase cycling improved the S/N by a factor of 1.03, which is not significant, however, is useful in the SEC dimension for noise reduction.
Solvent suppression by pulse sequence
The solvent suppression within the 1-pulse-spoil sequence exploits the large T1 difference between the solvent and analyte molecules, which in SEC are typical high molar mass polymers with low T1 relaxation times.30 When a 90° pulse is used, the residence time must be ca. 5 times larger than the longest T1 for a quantitative determination.40 This T1 filter works with two effects. First, the pre-magnetization of the solvent is reduced due to the fast transport into the active region by the capillary part of the flow cell. Therefore, small flow cells without pre-magnetization regions are used (NMR flow cells). Secondly, the fast repetition of the scans leaves the solvent in a high degree of saturation, whereas the polymer can relax to a large degree (suppression factors 5–7). Additionally, the solvent is degassed through the SEC system, which minimizes molecular oxygen from the air, a paramagnetic material which significantly contributes to the relaxation of protons. With the degassing of the solvent, it further assists in exploiting the T1 difference between the solvent and the polymer, allowing for more efficient solvent suppression. A working hypothesis is that the remaining solvent signal arises mostly by the in-flow of new solvent, as the solvent remaining in the flow cell is magnetically saturated.Obviously, the approach is limited to cases with large T1 differences, with respect to the spectral density, between solvent and analyte of high molar mass polymers in low molar mass solvents e.g. SEC-NMR and not HPLC-NMR for most cases. A second drawback is the suppression efficiency via fast repetition is linked to the accessible resolution by acquisition time, which cannot be varied independently, due to distortions of the spectra by T1 weighing.
Optimization of data evaluation
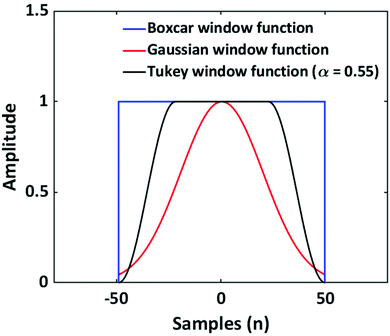
As discussed, the S/N of the analyte's NMR signals is a major challenge. Therefore, a great emphasis was put on filtering the SEC-NMR data in both dimensions (Fig. 1). The filtering is done independently in both dimensions and at different stages of the work flow. Here, we discuss first the filtering along the SEC dimension.Smoothing/filtering generally improves S/N but frequently (not always) increases the peak width. As such, the objective is achieving a maximum S/N while keeping the peak width within a certain threshold. We define arbitrarily a threshold of 10% increase in peak FWHM (in SEC dimension) by filtering as acceptable within this work to compare the effect of different filters. Three different filters were tested on SEC-NMR data by choosing a spectral resonance (PMMA/CHCl3, –OCH3, δ = 3.58 ppm) and applying them along the time dimension of the measurement: (a) boxcar averaging and fast Fourier transform (FFT) filtering with a (b) Gaussian and (c) Tukey window function, see Fig. 10.41–43 For the boxcar average of width N, at one-point n data points around  the current data point are averaged with the same weight to obtain the averaged data point. Then, the box of averaging is moved to the next point in line and the process is repeated. Increasing n leads to stronger smoothing. For the FFT filtering, the data is folded with either a Gaussian or Tapered Cosine (Tukey) window function as defined in eqn (2) and (3), respectively.42,43
 | (2) |
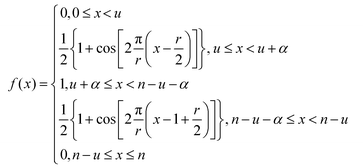 | (3) |
 . The Gaussian window has one free parameter the standard deviation, σ, defining the width of the function. Increasing σ leads to stronger smoothing. The Tukey window, while numerically complex, is based on the straight forward idea of replacing the flanks in a box window in a smooth way by half sides of a cosine function. The Tukey function has two free parameters, L and α, where L controls the base width of the window and α the amount of tapering, i.e. the cosine contribution to the flanks, where n is the number of points in the smoothed data set. The smoothing strength increases with L and α increases the smoothing as well but also introduces wiggles into the result and needs to be fine-tuned for the application.
The addressed window functions are applied to SEC-NMR data of a PMMA calibration standard (Mn = 30![[thin space (1/6-em)]](https://www.rsc.org/images/entities/char_2009.gif) 000 g mol−1, Đ = 1.06) in CHCl3. The peak under investigation is the –OCH3 resonance at 3.6 ppm, it was chosen as this peak is among the narrowest ones found in polymers and the influence of filtering on such a peak is most severe. Additionally, this peak is strong and well separated making S/N and FWHM calculation straight forward and reliable. The results are shown in Fig. 11. The characteristic function of a smoothing algorithm is obtained by varying the free parameter for each smoothing function (L and α in the case of the Tukey window) and recording S/N and FWHM. In general, each increase in S/N leads to an undesired increase in FWHM. For the Tukey window the results of three fixed values of α are shown. The characteristic function of the boxcar average is almost linear, while it is curved for the Gaussian and Tukey window; a lower α leads to stronger curving. With respect to the defined criterion of a 10% increase in width, see wide dashed line in Fig. 11, the boxcar average shows the least S/N improvement. The Gaussian window is slightly better, while the best results are found for the Tukey function dependent on the α-value chosen, where an α-value of 0.55 is the best for the current application. The lower the α the better S/N at the given FWHM. However, in the same direction wiggles (sinc function artifacts) are more pronounced in the spectrum. In this case, the wiggles became pronounced for α values below 0.55 and consequently lower α-values were not further explored. In Fig. 11, the Tukey window, with α = 0.55, shows an improvement of a factor 1.2 in S/N over the boxcar averaging without a loss in selectivity.
000 g mol−1, Đ = 1.06) in CHCl3. The peak under investigation is the –OCH3 resonance at 3.6 ppm, it was chosen as this peak is among the narrowest ones found in polymers and the influence of filtering on such a peak is most severe. Additionally, this peak is strong and well separated making S/N and FWHM calculation straight forward and reliable. The results are shown in Fig. 11. The characteristic function of a smoothing algorithm is obtained by varying the free parameter for each smoothing function (L and α in the case of the Tukey window) and recording S/N and FWHM. In general, each increase in S/N leads to an undesired increase in FWHM. For the Tukey window the results of three fixed values of α are shown. The characteristic function of the boxcar average is almost linear, while it is curved for the Gaussian and Tukey window; a lower α leads to stronger curving. With respect to the defined criterion of a 10% increase in width, see wide dashed line in Fig. 11, the boxcar average shows the least S/N improvement. The Gaussian window is slightly better, while the best results are found for the Tukey function dependent on the α-value chosen, where an α-value of 0.55 is the best for the current application. The lower the α the better S/N at the given FWHM. However, in the same direction wiggles (sinc function artifacts) are more pronounced in the spectrum. In this case, the wiggles became pronounced for α values below 0.55 and consequently lower α-values were not further explored. In Fig. 11, the Tukey window, with α = 0.55, shows an improvement of a factor 1.2 in S/N over the boxcar averaging without a loss in selectivity.
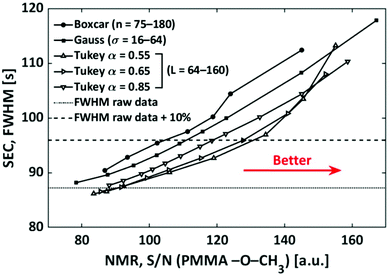 | ||
Fig. 11 Illustration of the effect of the different filters on the FWHM and S/N, determined on the –OCH3 (δ = 3.58 ppm) peak of a PMMA (Mn = 30![[thin space (1/6-em)]](https://www.rsc.org/images/entities/char_2009.gif) 000 g mol−1, Đ = 1.06) sample. 000 g mol−1, Đ = 1.06) sample. | ||
It must be noted that this result is dependent on the threshold chosen as indicated in Fig. 11 by the crossing of the characteristic functions. If a higher FWHMSEC is tolerated, e.g. above 30%, then the Gaussian filter becomes the best option. In the case of the FWHMNMR, a Gaussian filter is used as the apodization function in the S/N dimension in this work, as discussed in previous work from our group.29
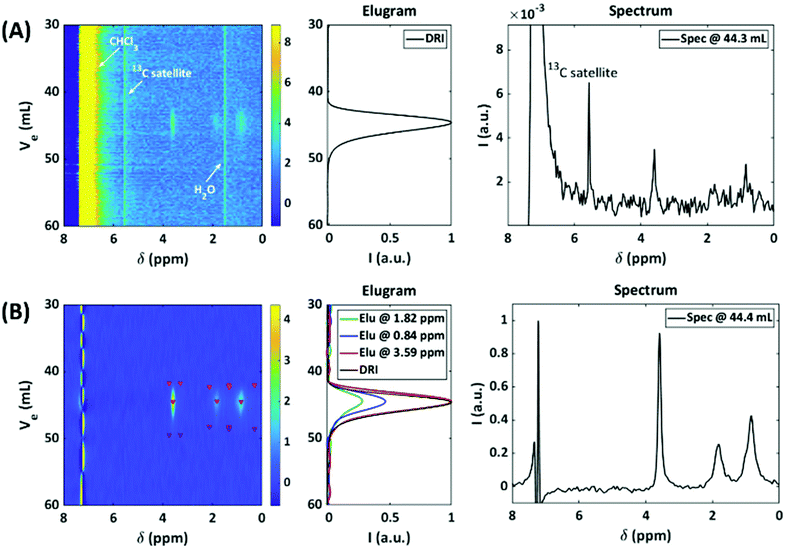
To illustrate the achieved optimization of the system, a PMMA calibration standard (Mn = 28![[thin space (1/6-em)]](https://www.rsc.org/images/entities/char_2009.gif) 700 g mol−1, Đ = 1.08) was analyzed in CHCl3 (Fig. 12), where the raw data, Fig. 12A, after fast fourier transform (FFT) without any data treatment is compared to, Fig. 12B, full data treatment. Without any data treatment the NMR spectra is dominated by the large residual eluent peak, however, with appropriate magnification the polymer signals can still be observed. The S/N for the –OCH3 peak (3.59 ppm) is S/N = 15 and S/N = 3300 for CHCl3. After full data treatment, see the sections from Optimization of NMR data acquisition to Optimization of data evaluation, the S/N increased to S/N = 263 for the –OCH3 peak and S/N = 935 for CHCl3. Furthermore, the 2D data treatment of the data result in a factor 16 improvement in S/N.
700 g mol−1, Đ = 1.08) was analyzed in CHCl3 (Fig. 12), where the raw data, Fig. 12A, after fast fourier transform (FFT) without any data treatment is compared to, Fig. 12B, full data treatment. Without any data treatment the NMR spectra is dominated by the large residual eluent peak, however, with appropriate magnification the polymer signals can still be observed. The S/N for the –OCH3 peak (3.59 ppm) is S/N = 15 and S/N = 3300 for CHCl3. After full data treatment, see the sections from Optimization of NMR data acquisition to Optimization of data evaluation, the S/N increased to S/N = 263 for the –OCH3 peak and S/N = 935 for CHCl3. Furthermore, the 2D data treatment of the data result in a factor 16 improvement in S/N.
Application examples
Having NMR as a detector for SEC enables the identification/structure elucidation of compounds as function of different eluting species and/or molar mass. An example is the differentiation between polymer blends29 and/or copolymers, where the blend consists of two homopolymers with different hydrodynamic volumes. It should be noted that the technique cannot differentiate between a blend and a copolymer in the case that the blend has two homopolymers of similar hydrodynamic volume, as the result would be the same as a copolymer, which co-elutes. Thus, in order to more accurately characterize a binary blend and copolymer, more in-depth NMR experiments must be conducted, e.g. end-group analysis. All the SEC-NMR experiments in this section were performed using a sample concentration of 2 g L−1, injection loop of 500 μL, a semi-preparative column and a volumetric flow rate of 1 mL min−1. The concentration range was chosen to minimize the risk of column overloading. If the material under investigation was completely unknown, standard solution NMR measurements could be performed, using higher concentration samples to obtain high quality spectra and the integral projection of the 2D data set. To illustrate how SEC hyphenation can differentiate between overlapping peaks, a PS/PMMA blend and PS-b-PMMA block copolymer were analyzed.29Fig. 13 displays the resulting 2D spectral chromatogram of the PS/PMMA blend as a contour plot for the SEC-NMR measurement.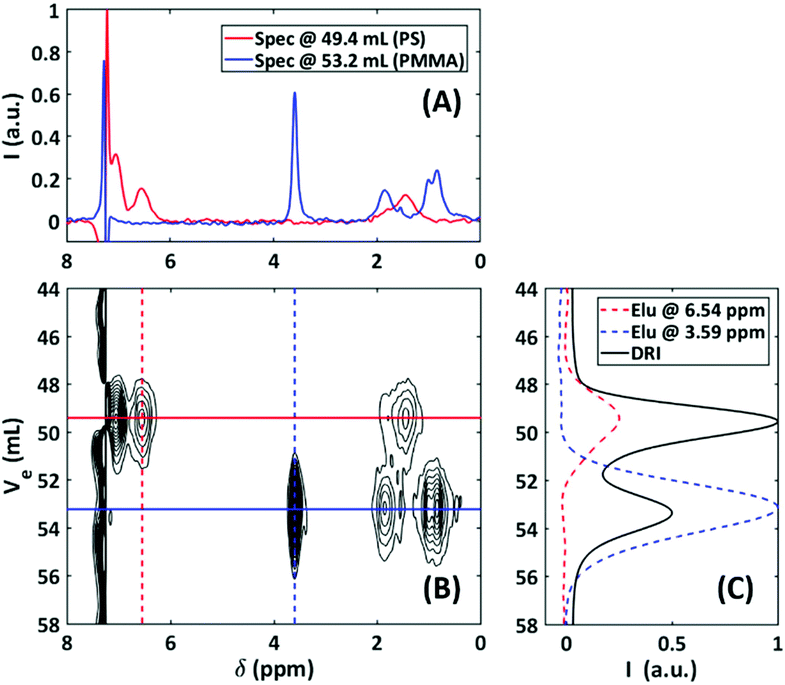 | ||
Fig. 13 SEC-NMR data of a 1![[thin space (1/6-em)]](https://www.rsc.org/images/entities/char_2009.gif) : :![[thin space (1/6-em)]](https://www.rsc.org/images/entities/char_2009.gif) 1 wt% PS/PMMA blend (54 1 wt% PS/PMMA blend (54![[thin space (1/6-em)]](https://www.rsc.org/images/entities/char_2009.gif) 000/23 000/23![[thin space (1/6-em)]](https://www.rsc.org/images/entities/char_2009.gif) 000 g mol−1). (A) 1D NMR data extracted from the 2D data at the peak maxima for each component. (B) A contour map (1–20 steps, 0.05 intensity increments) of the SEC-NMR data in the region of interest, two signal groups can be identified at 49.4 mL and 53.2 mL for the PS and PMMA components, respectively. (C) The corresponding elugram cuts as illustrated on figure B for two chemical shift regions in the NMR, overlayed with the DRI trace.29 000 g mol−1). (A) 1D NMR data extracted from the 2D data at the peak maxima for each component. (B) A contour map (1–20 steps, 0.05 intensity increments) of the SEC-NMR data in the region of interest, two signal groups can be identified at 49.4 mL and 53.2 mL for the PS and PMMA components, respectively. (C) The corresponding elugram cuts as illustrated on figure B for two chemical shift regions in the NMR, overlayed with the DRI trace.29 | ||
Because the PS and PMMA had similar hydrodynamic volumes, it resulted in the incomplete SEC baseline separation between the two species (see DRI trace, Fig. 13C). However, the deformulation of the blend, with respect to separation and identification, can be achieved because the two polymers have at least one unique proton resonance. The region of 6.3–7.3 ppm displays the aromatic protons of PS and the signal at 3.6 ppm belongs to the –OCH3 group of PMMA. By extracting the 1D NMR slices at the two different elution volumes, each spectrum was considered to be representative of the respective compound with no detectable traces of the other compound.
A unique advantage of using the hyphenated technique is the ability to quantify the compositional changes as a function of molar mass in a fast and reliable way. The optimized 2D analysis was applied to determine the composition of a single, non-blended block copolymer (PS-b-PMMA, 64![[thin space (1/6-em)]](https://www.rsc.org/images/entities/char_2009.gif) :
:![[thin space (1/6-em)]](https://www.rsc.org/images/entities/char_2009.gif) 36 mol%, Mn = 230
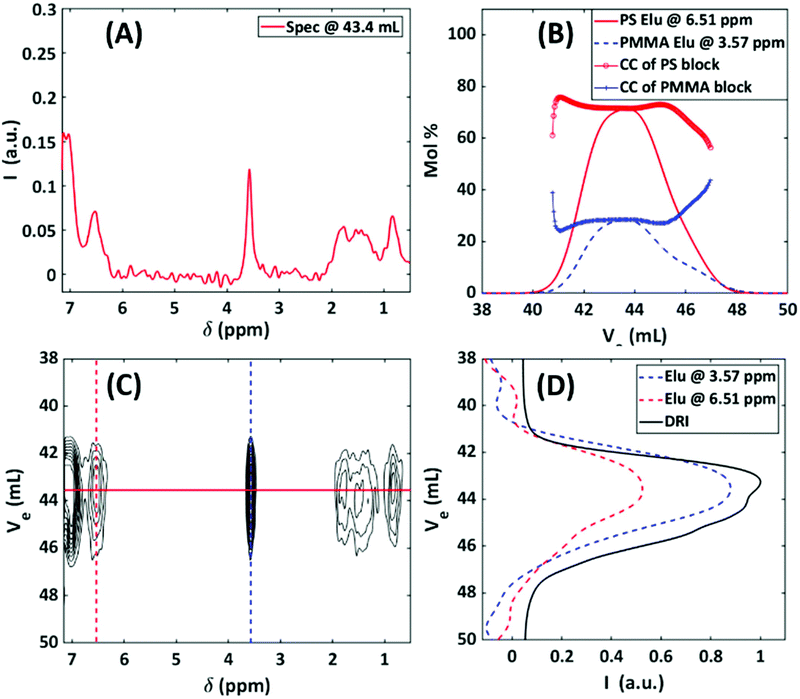
36 mol%, Mn = 230![[thin space (1/6-em)]](https://www.rsc.org/images/entities/char_2009.gif) 000 g mol−1, as determined by HF-NMR), which elutes as one peak. The total injected mass was 1 mg. Fig. 14A–D illustrates the SEC-NMR experiment of the block copolymer. It is evident from Fig. 14 that the block copolymer elutes as one main peak at 43.4 mL. Here, the 1H-NMR spectrum is a composite and shows both aromatic proton resonance of PS at 6.54 ppm and the methyl ether resonance at 3.57 ppm. Consequently, the elugrams at these two resonance peaks overlap with the DRI trace. The molar mass of the PS block of the copolymer can be determined by using the SEC-NMR on-flow data of the PS calibration. The main advantage of SEC-NMR is to provide the individual concentrations of both monomer units. Thus, it is possible to determine the chemical composition (CC) of the copolymer without using calibration standards. Based on the on-flow runs in Fig. 14B, the average CC can be determined at different elution volumes. The individual NMR elugrams are presented as a solid line for the PS and as a dashed line for the PMMA blocks.
000 g mol−1, as determined by HF-NMR), which elutes as one peak. The total injected mass was 1 mg. Fig. 14A–D illustrates the SEC-NMR experiment of the block copolymer. It is evident from Fig. 14 that the block copolymer elutes as one main peak at 43.4 mL. Here, the 1H-NMR spectrum is a composite and shows both aromatic proton resonance of PS at 6.54 ppm and the methyl ether resonance at 3.57 ppm. Consequently, the elugrams at these two resonance peaks overlap with the DRI trace. The molar mass of the PS block of the copolymer can be determined by using the SEC-NMR on-flow data of the PS calibration. The main advantage of SEC-NMR is to provide the individual concentrations of both monomer units. Thus, it is possible to determine the chemical composition (CC) of the copolymer without using calibration standards. Based on the on-flow runs in Fig. 14B, the average CC can be determined at different elution volumes. The individual NMR elugrams are presented as a solid line for the PS and as a dashed line for the PMMA blocks.
The simultaneous detection of the PS and PMMA allows for the determination of the average CC of the block copolymer dependent on the retention volume. The SEC-NMR elugrams and CCs were obtained by normalizing the ortho aromatic protons and –OCH3 protons to one proton and then applying a correction factor to extrapolate acceptable CC information, the approach used was similar to what has been described by Hiller et al.44 As is evident from Fig. 14B, the composition in mol% of the two blocks differs slightly from the HF-NMR results of 64![[thin space (1/6-em)]](https://www.rsc.org/images/entities/char_2009.gif) :
:![[thin space (1/6-em)]](https://www.rsc.org/images/entities/char_2009.gif) 36 mol% with a PS and PMMA mol% of 69% and 31%, respectively. This is within the margin of error of the experiment and can be ascribed to the lower magnetic field strength being employed as well as the T1 differences of each copolymer. In Fig. 14B, the increase in the mol% for the PMMA at higher elution volumes and decrease in mol% for PS can possibly be explained based on the following assumptions; (1) for living polymerization the PS anions has a Poisson distribution and (2) every PS anion has an equal probability to ‘consume’ MMA monomers. Working on the premise of these two assumptions the PS-b-PMMA, has a macro chain length distribution for the PS chains, with a micro chain length distribution of PMMA chains on every chain (length) of PS. This results in a distribution on a distribution, with the assumption that the smaller chain lengths of PS is rich in PMMA, i.e. longer chain lengths of PMMA, and vice versa.
36 mol% with a PS and PMMA mol% of 69% and 31%, respectively. This is within the margin of error of the experiment and can be ascribed to the lower magnetic field strength being employed as well as the T1 differences of each copolymer. In Fig. 14B, the increase in the mol% for the PMMA at higher elution volumes and decrease in mol% for PS can possibly be explained based on the following assumptions; (1) for living polymerization the PS anions has a Poisson distribution and (2) every PS anion has an equal probability to ‘consume’ MMA monomers. Working on the premise of these two assumptions the PS-b-PMMA, has a macro chain length distribution for the PS chains, with a micro chain length distribution of PMMA chains on every chain (length) of PS. This results in a distribution on a distribution, with the assumption that the smaller chain lengths of PS is rich in PMMA, i.e. longer chain lengths of PMMA, and vice versa.
The separation and identification were achieved by considering the individual resonances, which appear over the different chemical shift ranges. The result was plotted against the DRI traces to illustrate the extracted elugrams of each resonance peak. The spectrum of the compound was extracted at 43.4 mL (Fig. 14A) and exhibits all the resonance peaks for both PS and PMMA, indicating that the sample is a copolymer or two homopolymers with the same molecular mass distribution. Even when working with medium resolution NMR all the resonances for PS and PMMA, could easily be detected. This illustrated that SEC-MR-NMR could successfully be used for analyzing homo- and copolymers. In particular, the CC of copolymers can be determined with this technique, with the advantage of having the possibility of detecting each monomeric species simultaneously without the need for calibration and additionally information on the polymer microstructure. Table 3 summarizes the progressive increase in S/N, for the –OCH3 peak, as each parameter was improved. The overall gain in S/N during the method development described in this work was a factor of 385. This allows for performing SEC-NMR below the overloading limit of the SEC column, thus retaining chromatographic integrity, with all sample chromatograms having a S/N above the limit of detection (LOD, S/N > 3) and limit of quantification (LOQ, S/N > 10).
![[thin space (1/6-em)]](https://www.rsc.org/images/entities/char_2009.gif) 700 g mol−1, Đ = 1.08) calibration standard, looking only at the –OCH3 peak
700 g mol−1, Đ = 1.08) calibration standard, looking only at the –OCH3 peak
| Optimization parameter | Choice and/or recommendation | Increase in S/N during optimization |
|---|---|---|
| SEC: Injected mass | Close to overloading limit, sample dependent | 2 |
| SEC: Flow rate | 1 mL min−1 | 2.3 |
| SEC: Column | Semi-preparative, 300 × 20 mm i.d. | 1.5 |
| Flow cell: Geometry & dead volume | Conical shaped in- and out-lets, 0.80 mm i.d. capillaries, 4.2 mm i.d. active region, <500 μL | 2.1 |
| NMR: Recycle delay | 500 ms | 1.12 |
| NMR: Receiver gain | As high as possible, before ACD overflow | 1.2 |
| NMR: Phasing | x/−x only | 1.03 |
| Data processing: Noise region & fitting | Gaussian convolution | 1.2 |
| Data processing: Denoising (2D, filter in SEC & NMR dim.) | Combination of Tukey window function and Gaussian | 16 |
| Overall increase in S/N | 385 | |
Conclusions
In this publication, a detailed description on the optimization of all aspects regarding the hyphenation of a MR 62 MHz 1H-NMR spectrometer to SEC as a chemically sensitive detector, to obtain the best system performance was provided. Due to the unique design of the NMR spectrometer, cost and ease of use, it has the potential to be applied as a standard SEC detector, not only in academic institutions but also in industry, allowing for fast and accurate quality control and material development. Due to the intrinsic constraint for different conditions when hyphenating NMR to SEC, the specific requirements and modifications for the NMR and SEC and full optimization to fit the desired application are discussed in detail. By employing shorter recycle delays for the pulse sequence and adjusting the receiver gain to match the FID intensity to the ADC window an improvement in the S/N (factor ∼2–3) was achieved. To further improve S/N a modified Tukey window function was applied for filtering the data in the SEC dimension in combination with a Gaussian filter in the NMR dimension. The modified Tukey window function shows an improvement of ∼30% in S/N over the boxcar averaging without a loss in selectivity. The improvement in the design of the custom-built flow cell minimized in- and out-flow effects associated with on-flow NMR measurements and allowed for a better match to optimum chromatography conditions. This resulted in an improvement in S/N by ∼26%, and a reduction in band broadening by ∼6%. The product of the overall improved optimization parameters amounted in a factor of 385 improvement in S/N, with a final S/N of the –OCH3 (3.58 ppm) equating to S/N = 263. It was illustrated that the hyphenation of the MR 1H-NMR to SEC, although medium field strength, is a powerful technique to analyze homo- and copolymers. The method was tested on a PS/PMMA blend and a PS-b-PMMA block copolymer. The technique provided sufficient sensitivity and chemical shift resolution and was able to differentiate between the blend and block copolymer, because there was a difference in hydrodynamic volume of the respective homopolymers. With the S/N being sufficient for both quantitative and qualitative analyses at typical SEC concentrations (<0.5 g L−1 after separation) in protonated solvents, e.g. CHCl3 or THF. After appropriate molar mass calibration of the setup, in a single on-flow experiment (ca. 85 min) of a block copolymer, information on the MMD and CC of the bulk sample could be obtained. Model samples, having low Đ and complexities were employed for the method development to be realized. Further studies are planned to apply the technique to more complex samples, to generate a better understanding on the abilities and limitations of the hyphenated technique. In a forthcoming publication, the focus will be on employing more sophisticated pulse sequences for an improvement in suppression of the solvent signal, which will include the comparison of a 43 MHz Spinsolve spectrometer equipped with a power PFG.Conflicts of interest
The authors have no conflicts of interest to declare.Acknowledgements
This project was funded by the German Science Foundation (DFG) within the SFB 1176 “Molecular Structuring of Soft Matter”, project Q1. The authors would like to thank L. Faust for preparation of the PS-b-PMMA samples and Dr M. Heck for preparation of some homopolymers, and A. Bucka for assistance in programming. We would also like to thank Dr M. Pollard for proof reading the manuscript, the Magritek team and Prof. Dr T. Hofe.Notes and references
- T. Kitayama and K. Ute, Modern Magnetic Resonance, ed. G. A. Webb, Springer Netherlands, Dordrecht, 2006, pp. 399–405 Search PubMed.
- T. Provder, Adv. Chem. Ser., 1995, 247, 9 Search PubMed.
- T. F. Beskers, T. Hofe and M. Wilhelm, Polym. Chem., 2015, 6, 128–142 RSC.
- S. Morlock, J. M. Kübel, T. F. Beskers, B. Lendl and M. Wilhelm, Macromol. Rapid Commun., 2018, 39, 1700307 CrossRef PubMed.
- L. S. Ettre, LCGC North Am., 2005, 23, 486–495 CAS.
- D. A. Skoog, F. J. Holler and S. R. Crouch, Principles of instrumental analysis, Cengage learning, 2017 Search PubMed.
- S. J. Kok, C. A. Wold, Th. Hankemeier and P. J. Schoenmakers, J. Chromatogr. A, 2003, 1017, 83–96 CrossRef CAS PubMed.
- J. N. Willis, J. L. Dwyer and M. X. Liu, Int. J. Polym. Anal. Charact., 1997, 4, 21–29 CrossRef CAS.
- K. Inge, P. Harald, H. Heidrun and A. Klaus, Macromol. Chem. Phys., 1999, 200, 1734–1744 CrossRef.
- V. Exarchou, M. Krucker, T. A. van Beek, J. Vervoort, I. P. Gerothanassis and K. Albert, Magn. Reson. Chem., 2005, 43, 681–687 CrossRef CAS PubMed.
- W. Hiller, H. Pasch, T. Macko, M. Hofmann, J. Ganz, M. Spraul, U. Braumann, R. Streck, J. Mason and F. Van Damme, J. Magn. Reson., 2006, 183, 290–302 CrossRef CAS PubMed.
- W. Hiller, H. Pasch, P. Sinha, T. Wagner, J. Thiel, M. Wagner and K. Müllen, Macromolecules, 2010, 43, 4853–4863 CrossRef CAS.
- M. Cudaj, G. Guthausen, T. Hofe and M. Wilhelm, Macromol. Rapid Commun., 2011, 32, 665–670 CrossRef CAS PubMed.
- M. Cudaj, G. Guthausen, T. Hofe and M. Wilhelm, Macromol. Chem. Phys., 2012, 213, 1933–1943 CrossRef CAS.
- T. Kitayama and K. Hatada, NMR spectroscopy of polymers, Springer Science & Business Media, 2013 Search PubMed.
- W. Hiller, P. Sinha, M. Hehn and H. Pasch, Prog. Polym. Sci., 2014, 39, 979–1016 CrossRef CAS.
- W. Hiller, P. Sinha and H. Pasch, Macromol. Chem. Phys., 2007, 208, 1965–1978 CrossRef CAS.
- W. Hiller, P. Sinha and H. Pasch, Macromol. Chem. Phys., 2009, 210, 605–613 CrossRef CAS.
- K. Klimke, M. Parkinson, C. Piel, W. Kaminsky, H. W. Spiess and M. Wilhelm, Macromol. Chem. Phys., 2006, 207, 382–395 CrossRef CAS.
- G. Montaudo, D. Garozzo, M. S. Montaudo, C. Puglisi and F. Samperi, Macromolecules, 1995, 28, 7983–7989 CrossRef CAS.
- M. S. Montaudo, Polymer, 2002, 43, 1587–1597 CrossRef CAS.
- H. Pasch and B. Trathnigg, Multidimensional HPLC of polymers, Springer, 2013 Search PubMed.
- N. Watanabe and E. Niki, Proc. Jpn. Acad., Ser. B, 1978, 54, 194–199 CrossRef CAS.
- P. Gfrörer, J. Schewitz, K. Pusecker, L. H. Tseng, K. Albert and E. Bayer, Electrophoresis, 1999, 20, 3–8 CrossRef.
- K. Ute, R. Niimi, S.-y. Hongo and K. Hatada, Polym. J., 1998, 30, 439 CrossRef CAS.
- U. Koichi, N. Ryo, M. Morikatsu, H. Koichi and K. Tatsuki, Macromol. Chem. Phys., 2001, 202, 3081–3086 CrossRef.
- R. J. Ogg, R. B. Kingsley and J. S. Taylor, J. Magn. Reson., Ser. B, 1994, 104, 1–10 CrossRef CAS PubMed.
- S. H. Smallcombe, S. L. Patt and P. A. Keifer, J. Magn. Reson., Ser. A, 1995, 117, 295–303 CrossRef CAS.
- J. Höpfner, K.-F. Ratzsch, C. Botha and M. Wilhelm, Macromol. Rapid Commun., 2018, 39, 1700766 CrossRef PubMed.
- M. Cudaj, J. Cudaj, T. Hofe, B. Luy, M. Wilhelm and G. Guthausen, Macromol. Chem. Phys., 2012, 213, 1833–1840 CrossRef CAS.
- A. Striegel, W. W. Yau, J. J. Kirkland and D. D. Bly, Modern size-exclusion liquid chromatography: practice of gel permeation and gel filtration chromatography, John Wiley & Sons, 2009 Search PubMed.
- E. Danieli, J. Perlo, A. Duchateau, G. Verzijl, V. Litvinov, B. Blümich and F. Casanova, ChemPhysChem, 2014, 15, 3060–3066 CrossRef CAS PubMed.
- E. Danieli, J. Perlo, B. Blümich and F. Casanova, Angew. Chem., Int. Ed., 2010, 49, 4133–4135 CrossRef CAS PubMed.
- D. I. Hoult and R. Richards, J. Magn. Reson., 1976, 24, 71–85 Search PubMed.
- R. A. Shalliker, H. J. Catchpoole, G. R. Dennis and G. Guiochon, J. Chromatogr. A, 2007, 1142, 48–55 CrossRef CAS PubMed.
- A. M. Striegel, J. Chromatogr. A, 2001, 932, 21–31 CrossRef CAS PubMed.
- J. J. Van Deemter, F. Zuiderweg and A. v. Klinkenberg, Chem. Eng. Sci., 1956, 5, 271–289 CrossRef CAS.
- K. Albert, J. Chromatogr. A, 1995, 703, 123–147 CrossRef CAS.
- K. Albert, On-line LC-NMR and related techniques, John Wiley & Sons, 2003 Search PubMed.
- B. Gouilleux, B. Charrier, S. Akoka and P. Giraudeau, Magn. Reson. Chem., 2017, 55, 91–98 CrossRef CAS PubMed.
- I. I. Kanatov, V. V. Gul'vansky and D. I. Kaplun, in Proceedings of the 7th Mediterranean Conference on Embedded Computing (MECO), 2018, vol. 7, pp. 1–4 Search PubMed.
- F. J. Harris, Proc. IEEE, 1978, 66, 51–83 Search PubMed.
- S. Starosielec and D. Hägele, Signal Process., 2014, 102, 240–246 CrossRef.
- W. Hiller, M. Hehn, T. Hofe and K. Oleschko, Anal. Chem., 2010, 82, 8244–8250 CrossRef CAS PubMed.
| This journal is © The Royal Society of Chemistry 2019 |

