
 Open Access Article
 This Open Access Article is licensed under a Creative Commons Attribution-Non Commercial 3.0 Unported Licence
Broad spectrum absorption and low-voltage electrochromic operation from indacenodithieno[3,2-b]thiophene-based copolymers†
Kim
Bini‡
a,
Petri
Murto‡
ab,
Sait
Elmas
 b,
Mats R.
Andersson
*b and
Ergang
Wang
*a
b,
Mats R.
Andersson
*b and
Ergang
Wang
*a
aDepartment of Chemistry and Chemical Engineering/Applied Chemistry, Chalmers University of Technology, SE-412 96, Göteborg, Sweden. E-mail: ergang@chalmers.se
bFlinders Institute for Nanoscale Science and Technology, Flinders University, Sturt Road, Bedford Park, Adelaide, South Australia 5042, Australia. E-mail: mats.andersson@flinders.edu.au
First published on 12th March 2019
Abstract
Electrochromic performance of conjugated polymers has quickly become an important design factor in a variety of applications. There is still significant need to develop highly stable materials with high optical contrast, desired colour switching and fast kinetics. Here, poly[indacenodithieno[3,2-b]thiophene-2,8-diyl] (PIDTT) is introduced as a new type of electrochromic polymer exhibiting a narrow absorption band, excellent electrochemical stability and fast colour switching kinetics between vibrant red (peak maximum at ∼550 nm) and transparent (peak maximum at ∼920 nm) within a low potential range of 0–0.8 V. To widen the spectral coverage of the well-functioning PIDTT over the entire visible range, a modified donor–acceptor approach is used by incorporating three different donor–acceptor–donor (DAD) segments into an indacenodithieno[3,2-b]thiophene (IDTT) based polymer backbone, so as to obtain three different alternating copolymers. This design motif is further rationalized by the maintained electrochemical stability of the new copolymers, and their full colour switching between black and transparent down to an ultra-low potential range of 0–0.6 V.
Introduction
Electrochromic polymers can be used in a wide variety of applications spanning from smart windows/mirrors to eyewear and nonemissive displays, where switchable absorbance or colouration is desirable.1–3 Electrochromism in materials has been observed and researched for decades, but recent advances in organic electrochromic polymers have renewed the field with promises of colour control and stability for real-life applications.4,5 Conjugated polymers show a large degree of customizability, enabling new ways to tune colours both in neutral and oxidized/reduced states.6–8 Another big advantage is the abundance of conjugated structures developed for other optoelectronic applications, such as organic photovoltaics (OPVs), organic photodetectors (OPDs), organic field-effect transistors (OFETs), organic light-emitting diodes (OLEDs) and light-emitting electrochemical cells (LECs), providing access to an existing pool of already pre-designed and well-studied materials. Some examples of electrochromic materials based on the conventional donor–acceptor design motif include different quinoxaline,9 isoindigo10–12 and diketopyrrolopyrrole copolymers.13,14 Due to the good long-term stability, fast colour switching and relatively simple chemical structures, various polymers based on thiophenes, 3,4-ethylenedioxythiophenes and other dioxythiophenes have been a main focus of electrochromic research, spearheaded by the Reynolds group.7,15–21 Much work has been addressed to completing the whole electrochromic spectra of coloured to transparent, and the colour palette was considered complete in 2011, with the addition of yellow-to-transmissive polymers.17,22 Building upon their work, other groups have made well-performing materials in terms of improved stability, tailored coloration and fast colour switching.23–26 Since then, the research has continued with the focus on producing polymers with regards to the aforementioned figures of merit, with the goal of approaching sufficient levels of colouration for commercial prospects. This means almost exclusively switching from a distinct coloured state and to a transparent state.Electrochemical stability of the polymers upon oxidation (p-type doping) and reduction (n-type doping) is of utmost importance for their commercial viability, and the stability has been shown to be strongly dependent on the applied voltage.27 High band gap polymers typically exhibit narrow absorption envelopes and they require a large change in the applied voltage (ΔV > 1 V) for complete colour change.22,26,28,29 To obtain complimentary absorption over the visible spectrum, a popular approach has been to blend a high band gap polymer (showing spectral response in the high-energy region) with a low band gap polymer (spectral response in the low-energy region).16,30 The risk in such blends is that over time the low-gap polymer may degrade under the high voltage that is required to oxidize the high-gap polymer.31–33 A structure which has shown excellent electrochemical stability and charge transport properties when included in conjugated polymers and small molecules is the rigid and planar indacenodithieno[3,2-b]thiophene (IDTT) unit, and the IDTT-based materials have accordingly delivered high efficiencies in the above mentioned optoelectronic applications.34–38 Interestingly however, no publication exists to report the effect of p/n-doping on the absorption profile nor the electrochromic performance of IDTT-based copolymers.
Herein, poly[indacenodithieno[3,2-b]thiophene-2,8-diyl] (PIDTT) is used as an electrochromic polymer that exhibited low oxidation potential and thereby full colour switching from red to transparent at 0.8 V. PIDTT showed strong absorption in both solution and solid state, but the absorption envelope was rather narrow (solid-state full width at half maximum, fwhm = 107 nm). Inspired by the strong absorption and favourable electrochromic properties of PIDTT, three different donor–acceptor–donor (DAD) units were copolymerized with the IDTT moiety to obtain three copolymers with broad, full visible absorption from a single active material. A significant benefit over the blend approach (i.e., a blend of high-gap and low-gap polymers) then was that the copolymers exhibited full colour switching from black to transparent at ultra-low voltages ≤0.8 V. This ensures the realization of a low-voltage operation and good long-term stability of the electrochromic material, which was further confirmed by kinetic studies at different potentials ranging between 0–1.0 V.
Results and discussion
The chemical structures of the PIDTT homopolymer and the three copolymers PIDTT-TBT, PIDTT-SBS and PIDTT-SBRS are shown in Scheme 1, whereas their detailed synthetic procedures are represented in Scheme S1 (ESI†). PIDTT was synthesized via Pd-catalyzed Stille polycondensation of the bis(trimethylstannyl)-substituted IDTT monomer and the dibromo-substituted IDTT monomer. The copolymers were synthesized via corresponding reactions of the bis(trimethylstannyl)-substituted IDTT monomer and either the 4,7-bis(5-bromothiophen-2-yl)benzo[c][1,2,5]thiadiazole (TBT) monomer, for PIDTT-TBT, the 4,7-bis(6-bromo-4,4-bis(2-ethylhexyl)-4H-silolo[3,2-b:4,5-b′]dithiophen-2-yl)benzo[c][1,2,5]thiadiazole (SBS) monomer, for PIDTT-SBS, or the 4,7-bis(6-bromo-4,4-bis(2-ethylhexyl)-4H-silolo[3,2-b:4,5-b′]dithiophen-2-yl)-5,6-bis(dodecyloxy)benzo[c][1,2,5]thiadiazole (SBRS) monomer, for PIDTT-SBRS, respectively. All polymers were end-capped with thiophenes and collected at high number-average molecular weights (Mn ≥ 80 kg mol−1) and relatively narrow dispersities (PDI < 3) after several purification steps, as described in the ESI.† | ||
| Scheme 1 Chemical structures of PIDTT homopolymer and PIDTT-TBT, PIDTT-SBS and PIDTT-SBRS copolymers. | ||
The rigid IDTT unit was anticipated to minimize the torsional reorganization of the polymer backbone upon p- and n-type doping. On the other hand, the hexylphenyl substituents on IDTT were necessary to ensure sufficient solubility and processability of the polymers from both dilute chloroform solution (ca. 1 mg mL−1) and concentrated chlorobenzene solution (ca. 10 mg mL−1). The donor–acceptor design strategy is a common approach to decrease the band gap of conjugated polymers, and also to obtain the distinctive two-band absorption profile via local excitations and intramolecular charge transfer (ICT) transitions, thereby broadening their overall absorption spectra. Benzo[c][1,2,5]thiadiazole is a remarkable example of an electron-deficient acceptor unit that has enabled fast electrochromic colour switching of other low-gap donor–acceptor copolymers,16,39–41 and in this work the acceptor was accordingly endowed with two different electron-rich donor units: either the small thiophenes in PIDTT-TBT or the large 4,4-bis(2-ethylhexyl)-4H-silolo[3,2-b:4,5-b′]dithiophenes in PIDTT-SBS. In both cases, the aim was to decrease the oxidation potential, yet to keep it above the threshold of oxidation in air,42 which is necessary for stable long-term electrochromic operation of the polymers also under atmospheric conditions. Moreover, the central acceptor unit was functionalized with two dodecyloxy side chains in PIDTT-SBRS for fine-tuning of the band gap and colour of the polymer.
Fig. 1a shows the absorption coefficient versus wavelength curves of the synthesized polymers in chlorobenzene solution. The PIDTT homopolymer showed a strong and narrow, well-structured absorption band with a peak maximum at 550 nm. The three copolymers PIDTT-TBT, PIDTT-SBS and PIDTT-SBRS featured significantly broader absorption profiles compared to PIDTT, with both the high-energy local excitation and the low-energy ICT bands extending over the PIDTT absorption envelope. However, the absorption of the copolymers in solution was not as strong as that of the PIDTT homopolymer. When going from solution to solid-state thin film (Fig. 1b), the narrow absorption band of PIDTT is maintained, which we attribute to the bulky hexylphenyl substituents somewhat limiting the close π–π stacking of the polymer chains. We further note that the two absorption peaks appeared similar in magnitude in the solid state as a characteristic of indacenodithiophene- and IDTT-structured homopolymers.43,44 An optical band gap of ∼2.1 eV was estimated for PIDTT from the low-energy onset of absorption in thin film. A general observation is that the three copolymers exhibited stronger absorption in thin films, as compared to the solution samples, ascribable to the DAD units facilitating closer π–π stacking of the polymer chains in the solid state. This was particularly the case for PIDTT-TBT, which featured a significantly strong and redshifted absorption ranging from 350 to 750 nm, which is essentially over the entire visible spectrum. Comparison of the absorption spectra of PIDTT-SBS and PIDTT-SBRS reveals that the dodecyloxy side chains increased the energy gap and blueshifted the absorption of PIDTT-SBRS, which we attribute to the limited π–π stacking and weaker electron-withdrawing effect of its central acceptor unit due to the solubilizing and electron donating effect of the dodecyloxy groups. The optical band gaps of the three copolymers were between 1.6–1.8 eV.
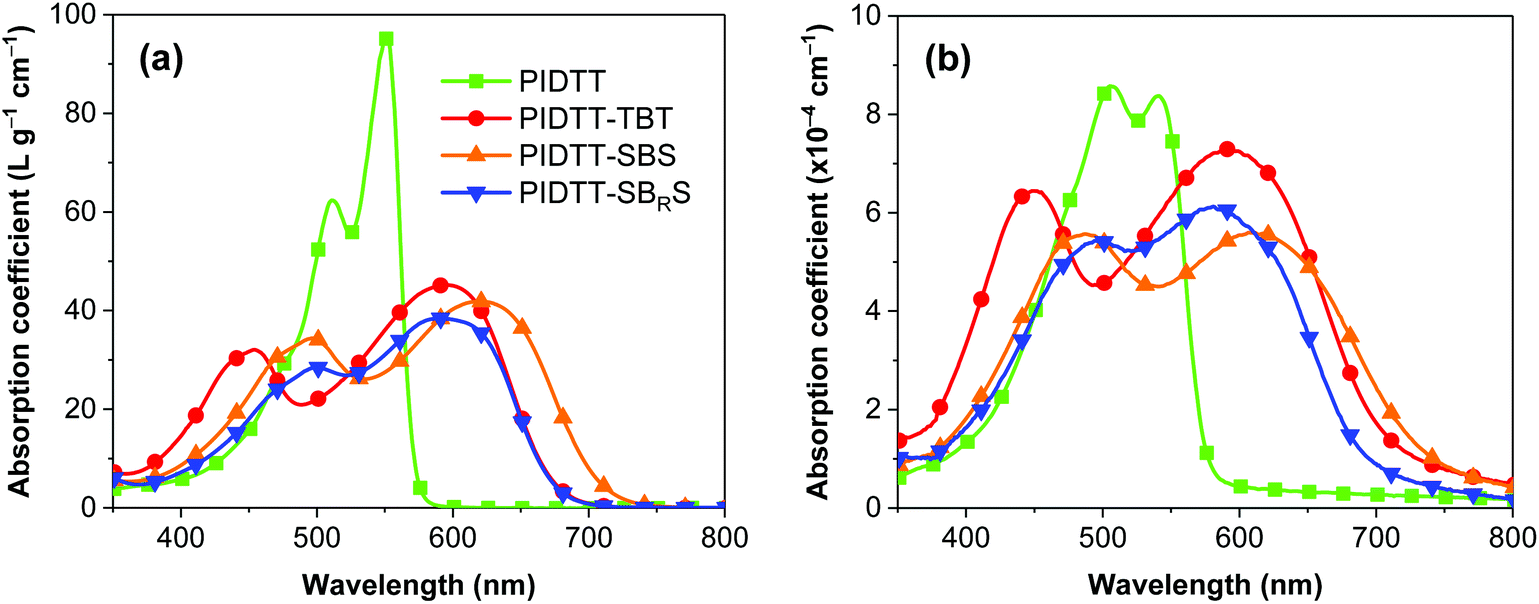 | ||
| Fig. 1 Absorption coefficients of the polymers (a) in chlorobenzene solution and (b) as solid-state thin film. The thin-film samples were prepared by spin-coating onto a glass substrate. | ||
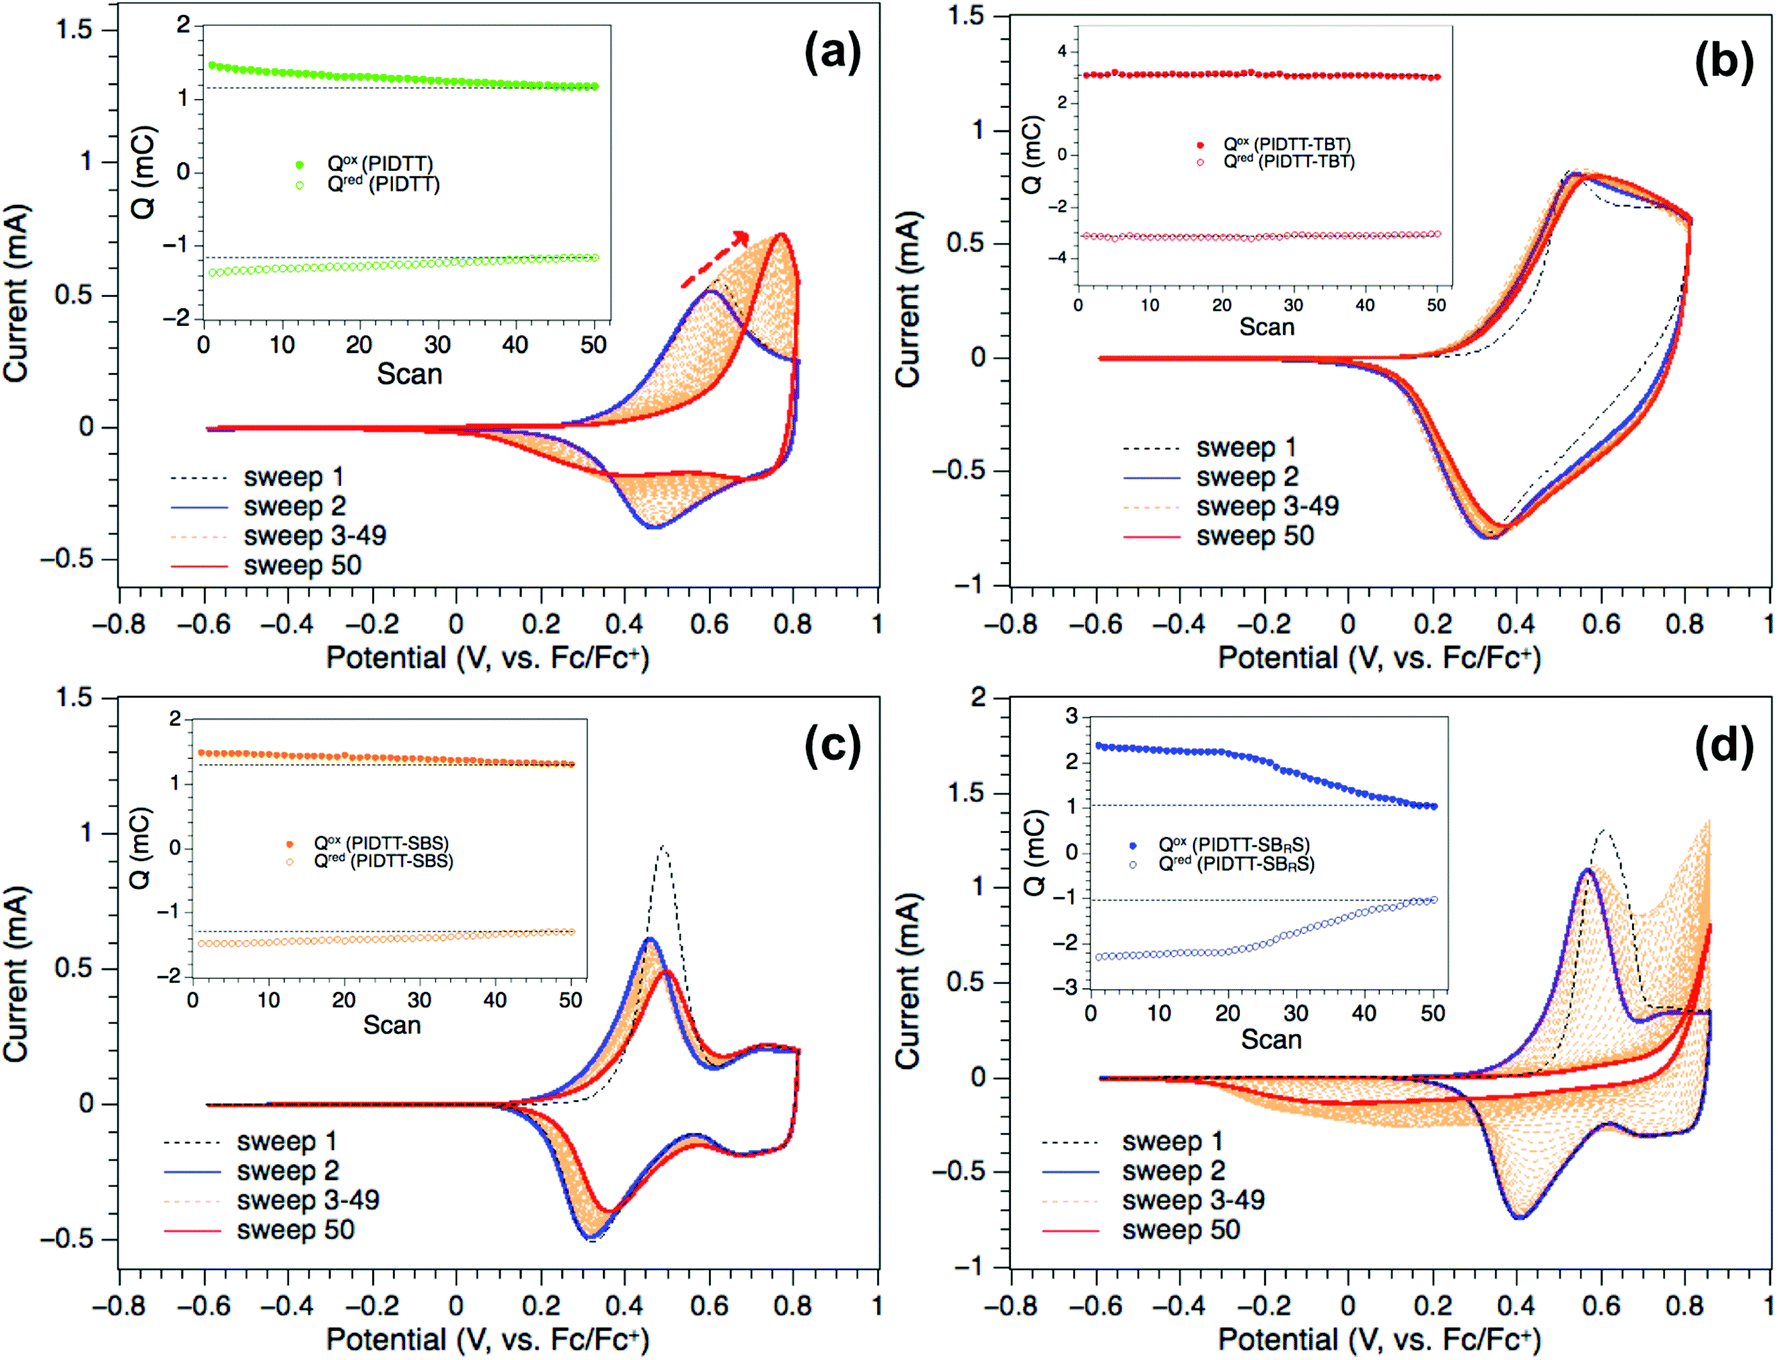
The electrochemical stabilities of the polymers were tested as solid-state films, which were prepared by drop-casting onto a Pt wire as the working electrode. Their cyclic voltammetry (CV) traces were recorded in the full anodic and cathodic potential ranges and are depicted in Fig. S9 (ESI†). Since the electrochemical reversibility is the main criterion for the stability, the anodic oxidation of the films and their cathodic reduction during the reverse scan were recorded at increasing scan rates, starting from 15 mV s−1 to 400 mV, which corresponds to 1.75 s switching time between the oxidised (at 0.7 V vs. Fc/Fc+) and neutral state (at 0 V vs. Fc/Fc+) at the highest scan rate. The recorded CV traces at variable scan rates are shown in Fig. 2 and further in Fig. S10 (ESI†).
 | ||
| Fig. 2 Scan rate dependence of the polymer films (a) PIDTT, (b) PIDTT-TBT, (c) PIDTT-SBS and (d) PIDTT-SBRS at the scan rates 15, 30, 50, 75, 100, 125, 150, 175, 200, 225, 250, 275 and 300 mV s−1, each. The scan rates were gradually increased from 15 to 400 mV s−1. Due to the scatter at higher scan rates the last CV traces at 325–400 mV s−1 are not shown here and instead moved to Fig. S10 (ESI†). | ||
Fig. 3 shows the recorded anodic (Iox) and cathodic peak currents (Ired) and their calculated charges as a function of the scan rate. Two of the polymers, PIDTT and PIDTT-TBT, respond with a linear increase in peak current during the anodic forward and the cathodic reverse scans as the scan rate progresses (Fig. 2a, b and Fig. 3a). PIDTT-SBS exhibits a linear correlation during the anodic forward scans, while the linearity during the cathodic reverse scans is maintained only up to 200 mV s−1 indicating broadening effects and drifts in the peak currents during the progressing scan rates (Fig. 2c and Fig. 3a). These effects become more pronounced when the central acceptor unit is functionalised with the dodecyloxy side chains in PIDTT-SBRS (Fig. 2d), resulting in a non-linear response of the peak currents at scan rates above 100 mV s−1 (Fig. 3a). This is reflected in the relative intensities of the peak currents (Ired/Iox) being far below the ideal value of 1.0 (Fig. 3b), thus displaying PIDTT-SBRS as considerably less reversible than the other three polymers in this study. As shown in Fig. 3b, we also conclude that the electrochemical reversibility of the polymers during the anodic sweeping follows the order PIDTT > PIDTT-TBT > PIDTT-SBS > PIDTT-SBRS.
 | ||
| Fig. 3 (a) Peak currents of the polymer films PIDTT (green), PIDTT-TBT (red), PIDTT-SBS (orange) and PIDTT-SBRS (blue) recorded at the scan rates 15, 30, 50, 75, 100, 125, 150, 175, 200, 225, 250, 275, 300, 325, 350, 375 and 400 mV s−1. The filled and empty squares indicate the anodic and cathodic peak currents, respectively. (b) Relative intensities of the anodic (Iox) and cathodic peak currents (Ired) at the selected scan rates. (c) Calculated charges (Q) during the anodic (filled squares) and cathodic (empty squares) scans and (d) their relative intensities (Qred/Qox) at the selected scan rates. The arrows indicate the direction of the experimental progress starting from the lowest scan rate. | ||
A much clearer insight into the electrochemical stability during the anodic sweeping at variable scan rates is provided in Fig. 3c, which shows the calculated charges during the charge (Qox) and discharge (Qred) processes, while the scan rate dependences of their relative intensities (Qred/Qox) are illustrated in Fig. 3d. As shown in Fig. 3c all polymer films exhibit an almost symmetrical charge (p-doping, Qox) and discharge (de-doping, Qred) response over the entire range of scan rates showing the highest charges between 50 and 125 mV s−1. After reaching the maxima, the charges in the PIDTT, PIDTT-TBT and PIDTT-SBS films slowly decrease and stabilise during the progressive scan rates, whereas the PIDTT-SBRS film shows here a fast decrease and substantial charge difference between the maximum and the plateau at 400 mV s−1. The relative intensities of the calculated charges (Qred/Qox) during anodic charge–discharge processes, as function of the progressing scan rate, are close to 1.0 for all polymers indicating that the films were not irreversibly oxidised (Fig. 3d). At increased scan rates (150–400 mV s−1) the Qred/Qox values deviate only by 1% from the ideal value of 1.0 for PIDTT, PIDTT-TBT and PIDTT-SBS but for PIDTT-SBRS it gradually decreases up to 4% (Fig. 3d), indicative for gradual loss in charges during fast anodic oxidation. It is likely that the solubilizing dodecyloxy side chains reduce the close π–π stacking of PIDTT-SBRS backbones, which results in domains in the prepared films and hence makes the polymer susceptible for an electrochemical charge trapping. As such, the p-doped domains are not discharged entirely during the anodic reverse scan.45 This effect appears more clearly in the cycling stability of the film. After 50 consecutive cycles, the anodic oxidation of PIDTT-SBRS almost disappeared resulting in a broad cathodic reduction wave during the reverse scan (Fig. 4d). However, the almost symmetrical shape of the anodic charge (Qox) and discharge (Qred) curves during the progressing number of scans (Fig. 4d, inset) suggest no irreversible oxidation of the film. The calculated anodic charges Qox and Qred slowly decrease between cycle numbers 1 and 20, and drop more steadily after the 20 cycles reaching half their initial values after 50 cycles. We conclude that during the multiple electrochemical cycling of PIDTT-SBRS the gradual charge trapping reached saturation in the film, which is reflected in the steady decrease in the charges after 20 cycles, the 50% charge difference between the first and the last cycle and the strong broadening effects in the CV traces.
 | ||
| Fig. 4 50 consecutive cyclic voltammetry sweeps of the anodic oxidation of (a) PIDTT, (b) PIDTT-TBT, (c) PIDTT-SBS and (d) PIDTT-SBRS films at a scan rate of 100 mV s−1. All films exhibit the typical “memory effect” of conducting polymers (first scan effect, sweep 1 in a–d, see also Fig. S11, ESI†).46 The calculated anodic charges during the forward (solid symbols) and reverse scans (empty symbols) at the respective scan number are shown in the insets. | ||
In comparison, the PIDTT and PIDTT-TBT films revealed to be the most stable candidates (Fig. 4a, b and their insets). Specifically for PIDTT-TBT, almost no change in the peak positions nor in the current values were observed after 50 potentiometric sweeps (Fig. 4b). The calculated charges of the PIDDT-TBT film during the p-doping and the de-doping remained remarkably stable over 50 consecutive scans (Fig. 4b, inset). Similar stability was obtained for the PIDTT homopolymer only after 40 cycles (Fig. 4a, inset). PIDTT-SBS showed a drop in the peak currents after 50 cycles (Fig. 4c), which is attributed to the leaching effects as the electrolyte solution turned slightly red with progressing number of potentiometric sweeps. However, the relative intensity between the charge–discharge values (Fig. 4c, inset) remained unchanged after 50 scans indicating an excellent stability of the polymer itself.
More interestingly, PIDTT showed a progressing drift of the anodic wave toward a higher positive potential with a systematic increase in the peak current values during the 50 cycles (Fig. 4a). The cathodic wave during the reverse scan resulted in a broadened de-doping shape. Opposite to the PIDTT-SBRS film, the quasi-reversibility of the PIDTT film could be restored after 50 oxidative scans, when the same film was subsequently swept in the full potential range from −2.5 to 0.8 V vs. Fc/Fc+ (see Fig. S12, ESI†). Here, the trapped charges in the PIDTT homopolymer were fully discharged under anodic conditions, which could not be observed in the PIDTT-SBRS film.
For the electrochromic characterization, the polymers were spray-coated onto an ITO-glass substrate as the electrochemical working electrode (see the Experimental section for details). The electrochromic transitions were measured at constant intervals of 0.1 V between 0 and 1.0 V, and the resulting spectra are shown in Fig. 5. The red lines represent the absorption of the neutral polymers, the blue lines correspond to the spectra measured at 1.0 V and the black lines to those measured at intermediate potentials. The spectra of the neutral polymers on ITO-glass are closely similar to those prepared by spin-coating (see Fig. 1b), with minor discrepancies in the relative peak intensities, which we attribute to a slightly different stacking of the polymer chains in the spray-coated films. The general observation is that the visible absorption is decreased and a new absorption band in the near-infrared (NIR) region is formed upon oxidation to 1.0 V in all four polymers. In the case of PIDTT, the narrow visible band extinguished already at 0.8 V but the intensity of the absorption at ∼920 nm increased further up to a potential of 1.0 V, as illustrated with the black arrows in Fig. 5a. This corresponds to a redshift by 370 nm from 0 to 1.0 V. For the three copolymers, the broad visible absorption diminished at 0.8 V for PIDTT-TBT (Fig. 5b), and an even lower voltage of 0.6 V for PIDTT-SBS (Fig. 5c) and 0.7 V for PIDTT-SBRS (Fig. 5d). The newly formed low-energy absorption band redshifted further upon increasing the potential, and eventually fell out of the measured spectral range at 1.0 V for all three copolymers.
 | ||
| Fig. 5 Electrochromic spectra of (a) PIDTT (b) PIDTT-TBT (c) PIDTT-SBS and (d) PIDTT-SBRS thin films, as measured by increasing the voltage from 0.0 V (red line) to 1.0 V (blue line) vs. Fc/Fc+. The arrows represent changes in absorption upon oxidation. The insets show the corresponding a*b* colour coordinates at increasing voltage from 0.0 V (red symbol) to 1.0 V (blue symbol). | ||
The insets in Fig. 5 depict the colour coordinates of the polymer films in the Commission internationale de l’éclairage (CIE) L*a*b* colour space, where a* describes the red-green balance (+a* is the direction of red and −a* is the direction of green) and b* represents the yellow-blue balance (+b* is the direction of yellow and −b* is the direction of blue).47 The distance from the origin indicates the colour vibrancy, while L* represents the third dimension corresponding to the lightness of the colour (a range between 0 = black and 100 = diffuse white). The colour coordinates are summarized in Table 1 for the neutral and fully oxidized polymers at 0 and 1.0 V, respectively. Colour chroma (C*ab) is an indication of the overall hue of the colour, i.e., the magnitude of the vector in the (a*, b*) plane, and is given by eqn (1). A low value of C*ab thus corresponds to a colour-neutral polymer film with equal contribution of a* and b* components.30
 | (1) |
| Polymer | Neutral state | Oxidized state | ||||||
|---|---|---|---|---|---|---|---|---|
| L* | a* | b* | C*ab | L* | a* | b* | C*ab | |
| PIDTT | 63.4 | 74.1 | 14.8 | 75.6 | 84.5 | 0.1 | −4.2 | 4.2 |
| PIDTT-TBT | 43.4 | −2.7 | −3.5 | 4.5 | 84.1 | −2.9 | −3.4 | 4.5 |
| PIDTT-SBS | 42.6 | 1.2 | −11.7 | 11.8 | 87.0 | −2.4 | −2.5 | 3.5 |
| PIDTT-SBRS | 53.1 | 6.2 | −13.4 | 14.8 | 84.6 | −1.0 | −2.4 | 2.6 |
As an effect of the narrow absorption band in the visible region, neutral PIDTT has a vibrant red colour, which upon oxidation rapidly turns into an essentially colour-neutral transparent state (Fig. 5a). The residual tint in the direction of blue is a typical characteristic of conjugated polymers due to a weak absorption in the long wavelength, far red/NIR part of the visible spectrum.48 The PIDTT-TBT, PIDTT-SBS and PIDTT-SBRS films were coated to different optical densities, but they have almost identical colour-neutral transmissive states at 1.0 V (Fig. 5b–d, Table 1). A significant difference between the three copolymers is that PIDTT-TBT is equally colourless in its neutral state and only the lightness, L*, is changed from a strongly absorbent dark grey/black to transparent. PIDTT-SBS and PIDTT-SBRS show broad absorption profiles but the neutral dark/black film of PIDTT-SBS has a blue tint, while the colour of PIDTT-SBRS film is more distinguishable purple ascribable to the dodecyloxy side chain functionalities. The achieved colouration for the three copolymers were in line with expectations of the molecular design, thereby confirming that the donor–acceptor motif is a successful strategy to produce narrow band gap copolymers effectively covering the visible spectrum. Considering that all four polymers approach full transparency when oxidized, they fill slightly different niches. PIDTT would have to be used in blends with other copolymers to achieve a black film, but it could also be used as a source of single switchable colour. The copolymers, on the other hand, are applicable for strongly absorbing-to-transparent switching without the need of blending with another low band gap polymer, thus eliminating the possible source of degradation.
A key aspect of electrochromic polymers is the speed and stability of their colour change, i.e., their kinetics. Fig. 6 shows the switching kinetics of the four polymers at the wavelength with highest change in transmittance (ΔT%) between the neutral and oxidized states. The potentials used vary for the polymers and were chosen after a series of measurements with increasing potentials, shown in Fig. S13 (ESI†), where the highest potentials not resulting in obvious degradation are presented. For PIDTT and PIDTT-TBT, the maximum optical contrast was obtained at a potential range of 0–0.8 V vs. Fc/Fc+. For PIDTT-SBS and PIDTT-SBRS, even lower potential ranges of 0–0.6 and 0–0.7 V vs. Fc/Fc+ were used, respectively. PIDTT represents a maximum optical contrast of 64% with complete oxidation of the 10 s square waves (Fig. 6a). The three copolymers exhibit lower maximum contrasts ranging between 44–48% (Fig. 6b–d). In all cases, the performance is closely maintained for the 2.5 s waves, but any further increase of the switching speed resulted in significant loss of contrast. This can be explained by a closer investigation of the 10 s step potentials in Fig. S14 (ESI†), which reveals that PIDTT reaches 95% of the maximum electrochemical contrast just under 2 s during oxidation. PIDTT-TBT, PIDTT-SBS and PIDTT-SBRS reach the same relative contrast in a 2–3 s timeframe. The oxidation steps thus limit the switching kinetics of the polymers, as the reduction back to their neutral state takes less than a second. This conclusion is further supported by the observed (minor) drop in the relative charge/discharge of the polymers at the fastest CV scan rate 400 mV s−1 requiring full redox switch in 1.75 s (see Fig. 3d). The only exception is PIDTT-SBS, which requires longer time to switch from the oxidized state to the neutral state, and is in good agreement with the observed sub-linear scan rate dependency of the cathodic CV reduction at scan rates higher than 200 mV s−1 (Fig. 3a, orange empty squares). Although leaching of the spray-coated polymer film over time cannot be excluded as the reason, we did not observe similar colouration of the electrolyte solution as in the case of drop-cast PIDTT-SBS film in the CV experiments (see Fig. 4c and related discussion). The PIDTT-SBRS film, on the other hand, exhibited lower optical stability compared the other polymers in this study, as can be seen from the drift of the baseline in Fig. 6d. Such undesired effect in the performance when changing from the PIDTT-TBT and PIDTT-SBS films to the PIDTT-SBRS film must be related to the poor electrochemical reversibility already at 100 mV s−1 (Fig. 3a, blue squares), and moreover to the charge trapping in the film due to the dodecyloxy side chain functionalities on the central acceptor (Fig. 4d, inset).
 | ||
| Fig. 6 Kinetic measurements at maximum transmittance difference in the electrochromic spectra for (a) PIDTT, (b) PIDTT-TBT, (c) PIDTT-SBS and (d) PIDTT-SBRS thin films with potentials vs Fc/Fc+. | ||
An excellent electrochemical stability, desired black-to-transparent colouration and relatively fast switching kinetics are specific characteristics of the PIDTT-TBT film. The optical contrast of the polymer is in line with the state-of-the-art black to transmissive polymers and polymer blends, but the significant benefit of PIDTT-TBT is that it remains equally achromatic at both the neutral and oxidized states.30,49 This further confirms the functionality of the newly synthesized polymers for a low-voltage electrochromic operation in this study.
Conclusion
In this work, electrochromic properties of four conjugated polymers were presented. In order to broaden the narrow absorption band of PIDTT homopolymer, three alternating copolymers with donor–acceptor structures were synthesized, incorporating the IDTT unit with three different DAD units in PIDTT-TBT, PIDTT-SBS and PIDTT-SBRS copolymers. All three copolymers exhibited broad absorption over the visible spectral region. PIDTT showed excellent electrochemical stability, which was maintained largely in the PIDTT-TBT and PIDTT-SBS copolymers. However, the dodecyloxy functionalities in PIDTT-SBRS decreased the electrochemical reversibility of the polymer, which was the consequence for charge trapping effects during the electrochemical p-doping. The PIDTT film exhibited a maximum optical contrast ΔT% of 64% within a potential range of 0–0.8 V, showing a rapid change of the characteristic red colour into an achromatic transparent. From the three copolymers, PIDTT-TBT delivered the best electrochromic performance in terms of highest optical contrast of ΔT% of 48%, and achromatic switching between strongly absorbent black and transparent states. All tested polymers could be operated at ultra-low potentials ≤0.8 V to reach full colour switch. These results show the possibility to utilize the IDTT moiety in new type of solution-processable and low-voltage driven electrochromic polymers through an advanced materials design.Experimental section
Material characterization
The 1H NMR spectra of the polymers were recorded on an automated Varian Inova 400 MHz spectrometer. The solvent was 1,1,2,2-tetrachloroethane-d2 (C2D2Cl4) and the chemical shifts are given in δ (ppm) relative to the solvent peak (C2D2Cl4: 1H, 6.00 ppm) in Fig. S1–S4 (ESI†). Gel permeation chromatography (GPC) was carried out on an Agilent PL-GPC 220 integrated high-temperature GPC/SEC system equipped with refractive index and viscometer detectors and 3 sequential PLgel 10 μm MIXED-B LS 300 mm × 7.5 mm columns. The eluent was 1,2,4-trichlorobenzene and the operating temperature was 150 °C. The number-average molecular weights (Mn) were calculated relative to calibration with polystyrene standards (Fig. S5–S8, ESI†). The UV-Vis-NIR absorption of the polymers were measured with a PerkinElmer Lambda 900 UV-Vis-NIR Spectrometer. Measurements in chlorobenzene (CB) solution were done in a 10 × 10 mm quartz cuvette at room temperature. Absorption coefficients were determined as an average of three samples of different concentrations (ca. 0.025 ± 0.005 mg mL−1). The thin-film samples were prepared by spin-coating from solutions of 10 mg mL−1 polymer in CB onto a glass substrate to obtain a film thickness of 50–150 nm, as measured with a KLA-Tencor Alpha-Step D-100 profilometer. Absorption coefficients were determined as an average of 4–5 different samples.Cyclic voltammetry
CV traces were recorded on a Metrohm Multi Autolab instrument in a three-electrode configuration using Pt wires as both the working electrode and the counter electrode, and a freshly activated Ag wire as the Ag/Ag+ pseudoreference electrode. The Ag wire was activated by immersing it in concentrated HCl solution to remove any passivated oxides or other impurities, rinsed with water, acetone and dried prior to the measurements. The pseudoreference electrode was calibrated versus the ferrocene/ferrocenium (Fc/Fc+) redox couple at the end of the measurements. The supporting electrolyte was a 0.1 M solution of tetrabutylammonium hexafluorophosphate (TBAPF6) in anhydrous acetonitrile, which was bubbled with nitrogen prior to each measurement to remove any dissolved oxygen. Polymer films were deposited onto the working electrode by drop-casting from solutions of 10 mg mL−1 polymer in CB using a 200 μL Hamilton pipette. Here, the polymer solutions were drop-cast to the middle of the Pt wire, which was hold in a 45–70° angle to allow each droplet a slow drip back into the vial. During the drop-casting and back-drip along the wire the solvent evaporated and formed a polymer film from the starting point to the end of the wire. Rotating the Pt wire with one hand at the same time while drop-casting with other hand accelerated the procedure and covered the entire Pt surface. Alternatively, deposition of the polymer films on the Pt working electrode can be obtained by submerging the Pt wire into the respective solution and drying under ambient conditions.50The scan rate dependence of each film was recorded at 15, 30, 50, 75, 100, 125, 150, 175, 200, 225, 250, 275, 300, 325, 350, 375 and 400 mV s−1 starting at the lowest scan rate first. For each scan rate experiment, two sweeps were applied and the peak currents were read from the second sweep, each. Each fresh polymer film was pre-swept at 100 mV s−1 prior to the scan rate studies (Fig. S11, ESI†). After each scan rate experiment a waiting time of two minutes was allowed before recording the voltammetry traces at the next increased scan rate. Due to the instrument limitation (strong scatter) scan rates higher than 400 mV s−1 were not recoded. The calculated charges during the cyclic voltammetry experiments were extracted from the “Windower” option of the software Nova 2.1 (Windower, Q+, Q−).
Electrochromic characterization
Electrochromic measurements were done by combining conventional UV-Vis-NIR absorption spectroscopy and square wave electrochemical measurements. Absorption spectroscopy was performed with an Agilent Cary 60 UV-Vis spectrophotometer. The colour coordinates were derived from the absorption spectra using the colour-matching functions of the CIE standard illuminant D65, 2-deg observer and 1976 L*a*b* colour space. Electrochemical measurements were performed with a CH-Instruments 650A Electrochemical Workstation equipped with a three-electrode setup identical to that described for CV. Polymer films were prepared by spray coating from solutions of 1 mg mL−1 polymer in chloroform onto an ITO-glass substrate, replacing the previously used Pt wire as the working electrode. The supporting electrolyte was a 0.1 M solution of TBAPF6 in anhydrous acetonitrile, which was degassed using nitrogen prior to the measurements. A 10 × 10 mm quartz cuvette was used as the electrochemical cell, which enabled simultaneous spectroscopy and voltammetry. The pseudoreference electrode Ag/Ag+ was calibrated against the Fc/Fc+ redox couple, thus allowing comparison of the CV and electrochromic measurements done with two different instruments. The photographs in the TOC figure were taken at the electrochemical cells in situ under ambient light, by Nikon D5300 camera + AF-S DX Micro Nikkor 85 mm f/3.5G ED VR lens (ISO 100, aperture f/22, exposure 1/2 s).Conflicts of interest
There are no conflicts to declare.Acknowledgements
The authors thank Juuso Pietarinen for his contribution to the polymer synthesis, Dr. Andreas Dahlin and Oliver Olsson at Chalmers University of Technology for their help with defining the colour coordinates. The authors gratefully acknowledge funding from the European Community's Seventh Framework Programme (FP7/2007-2013) under Grant Agreement No. 607585 (OSNIRO), the Swedish Research Council, the Swedish Research Council Formas, the Wallenberg Foundation and Flinders University. S. E. and M. A. thank the Australian Government for the Australian Research Council's Discovery Projects funding (project DP160102356).References
- J. Jensen, M. Hösel, A. L. Dyer and F. C. Krebs, Adv. Funct. Mater., 2015, 25, 2073–2090 CrossRef CAS.
- J. Remmele, D. E. Shen, T. Mustonen and N. Fruehauf, ACS Appl. Mater. Interfaces, 2015, 7, 12001–12008 CrossRef CAS PubMed.
- W. T. Neo, Q. Ye, S.-J. Chua and J. Xu, J. Mater. Chem. C, 2016, 4, 7364–7376 RSC.
- R. J. Mortimer, Annu. Rev. Mater. Res., 2011, 41, 241–268 CrossRef CAS.
- G. Gunbas and L. Toppare, Chem. Commun., 2012, 48, 1083–1101 RSC.
- L. Beverina, G. A. Pagani and M. Sassi, Chem. Commun., 2014, 50, 5413–5430 RSC.
- K. Cao, D. E. Shen, A. M. Österholm, J. A. Kerszulis and J. R. Reynolds, Macromolecules, 2016, 49, 8498–8507 CrossRef CAS.
- X. Lv, W. Li, M. Ouyang, Y. Zhang, D. S. Wright and C. Zhang, J. Mater. Chem. C, 2017, 5, 12–28 RSC.
- S. Hellström, P. Henriksson, R. Kroon, E. Wang and M. R. Andersson, Org. Electron., 2011, 12, 1406–1413 CrossRef.
- R. Stalder, J. Mei, J. Subbiah, C. Grand, L. A. Estrada, F. So and J. R. Reynolds, Macromolecules, 2011, 44, 6303–6310 CrossRef CAS.
- H. Xie, M. Wang, L. Kong, Y. Zhang, X. Ju and J. Zhao, RSC Adv., 2017, 7, 11840–11851 RSC.
- H. Gu, S. Ming, K. Lin, S. Chen, X. Liu, B. Lu and J. Xu, Electrochim. Acta, 2018, 260, 772–782 CrossRef CAS.
- J. Y. Lee, S.-Y. Han, I. Cho, B. Lim and Y.-C. Nah, Electrochem. Commun., 2017, 83, 102–105 CrossRef CAS.
- X. Cheng, X. Ju, H. Du, Y. Zhang, J. Zhao and Y. Xie, RSC Adv., 2018, 8, 23119–23129 RSC.
- A. Kumar, D. M. Welsh, M. C. Morvant, F. Piroux, K. A. Abboud and J. R. Reynolds, Chem. Mater., 1998, 10, 896–902 CrossRef CAS.
- A. M. Osterholm, D. E. Shen, J. A. Kerszulis, R. H. Bulloch, M. Kuepfert, A. L. Dyer and J. R. Reynolds, ACS Appl. Mater. Interfaces, 2015, 7, 1413–1421 CrossRef CAS PubMed.
- A. L. Dyer, E. J. Thompson and J. R. Reynolds, ACS Appl. Mater. Interfaces, 2011, 3, 1787–1795 CrossRef CAS PubMed.
- J. F. Ponder, A. M. Österholm and J. R. Reynolds, Chem. Mater., 2017, 29, 4385–4392 CrossRef CAS.
- P. M. Beaujuge, C. M. Amb and J. R. Reynolds, Adv. Mater., 2010, 22, 5383–5387 CrossRef CAS PubMed.
- J. A. Kerszulis, C. M. Amb, A. L. Dyer and J. R. Reynolds, Macromolecules, 2014, 47, 5462–5469 CrossRef CAS.
- A. A. Argun, P.-H. Aubert, B. C. Thompson, I. Schwendeman, C. L. Gaupp, J. Hwang, N. J. Pinto, D. B. Tanner, A. G. MacDiarmid and J. R. Reynolds, Chem. Mater., 2004, 16, 4401–4412 CrossRef CAS.
- C. M. Amb, J. A. Kerszulis, E. J. Thompson, A. L. Dyer and J. R. Reynolds, Polym. Chem., 2011, 2, 812–814 RSC.
- E. Poverenov, N. Zamoshchik, A. Patra, Y. Ridelman and M. Bendikov, J. Am. Chem. Soc., 2014, 136, 5138–5149 CrossRef CAS PubMed.
- S. Mi, J. Wu, J. Liu, J. Zheng and C. Xu, Org. Electron., 2015, 23, 116–123 CrossRef CAS.
- S. Ming, S. Zhen, K. Lin, L. Zhao, J. Xu and B. Lu, ACS Appl. Mater. Interfaces, 2015, 7, 11089–11098 CrossRef CAS PubMed.
- J. Liu, M. Li, J. Wu, Y. Shi, J. Zheng and C. Xu, Org. Electron., 2017, 51, 295–303 CrossRef CAS.
- X. Xing, C. Wang, X. Liu, L. Qin, E. Wang and F. Zhang, Electrochim. Acta, 2017, 253, 530–535 CrossRef CAS.
- S. Goker, S. O. Hacioglu, G. Hizalan, E. Aktas, A. Cirpan and L. Toppare, Macromol. Chem. Phys., 2017, 218, 1600544 CrossRef.
- Z. Xu, L. Kong, Y. Wang, B. Wang and J. Zhao, Org. Electron., 2018, 54, 94–103 CrossRef CAS.
- L. R. Savagian, A. M. Österholm, D. E. Shen, D. T. Christiansen, M. Kuepfert and J. R. Reynolds, Adv. Opt. Mater., 2018, 6, 1800594 CrossRef.
- J. Padilla, V. Seshadri, T. F. Otero and G. A. Sotzing, J. Electroanal. Chem., 2007, 609, 75–84 CrossRef CAS.
- J. Jensen, M. V. Madsen and F. C. Krebs, J. Mater. Chem. C, 2013, 1, 4826–4835 RSC.
- S. Guan, A. S. Elmezayyen, F. Zhang, J. Zheng and C. Xu, J. Mater. Chem. C, 2016, 4, 4584–4591 RSC.
- X. Xu, P. Cai, Y. Lu, N. S. Choon, J. Chen, B. S. Ong and X. Hu, Macromol. Rapid. Commun., 2013, 34, 681–688 CrossRef CAS PubMed.
- X. Xu, Z. Li, O. Bäcke, K. Bini, D. I. James, E. Olsson, M. R. Andersson and E. Wang, J. Mater. Chem. A, 2014, 2, 18988–18997 RSC.
- H. Chen, M. Hurhangee, M. Nikolka, W. Zhang, M. Kirkus, M. Neophytou, S. J. Cryer, D. Harkin, P. Hayoz, M. Abdi-Jalebi, C. R. McNeill, H. Sirringhaus and I. McCulloch, Adv. Mater., 2017, 29, 1702523 CrossRef PubMed.
- S. Tang, P. Murto, X. Xu, C. Larsen, E. Wang and L. Edman, Chem. Mater., 2017, 29, 7750–7759 CrossRef CAS.
- Z. Fei, F. D. Eisner, X. Jiao, M. Azzouzi, J. A. Röhr, Y. Han, M. Shahid, A. S. R. Chesman, C. D. Easton, C. R. McNeill, T. D. Anthopoulos, J. Nelson and M. Heeney, Adv. Mater., 2018, 30, 1705209 CrossRef PubMed.
- P. M. Beaujuge, S. Ellinger and J. R. Reynolds, Adv. Mater., 2008, 20, 2772–2776 CrossRef CAS PubMed.
- U. Koldemir, K. R. Graham, D. H. Salazar, T. D. McCarley and J. R. Reynolds, J. Mater. Chem., 2011, 21, 6480–6482 RSC.
- E. Poverenov, N. Zamoshchik, A. Patra, Y. Ridelman and M. Bendikov, J. Am. Chem. Soc., 2014, 136, 5138–5149 CrossRef CAS PubMed.
- P. M. Beaujuge and J. R. Reynolds, Chem. Rev., 2010, 110, 268–320 CrossRef CAS PubMed.
- S.-H. Chan, C.-P. Chen, T.-C. Chao, C. Ting, C.-S. Lin and B.-T. Ko, Macromolecules, 2008, 41, 5519–5526 CrossRef CAS.
- P. Murto, S. Tang, C. Larsen, X. Xu, A. Sandström, J. Pietarinen, B. Bagemihl, B. A. Abdulahi, W. Mammo, M. R. Andersson, E. Wang and L. Edman, ACS Appl. Energy Mater., 2018, 1, 1753–1761 CrossRef CAS.
- J. Heinze, B. A. Frontana-Uribe and S. Ludwigs, Chem. Rev., 2010, 110, 4724–4771 CrossRef CAS PubMed.
- B. Villeret and M. Nechtschein, Phys. Rev. Lett., 1989, 63, 1285–1287 CrossRef CAS PubMed.
- J. Schanda, in Colorimetry: Understanding the CIE System, ed. J. Schanda, John Wiley & Sons, Inc., Hoboken, NJ, 2007, pp. 25–78 Search PubMed.
- K. L. Cao, D. E. Shen, A. M. Osterholm, J. A. Kerszulis and J. R. Reynolds, Macromolecules, 2016, 49, 8498–8507 CrossRef CAS.
- Q. Zhang, C.-Y. Tsai, T. Abidin, J.-C. Jiang, W.-R. Shie, L.-J. Li and D.-J. Liaw, Polym. Chem., 2018, 9, 619–626 RSC.
- J. M. Bjuggren, A. Sharma, D. Gedefaw, S. Elmas, C. Pan, B. Kirk, X. Zhao, G. Andersson and M. R. Andersson, ACS Appl. Energy Mater., 2018, 1, 7130–7139 CrossRef CAS.
Footnotes |
| † Electronic supplementary information (ESI) available: Polymer synthesis and characterization, 1H NMR spectra, GPC traces, additional electrochemical characterization and additional kinetic measurements. See DOI: 10.1039/c8py01787e |
| ‡ These authors contributed equally to this work. |
| This journal is © The Royal Society of Chemistry 2019 |