XPS studies on dispersed and immobilised carbon nitrides used for dye degradation
Received
26th March 2019
, Accepted 28th May 2019
First published on 5th June 2019
Abstract
Liquid phase adsorption is a common technique in waste water purification. However, this process has some downsides. The removal of environmentally harmful contaminants from organic liquids by adsorption produces secondary waste which has to be treated afterwards. The treatment can be e.g. high temperatures or a landfill. Photocatalysts such as CN6 can remove the dye under light irradiation but most times they have to be separated afterwards. Immobilisation of these photocatalysts can be one way to address this problem. The resulting photocatalyst layers were analysed in operando by near-ambient pressure XPS. This enabled us to detect the active species, i.e. oxygen radicals, at the surface, responsible for the dye degradation.
1 Introduction
Pollutions which are caused by the effluents discharged from industrial plants are often harmful to health and the environment. Dye-containing wastewater discharged by plants (e.g. cosmetic, food, paper, plastic and textile) is one major source of environmental pollution.1 The amount of dye lost is dependent upon the class of dye application used, varying from only 2% loss when using basic dyes to a 50% loss when certain reactive dyes are used.2 Removal of dyes from industrial waste-water has therefore received increasing attention and various methods have been investigated, e.g. adsorption, filtration, and electrochemical or photochemical techniques. Among these methods adsorption, e.g. using activated carbon,3 carbon nanotubes4 or superabsorbent hydrogels5 as adsorbers, is widely used. The problem is that adsorption techniques produce secondary waste,6 the contaminated adsorber which has to be treated afterwards, e.g. by high temperatures, to remove the contaminant. TiO2 has been investigated as a photocatalyst for the removal of dyes from aqueous solutions for many years7 but it works only under UV light. For adsorption and photocatalysis, materials with high surface area are desirable, because both phenomena take place on the surface of the catalyst.8 In literature mixed systems of active carbon and TiO2 have shown a substantial synergy effect, which can be explained by a mass transfer of the pollutant from the adsorber, e.g. AC, to the photocatalyst, e.g. TiO2.8–12 Recently, metal free, polymeric carbon nitrides were explored for the degradation of dyes.13 In particular, mesoporous carbon nitrides have a large surface area which should deal with limitations such as low adsorption of the pollutants and therefore low capability of treating high volumes of polluted waste-water. We have evaluated the ability to deposit these carbon nitrides onto stainless steel plates as supports with two different methods. As the first method we used the electrophoretic deposition (EPD) and studied the impact of EPD parameters. For the second method, the catalyst was immobilised with a binder according to a patented procedure. Afterwards, the photocatalytic degradation of the cationic dye methylene blue (MB) was investigated which is often used in literature as a model substance.8–11
2 Experimental
2.1 Chemicals
We used mesoporous carbon nitride as the photocatalyst in all investigations (see section 2.2). In EPD, iodine (99.99%, Sigma-Aldrich) was used to increase the conductivity and acetone (99.5%, Sigma-Aldrich) as the solvent. For the binder method, Levasil 200/30 (30% active content, Obermeier), tetraethylorthosilicate (TEOS, 98%, Sigma-Aldrich), 1-propanol (99,5%, Roth), as a solvent, and hydrochloric acid (HCl, 37%, VWR International) were used.
2.2 Photocatalyst preparation
Mesoporous graphitic carbon nitride, mpg-SG-CN-6 (abbreviated as CN6), was prepared using a published procedure.14 Cyanamide (CA), used as the carbon nitride precursor, was mixed with TEOS, used as the silica template (1![[thin space (1/6-em)]](https://www.rsc.org/images/entities/char_2009.gif) :
:![[thin space (1/6-em)]](https://www.rsc.org/images/entities/char_2009.gif) 6 molar ratios of TEOS
6 molar ratios of TEOS![[thin space (1/6-em)]](https://www.rsc.org/images/entities/char_2009.gif) :
:![[thin space (1/6-em)]](https://www.rsc.org/images/entities/char_2009.gif) CA). After aging at 80 °C, the composites are thermally treated at 550 °C to obtain the carbon nitride silica composites. Finally, carbon nitride, CN6, is obtained by the removal of silica using NH4HF2 solution.15
CA). After aging at 80 °C, the composites are thermally treated at 550 °C to obtain the carbon nitride silica composites. Finally, carbon nitride, CN6, is obtained by the removal of silica using NH4HF2 solution.15
The synthesis of covalent triazine frameworks (CTFs) has been described elsewhere.16–21 In principle, networks are formed by trimerisation of dicyanocompounds in salt melts, namely zinc chloride, at high temperatures (e.g., ≥400 °C). 1,4-Dicyanobenzene as monomer yields a crystalline framework denoted as CTF-1.
2.3 Immobilisation
2.3.1 EPD.
In a typical experiment, CN6 (e.g. 30 mg), iodine (e.g. 20 mg) and 50 ml of acetone were added to a 100 ml beaker with a sufficiently large volume/cross-sectional area. The solution was then treated in an ultrasonic bath. Afterwards, the beaker containing the solution was placed in the EPD unit. One 3.5 cm × 3.5 cm stainless steel plate to be coated with the photocatalyst was connected as the counter electrode, while a second 3.5 cm × 3.5 cm stainless steel plate was connected as the working electrode. Furthermore, both electrodes were connected to the potentiostat in order to measure the current intensity curve over the deposition time. The applied potential for the deposition was 10 V. After the end of the deposition time, e.g. 5 minutes, the electrodes were removed from the solution and the coated plate was dried at 60 °C for two hours in an oven. The resulting plate is shown in Fig. 1a.
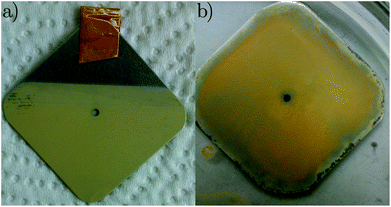 |
| | Fig. 1 Stainless steel supported carbon nitride (a) with EPD and (b) with binder. | |
2.3.2 Sol–gel method.
The immobilisation of CN6 with binder was carried out according to ref. 29. TEOS was placed in abeaker and Levasil 200/30 was added slowly under stirring. A quantity of concentrated hydrochloric acid and 2-propanol were then added as well. The beaker was sealed with parafilm and further stirred for 24 minutes. The solution was cooled in the refrigerator for 4 hours. The CN6 photocatalyst and 1-propanol were added, the whole mixture was stirred on the magnetic stirrer for 30 minutes and treated in ultrasound for 10 minutes. The final solution was evenly distributed over the stainless steel plate using a brush. Afterwards, the plates were dried at 80 °C and are shown in Fig. 1b.
2.4 XPS measurements
EnviroESCA (Electron Spectroscopy for Chemical Analysis under Environmental Conditions) of CN6 films was carried out with support of SPECS Surface Nano Analysis GmbH (13355 Berlin, Germany). Samples were measured under nitrogen atmosphere with 1 mbar gas pressure. Prior to the XPS (X-ray Photoelectron Spectroscopy) experiments, the CN6 powders were immobilised on nickel supports (see section 3.1). For immobilisation, the standard EPD procedure described in 2.3.1 was used. The electrodes in this case were, a fluorinated tinoxide (FTO) counter electrode and a nickel sheet. Particles were deposited on the cathode, in this case the nickel sheet, while the FTO counter electrode remained almost free of particles. The presence of nitrogen, ionised by X-ray radiation, helped compensating surface charging and resulted thereby in reliable assignment of photoelectron peak signals to the respective bonding state (and binding energy, respectively). Samples with adsorbed methylene blue were, firstly, exposed to an 18 mbar water vapor pressure and measured in the dark. Subsequently, an LED light source was employed for irradiation of the films, providing light with photon energy in the visible range, i.e. in the absorption range of CN6, and measured under approximately 3 mbar gas pressure. For X-ray excitation of photoelectrons, a monochromatised Al Kα X-ray source was used. For the signals of nitrogen (N 1s) and carbon (C 1s) full-width half-maximum (FWHM) values of 1.65 eV were used for all peaks.
2.5 Characterisation
SEM micrographs of carbon nitride films were executed to determine the film thickness. EnviroESCA measurements were carried out to determine the chemical composition of the carbon nitride. The zeta potential measurements have been performed with ZetasizerNano ZS using a disposable folded capillary cell from Malvern Instruments.22 Additionally, the characterisation of the carbon nitride powder was carried out as described in ref. 23.
2.6 Adsorption
In order to evaluate the adsorption capacity of different materials, namely active carbon (AC), C3N4, CN6, and CTF, methylene blue (MB) removal from these adsorbent materials in aqueous solution was carried out. For C3N4 and CN6, 50 mg of thephotocatalyst was added into 10 mL of MB solution with different initial concentrations. In case of AC and CTF, 5 mg were used. Then the solution was shaken in the dark for 24 hours. After the adsorption equilibrium had been reached, the dye-loaded AC, C3N4, CN6, and CTF were separated by centrifugation and the residual concentration of MB was determined by UV/Vis spectroscopy. The adsorption capacity of the adsorbent was then calculated using eqn (1):| |  | (1) |
where q refers to the adsorption capacity (mg g−1), c is the concentration of dye solution (mg L−1), V is the volume of dye solution (L) and m is the mass of adsorbent (g).
2.7 Batch reactor
For the experiments in the batch reactor, 50 mg of the photocatalyst and 50 ml of a methylene blue solution at a concentration of 16 mg L−1 were placed in a double jacket vessel. The thermostat was set to 23 °C and the magnetic stirrer to 250 rpm. Using a pipette, 1 ml of the solution was removed immediately after the substances have been added. The reaction vessel was then covered with aluminium foil for 30 minutes. A second sample was taken and the xenon lamp (L.O.T.-Oriel GmbH & Co. KG) with a 395 nm cutoff filter was switched on. After 10, 20, 30, 60 and 120 minutes samples of 1 ml were taken. The setup is shown in Fig. 2.
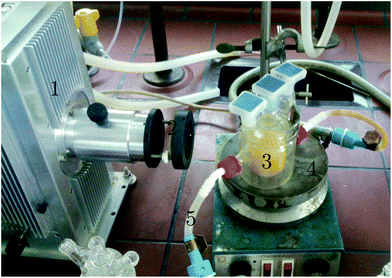 |
| | Fig. 2 Batch reactor setup for dye degradation: 1. xenon lamp, 2. cutoff filter, 3. double jacket vessel, 4. magnetic stirrer and 5. thermostat. | |
2.8 Flow reactor
For the experiment in the flow reactor CN6 was deposited with the binder method on four different stainless steel plates. This operation was performed twice for two plates, and once for the two others. Per deposition 9 mg of CN6 was deposited onto the steel plates. A 12 mg L−1 methylene blue solution was pumped over four plates loaded with CN6. The plates were then irradiated with an LED Array RS 5300LM White (Bridgelux, BXRA-50C5300-H-04) After 10, 20, 30, 60, 120, 180 and 210 minutes a sample was taken and analysed by UV-Vis spectroscopy to monitor the dye degradation. The same procedure was used for the next two consecutive runs. The setup is shown in Fig. 3.
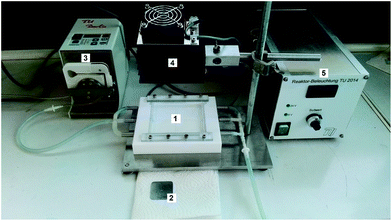 |
| | Fig. 3 Reactor setup for continuous photocatalytic dye degradation: 1. Teflon flow cell, 2. stainless steel plate, 3. peristaltic pump, 4. white light LED, 5. LED control unit. | |
3. Results and discussion
3.1 Immobilisation
EPD parameters were varied in a broad range (see Table 1) to obtain a stable coating. The EPD deposition gave an uniform distribution of particles on the plate and, as a result, an homogenous layer thickness. However, the layer was not mechanically stable under reaction conditions. The sample, produced with the sol–gel approach, on the other hand is mechanically stable under reaction conditions but the layer was not as homogenously distributed as the EPD layer.
Table 1 Varied parameters for EPD
| Parameter |
Specification |
| Deposition time |
1 × 5 min; 2 × 5 min; 3 × 5 min; 10 min |
| Ultrasonic bath |
15–30 min |
| Volume |
50–80 mL |
| Mass iodine |
10–40 mg |
| Mass CN6 |
20–50 mg |
| Sintering temperature |
80–120 °C |
| Sintering time |
1–3 h |
| Solvent |
2-Propanol; acetone; ethanol; hexane; methanol |
3.2 SEM
In Fig. 4a/c the EPD film is shown from the side and top respectively. The film thickness is around 5 μm. In Fig. 4b/d the binder film is shown from the side and top respectively. The film thickness here is around 150 μm. SEM images were acquired in secondary electron mode using a JEOL JSM-7401F high resolution field emission SEM operated at 10 kV.
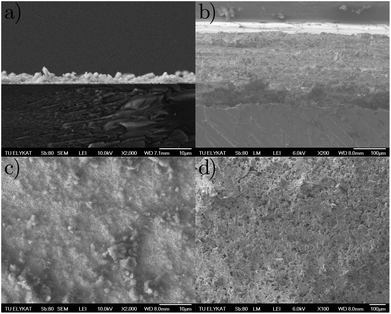 |
| | Fig. 4 SEM micrographs of CN6 immobilised with (a)/(c) EPD and (b)/(d) binder. | |
3.3 XPS
A weak nickel Ni 3d signal, resulting from the support, was detectable for all samples (not shown below). Satellite peaks in the Ni 3d signal suggest the presence of nickel in the form of nickel oxide. In Fig. 5, results for carbon C 1s are shown. The assignment of the peaks, obtained by deconvolution of the measured signal, is based on the differences in electronegativity of carbon (2.55) and nitrogen (3.04). The N–(C)3 signal appears at 285.3 eV binding energy, at the expected position for sp3-hybridised carbon and approximately 2 eV lower than for samples investigated earlier where surface charging could not be compensated.24,25 The result coincides, however, with measurements on ultra-thin g-C3N4, directly synthesised by thermal condensation of dicyandiamide precursors on silicon supports.26 Likewise, the peak to be assigned to C![[double bond, length as m-dash]](https://www.rsc.org/images/entities/char_e001.gif) N–C at 288.4 eV appears 2 eV lower than for samples with surface charging.24,25 Interestingly, the corresponding peak position on ultra-thin g-C3N4 films appears at a higher binding energy of about 289.1 eV pointing to structural deviations caused by the thermal condensation process on silicon supports. Those deviations may consist of stretching of bonds in the course of adaption to the silicon support. An identical shift of about 0.7 eV in the C
N–C at 288.4 eV appears 2 eV lower than for samples with surface charging.24,25 Interestingly, the corresponding peak position on ultra-thin g-C3N4 films appears at a higher binding energy of about 289.1 eV pointing to structural deviations caused by the thermal condensation process on silicon supports. Those deviations may consist of stretching of bonds in the course of adaption to the silicon support. An identical shift of about 0.7 eV in the C![[double bond, length as m-dash]](https://www.rsc.org/images/entities/char_e001.gif) N C signal is observed in the corresponding N 1s spectrum (see below). Furthermore, a third peak at 286.6 eV is observed. It appears highly likely that this peak has to be assigned to C–OH, formed by contact with the ambient, although nominally oxygen-free samples exhibited this peak, too.24 In ref. 25 and 26, this peak is reported as well (for non-oxygen-free samples). It should be noted that further carbon species might contribute to the measured data but are not distinguishable from the peaks indicated in Fig. 5. Among them, so-called adventitious carbon has to be mentioned stemming from the environment (carbon contamination) as well as carboxyl groups, O
N C signal is observed in the corresponding N 1s spectrum (see below). Furthermore, a third peak at 286.6 eV is observed. It appears highly likely that this peak has to be assigned to C–OH, formed by contact with the ambient, although nominally oxygen-free samples exhibited this peak, too.24 In ref. 25 and 26, this peak is reported as well (for non-oxygen-free samples). It should be noted that further carbon species might contribute to the measured data but are not distinguishable from the peaks indicated in Fig. 5. Among them, so-called adventitious carbon has to be mentioned stemming from the environment (carbon contamination) as well as carboxyl groups, O![[double bond, length as m-dash]](https://www.rsc.org/images/entities/char_e001.gif) C–OH, potentially formed by interaction with oxygen from the environment. While the first species has binding energies close to N–(C)3 the latter has binding energies close to C
C–OH, potentially formed by interaction with oxygen from the environment. While the first species has binding energies close to N–(C)3 the latter has binding energies close to C![[double bond, length as m-dash]](https://www.rsc.org/images/entities/char_e001.gif) N–C.
N–C.
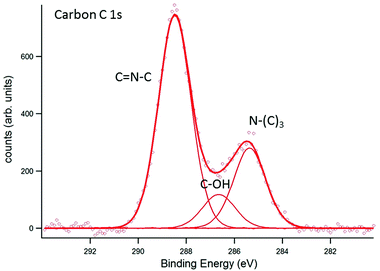 |
| | Fig. 5 EnviroESCA analysis of the carbon C 1s signal. The assignment of the respective carbon species to the CN6 structure is indicated in the figure. Additionally, C–OH bonding near 286.6 eV was detected. | |
In Fig. 6, the corresponding analysis for N 1s is presented. In comparison to the literature,24,25 the peak positions appear at lower binding energies (by about 2 eV), emphasizing that surface charging and an apparent shift of the binding energy could be avoided by EnviroESCA. The C![[double bond, length as m-dash]](https://www.rsc.org/images/entities/char_e001.gif) N–C signal appears at 399.0 eV and the N–(C)3 signal appears at 400.9 eV. Again, the C
N–C signal appears at 399.0 eV and the N–(C)3 signal appears at 400.9 eV. Again, the C![[double bond, length as m-dash]](https://www.rsc.org/images/entities/char_e001.gif) N–C signal is shifted by about 0.7 eV in comparison to ultra-thin films prepared by direct thermal condensation on silicon supports.26 For XPS investigation of the photocatalytic activity of CN6, diluted methylene blue was adsorbed on the surface. The surface color changed thereby from yellow to a visible greenish tone. The low concentration of 20 mg L−1 was chosen to allow sufficient light to pass through the dye and reach the photoactive CN6. As a side-effect, the typical signals of chlorine and sulfur of methylene blue were too low in intensity to be monitored while the main constituents, i.e. carbon and nitrogen, were not clearly distinguishable from CN6. The analysis was therefore restricted to the change of the O 1s signal of oxygen, investigated after water adsorption and subsequently during illumination of the surface. In Fig. 7, the O 1s signal is shown resulting from water vapor present in the XPS analysis chamber and adsorbed to the surface of the sample. With illumination of the sample (Fig. 7b) an additional peak at about 532.7 eV is detected. During consecutive scans, the water O 1s signal decreases (at 3 mbar gas pressure) while the intensity of the additional peak continues to increase slightly. This peak is attributed to OH-species resulting from photoelectrocatalytic dissociation of water in the presence of the catalyst (denoted as OH˙). It should be noted that the decreasing water vapor pressure (from 18 mbar in (a) to 3 mbar in (b)) causes naturally a lower O 1s signal intensity from both water adsorbed on the surface and water present as gas. The signal at about 532.7 eV, however, can only be attributed to species present at the surface of the sample and after illumination was applied.
N–C signal is shifted by about 0.7 eV in comparison to ultra-thin films prepared by direct thermal condensation on silicon supports.26 For XPS investigation of the photocatalytic activity of CN6, diluted methylene blue was adsorbed on the surface. The surface color changed thereby from yellow to a visible greenish tone. The low concentration of 20 mg L−1 was chosen to allow sufficient light to pass through the dye and reach the photoactive CN6. As a side-effect, the typical signals of chlorine and sulfur of methylene blue were too low in intensity to be monitored while the main constituents, i.e. carbon and nitrogen, were not clearly distinguishable from CN6. The analysis was therefore restricted to the change of the O 1s signal of oxygen, investigated after water adsorption and subsequently during illumination of the surface. In Fig. 7, the O 1s signal is shown resulting from water vapor present in the XPS analysis chamber and adsorbed to the surface of the sample. With illumination of the sample (Fig. 7b) an additional peak at about 532.7 eV is detected. During consecutive scans, the water O 1s signal decreases (at 3 mbar gas pressure) while the intensity of the additional peak continues to increase slightly. This peak is attributed to OH-species resulting from photoelectrocatalytic dissociation of water in the presence of the catalyst (denoted as OH˙). It should be noted that the decreasing water vapor pressure (from 18 mbar in (a) to 3 mbar in (b)) causes naturally a lower O 1s signal intensity from both water adsorbed on the surface and water present as gas. The signal at about 532.7 eV, however, can only be attributed to species present at the surface of the sample and after illumination was applied.
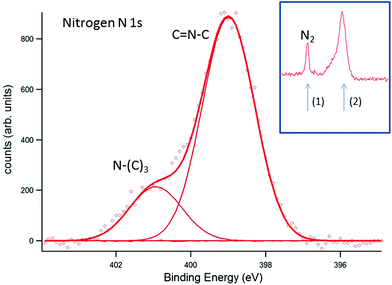 |
| | Fig. 6 EnviroESCA analysis of the nitrogen N 1s signal. The assignment of the respective nitrogen species to the CN6 structure is indicated in the figure. The inset indicates the nitrogen signal, resulting from the nitrogen atmosphere (1), and the signal used for deconvolution (2). | |
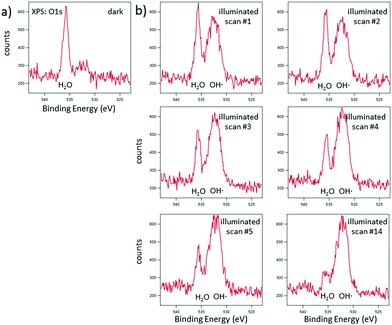 |
| | Fig. 7 EnviroESCA analysis of CN6 films with adsorbed methylene blue after adsorption of water (a) and during consecutive scans (1, 2, 3, 4, 5, and 14) with illumination by visible light (b). | |
3.4. Adsorption experiments
In this work, different materials with different zeta potentials were investigated as adsorbers. Carbon nitride has a negative zeta potential and should therefore have a good adsorption capacity for the cationic MB molecules. To evaluate their adsorption performance towards methylene blue adsorption, their adsorption isotherms were measured as described in the experimental part. The Langmuir and Freundlich isotherms for MB adsorption are presented in Fig. 8.
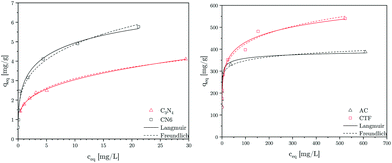 |
| | Fig. 8 Langmuir and Freundlich graphs of C3N4, CN6, CTF, and AC. | |
3.4.1 Langmuir.
Langmuir type behaviour can be expressed by eqn (2):| |  | (2) |
The linearised form of Langmuir isotherm is represented by eqn (3):
| |  | (3) |
where
qm is the maximum adsorption capacity to form a complete monolayer on the surface (mg g
−1) and
kL is the Langmuir constant related to the energy of adsorption (L mg
−1). The values of
qm and
kL can be determined with a
Ce/
qeversus Ce plot, whereby
Ce is the methylene blue concentration in equilibrium. The values of the adsorption capacity, adsorption constant and the correlation coefficient are shown in
Table 2. High values for
kL, a constant which characterises the strength of adsorbate binding to the adsorbent, suggest that MB strongly binds with carbon nitride. This observation is consistent with the zeta potential measurements. The higher value of
qm for CN6 than C
3N
4 can mainly be attributed to the porosity of CN6.
14 Besides,
Table 2 suggests that CTF and AC have a good adsorption capacity for MB. AC is used as a comparative adsorption standard, while CTF is used as material which can have similar photocatalytic properties as CN6.
27 CTF would represent another adsorbent besides the used carbon nitrides that can be used in our concept of regenerating the adsorber by irradiaton with light in the visible range.
Table 2 Langmuir isotherm parameters for the adsorption of MB
| Adsorbent |
q
m [mg g−1] |
k
L [L mg−1] |
R
2 [—] |
| AC |
375.46 |
0.0779 |
0.9782 |
| C3N4 |
4.12 |
0.4225 |
0.9696 |
| CN6 |
5.76 |
1.3002 |
0.9879 |
| CTF |
541.69 |
0.1028 |
0.9943 |
3.4.2 Freundlich.
Freundlich type behaviour can be expressed by eqn (4):| |  | (4) |
The linearised form of Freundlich isotherm is represented by eqn (5):
| |  | (5) |
where
kF is the Freundlich isotherm constant (mg g
−1) and
n the adsorption intensity. The values of
kF and
n can be determined with a log
![[thin space (1/6-em)]](https://www.rsc.org/images/entities/char_2009.gif) qeversus
qeversus log
![[thin space (1/6-em)]](https://www.rsc.org/images/entities/char_2009.gif) Ce
Ce plot, whereby
Ce is the methylene blue concentration in equilibrium. The values of the adsorption intensity, adsorption constant and the correlation coefficient are shown in
Table 3. The value of the constant
n is above 1 for all adsorbents which also indicates a favourable adsorption. Besides, the correlation coefficient for the Freundlich plot of C
3N
4 is higher than the correlation coefficient for the Langmuir plot, meaning that the Freundlich model is a better fit for the experimental results.
Table 3 Freundlich isotherm parameters for the adsorption of MB
| Adsorbent |
k
F [mg g−1] |
n
|
R
2 [—] |
| AC |
249.11 |
13.50 |
0.9369 |
| C3N4 |
1.78 |
4.17 |
0.9937 |
| CN6 |
5.76 |
2.57 |
0.9405 |
| CTF |
200.23 |
6.04 |
0.9833 |
3.5 Reaction kinetics
A first-order kinetic model was used to describe the kinetics of methylene blue degradation and to obtain the values of the apparent constant of degradation. The model is expressed by eqn (6):| |  | (6) |
where r is the reaction rate, c is the concentration and kapp is the apparent first-order rate constant. After linearisation and because of the fact that the absorption is proportional to the concentration eqn (7) follows.| |  | (7) |
In Table 4 it is shown that the apparent rate constant for dispersed (Fig. 9) and immobilised (Fig. 10) CN6 is in good agreement with the used first-order rate mechanism, as the square regression factor is above 0.97. Compared to TiO2 with apparent rate constants of 2 × 10⁻⁴ s−1 (ref. 10 and 11) in the UV and 0.7 × 10⁻⁴ s−1 (ref. 10) under Vis conditions CN6 has a higher reaction rate. In combination with AC and a higher surface area, these TiO2 samples can achieve even higher apparent rate constants than CN6.10 The apparent rate constant is roughly stable over the four, respectively three runs. The loss of activity could be a result of our test procedure because the photocatalytic treatment was stopped after a given time and the degradation was only confirmed by UV/Vis spectroscopy of the solution. Due to that fact, there could still be adsorbing some dye molecules and/or by-products on the surface which need longer time for degradation. In addition, loss of catalyst in the process could be another factor.
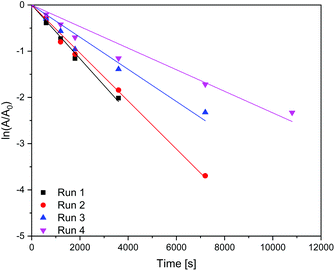 |
| | Fig. 9 Kinetics of the dye degradation on dispersed carbon nitride. | |
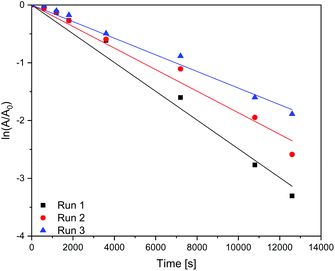 |
| | Fig. 10 Kinetics of the dye degradation on immobilised carbon nitride. | |
Table 4 Apparent first-order rate constants kapp
| Photocatalyst |
Run |
k [10–4 s−1] |
R
2
|
| CN6 – dispersed |
1 |
5.80 |
0.99 |
| 2 |
5.20 |
0.99 |
| 3 |
3.48 |
0.97 |
| 4 |
2.33 |
0.97 |
| |
| CN6 – immobilised |
1 |
2.50 |
0.99 |
| 2 |
1.87 |
0.99 |
| 3 |
1.44 |
0.99 |
3.6 Stability/durability in the flow reactor
The stability of the film was tested in the flow reactor. In consecutive runs the film was dyed with methylene blue and illuminated afterwards. In Fig. 11 two runs are shown. While looking at the reaction kinetics in section 3.5, the stability of the binder film was good and the apparent rate constant was roughly stable. The EPD film on the other hand wasn't stable enough under these conditions.
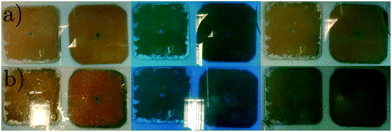 |
| | Fig. 11 Snapshots of the reactor. Two consecutive runs with methylene blue to test the stability of the immobilised carbon nitride under reaction conditions. The left part of the picture shows the before status, the middle part of the picture shows the dyed status and the right part of the picture shows the status after illumination. | |
4 Conclusion
Films of CN6 have been prepared by EPD and a sol–gel approach. For the first time, we show here a clear peak in EnviroESCA measurements of an OH-species resulting from photoelectrocatalytic dissociation of water in the presence of the catalyst (Fig. 7). These OH-radicals are mainly responsible for the oxidation of the organic compounds.28 Besides, to our knowledge, these are the first XPS measurements of carbon nitride powder with the usage of ionised nitrogen to compensate the surface charge. In addition, dye degradation with immobilised carbon nitride photocatalyts was shown (Fig. 11). The degradation of the immobilised as well as the dispersed carbon nitride follows a pseudo first-order kinetic (Fig. 9/10). With regards to the experimental conditions, the apparent rate constants for the degradation are nearly constant for up to four consecutive runs (Table 4). However, this only applies for the sol–gel approach as the EPD film wasn't stable enough under these conditions.
Conflicts of interest
There are no conflicts to declare.
Acknowledgements
The author gratefully acknowledge financial support from the Einstein Foundation (Einstein-Research project 2016-306) and would like to thank Prof. Asscher for the good collaboration in this project. We thank SPECS Surface Nano Analysis GmbH (13355 Berlin, Germany) for the opportunity to measure EnviroESCA of our samples. We thank Benjamin Paul for performing SEM measurements.
References
- T. Wang, K. Kailasam, P. Xiao, G. Chen, L. Chen, L. Wang, J. Li and J. Zhu, Microporous Mesoporous Mater., 2014, 187, 63–70 CrossRef CAS.
-
Colour in Dyehouse Effluent, ed. P. Cooper, Society of Dyers and Colourists, Bradford, 1995 Search PubMed.
- O. Zanella, I. C. Tessaro and L. A. Féris, Chem. Eng. Technol., 2014, 37, 1447–1459 CrossRef CAS.
- S. Li, Y. Gong, Y. Yang, C. He, L. Hu, L. Zhu, L. Sun and D. Shu, Chem. Eng. J., 2015, 260, 231–239 CrossRef CAS.
- R. Bhattacharyya and S. K. Ray, Chem. Eng. J., 2015, 260, 269–283 CrossRef CAS.
- U. G. Akpan and B. H. Hameed, J. Hazard. Mater., 2009, 170, 520–529 CrossRef CAS PubMed.
- P. Reeves, R. Ohlhausen, D. Sloan, K. Pamplin, T. Scoggins, C. Clark, B. Hutchinson and D. Green, Sol. Energy, 1992, 48, 413–420 CrossRef CAS.
- J. Matos, V. Fierro, R. Montaña, E. Rivero, A. M. de Yuso, W. Zhao and A. Celzard, Appl. Catal., A, 2016, 517, 1–11 CrossRef CAS.
- J. Matos, M. Hofman and R. Pietrzak, Carbon, 2013, 54, 460–471 CrossRef CAS.
- J. Matos, R. Montaña and E. Rivero, Environ. Sci. Pollut. Res. Int., 2015, 22, 784–791 CrossRef CAS PubMed.
- J. Matos, J. Ocares-Riquelme, P. S. Poon, R. Montaña, X. García, K. Campos, J. C. Hernández-Garrido and M. M. Titirici, J. Colloid Interface Sci., 2019, 547, 14–29 CrossRef CAS PubMed.
- J. Matos, J. Laine and J.-M. Herrmann, J. Catal., 2001, 200, 10–20 CrossRef CAS.
- S. C. Yan, Z. S. Li and Z. G. Zou, Langmuir, 2009, 25, 10397–10401 CrossRef CAS PubMed.
- K. Kailasam, J. D. Epping, A. Thomas, S. Losse and H. Junge, Energy Environ. Sci., 2011, 4, 4668 RSC.
- M. Schwarze, D. Stellmach, M. Schroder, K. Kailasam, R. Reske, A. Thomas and R. Schomacker, Phys. Chem. Chem. Phys., 2013, 15, 3466–3472 RSC.
- P. Kuhn, A. Forget, D. Su, A. Thomas and M. Antonietti, J. Am. Chem. Soc., 2008, 130, 13333–13337 CrossRef CAS PubMed.
- P. Kuhn, M. Antonietti and A. Thomas, Angew. Chem., Int. Ed., 2008, 47, 3450–3453 CrossRef CAS PubMed.
- P. Kuhn, A. Thomas and M. Antonietti, Macromolecules, 2009, 42, 319–326 CrossRef CAS.
- W. Zhang, C. Li, Y.-P. Yuan, L.-G. Qiu, A.-J. Xie, Y.-H. Shen and J.-F. Zhu, J. Mater. Chem., 2010, 20, 6413 RSC.
- M. J. Bojdys, J. Jeromenok, A. Thomas and M. Antonietti, Adv. Mater., 2010, 22, 2202–2205 CrossRef CAS PubMed.
- J. Roeser, K. Kailasam and A. Thomas, ChemSusChem, 2012, 5, 1793–1799 CrossRef CAS PubMed.
- M. Schröder, K. Kailasam, S. Rudi, M. Richter, A. Thomas, R. Schomäcker and M. Schwarze, Int. J. Hydrogen Energy, 2014, 39, 10108–10120 CrossRef.
- A. Indra, A. Acharjya, P. W. Menezes, C. Merschjann, D. Hollmann, M. Schwarze, M. Aktas, A. Friedrich, S. Lochbrunner, A. Thomas and M. Driess, Angew. Chem., Int. Ed., 2017, 56, 1653–1657 CrossRef CAS PubMed.
- F. Yang, M. Lublow, S. Orthmann, C. Merschjann, T. Tyborski, M. Rusu, S. Kubala, A. Thomas, R. Arrigo, M. Hävecker and T. Schedel-Niedrig, ChemSusChem, 2012, 5, 1227–1232 CrossRef CAS PubMed.
- F. Yang, V. Kuznietsov, M. Lublow, C. Merschjann, A. Steigert, J. Klaer, A. Thomas and T. Schedel-Niedrig, J. Mater. Chem. A, 2013, 111, 7851 Search PubMed.
- M. Lublow, A. Fischer, C. Merschjann, F. Yang, T. Schedel-Niedrig, J.-F. Veyan and Y. J. Chabal, J. Mater. Chem. A, 2014, 2, 12697–12702 RSC.
- J. Bi, W. Fang, L. Li, J. Wang, S. Liang, Y. He, M. Liu and L. Wu, Macromol. Rapid Commun., 2015, 36, 1799–1805 CrossRef CAS PubMed.
- A. Ajmal, I. Majeed, R. N. Malik, H. Idriss and M. A. Nadeem, RSC Adv., 2014, 4, 37003–37026 RSC.
-
A. Šuligoj, U. Cernigoj and U. Lavrenčič Štangar, SI23585A, The Slovenian Intellectual Property Office, Ljubljana, 2010.
|
| This journal is © The Royal Society of Chemistry and Owner Societies 2019 |
Click here to see how this site uses Cookies. View our privacy policy here.  Open Access Article
 *,
Michael
Lublow
,
Steven
Anders
,
Minoo
Tasbihi
 ,
Amitava
Acharjya
 ,
Kamalakannan
Kailasam
 ,
Arne
Thomas
 ,
Michael
Schwarze
 and
Reinhard
Schomäcker

![[thin space (1/6-em)]](https://www.rsc.org/images/entities/char_2009.gif) :
:![[thin space (1/6-em)]](https://www.rsc.org/images/entities/char_2009.gif) 6 molar ratios of TEOS
6 molar ratios of TEOS![[thin space (1/6-em)]](https://www.rsc.org/images/entities/char_2009.gif) :
:![[thin space (1/6-em)]](https://www.rsc.org/images/entities/char_2009.gif) CA). After aging at 80 °C, the composites are thermally treated at 550 °C to obtain the carbon nitride silica composites. Finally, carbon nitride, CN6, is obtained by the removal of silica using NH4HF2 solution.15
CA). After aging at 80 °C, the composites are thermally treated at 550 °C to obtain the carbon nitride silica composites. Finally, carbon nitride, CN6, is obtained by the removal of silica using NH4HF2 solution.15


![[double bond, length as m-dash]](https://www.rsc.org/images/entities/char_e001.gif) N–C at 288.4 eV appears 2 eV lower than for samples with surface charging.24,25 Interestingly, the corresponding peak position on ultra-thin g-C3N4 films appears at a higher binding energy of about 289.1 eV pointing to structural deviations caused by the thermal condensation process on silicon supports. Those deviations may consist of stretching of bonds in the course of adaption to the silicon support. An identical shift of about 0.7 eV in the C
N–C at 288.4 eV appears 2 eV lower than for samples with surface charging.24,25 Interestingly, the corresponding peak position on ultra-thin g-C3N4 films appears at a higher binding energy of about 289.1 eV pointing to structural deviations caused by the thermal condensation process on silicon supports. Those deviations may consist of stretching of bonds in the course of adaption to the silicon support. An identical shift of about 0.7 eV in the C![[double bond, length as m-dash]](https://www.rsc.org/images/entities/char_e001.gif) N C signal is observed in the corresponding N 1s spectrum (see below). Furthermore, a third peak at 286.6 eV is observed. It appears highly likely that this peak has to be assigned to C–OH, formed by contact with the ambient, although nominally oxygen-free samples exhibited this peak, too.24 In ref. 25 and 26, this peak is reported as well (for non-oxygen-free samples). It should be noted that further carbon species might contribute to the measured data but are not distinguishable from the peaks indicated in Fig. 5. Among them, so-called adventitious carbon has to be mentioned stemming from the environment (carbon contamination) as well as carboxyl groups, O
N C signal is observed in the corresponding N 1s spectrum (see below). Furthermore, a third peak at 286.6 eV is observed. It appears highly likely that this peak has to be assigned to C–OH, formed by contact with the ambient, although nominally oxygen-free samples exhibited this peak, too.24 In ref. 25 and 26, this peak is reported as well (for non-oxygen-free samples). It should be noted that further carbon species might contribute to the measured data but are not distinguishable from the peaks indicated in Fig. 5. Among them, so-called adventitious carbon has to be mentioned stemming from the environment (carbon contamination) as well as carboxyl groups, O![[double bond, length as m-dash]](https://www.rsc.org/images/entities/char_e001.gif) C–OH, potentially formed by interaction with oxygen from the environment. While the first species has binding energies close to N–(C)3 the latter has binding energies close to C
C–OH, potentially formed by interaction with oxygen from the environment. While the first species has binding energies close to N–(C)3 the latter has binding energies close to C![[double bond, length as m-dash]](https://www.rsc.org/images/entities/char_e001.gif) N–C.
N–C.
![[double bond, length as m-dash]](https://www.rsc.org/images/entities/char_e001.gif) N–C signal appears at 399.0 eV and the N–(C)3 signal appears at 400.9 eV. Again, the C
N–C signal appears at 399.0 eV and the N–(C)3 signal appears at 400.9 eV. Again, the C![[double bond, length as m-dash]](https://www.rsc.org/images/entities/char_e001.gif) N–C signal is shifted by about 0.7 eV in comparison to ultra-thin films prepared by direct thermal condensation on silicon supports.26 For XPS investigation of the photocatalytic activity of CN6, diluted methylene blue was adsorbed on the surface. The surface color changed thereby from yellow to a visible greenish tone. The low concentration of 20 mg L−1 was chosen to allow sufficient light to pass through the dye and reach the photoactive CN6. As a side-effect, the typical signals of chlorine and sulfur of methylene blue were too low in intensity to be monitored while the main constituents, i.e. carbon and nitrogen, were not clearly distinguishable from CN6. The analysis was therefore restricted to the change of the O 1s signal of oxygen, investigated after water adsorption and subsequently during illumination of the surface. In Fig. 7, the O 1s signal is shown resulting from water vapor present in the XPS analysis chamber and adsorbed to the surface of the sample. With illumination of the sample (Fig. 7b) an additional peak at about 532.7 eV is detected. During consecutive scans, the water O 1s signal decreases (at 3 mbar gas pressure) while the intensity of the additional peak continues to increase slightly. This peak is attributed to OH-species resulting from photoelectrocatalytic dissociation of water in the presence of the catalyst (denoted as OH˙). It should be noted that the decreasing water vapor pressure (from 18 mbar in (a) to 3 mbar in (b)) causes naturally a lower O 1s signal intensity from both water adsorbed on the surface and water present as gas. The signal at about 532.7 eV, however, can only be attributed to species present at the surface of the sample and after illumination was applied.
N–C signal is shifted by about 0.7 eV in comparison to ultra-thin films prepared by direct thermal condensation on silicon supports.26 For XPS investigation of the photocatalytic activity of CN6, diluted methylene blue was adsorbed on the surface. The surface color changed thereby from yellow to a visible greenish tone. The low concentration of 20 mg L−1 was chosen to allow sufficient light to pass through the dye and reach the photoactive CN6. As a side-effect, the typical signals of chlorine and sulfur of methylene blue were too low in intensity to be monitored while the main constituents, i.e. carbon and nitrogen, were not clearly distinguishable from CN6. The analysis was therefore restricted to the change of the O 1s signal of oxygen, investigated after water adsorption and subsequently during illumination of the surface. In Fig. 7, the O 1s signal is shown resulting from water vapor present in the XPS analysis chamber and adsorbed to the surface of the sample. With illumination of the sample (Fig. 7b) an additional peak at about 532.7 eV is detected. During consecutive scans, the water O 1s signal decreases (at 3 mbar gas pressure) while the intensity of the additional peak continues to increase slightly. This peak is attributed to OH-species resulting from photoelectrocatalytic dissociation of water in the presence of the catalyst (denoted as OH˙). It should be noted that the decreasing water vapor pressure (from 18 mbar in (a) to 3 mbar in (b)) causes naturally a lower O 1s signal intensity from both water adsorbed on the surface and water present as gas. The signal at about 532.7 eV, however, can only be attributed to species present at the surface of the sample and after illumination was applied.


![[thin space (1/6-em)]](https://www.rsc.org/images/entities/char_2009.gif) qeversus log
qeversus log![[thin space (1/6-em)]](https://www.rsc.org/images/entities/char_2009.gif) Ce plot, whereby Ce is the methylene blue concentration in equilibrium. The values of the adsorption intensity, adsorption constant and the correlation coefficient are shown in Table 3. The value of the constant n is above 1 for all adsorbents which also indicates a favourable adsorption. Besides, the correlation coefficient for the Freundlich plot of C3N4 is higher than the correlation coefficient for the Langmuir plot, meaning that the Freundlich model is a better fit for the experimental results.
Ce plot, whereby Ce is the methylene blue concentration in equilibrium. The values of the adsorption intensity, adsorption constant and the correlation coefficient are shown in Table 3. The value of the constant n is above 1 for all adsorbents which also indicates a favourable adsorption. Besides, the correlation coefficient for the Freundlich plot of C3N4 is higher than the correlation coefficient for the Langmuir plot, meaning that the Freundlich model is a better fit for the experimental results.


