
 Open Access Article
 This Open Access Article is licensed under a Creative Commons Attribution-Non Commercial 3.0 Unported Licence
Responses of flavonoid profile and associated gene expression to solar blue and UV radiation in two accessions of Vicia faba L. from contrasting UV environments†
Yan
Yan
 *a,
Frederick L.
Stoddard
b,
Susanne
Neugart
c,
Victor O.
Sadras
d,
Anders
Lindfors
e,
Luis Orlando
Morales
f and
Pedro J.
Aphalo
a
*a,
Frederick L.
Stoddard
b,
Susanne
Neugart
c,
Victor O.
Sadras
d,
Anders
Lindfors
e,
Luis Orlando
Morales
f and
Pedro J.
Aphalo
a
aViikki Plant Science Centre (ViPS), Department of Biosciences, University of Helsinki, Uusimaa, Finland. E-mail: yan.z.yan@helsinki.fi
bViikki Plant Science Centre (ViPS), Department of Agricultural Sciences, University of Helsinki, Uusimaa, Finland
cLeibniz-Institute of Vegetable and Ornamental Crops, Grossbeeren, Germany
dSouth Australian Research and Development Institute, Australia
eFinnish Meteorological institute, Helsinki, Finland
fDepartment of Science and Technology, Örebro Life Science Centre, Örebro University, SE-70182 Örebro, Sweden
First published on 4th January 2019
Abstract
Blue light and UV radiation shape a plant's morphology and development, but accession-dependent responses under natural conditions are unclear. Here we tested the hypothesis that two faba bean (Vicia faba L.) accessions adapted to different latitudes and altitudes vary in their responses to solar blue and UV light. We measured growth, physiological traits, phenolic profiles and expression of associated genes in a factorial experiment combining two accessions (Aurora, a Swedish cultivar adapted to high latitude and low altitude; ILB938, from the Andean region of Colombia and Ecuador, adapted to low latitude and high altitude) and four filter treatments created with plastic sheets: 1. transparent as control; 2. attenuated short UV (290–350 nm); 3. attenuated UV (290–400 nm); 4. attenuated blue and UV light. In both accessions, the exclusion of blue and UV light increased plant height and leaf area, and decreased transcript abundance of ELONGATED HYPOCOTYL 5 (HY5) and TYROSINE AMINOTRANSFERASE 3 (TAT3). Blue light and short UV induced the accumulation of epidermal and whole-leaf flavonoids, mainly quercetins, and the responses in the two accessions were through different glycosides. Filter treatments did not affect kaempferol concentration, but there were more tri-glycosides in Aurora and di-glycosides in ILB938. Furthermore, fewer quercetin glycosides were identified in ILB938. The transcript abundance was consistently higher in Aurora than in ILB938 for all seven investigated genes: HY5, TAT3, CHALCONE SYNTHASE (CHS), CHALCONE ISOMERASE (CHI), DON-GLUCOSYLTRANSFERASE 1 (DOGT1), ABA INSENSITIVE 2 (ABI2), AUXIN-INDUCIBLE 2–27 (IAA5). The two largest differences in transcript abundance between the two accessions across treatments were 132-fold in CHS and 30-fold in DOGT1 which may explain the accession-dependent glycosylation patterns. Our findings suggest that agronomic selection for adaptation to high altitude may favour phenotypes with particular adaptations to the light environment, including solar UV and blue light.
Introduction
Sunlight drives photosynthesis, growth and development of plants.1 Plants perceive light through different families of photoreceptors: phytochromes are the well documented red and far-red light receptors;2 blue and UV-A wavebands are sensed through cryptochromes, phototropins and Zeitlupe family;3 and UV-B is perceived through the photoreceptor UVR8 (UV RESISTANCE LOCUS8) which mediates UV-B acclimation.4 Since plants simultaneously receive different wavebands of light, crosstalk between different photoreceptor signaling pathways has been investigated,5 where a common set of signaling components seems to be shared.1,6 In addition, blue and UV-A radiation activate photolyase that repairs DNA damage caused by UV-B, which contributes to UV-B tolerance in plants.7Since the 1980s, the depletion of the ozone layer has stimulated UV-B research. Early experiments in controlled environments with unrealistically high UV-B radiation led to the conclusion that UV-B is a stressor causing DNA-damage and increasing the concentration of reactive oxygen species (ROS) in plants.8 Subsequently, the importance of studying more realistic UV-B radiation regimes in the natural environment was recognized.9,10 Instead of causing damage, low fluence rates of UV-B radiation were found to initiate regulatory photomorphogenesis, such as reducing hypocotyl length, increasing leaf thickness and promoting axillary branching.11
Blue, UV-A and UV-B radiation are all reported to stimulate the synthesis and accumulation of phenolic compounds.12,13 Flavonoids are phenolic compounds that serve as a sunscreen in the leaf epidermis, protecting inner mesophyll cells from harmful levels of UV radiation while allowing photosynthetically active radiation (PAR) to pass.13 Flavonoids also regulate growth and reproduction, provide antioxidant activity and defend plants against herbivores and pathogens.14
Under photomorphogenic UV-B light, activated UVR8 monomer interacts with CONSTITUTIVELY PHOTOMORPHOGENIC 1-SUPPRESSOR OF PHYA (COP1-SPA) complexes to induce and stabilize the transcription factor HY5.15 Blue and UV-A radiation also induce the accumulation of HY5 through cryptochrome 1.16,17 HY5 then relays the light signals by activating gene expression contributing to blue and UV light acclimation, including genes involved in flavonoid synthesis, e.g., CHALCONE SYNTHASE (CHS) and CHALCONE ISOMERASE (CHI). It is well documented that most genes responding to UV-B are likely to be regulated at the level of transcription,11 but there is little information on how long-term exposure to UV-B or other wavebands of the spectrum affect transcription of genes involved in UV signaling and other pathways that promote UV acclimation in sunlight. While the mechanism for light perception in Arabidopsis thaliana has been intensively studied, research in model plants generates a two-fold-bias, one taxonomic18 and the other from often unrealistic growing conditions, as discussed above. Our knowledge of responses to solar blue and UV light remains limited for crop species under natural sunlight.
Faba bean (Vicia faba L.) is one of the oldest crops. It was apparently domesticated at the western end of the Fertile Crescent and spread from there across Eurasia and Northern Africa, and with Spanish colonists to South America in the 16th century.19,20 Several distinctive germplasm pools are recognized, including Mediterranean autumn-sown, Atlantic autumn-sown, and continental spring-sown.21 Faba bean is a winter annual where it evolved in Western Asia and the Mediterranean basin, so its evolutionary exposure to high PAR and solar UV-B was presumably limited to the end of the ripening phase in spring. Its adaptation to higher latitudes, such as central and Northern Europe, has involved a shift to spring sowing and autumn ripening. Significant adaptations are required for the diffusion of crops away from their center of origin, particularly across latitudes.22 In equatorial regions, such as Colombia and Ecuador, V. faba is grown at high altitudes (around 3000 m) with strong exposure to UV light, whereas it is exposed to less UV at higher latitudes such as the Nordic-Baltic region.
Hence, we hypothesized that V. faba accessions from equatorial highlands (low latitude at high altitude) and sub-boreal lowlands (high latitude at low altitude) would react differently to solar blue and UV light. ILB938, a selection from the Andean region of Colombia and Ecuador,23 was chosen as the representative from equatorial highlands, and Aurora, an old Swedish cultivar, as the representative from sub-boreal lowlands. The estimated yearly maximum UV-B irradiance is more than 50% higher in the Ecuadorian Andean region than in Southern Sweden (ESI Table 1†). The largest difference in irradiance between these two locations is in the shortest wavelengths of the solar spectrum where photons are most energetic (ESI Fig. 1†) and consequently solar UV radiation is much more effective in Ecuador than in Southern Sweden (effective irradiances of 0.75 W m−2vs. 0.25 W m−2, using Green's formulation of the generalized plant action spectrum). In contrast, daily average air temperatures in the growing season in these two regions are similar, 8–15 °C in southern Sweden and 10–11 °C in Andean Ecuador and Colombia.
Materials and methods
Solar radiation and temperatures in Ecuadorian Andean region and Southern Sweden
To estimate the yearly maximum solar spectral irradiance in the Andean region of Ecuador and in southern Sweden where these two accessions originate, we used the Quick TUV model24 and “R for photobiology” packages25 assuming clear sky conditions. We used 0° and 33° as zenith angles and 3000 m a.m.s.l. and 0 m a.m-s.l. as elevations for Ecuador and southern Sweden, respectively. The estimates for ozone layer were obtained from the Aura OMI (DOAS) layer in NASA's Worldview site (https://worldview.earthdata.nasa.gov/): 230 DU for Ecuador as representative for the annual average and 300 DU for southern Sweden for the end of June. Mean temperature data for Ipiales, Colombia, and Gothenburg, Sweden were obtained from the World Weather Information Service, World Meteorological Organization (https://worldweather.wmo.int).Plant material, treatments and experimental design
The experiment was conducted outdoors in the Viikki campus of the University of Helsinki, Finland (60°13′N, 25°1′E) from early May to early June of 2016, when the ambient temperature averaged 13.8 °C and ranged from 9.1 to 20.0 °C. The experiment was a full factorial combining two accessions and four filter treatments with 4 replicate blocks in a split-plot design, with filters as the main plot and accessions as the sub-plot. Within each block, filter locations were randomized. Under each filter, 4–6 pots of each accession were located at random and interspersed. The pots were placed under the filters when the seeds were sown, and their positions were rotated every 3–4 days.The original seed of ILB938/2 and Aurora/2 was provided by courtesy of Prof. W. Link, University of Göttingen, Germany, and further inbred for several generations in the University of Helsinki glasshouses. The seeds were imbibed overnight in tap water, inoculated evenly with rhizobium (R. leguminosarum biovar vicieae, Elomestari OY, Tornio, Finland), and sown into 1.2 L pots containing pre-fertilized nursery peat (Kekkilä P6, Finland) and vermiculite (Vermipu, Finland) (2![[thin space (1/6-em)]](https://www.rsc.org/images/entities/char_2009.gif) :1 by volume). Pots were watered evenly throughout the experiment.
:1 by volume). Pots were watered evenly throughout the experiment.
Four filter treatments were established with four types of plastic sheets (3 mm) that transmit different wavelengths of the solar spectrum: (1) >290 nm (Clear acrylic, PLEXIGLAS 2458 GT, Evonik, Germany) as control; (2) >350 nm (Solar Clear acrylic, PLEXIGLAS 0Z023 GT, Evonik, Germany) to attenuate short UV light (<350 nm); (3) >400 nm (Clear polycarbonate, Makrolife, Arla Plast, Sweden) to attenuate all UV radiation; (4) >500 nm (Yellow acrylic, PLEXIGLAS 1C33 GT, Evonik, Germany) to attenuate both blue and UV radiation. We chose 350 nm as the boundary for distinguishing short UV from long UV rather than the usual 315 nm, because 350 nm is the border between the sensitivity of UVR8 and that of A. thaliana cryptochromes (Neha Rai, Luis Morales, Pedro J Aphalo, unpublished data). All filters were attached on top of wooden frames (1 × 0.80 m) at a slight inclination toward the south. The filters were adjusted to 15 cm above the top of the plants throughout the experiment.
The transmittance of the filters (Fig. 1) was measured with a spectrophotometer (Agilent 8453 UV-visible spectrophotometer, Agilent Technologies, Waldbronn, Germany). Hourly ambient spectra for the whole duration of the experiment were modelled following Lindfors et al.26 and summaries computed with the “R for photobiology” package.25 Biologically effective UV daily exposures were calculated for five frequently used BSWFs (biological spectral weighting functions)27 normalized to 300 nm to allow comparison with earlier publications. Table 1 shows effective irradiances and spectral ratios. We used the generalized plant action spectrum by Caldwell,27 in two formulations, one introduced by Green et al.27 and the other by Thimijan et al.;27 an action spectrum for the accumulation of the flavonoid mesembryanthin in Mesembryanthemum crystallinum L;27 the CIE spectrum for UV-induced erythema in human skin,27 and an action spectrum for DNA damage in alfalfa (Medicago sativa L.) seedlings.27 ESI Fig. 2† shows the daily photon exposure to photosynthetically active radiation (PAR) throughout the duration of the experiment under each filter treatment. ESI Fig. 3 and 4† show the time course of photon irradiances during the day (30 days after plant emergence) when samples for metabolite and RNA abundance analyses were collected.
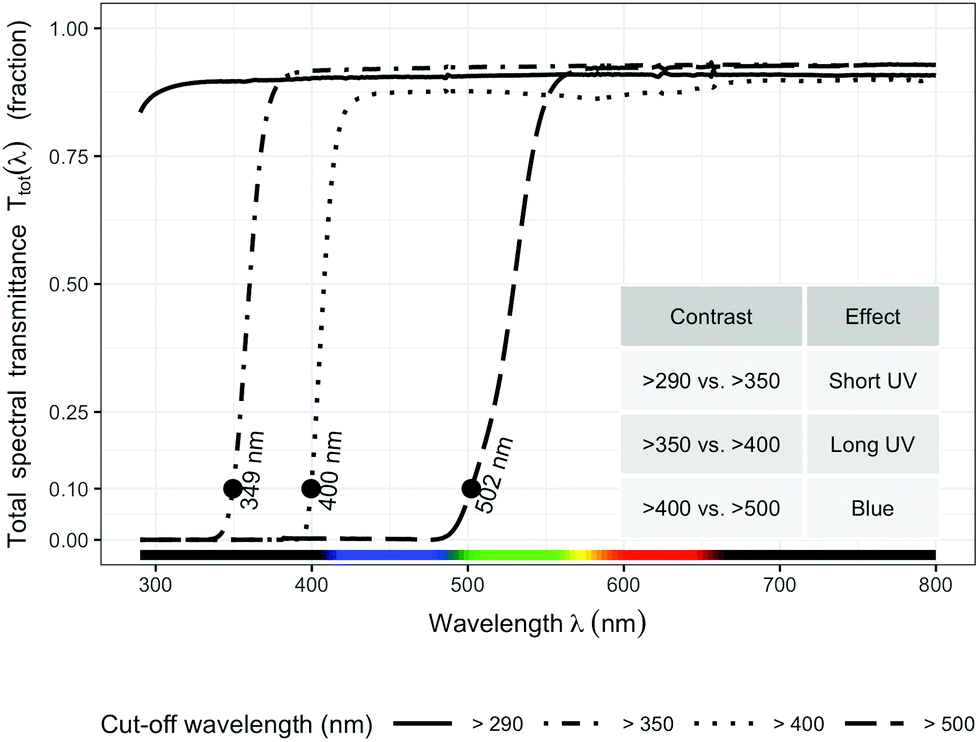 | ||
| Fig. 1 Spectral transmittance of the four filters used in the experiment. The contrast of filter “>290 nm” vs. “>350 nm” shows the effect of short UV (290–350 nm); the contrast of filter “>350 nm” vs. “>400 nm” shows the effect of long UV (350–400 nm); and the contrast of filter “>400 nm” vs. “>500 nm” shows the effect of blue light. For detailed descriptions of the filters, see Methods. | ||
| Filter treatment | GEN(G) (kJ m−2 day−1) min (mean) max | GEN(T) (kJ m−2 day−1) min (mean) max | CIE (kJ m−2 day−1) min (mean) max | FLAV (kJ m−2 day−1) min (mean) max | DNA(P) (kJ m−2 day−1) min (mean) max |
|---|---|---|---|---|---|
| Ambient (no filter) | 0.86 (2.61) 3.53 | 1.57 (4.38) 5.68 | 0.93 (2.57) 3.29 | 3.48 (9.32) 11.76 | 7.53 (19.80) 24.57 |
| >290 nm | 0.76 (2.30) 3.11 | 1.39 (3.88) 5.03 | 0.82 (2.28) 2.92 | 3.09 (8.29) 10.45 | 6.71 (17.64) 21.89 |
| >350 nm | 0.0001 (0.0003) 0.0005 | 0.0003 (0.0008) 0.001 | 0.06 (0.17) 0.21 | 0.002 (0.005) 0.007 | 0.21 (0.56) 0.69 |
| >400 nm | 0.0001 (0.0003) 0.0004 | 0.0002 (0.0004) 0.0006 | 0.0004 (0.001) 0.0014 | 0.0004 (0.001) 0.001 | 0.001 (0.003) 0.004 |
| >500 nm | 0.0001 (0.0003) 0.0004 | 0.0002 (0.0004) 0.0006 | 0.0001 (0.0004) 0.0005 | 0.0004 (0.0009) 0.001 | 0.0008 (0.002) 0.003 |
| Filter treatment | PAR (mol m−2 day−1) min (mean) max | Blue (mol m−2 day−1) min (mean) max | UV-A2 (mol m−2 day−1) min (mean) max | UV-A1 (mmol m−2 day−1) min (mean) max | UV-B (mmol m−2 day−1) min (mean) max |
|---|---|---|---|---|---|
| Estimated biologically effective UV doses calculated with five BSWFs (biological spectral weighting functions) and PAR, blue, UV-B, UV-A1 and UV-A2 radiation for the whole duration of the experiment. The minimum, mean and maximum daily doses are given with mean indicated in parenthesis. Ambient (no filter) light condition is listed here for comparison purposes with the filter treatments. GEN(G) and GEN(T) are the generalized plant action spectrum calculated with two different formulations.27 FLAV is the action spectrum for the accumulation of the flavonoid mesembryanthin in Mesembryanthemum crystallinum,27 CIE is the action spectrum for UV-induced erythema in human skin27 and DNA(P) is the action spectrum for DNA damage in alfalfa (Medicago sativa) seedlings.27 UV-A2 is radiation from 315 to 340 nm, and UV-A1 is from 340 to 400 nm. | |||||
| Ambient (no filter) | 15.17 (46.14) 58.19 | 3.15 (9.30) 11.67 | 1.13 (3.05) 3.78 | 256 (651) 799 | 18.8 (51.8) 66.8 |
| >290 nm | 13.78 (41.88) 52.82 | 2.85 (8.41) 10.56 | 1.02 (2.74) 3.40 | 229 (582) 714 | 16.6 (45.9) 59.2 |
| >350 nm | 14.04 (42.70) 53.84 | 2.91 (8.57) 10.76 | 0.74 (2.01) 2.50 | 0.30 (0.76) 0.94 | 0.0029 (0.008) 0.01 |
| >400 nm | 13.06 (39.75) 50.14 | 2.75 (8.10) 10.17 | 0.008 (0.023) 0.028 | 0.026 (0.066) 0.081 | 0.0019 (0.0053) 0.0068 |
| >500 nm | 8.69 (26.92) 34.04 | 0.007 (0.02) 0.025 | 0.001 (0.003) 0.004 | 0.027 (0.068) 0.083 | 0.0019 (0.0052) 0.0067 |
Growth, gas exchange and stomatal conductance
For each accession, 4–6 plants from the center under each filter frame were selected for growth and physiological measurements. The remaining plants were not measured to avoid edge effects. Plant height was measured 30 d after emergence. Leaves harvested at the end of the experiment were scanned with a reference of known length on a white background for later leaf area measurement using imageJ.28 The leaves were then dried at 75 °C for 4 d to measure dry weight.The flavonoid and chlorophyll content in leaf epidermis was assessed non-destructively with a Dualex Scientific+ device (Force-A™, Paris, France)29 four times: 14 d after seedling emergence, when the first two leaves were fully expanded, and then at 5 d intervals, each time adding a new fully expanded leaf.
Photosynthesis rate and chlorophyll fluorescence were measured with a portable photosynthesis system (LI-COR 6400XT, LI-COR, Inc., Lincoln, NE, USA) using the standard leaf chamber (2 × 3 cm) (LI-COR 6400-40 Leaf Chamber Fluorometer) under a constant CO2 concentration of 400 μmol mol−1 maintained by the CO2 injection system, with 1.95 kPa as the vapor pressure deficit based on Leaf temperature (VpdL). The PPFD used for all measurements was 1000 μmol m−2 s−1 provided by a red and blue light source with a ratio of 9:1 (LI-COR 6400-40). On average, 2–3 minutes were required for stabilization after enclosing leaves in the chamber. Chlorophyll fluorescence was measured without leaf dark adaptation. All measurements were done at midday (12:00 EEST) ±1 h under clear sky, 29 and 30 d after seedling emergence. The abaxial stomatal conductance was measured in situ with an automatic transit-time porometer (AP4, Delta-T Devices, Cambridge, UK) at midday (12:00 EEST) ±1 h. Measurements were taken from at least two leaves per plant, 30 d after seedling emergence.
Phenolic analysis by HPLC-DAD-ESI-MSn
The youngest two fully expanded leaves were harvested independently from each plant, put into liquid nitrogen and stored at −80 °C until use. One leaf sample was used for phenolic analysis and the other for gene expression analysis. The samples harvested for phenolic analysis were lyophilized in a freeze dryer (Savant Modulyo® Freeze Dryer, Thermo Electron Corporation, USA). The samples were then ground to powder in a porcelain mortar.Flavonoids were analysed according to Schmidt et al.30 with slight modification. Lyophilized, ground plant material (0.02 g) was extracted with 600 μl of 60% aqueous methanol on a magnetic stirrer plate for 40 min at 20 °C. The extract was centrifuged at 19000g for 10 min at room temperature, and the supernatant was collected in a glass tube. This process was repeated twice with 300 μl of 60% aqueous methanol for 20 min and 10 min, respectively, and the three supernatants were combined. The extract was subsequently evaporated until it was dry and was then suspended in 200 μl of 10% aqueous methanol. The extract was centrifuged at 12500g for 5 min at 20 °C through a Corning® Costar® Spin-X® plastic centrifuge tube filter (Sigma Aldrich Chemical Co., St. Louis, MO, USA) for the HPLC analysis. Each extraction was carried out in duplicate.
Flavonoid profile (including hydroxycinnamic acid derivatives and glycosides of flavonoids) and concentrations were determined from the filtrate using a series 1100 HPLC (Agilent Technologies, Waldbronn, Germany) equipped with a degasser, binary pump, autosampler, column oven, and photodiode array detector. An Ascentis® Express F5 column (150 mm × 4.6 mm, 5 μm, Supelco, Sigma Aldrich, St. Louis, MO, USA) was used to separate the compounds at 25 °C. Eluent A was 0.5% acetic acid, and eluent B was 100% acetonitrile. The gradient used for eluent B was 5–12% (0–3 min), 12–25% (3–46 min), 25–90% (46–49.5 min), 90% isocratic (49.5–52 min), 90–5% (52–52.7 min), and 5% isocratic (52.7–59 min). The flow rate was 0.85 ml min−1 and the detector wavelengths were 280 nm, 320 nm, 330 nm, 370 nm and 520 nm. The hydroxycinnamic acid derivatives and glycosides of flavonoids were identified as deprotonated molecular ions and characteristic mass fragment ions according to Schmidt et al.31 and Neugart et al.32 by HPLC-DAD-ESI-MSn using a Bruker Amazon SL ion trap mass spectrometer (Agilent Technologies, Waldbronn, Germany) in negative ionisation mode. Nitrogen was used as the dry gas (10 l min−1, 325 °C) and the nebulizer gas (40 psi) with a capillary voltage of −3500 V. Helium was used as the collision gas in the ion trap. The mass optimization for the ion optics of the mass spectrometer for quercetin was performed at m/z 301 or arbitrarily at m/z 1000. The MSn experiments were performed in automatic mode up to MS3 in a scan from m/z 200 to 2000. Chlorogenic acid, quercetin 3-glucoside and kaempferol 3-glucoside (all from Roth, Karlsruhe, Germany) were the standards used for external calibration curves in a semi-quantitative approach.
Gene expression analysis by quantitative real-time PCR (q-PCR)
Long-term effects of filter treatments on the expression of genes involved in light signaling, flavonoid glycoside biosynthesis and hormone response were assessed with q-PCR. Here, transcript abundance of seven selected genes (ESI Table 2†) was measured in leaf samples after 30 days of filter treatments outdoors. Among the seven selected genes, ELONGATED HYPOCOTYL 5 (HY5) is involved in blue and UV-B light signaling; CHALCONE SYNTHASE (CHS), CHALCONE ISOMERASE (CHI) and DON-GLUCOSYLTRANSFERASE 1 (DOGT1) are involved in biosynthesis of flavonoid glycosides; ABA INSENSITIVE 2 (ABI2) is a negative regulator in ABA activated signal pathway; AUXIN-INDUCIBLE 2-27 (IAA5) is responsive to auxin; TYROSINE AMINOTRANSFERASE 3 (TAT3) is responsive to JA. Some other relevant genes such as F3′H could not be included as their sequence data (CDS) was not yet available for V. faba. Total RNA was extracted using TRIzol™ reagent (Thermo Fisher Scientific, Waltham, MS, USA) according to the manufacturer's instructions. The concentration of RNA was determined using a NanoDrop ND-1000 Spectrophotometer (Thermo Fisher Scientific), and the integrity of RNA was assessed on a 1% agarose gel. Each sample containing 2 μg of RNA was first treated with DNase I (Thermo Fisher Scientific) to eliminate genomic DNA contamination and then the RNA reverse-transcribed to cDNA using RevertAid Reverse Transcriptase (Thermo Fisher Scientific) and oligo(dT)20 primers. The Arabidopsis thaliana sequences of 13 initially selected genes obtained from The Arabidopsis Information Resource (TAIR) were used to find homologous genes in the Medicago truncatula Gaertn sequence database (LegumeIP, The Samuel Roberts Noble Foundation, Ardmore, OK, USA) using BLAST. Gene sequences from M. truncatula were subsequently used to find the homologous genes in V. faba by blasting against a developing Trinity assembly of transcripts derived from RNAseq of a mapping population (Frederick Stoddard, Jaakko Tanskanen, Alan Schulman, unpublished data). Primers for the available genes in V. faba were designed using Primer 3,33 and the melting curve was checked for each pair of primers before they were used in q-PCR. ESI Table 2† shows the primer sequence and gene information. The q-PCR was conducted in a CFX384 Touch™ Real-Time PCR Detection System (Bio-Rad Laboratories, Inc., USA) using FIREPol® EvaGreen® q-PCR Mix Plus (Solis Biodyne, Tartu, Estonia). All samples collected from each replicate block were run on the same 384-well plate as 10 μl PCR reactions in triplicate. The cycle thresholds were determined using Bio-Rad CFX Manager and were imported into qbasePLUS 2.0 (Biogazelle, Belgium), where two reference genes (CYP2 and ELF1A)34 were used to normalize the q-PCR data. The reference genes had an average geNorm expression value M = 0.9 and coefficient of variation (CV) = 0.2. After normalization, expression values were scaled to the average expression values of the specific run,35 log10-transformed and exported from qbasePLUS for statistical analyses in R-3.5.0.36Statistical analysis
Linear mixed models with blocks as random effects (LME) were fitted using the NLME package37 in R-3.5.0.36 Factorial analysis of variance (ANOVA) was used to assess the significance of main effects of the factors, filter treatment and accession, and their interaction. When the ANOVA indicated interaction (p < 0.05), response to filter treatments within each of the two accessions was assessed by splitting the data by accession before fitting simpler models separately. When the filter treatment was significant (p < 0.05), the individual effects of short UV (290–350 nm), long UV (350–400 nm) and blue radiation (400–500 nm) were assessed through selected contrasts using the fit.contrasts() function from the package gmodels,38 and p-values were later adjusted using p.adjust() function. The contrast between filter “>290 nm” and filter “>350 nm” was used as to test for the effect of short UV radiation, that between filter “>350 nm” and filter “>400 nm” for the effect of long UV radiation, and finally that between filter “>400 nm” and filter “>500 nm” for the effect of blue light.Differences in the profiles of flavonoid derivatives were assessed by principal component analysis (PCA) using prcomp() function from package stats of core R. Data used for PCA were log2 transformed molar concentrations (μmol g−1) to ensure normal distribution. Figures were drawn using the package ggfortify and ggplot2 in R-3.5.0.39
Results
Plant growth and physiological traits
The Andean-origin accession ILB938 had taller plants (p = 0.0004) and greater leaf dry weight (p < 0.0001) than the Swedish cultivar Aurora under all filter treatments. The exclusion of blue light increased plant height (p < 0.0001) and leaf area (p = 0.034) in both accessions (Fig. 2a and b). The main effect of accession was significant for photosynthetic rate (p = 0.0102), chlorophyll fluorescence (p = 0.0151) and stomatal conductance gs (p = 0.0001) (Fig. 2d–f), while the interaction between accession and filter treatment was not significant for these three parameters. Under all filter treatments, Aurora had higher stomatal conductance than ILB938. The chlorophyll concentration per unit area estimated with Dualex was 7% higher in Aurora than in ILB938 (p = 0.0019).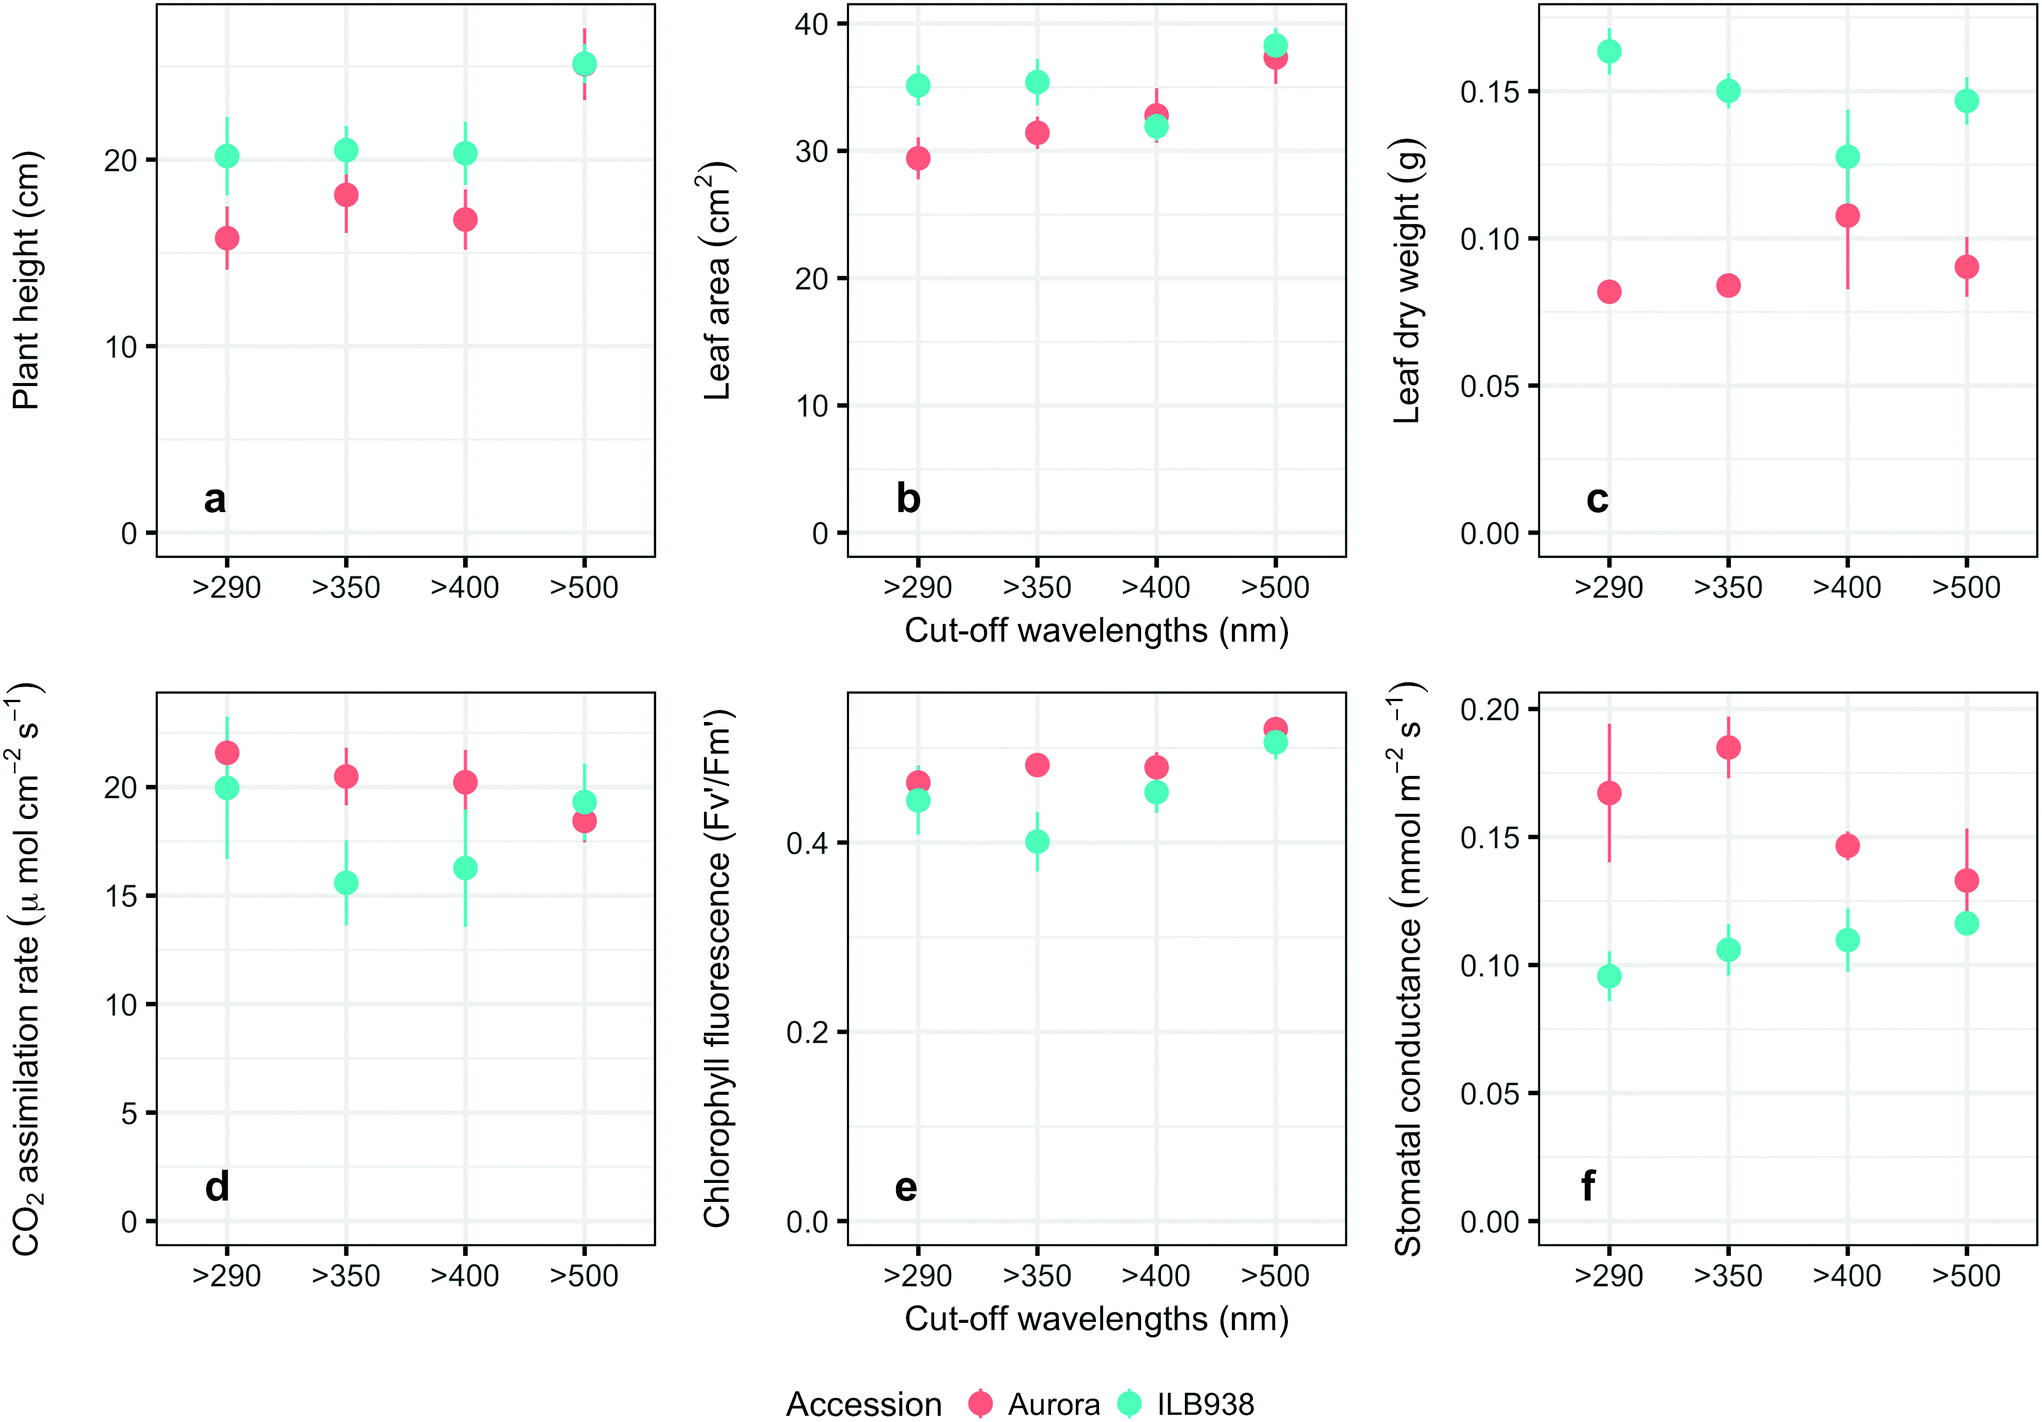 | ||
| Fig. 2 Growth and physiological traits of plants of accessions aurora and ILB938 of V. faba grown in sunlight under four filters. a. Height of the seedlings at 30 d after emergence; b. leaf area at 30 d after emergence; c. leaf dry weight 30 d after emergence; d. leaf photosynthesis rate measured by gas exchange at 29–30 d; e. leaf chlorophyll fluorescence; f. abaxial leaf stomatal conductance measured with porometer. All values are means ± SE of four replicate blocks, 163 measured plants for a, b, c, f; 96 measured plants for d, e. | ||
Phenolic metabolites
In non-destructive measurements, the adaxial leaf surface had higher estimated flavonoid concentration per unit area than the abaxial surface (p < 0.0001). Blue (p < 0.0001) and short UV light (p < 0.0001) enhanced phenolic content per unit area in both surfaces. The induction effects of blue and short UV light were observed at all leaf growth stages (ESI Fig. 5†).In destructive HPLC analysis, a total of 24 individual phenolic compounds (19 flavonoid derivatives and 5 phenolic acids) were identified in leaf samples at the end of the experiment (Table 2 and ESI Table 3†). Quercetin glycosides were the main flavonoids (Fig. 3). Total kaempferol (sum of kaempferol glycosides) concentration was not affected by filter treatments in either of the two accessions (p = 0.59) (Fig. 3). The mass concentration (μg g−1) of kaempferol glycosides was higher in Aurora (p = 0.016), but no difference between accessions was found with molar concentration (p = 0.77) (ESI Fig. 6†). The two accessions were separated clearly in the first principal component (PC1) (Fig. 4), which explained 58% of the variation and highlighted their different profiles of kaempferol glycosides. In ILB938, the kaempferol glycosides were mainly mono-glycoside and di-glycosides, whereas in Aurora, they were mainly tri-glycosides and a tetra-glycoside. Moreover, acetylated kaempferol glycosides were at higher concentration in Aurora (Fig. 4). Effects of filter treatments on kaempferol compounds were not separated by PCA, which is in accordance with ANOVA.
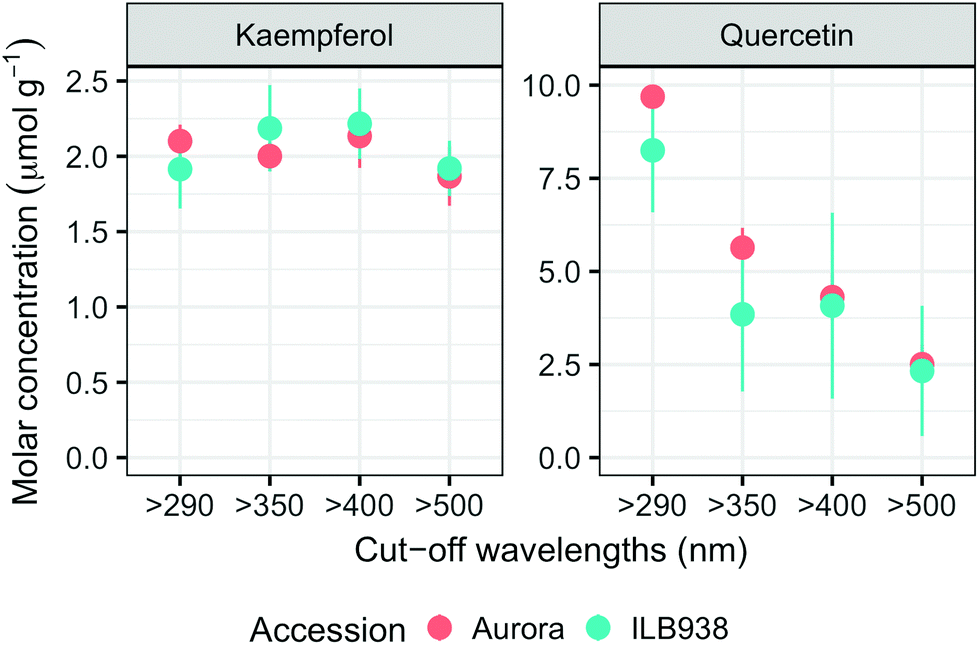 | ||
| Fig. 3 Whole-leaf molar concentrations (μmol g−1) of total kaempferols and quercetins per unit leaf dry mass in plants of accessions aurora and ILB938 of V. faba grown in sunlight under four filters. All values are means ± SE of four replicate blocks, 163 sampled plants in total. | ||
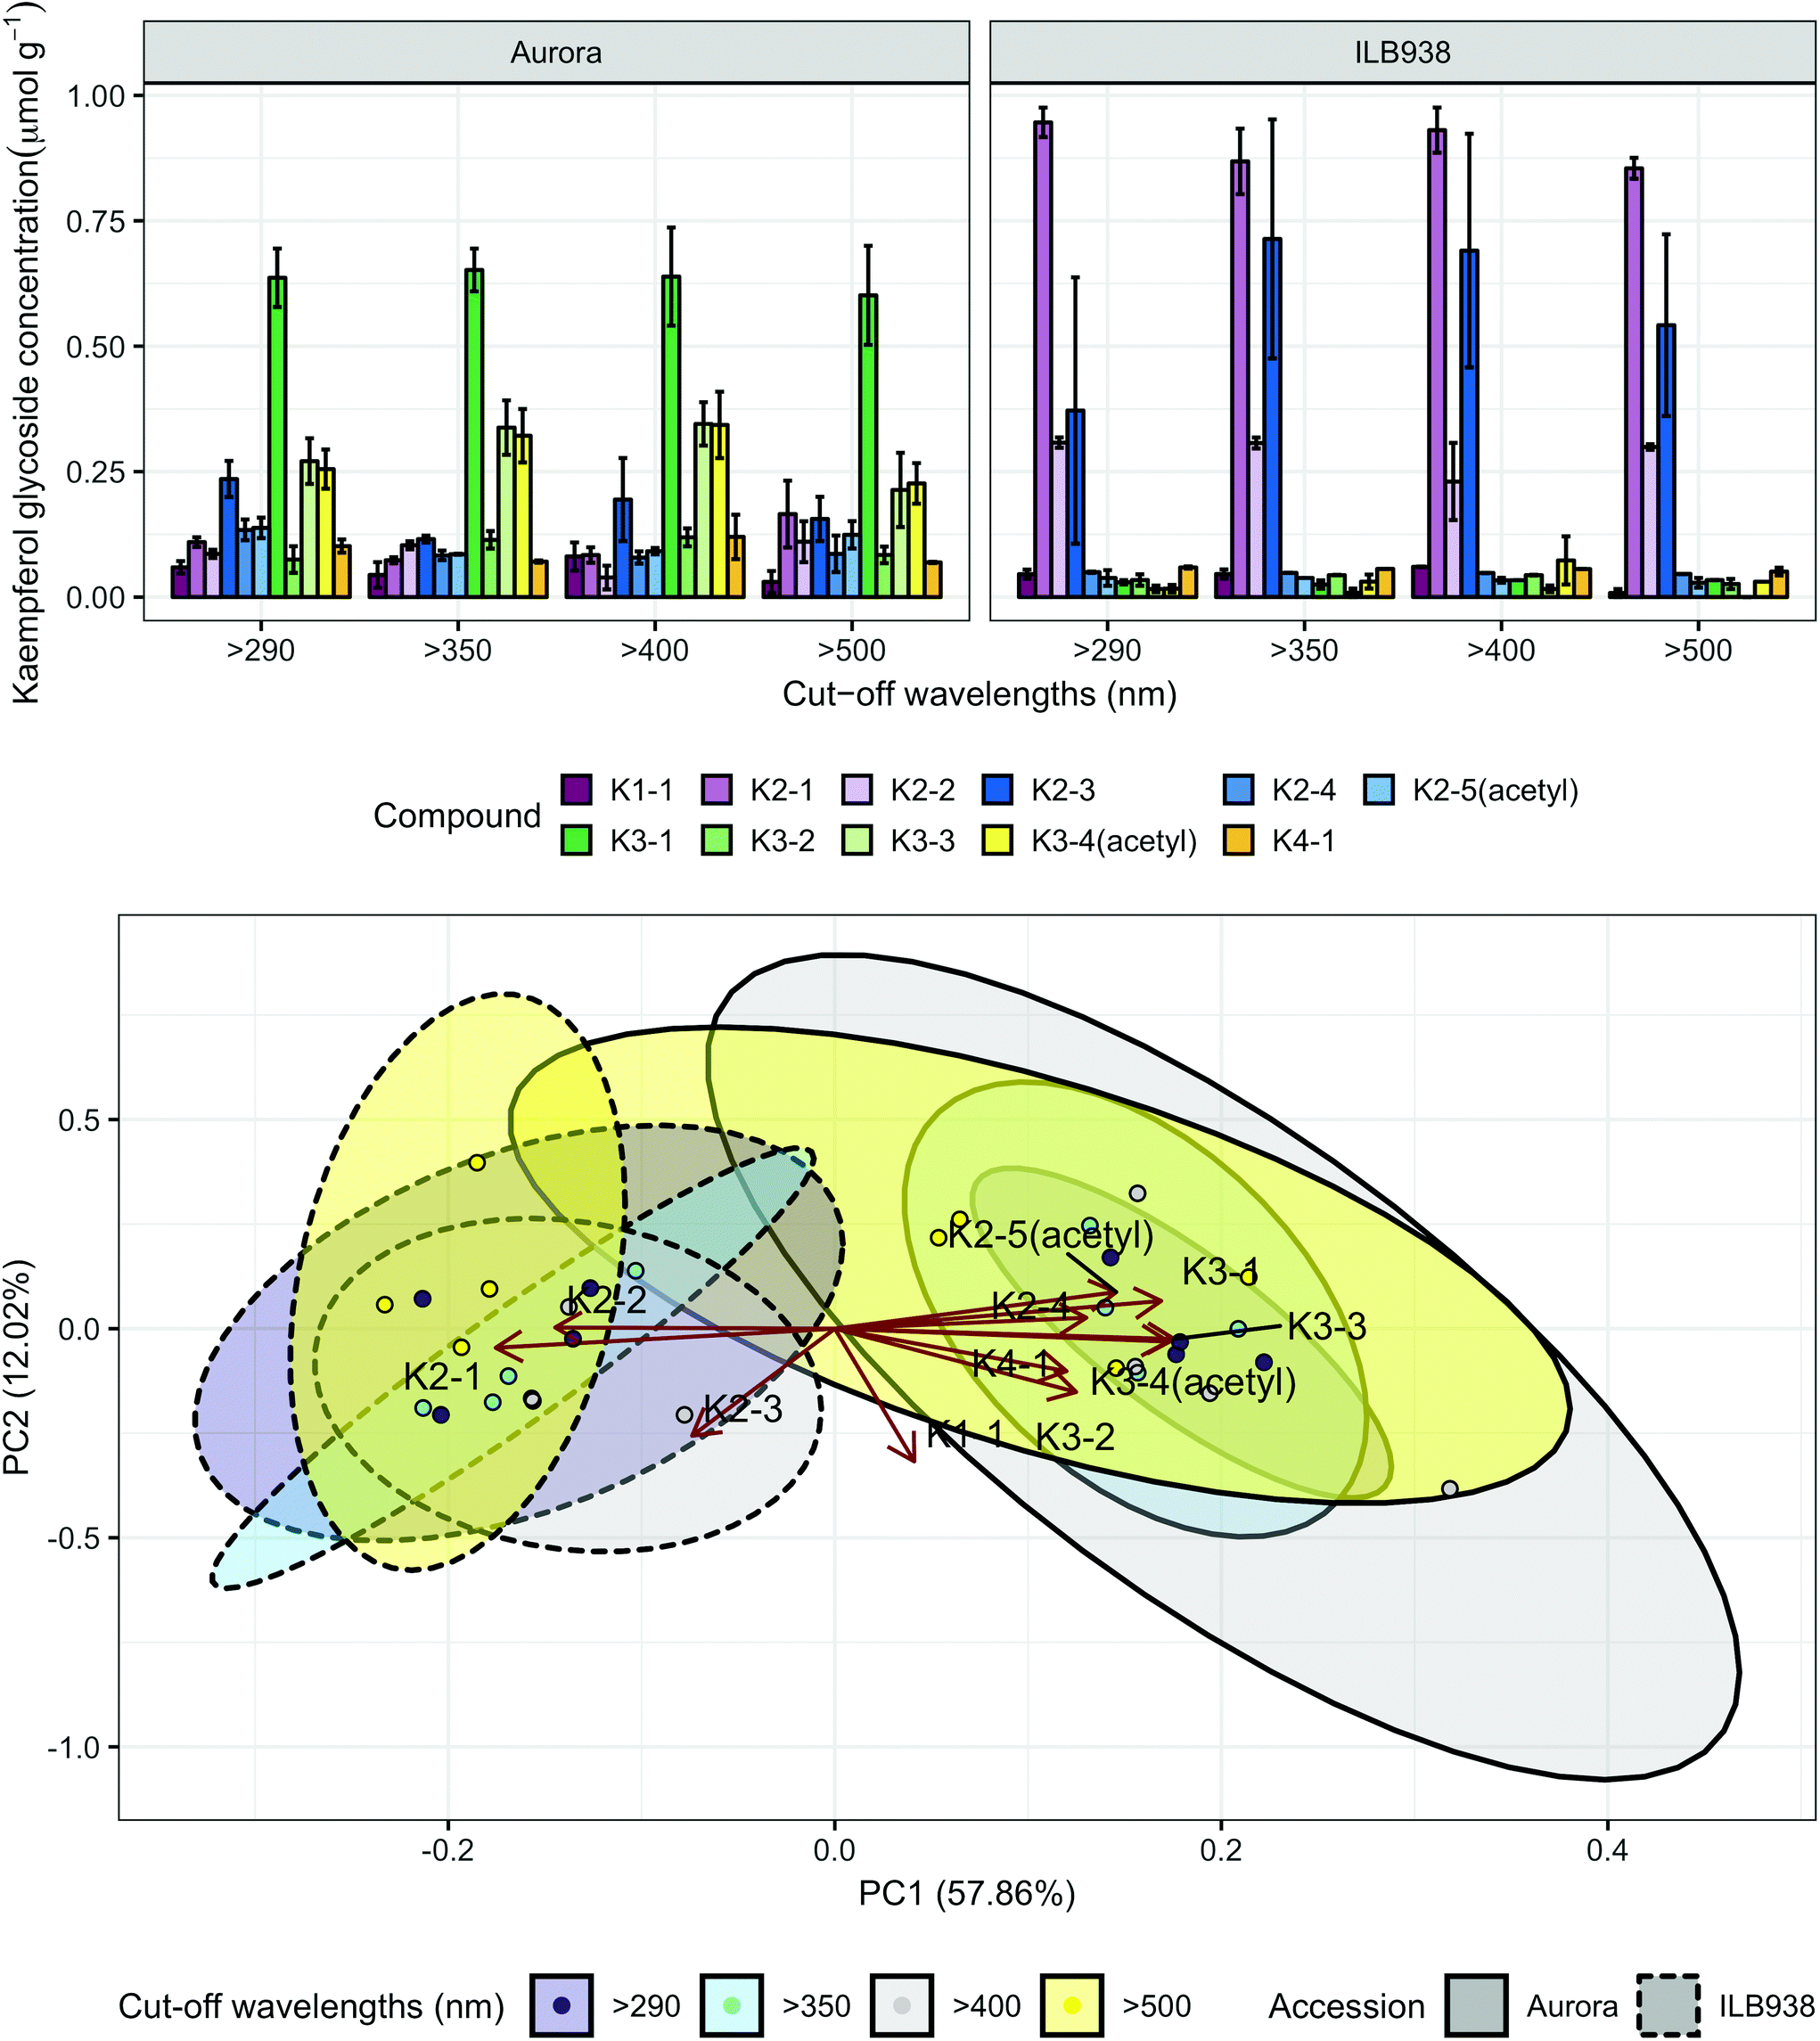 | ||
| Fig. 4 Kaempferol profiles of accessions aurora and ILB938 of V. faba grown in sunlight under four filters. Top, molar concentrations (μmol g−1) of individual kaempferol glycosides per unit leaf dry mass. Values are means ± SE of four replicate blocks, 163 sampled plants in total. Bottom, principal component analysis (PCA) of the kaempferol glycoside profile. The ellipses show 0.95 confidence regions assuming bivariate t distribution. The first two principal components together explain 70% of the variance. All kaempferol compounds are shown with their labels. The corresponding compound names and their rotation values for PC1 and PC2 are shown in Table 2. | ||
| Compound name | Abbreviationa | Accession × filter interaction (p) | Accession effect (p) | Filter effect (p) | Different filter effect in two accession (p) | PC1 | PC2 | |
|---|---|---|---|---|---|---|---|---|
| Short UV | Blue | |||||||
| a The first number in the label stands for the number of sugars attached to the aglycone, and when “acetyl” is in the label, the compound is acetylated. The p values for interaction between accession and filter, main effect of accession and filter are shown. Significant interactions (p < 0.05), overall treatment effects (p < 0.01), and effects of solar short UV and blue light (p < 0.01) are shown in bold. Accession legend: A (Aurora), I (ILB938). When accession effect is significant (p < 0.05), “>”, “<” are used to indicate in which accession the compound has higher concentration. “≈” is used when accession effect is not significant. “≫”and “≪” are used when the difference between accessions was greater than or equal to 5 fold. The rotation value for PC1 and PC2 are listed for each compound. The rotation value around 0.5 or more than 0.5 are shown in bold. | ||||||||
| Kaempferol-3-O-rhamnoside | K1-1 | 0.876 | A ≈ I (0.258) | 0.088 | 0.088 | —0.683 | ||
| Kaempferol-3-O-arabinoside-7-O-rhamnoside | K2-1 | 0.224 | A ≪ I (<0.0001) | 0.556 | −0.377 | —0.098 | ||
| Kaempferol-3-O-rhamnoside-7-O-rhamnoside | K2-2 | 0.943 | A < I (<0.0001) | 0.131 | −0.311 | 0.006 | ||
| Kaempferol-3-O-galactoside-7-O-rhamnoside | K2-3 | 0.550 | A < I (0.009) | 0.350 | −0.159 | —0.551 | ||
| Kaempferol-3-O-rhamnoglucoside | K2-4 | 0.338 | A > I (0.001) | 0.025 | 0.280 | 0.056 | ||
| Kaempferol-3-O-acetyl-galactoside-7-O-rhamnoside | K2-5(acetyl) | 0.204 | A > I (<0.0001) | 0.258 | 0.313 | 0.188 | ||
| Kampferol-3-O-rhamnoarabinoside-7-O-rhamnoside | K3-1 | 0.956 | A ≫ I (<0.0001) | 0.982 | 0.363 | 0.143 | ||
| Kaempferol-3-O-rhamnogalactoside-7-O-rhamnoside | K3-2 | 0.448 | A > I (<0.0001) | 0.336 | 0.268 | —0.326 | ||
| Kaempferol-3-O-rhamnoglucoside-7-O-rhamnoside | K3-3 | 0.392 | A ≫ I (<0.0001) | 0.306 | 0.378 | —0.054 | ||
| Kaempferol-3-O-acetyl-rhamnogalactoside-7-O-rhamnoside | K3-4(acetyl) | 0.463 | A ≫ I (<0.0001) | 0.365 | 0.371 | —0.066 | ||
| Kaempferol-3-O-rhamnoglucoside-7-O-rhamnoside-4′-rhamnoside | K4-1 | 0.435 | A > I (0.011) | 0.326 | 0.258 | —0.219 | ||
| Quercetin-3-O-rhamnoside-7-O-rhamnoside | Q2-1 | 0.0003 | A < I (<0.0001) | <0.0001 | <0.0001 (I) | 0.0079 (I) | 0.131 | 0.634 |
| Quercetin-3-O-rhamnoside-7-O-galactoside | Q2-2 | 0.0002 | A ≫ I (<0.0001) | 0.0005 | 0.0287 (A) | −0.475 | 0.052 | |
| Quercetin-3-O-rhamnoglucoside | Q2-3 | 0.907 | A ≈ I (0.051) | 0.747 | 0.060 | 0.402 | ||
| Quercetin-3-O-acetyl-galactoside-7-O-rhamnoside | Q2-4(acetyl) | Not detected in I | 0.196 | −0.409 | 0.135 | |||
| Quercetin-3-O-rhamnoarabinoside-7-O-rhamnoside | Q3-1 | 0.474 | A ≈ I (0.081) | 0.558 | −0.322 | 0.081 | ||
| Quercetin-3-O-rhamnogalactoside-7-O-rhamnoside | Q3-2 | 0.008 | A > I (<0.0001) | 0.002 | 0.0183 (A) | −0.477 | 0.132 | |
| Quercetin-3-O-rhamnoglucoside-7-O-rhamnoside | Q3-3 | Not detected in I | 0.002 | 0.0285 (A) | −0.496 | —0.003 | ||
| Quercetin-3-O-rhamnorhamnogalactoside | Q3-4 | 0.018 | A > I (0.026) | 0.002 | <0.0001 (I) | 0.0001 (I) | 0.096 | 0.625 |
| Caffeoyl-glucoside | 0.001 | A < I (0.0005) | 0.720 | |||||
| Feruloyl-glucoside | 0.028 | A > I (0.0006) | 0.080 | |||||
| Sinapoyl-glucoside | 0.113 | A > I (0.005) | 0.0004 | 0.002 (A & I) | ||||
| Unknown 1 | 0.908 | A > I (0.004) | 0.153 | |||||
| Unknown 2 | 0.106 | A ≈ I (0.362) | 0.004 | 0.033 (A & I) | ||||
The variation among replicates for total quercetin (sum of quercetin glycosides) concentration was higher in ILB938 than in Aurora (p < 0.001, Fig. 3), primarily due to the greater standard deviation of Q2-3 (Quercetin-3-O-rhamnoglucoside) in ILB938 (Fig. 5). Short UV radiation increased total quercetin concentration (p = 0.001) in Aurora, while the response of total quercetin in ILB938 to the filter treatments was not statistically significant due to the large variation caused by Q2-3. Two of the quercetin glycosides quantified in Aurora were not detected in ILB938: Q2-4 (acetyl) (quercetin-3-O-acetyl-galactoside-7-O-rhamnoside) and Q3-3 (quercetin-3-O-rhamnoglucoside-7-O-rhamnoside). The PCA for quercetin glycosides separated the two accessions in PC1, which accounted for 49% of the variation (Fig. 5). In Aurora, “>290 nm” filter and “>500 nm” filter were clearly discriminated in PC1 due to the responses of Q2-2, Q2-4 (acetyl), Q3-2 and Q3-3 (they had absolute rotation values around 0.5 in PC1, Table 2). In ILB938, filter treatments were separated in the second principal component (PC2), which explained 24% of the variation. Q2-1 and Q3-4, having absolute rotation values of 0.634 and 0.625 respectively in PC2, responded significantly to both blue and short UV light in ILB938. Quercetin glycosides responded to filter treatment dependent on their glycosylation pattern. In Aurora, the concentration of Q2-2 (quercetin-3-O-rhamnoside-7-O-galactoside) increased with short UV radiation, while those of Q3-2 (quercetin-3-O-rhamnogalactoside-7-O-rhamnoside) and Q3-3 (quercetin-3-O-rhamnoglucoside-7-O-rhamnoside) increased with blue light (Fig. 5 and Table 2). In ILB938, in contrast, the concentrations of Q2-1 (quercetin-3-O-rhamnoside-7-O-rhamnoside) and Q3-4 (quercetin-3-O-rhamnorahmnogalactoside) increased with both short UV and blue light (Fig. 5 and Table 2). Five phenolic acids were found in leaf samples, out of which two could not be identified (Table 2 and ESI Table 3†). Filter treatments did not affect total phenolic acid concentration in either accession (p = 0.168) (Fig. 6). Of the individual phenolic acids, blue light induced sinapoyl-glucoside in both accessions (p = 0.002), while short UV increased the concentration of unknown2 in both accessions (p = 0.033) (Fig. 6 and Table 2).
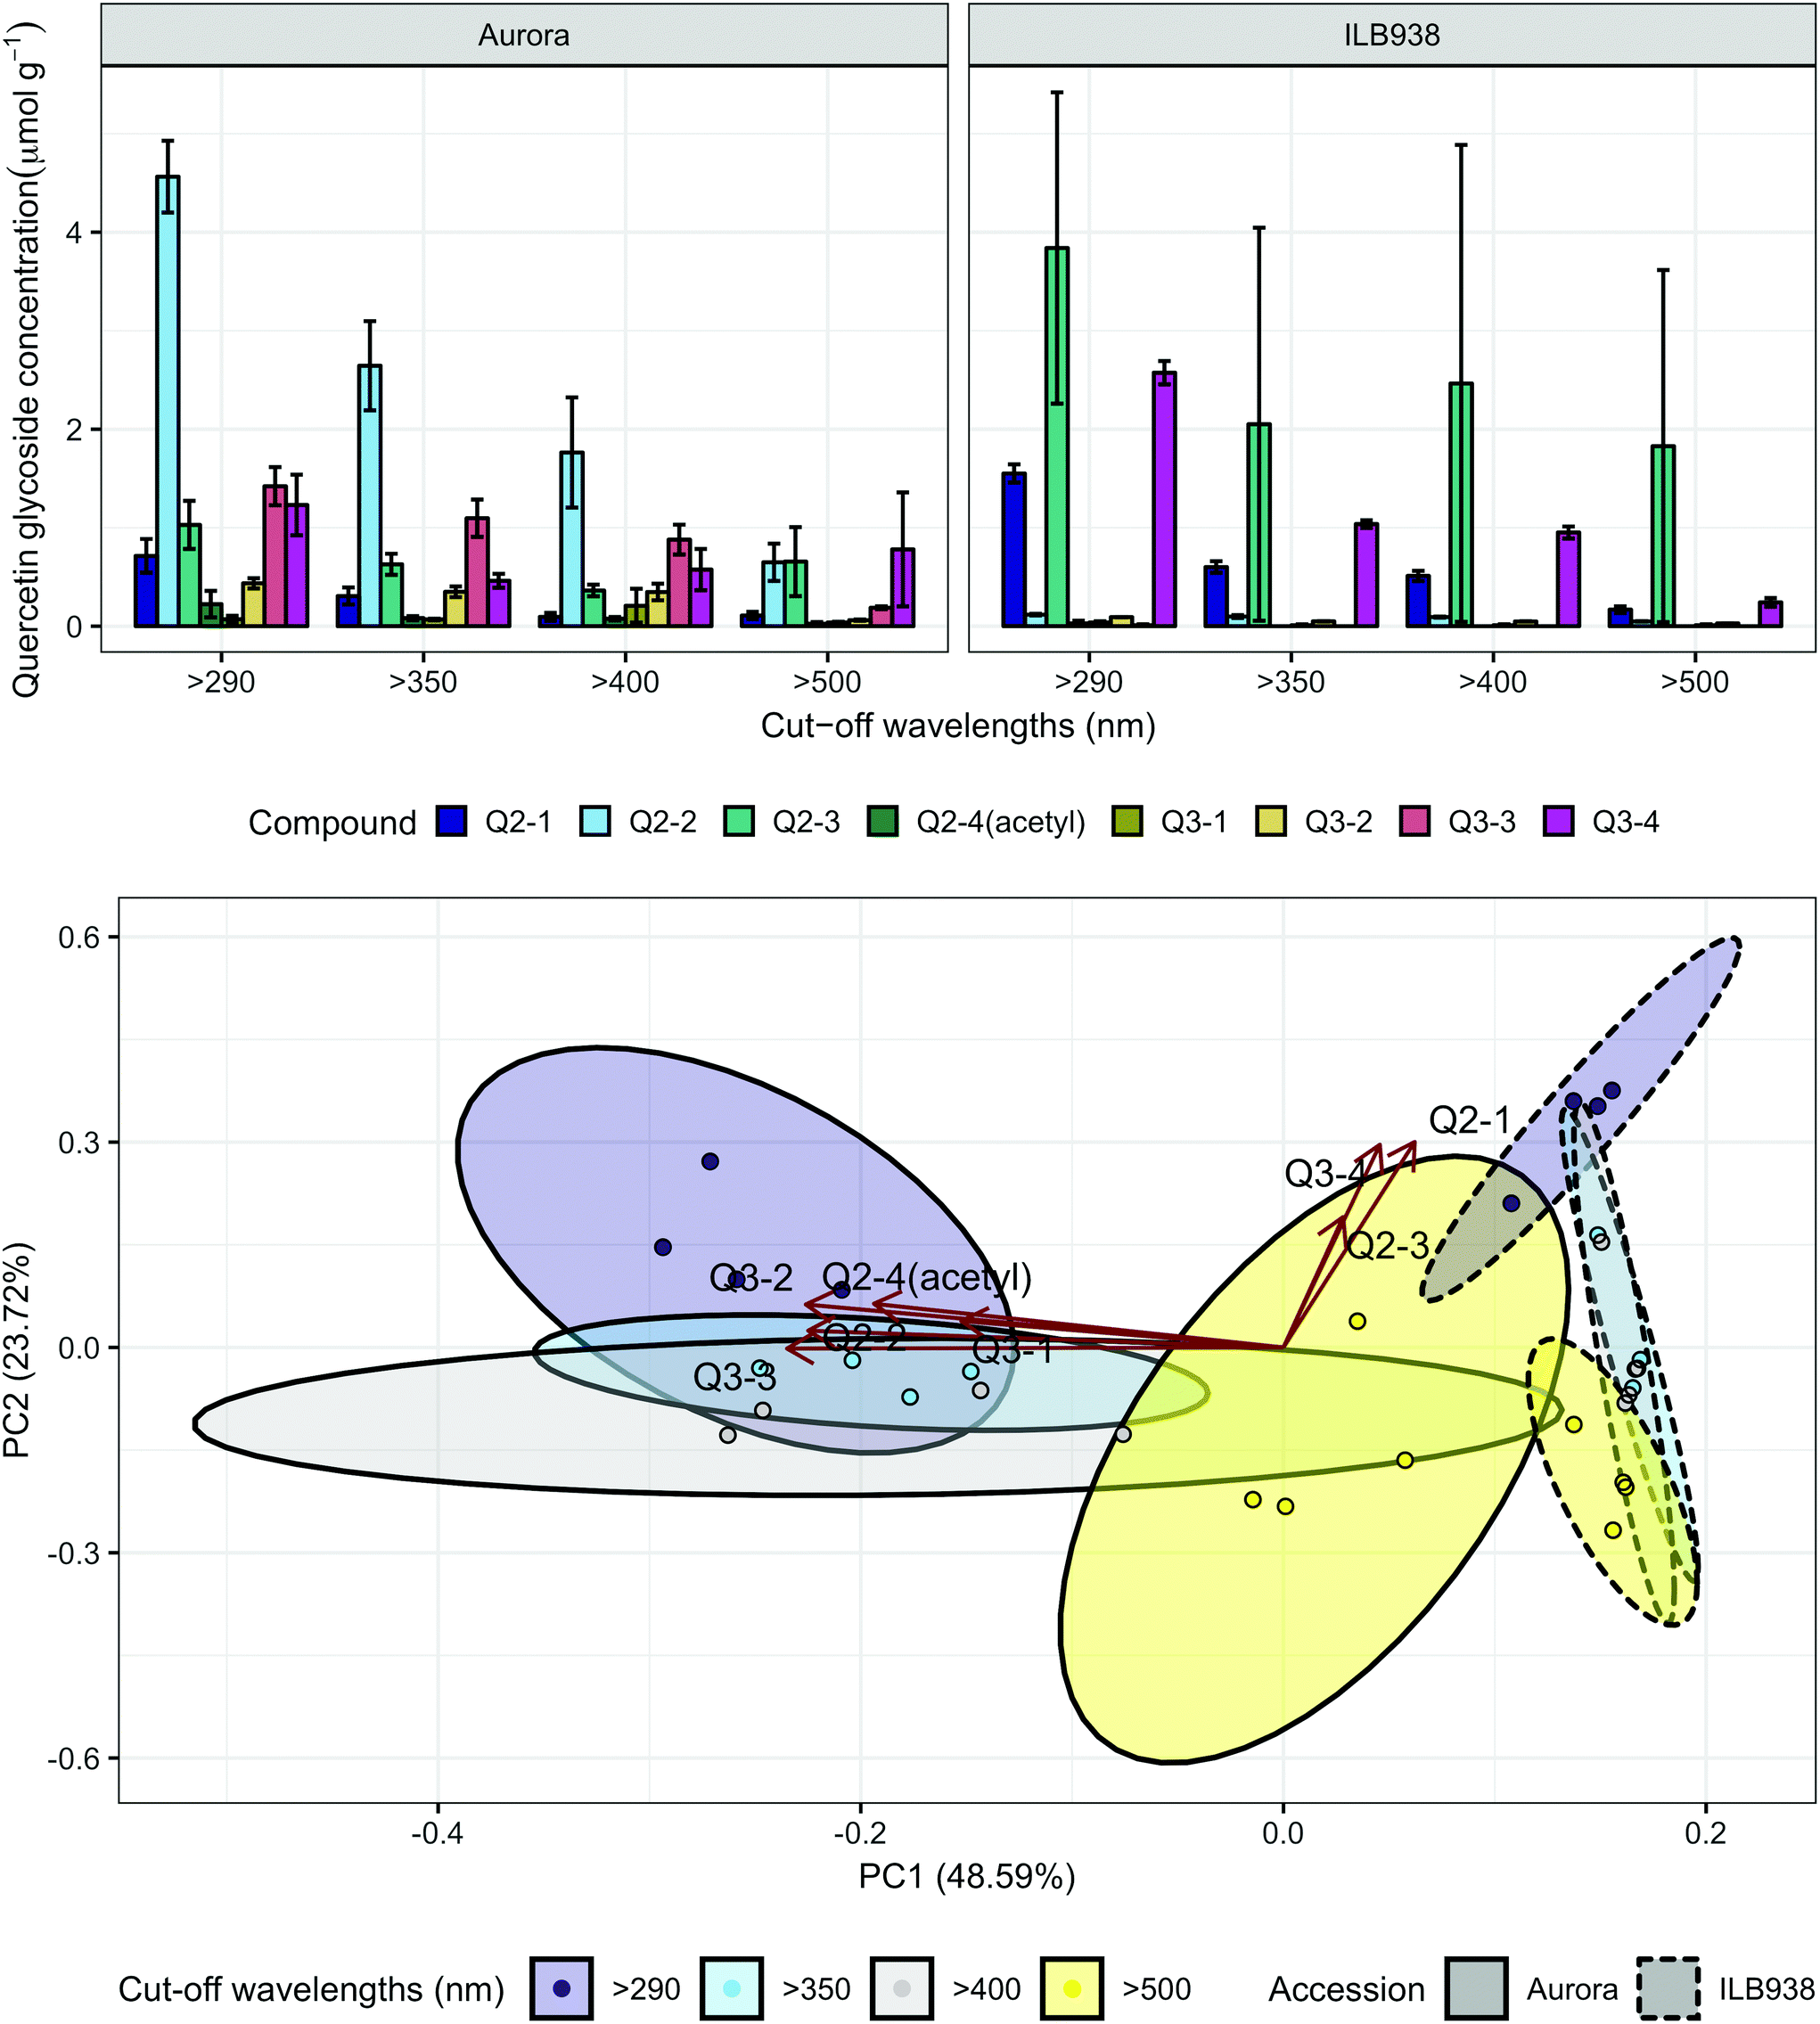 | ||
| Fig. 5 Quercetin profiles of accessions aurora and ILB938 of V. faba grown in sunlight under four filters. Top, molar concentrations (μmol g−1) of individual quercetin glycosides per unit leaf dry mass. Values are means ± SE of four replicate blocks, 163 sampled plants in total. Bottom, principal component analysis (PCA) of the quercetin glycoside profile. The ellipses show 0.95 confidence regions assuming bivariate t distribution. The first two principal components together explain 72% of the variance. All quercetin compounds are shown with their labels. The corresponding compound names and their rotation values for PC1 and PC2 are shown in Table 2. | ||
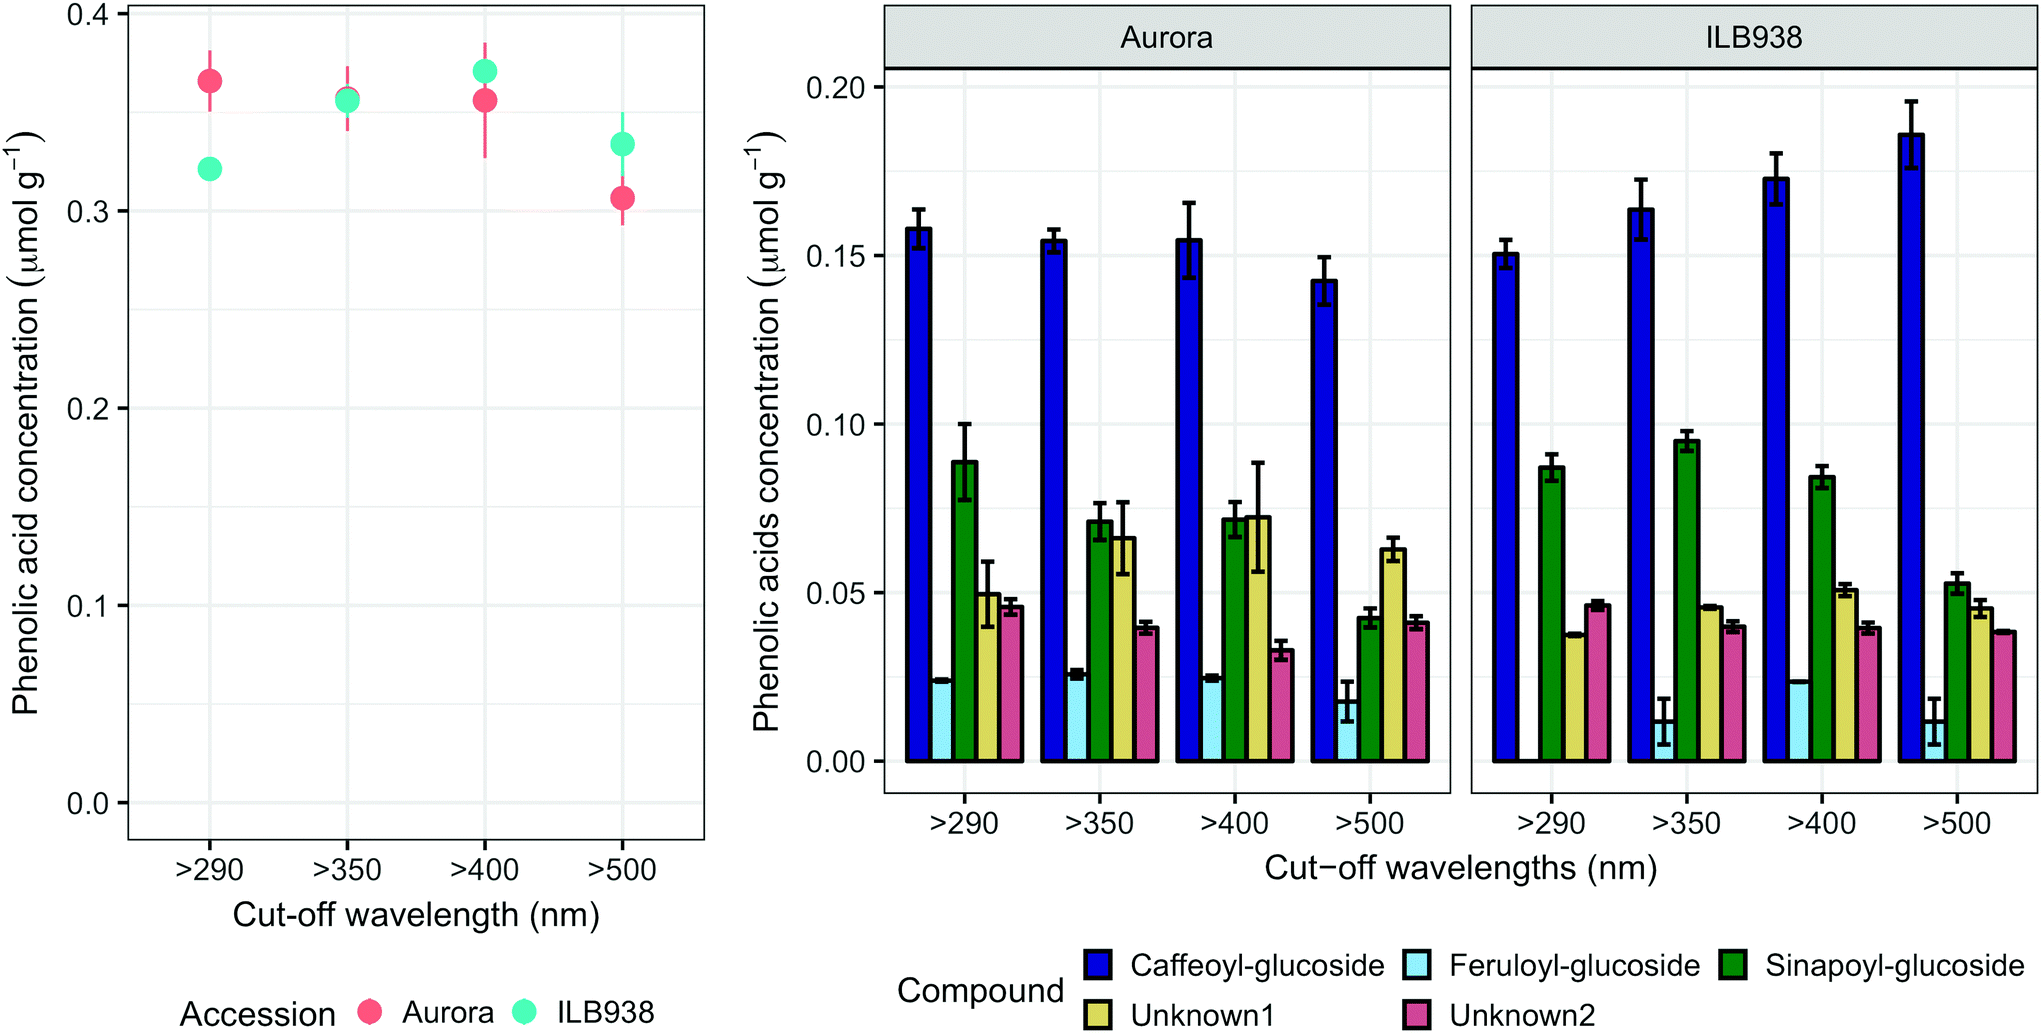 | ||
| Fig. 6 Phenolic acids in plants of accessions aurora and ILB938 of V. faba grown in sunlight under four filters. Whole-leaf molar concentrations (μmol g−1) of total phenolic acids and molar concentration of individual phenolic acid compounds. All values are means ± SE of four replicate blocks, 163 sampled plants in total. | ||
Gene transcript abundance
The lack of significant interaction (accession × filter-treatment) in our data indicated that transcript abundance of all seven genes was not differentially affected by the filter treatments in Aurora and ILB938 (Fig. 7). However, ANOVA detected significant main effects of accession for all these genes, and of the filter treatment for HY5 and TAT3 (Fig. 7). After 30 d of exposure to blue light, stable transcript levels of genes involved in light signaling (HY5, p = 0.007) and JA signaling (TAT3, p = 0.0548) increased in both accessions. For all seven investigated genes, transcript abundance was higher in Aurora than in ILB938 under all filter treatments (Fig. 7). For example, the two largest mean differences between the two accessions across treatments were 132-fold in CHS, an enzyme involved early in the flavonoid pathway, and 30-fold in DOGT1, an enzyme reported to be involved in glucosylation at position 7 of flavonoid aglycones (Fig. 7).40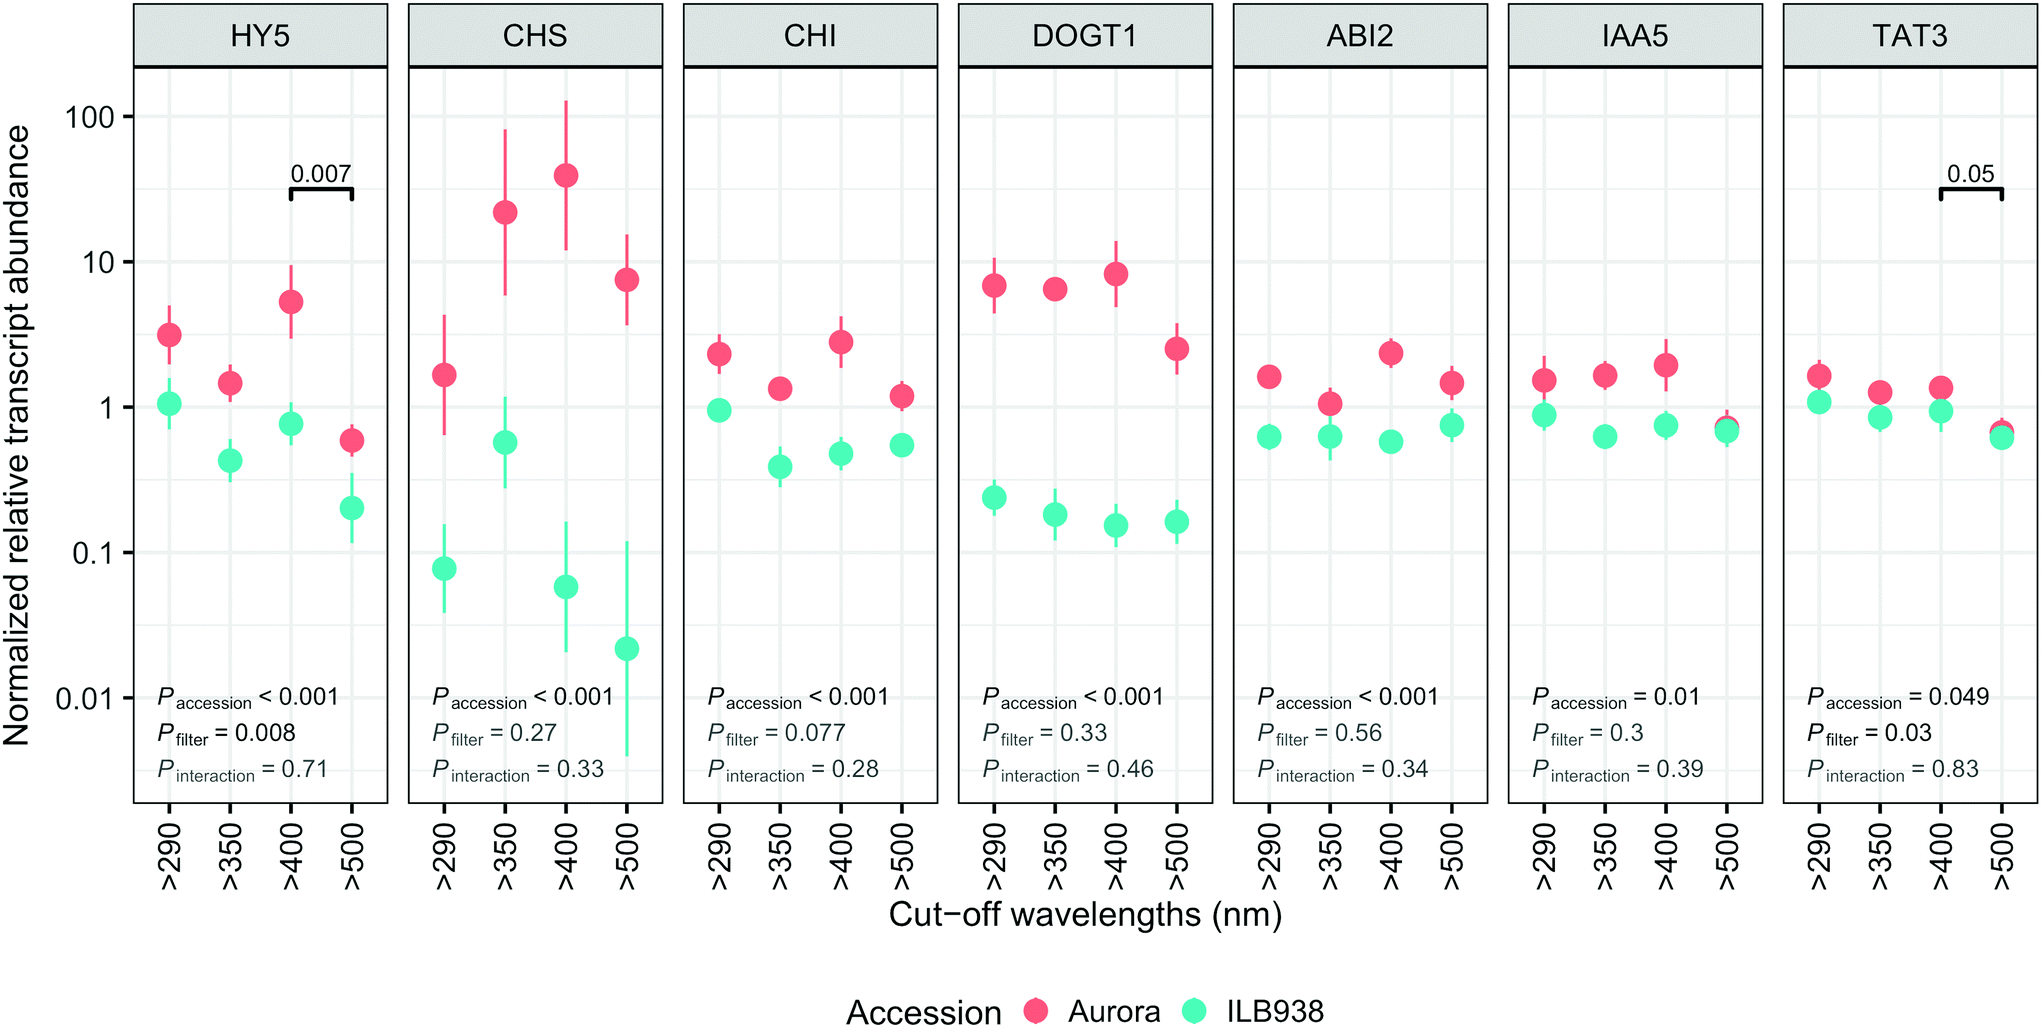 | ||
| Fig. 7 Normalized relative transcript abundance scaled to average expression of all genes in each run: HY5, CHS, CHI, DOGT1, ABI2, IAA5 AND TAT3 in plants of accessions aurora and ILB938 of V. faba grown in sunlight under four filters. Values are plotted on a logarithmic scale with mean ± SE of four replicate blocks, 163 sampled plants in total, computed using log10 transformed data. Short UV (290–350 nm) effect was assessed by comparing “>290 nm” and “>350 nm”; long UV (350–400 nm) effect was assessed by comparing “>350 nm” and “>400 nm”; blue light effect was assessed by comparing “>400 nm” and “>500 nm”. The numbers above the horizontal bars indicate the p-value for significant differences between pairs of filter-treatments. The numbers in the lower left corner give the p-values for the main effects of accession and filter treatment and the interaction between accession and filter treatment, from anova.” | ||
Discussion
Both short UV and blue radiation induced phenolic accumulation in the leaves of two V. faba accessions by increasing the concentration of quercetin glycosides, while long UV radiation showed no significant effect. The induction of flavonoids by short UV and blue light was validated by Dualex measurements throughout the experiment. In our experiment, quercetin glycosides were the main flavonoids in Aurora and ILB938, whereas kaempferol glycosides were the main flavonoids in the leaves of German winter (Hiverna and Nordica) and spring (Fuego and Espresso) cultivars of V. faba grown under greenhouse conditions, with quercetin having a relatively minor role.32 The differences may be due to the absence of UV treatment in the earlier experiment and/or genetic differences between the tested germplasm. The role of blue light in increasing the concentration of flavonoids in the epidermis and the whole leaf under natural light has been previously described in pea (Pisum sativum L.),41 a close relative of V. faba. In the present study, solar short UV radiation increased the flavonoid concentration in whole leaves even more than solar blue light. Similarly, a strong UV response in flavonoid concentration was observed in controlled environment in cabbage (Brassica oleracea L. var. capitata)42 and under natural solar radiation in A. thaliana.43,44Flavonoid profiles and glycosylation differed greatly between the two accessions. Glycosylation of flavonoids by UDP-Glycosyltransferases (UGTs) regulates flavonoid homeostasis by modifying the solubility, stability and antioxidant potential, as well as changing compartmentalization.45 Our data revealed consistently higher expression of DOGT1 in Aurora, implying higher glycosylation activity, which may explain the observation that the kaempferol glycosides in this accession had more sugar residues than those in ILB938. The different accession effects on mass and molar concentration of total kaempferol confirmed the different glycosylation pattern in the two accessions. This difference is important, and highlights that mass concentrations as used in many earlier studies of UV radiation effects on plants46 cannot be directly compared to the functionally more relevant molar concentrations. Short UV radiation and blue light significantly changed the profile of quercetin derivatives in the two accessions with distinct response patterns: in Aurora, the concentration of a di-glycoside increased in response to short UV radiation whereas the concentrations of two tri-glycosides increased in response to blue light; in ILB938, concentrations of a different di-glycoside and two tri-glycosides increased in response to both short UV radiation and blue light. These differences could affect the antioxidant capacity in the plant. A genotype effect on flavonoid profile has been previously observed in B. oleracea and B. rapa.31 In contrast to quercetin, filter treatments did not affect the kaempferol profile in the present experiment. No effect of accession or filter treatment was detected for total phenolic acid concentration, and as this concentration was only 2% of that of flavonoids, these acids could have played at most a minor role in UV protection in the current experiment.
While most previous research on gene regulation in response to UV radiation and blue light has been with short term treatments in controlled environments, our data, measured after 30 d of sunlight exposure, demonstrate that regulation of gene expression by blue light can be observed after longer treatments outdoors. Solar blue light, but not UV radiation, induced the expression of HY5, which is a well-known positive transcription factor in photomorphogenesis, activated by short-term exposure of plants to blue light through cryptochromes and by short-term exposure to UV-B radiation through UVR8.16,17 Our study shows that this response of HY5 to blue light also takes place outdoors after 30 d of exposure to sunlight. In contrast, lack of response of HY5 to 30 d of exposure to solar UV radiation suggests that transcriptional response to UV was transient. Blue light also increased the transcript level of jasmonic acid (JA) responsive gene TAT3, indicating that long-term exposure to solar blue light may modulate the JA signaling pathway. This crosstalk has been observed in A. thaliana, mediated through transcription factor AtMYC2.47 In contrast, effects of UV radiation or blue light on transcript abundance of CHS and CHI were not detected after 30 d of filter treatment while the total molar concentration of flavonoids increased, suggesting that the increase in expression of these genes may have also been transient. It is also possible that responses to other factors such as time of day may have masked the effect of the filter treatments on these genes.48 Although most light-induced responses in plants are regulated at the level of transcription,11 we cannot exclude the possibility that responses of the genes studied (e.g. HY5) are also regulated at post-transcriptional, translational or post-translational levels.
For all seven genes investigated, chosen a priori as markers for responses to UV radiation and blue light, the transcript abundance was higher in Aurora than in ILB938, but the size of the difference varied among genes. As transcript abundance values for these seven genes were normalized to those of housekeeping genes, the increase in abundance indicates that these seven genes were differently regulated in the two accessions. Because the accessions were compared under Nordic UV conditions, higher expression of these genes in Aurora could reflect adaptation to lower “basal” UV exposures than ILB938. The large difference in transcript abundance of the gene DOGT1 coding for a glucosylation enzyme may help explain the larger number of sugar moieties attached to kaempferol in Aurora than in ILB938.40 IAA5 is an auxin-inducible transcription repressor49 and its lower transcript abundance in ILB938 than in Aurora may be one reason for the greater height of ILB938. The difference in normalized transcript abundance between the two accessions is probably related to the different UV exposures at their regions of origin, as only small differences in mean temperature exist between these regions and the temperature during the experiment was also similar to this temperature.
In the present experiment, Aurora had higher photosynthesis rate, chlorophyll fluorescence and stomatal conductance than ILB938. Similarly, a previous comparison of eight accessions of V. faba showed higher stomatal conductance in drought-sensitive Aurora than in drought-tolerant ILB938.50 No effect of UV radiation was detected in growth and physiological traits, while blue light decreased plant height and leaf area in both accessions. This observation is consistent with the well-established effect of blue light on inhibiting hypocotyl elongation mediated by cryptochromes.51 Our results also agree with an outdoor experiment with pea showing that solar blue light was more effective than UV radiation in reducing plant height and leaf area.41
In general, our results showed significant differences in growth, physiological traits and flavonoid profiles between the two accessions. We also report, for the first time in V. faba, consistent difference of relative transcript abundance between two accessions on genes involved in light signaling (HY5), biosynthesis of flavonoid glycosides (CHS, CHI, and DOGT1) and responses to hormones (ABI2, IAA5 and TAT3). A significant effect of solar blue light, but not of UV radiation, was detected on growth traits and transcript abundance in 30 d-old plants, possibly as a result of acclimation to solar UV light at an early stage of plant development. Flavonoid profiles were very different in the two accessions, but this was not reflected in their growth response to UV. Both solar short UV radiation and blue light increased the concentration of flavonoids, suggesting that blue light responses could have contributed to plants’ tolerance of exposure to solar UV radiation.
The huge difference in elevation and latitude leads to distinct UV exposure between the two habitats where the ancestors of the two accessions evolved over several centuries. This can be expected to lead to differential adaptation in many characters including the responses to solar UV and blue light observed in our study. Further tests for differential adaptation to contrasting UV environments will require the screening of more accessions from both types of environment.
Conflicts of interest
There are no conflicts to declare.Acknowledgements
This research was supported by China Scholarship Council (to Y. Y.). We thank David Israel and Cyntia Ayala González for their help during the experiment. We also thank Jaakko A Tanskanen for finding homologous genes in the V. faba genome.References
- M. Chen, J. Chory and C. Fankhauser, Light Signal Transduction in Higher Plants, Annu. Rev. Genet., 2004, 38(1), 87–117, DOI:10.1146/annurev.genet.38.072902.092259.
- H. Smith, Phytochromes and light signal perception by plants—an emergingsynthesis, Nature, 2000, 407(6804), 585–591, DOI:10.1038/35036500.
- C. Lin, Plant blue-light receptors, Trends Plant Sci., 2000, 5(8), 337–342, DOI:10.1016/S1360-1385(00)01687-3.
- L. Rizzini, J. J. Favory and C. Cloix, et al., Perception of UV-B by the Arabidopsis UVR8 protein, Science, 2011, 332(6025), 103–106, DOI:10.1126/science.1200660.
- J. J. Casal, Phytochromes, Cryptochromes, Phototropin: Photoreceptor Interactions in Plants, Photochem. Photobiol., 2007, 71(1), 1–11, DOI:10.1562/0031-8655(2000)0710001PCPPII2.0.CO2.
- L. Ma, J. Li and L. Qu, et al., Light Control of Arabidopsis Development Entails Coordinated Regulation of Genome Expression and Cellular Pathways, Plant Cell, 2001, 13, 2589–2607, DOI:10.1105/tpc.010229.
- A. Sancar, Structure and Function of DNA Photolyase and Cryptochrome Blue-Light Photoreceptors, Chem. Rev., 2003, 103(6), 2203–2237, DOI:10.1021/cr0204348.
- M. M. Caldwell and S. D. Flint, Stratospheric ozone reduction, solar UV-B radiation and terrestrial ecosystems, Clim. Change, 1994, 28(4), 375–394, DOI:10.1007/BF01104080.
- C. L. Ballaré, M. C. Rousseau and P. S. Searles, et al., Impacts of solar ultraviolet-B radiation on terrestrial ecosystems of Tierra del Fuego (southern Argentina). An overview of recent progress, J. Photochem. Photobiol., B, 2001, 62(1–2), 67–77, DOI:10.1016/s1011-1344(01)00152-x.
- N. D. Paul and D. Gwynn-Jones, Ecological roles of solar UV radiation: towards an integrated approach, Trends Ecol. Evol., 2003, 18(1), 48–55, DOI:10.1016/S0169-5347(02)00014-9.
- G. I. Jenkins, Signal transduction in responses to UV-B radiation, Annu. Rev. Plant Biol., 2009, 60, 407–431, DOI:10.1146/annurev.arplant.59.032607.092953.
- G. Fuglevand, J. A. Jackson and G. I. Jenkins, UV-B, UV-A, and Blue Light Signal Transduction Pathways Interact Synergistically to Regulate Chalcone Synthase Gene Expression in Arabidopsis, Plant Cell Online, 1996, 8(12), 2347–2357, DOI:10.1105/tpc.8.12.2347.
- G. Agati and M. Tattini, Multiple functional roles of flavonoids in photoprotection, New Phytol., 2010, 186(4), 786–793, DOI:10.1111/j.1469-8137.2010.03269.x.
- J. B. Harborne and C. A. Williams, Advances in flavonoid research since 1992, Phytochemistry, 2000, 55(6), 481–504, DOI:10.1016/S0031-9422(00)00235-1.
- J.-J. Favory, A. Stec and H. Gruber, et al., Interaction of COP1 and UVR8 regulates UV-B-induced photomorphogenesis and stress acclimation in Arabidopsis, EMBO J., 2009, 28(5), 591–601, DOI:10.1038/emboj.2009.4.
- H. K. Wade, T. N. Bibikova, W. J. Valentine and G. I. Jenkins, Interactions within a network of phytochrome, cryptochrome and UV-B phototransduction pathways regulate chalcone synthase gene expression in Arabidopsis leaf tissue, Plant J., 2002, 25(6), 675–685, DOI:10.1046/j.1365-313x.2001.01001.x.
- S. N. Gangappa and J. F. Botto, The Multifaceted Roles of HY5 in Plant Growth and Development, Mol. Plant, 2016, 9(10), 1353–1365, DOI:10.1016/J.MOLP.2016.07.002.
- M. Zuk and M. Travisano, Models on the runway: how do we make replicas of the world?, Am. Nat., 2018, 192(1), 1–9, DOI:10.1086/697508.
- V. Caracuta, O. Barzilai and H. Khalaily, et al., The onset of faba bean farming in the Southern Levant, Sci. Rep., 2015, 5(1), 14370, DOI:10.1038/srep14370.
- D. A. Lawes, D. A. Bond and M. H. Poulsen, Classification, origin, breeding methods and objectives. Faba Bean 1983, pp. 23–76 Search PubMed.
- W. Link, T. J. Hocking and F. L. Stoddard, Evaluation of physiological traits for improving drought tolerance in faba bean (Vicia faba L.), Plant Soil, 2007, 292(1–2), 205–217 Search PubMed.
- J. Diamond and N. Y. London, Guns, Germs And Steel The Fates Of Human Societies. http://www.cloverport.kyschools.us/userfiles/3/Classes/308/Jared Diamond - Guns Germs and Steel.pdf.
- H. Khazaei, W. Link, K. Street and F. L. Stoddard, Short Communication ILB 938, a valuable faba bean (Vicia faba L.) accession. 2018. DOI:10.18730/60FD2.
- S. Madronich, S. Flocke, J. Zeng, I. Petropavlovskikh and J. Lee-Taylor, Tropospheric Ultraviolet-Visible Model (TUV), 2002 Search PubMed.
- P. J. Aphalo, The r4photobiology suite, UV4Plants Bulletin, 2015, 21–29, DOI:10.19232/uv4pb.2015.1.14.
- A. Lindfors, A. Heikkilä, J. Kaurola, T. Koskela and K. Lakkala, Reconstruction of Solar Spectral Surface UV Irradiances Using Radiative Transfer Simulations, Photochem. Photobiol., 2009, 85(5), 1233–1239, DOI:10.1111/j.1751-1097.2009.00578.x.
- P. J. Aphalo, A. Albert, L. O. Björn, A. R. Mcleod, T. M. Robson and E. Rosenqvist, Beyond the visible: A handbook of best practice in plant UV photobiology. https://helda.helsinki.fi/bitstream/handle/10138/37558/Handbook_BeyondtheVisible.pdf;sequence=1 Search PubMed.
- W. S. Rasband, ImageJ. Version 1.46 r, US National Institutes of Health, Bethesda, MD, 2012 Search PubMed.
- Z. G. Cerovic, G. Masdoumier, N. B. Ghozlen and G. Latouche, A new optical leaf-clip meter for simultaneous non-destructive assessment of leaf chlorophyll and epidermal flavonoids, Physiol. Plant., 2012, 146(3), 251–260, DOI:10.1111/j.1399-3054.2012.01639.x.
- S. Schmidt, M. Zietz, M. Schreiner, S. Rohn, L. W. Kroh and A. Krumbein, Genotypic and climatic influences on the concentration and composition of flavonoids in kale (Brassica oleracea var. sabellica), Food Chem., 2010, 119(4), 1293–1299, DOI:10.1016/j.foodchem.2009.09.004.
- S. Schmidt, M. Zietz, M. Schreiner, S. Rohn, L. W. Kroh and A. Krumbein, Identification of complex, naturally occurring flavonoid glycosides in kale (Brassica oleracea, var. sabellica) by high-performance liquid chromatography diode-array detection/electrospray ionization multi-stage mass spectrometry, Rapid Commun. Mass Spectrom., 2010, 24(14), 2009–2022, DOI:10.1002/rcm.4605.
- S. Neugart and M. Schreiner, Identification of complex, naturally occurring flavonoid glycosides in Vicia faba and Pisum sativum, leaves by HPLC-DAD-ESI-MSn and the genotypic effect on their flavonoid profile, Food Res. Int., 2015, 76, 114–121, DOI:10.1016/J.FOODRES.2015.02.021.
- A. Untergasser, I. Cutcutache and T. Koressaar, et al., Primer3-new capabilities and interfaces, Nucleic Acids Res., 2012, 40(15), e115, DOI:10.1093/nar/gks596.
- N. Gutierrez, M. J. Giménez, C. Palomino and C. M. Avila, Assessment of candidate reference genes for expression studies in Vicia faba L. by real-time quantitative PCR, Mol. Breed., 2011, 28(1), 13–24, DOI:10.1007/s11032-010-9456-7.
- J. Hellemans, G. Mortier, A. De Paepe, F. Speleman and J. Vandesompele, qBase relative quantification framework and software for management and automated analysis of real-time quantitative PCR data, Genome Biol., 2007, 8(2), R19, DOI:10.1186/gb-2007-8-2-r19.
- R Core Team, R: A Language and Environment for Statistical Computing, 2018, https://www.r-project.org/ Search PubMed.
- Linear Mixed-Effects Models: Basic Concepts and Examples, in Mixed-Effects Models in S and S-PLUS, Springer-Verlag, New York, 2000, pp. 3–56. DOI:10.1007/0-387-22747-4_1.
- A. R. Gregory Warnes, B. Bolker and T. Lumley, Johnson Contributions from Randall C Johnson RC. Package “gmodels” Title Various R Programming Tools for Model Fitting, 2018, https://cran.r-project.org/web/packages/gmodels/gmodels.pdf Search PubMed.
- Y. Tang, M. Horikoshi and W. Li, ggfortify: Unified Interface to Visualize Statistical Results of Popular R Packages, https://journal.r-project.org/archive/2016/RJ-2016-060/RJ-2016-060.pdf Search PubMed.
- E.-K. Lim, D. A. Ashford, B. Hou, R. G. Jackson and D. J. Bowles, Arabidopsis glycosyltransferases as biocatalysts in fermentation for regioselective synthesis of diverse quercetin glucosides, Biotechnol. Bioeng., 2004, 87(5), 623–631, DOI:10.1002/bit.20154.
- S. M. Siipola, T. Kotilainen and N. Sipari, et al., Epidermal UV-, A absorbance and whole-leaf flavonoid composition in pea respond more to solar blue light than to solar UV radiation, Plant, Cell Environ., 2015, 38(5), 941–952, DOI:10.1111/pce.12403.
- R. Gonzalez, A. R. Wellburn and N. D. Paul, Dose responses of two pea lines to ultraviolet-B radiation (280–315 nm), Physiol. Plant., 1998, 104(3), 373–378, DOI:10.1034/j.1399-3054.1998.1040312.x.
- L. O. Morales, R. Tegelberg, M. Brosché, M. Keinänen, A. Lindfors and P. J. Aphalo, Effects of solar UV-A and UV-B radiation on gene expression and phenolic accumulation in Betula pendula leaves, Tree Physiol., 2010, 30(7), 923–934, DOI:10.1093/treephys/tpq051.
- L. O. Morales, M. Brosché and J. Vainonen, et al., Multiple roles for UV RESISTANCE LOCUS8 in regulating gene expression and metabolite accumulation in Arabidopsis under solar ultraviolet radiation, Plant Physiol., 2013, 161(2), 744–759, DOI:10.1104/pp.112.211375.
- J. Le Roy, B. Huss, A. Creach, S. Hawkins and G. Neutelings, Glycosylation Is a Major Regulator of Phenylpropanoid Availability and Biological Activity in Plants, Front. Plant Sci., 2016, 7, 735, DOI:10.3389/fpls.2016.00735.
- G. I. Jenkins, Signal Transduction in Responses to UV-B Radiation, Annu. Rev. Plant Biol., 2009, 60, 407–431, DOI:10.1146/annurev.arplant.59.032607.092953.
- W. V. Yadav, C. Mallappa, S. N. Gangappa, S. Bhatia and S. Chattopadhyay, A Basic Helix-Loop-Helix Transcription Factor in Arabidopsis, MYC2, Acts as a Repressor of Blue Light–Mediated Photomorphogenic Growth, Plant Cell, 2005, 17(7), 1953–1966, DOI:10.1105/tpc.105.032060.
- M. A. Jansen, V. Gaba and B. M. Greenberg, Higher plants and UV-B radiation: balancing damage, repair and acclimation, Trends Plant Sci., 1998, 3(4), 131–135, DOI:10.1016/S1360-1385(98)01215-1.
- M. Salehin, R. Bagchi and M. Estelle, SCFTIR1/AFB-based auxin perception: mechanism and role in plant growth and development, Plant Cell, 2015, 27(1), 9–19, DOI:10.1105/tpc.114.133744.
- H. U. R. Khan, W. Link, T. J. Hocking and F. L. Stoddard, Evaluation of physiological traits for improving drought tolerance in faba bean (Vicia faba L.), Plant Soil, 2007, 292(1–2), 205–217, DOI:10.1007/s11104-007-9217-5.
- W. R. Briggs and E. Huala, Blue-Light Photoreceptors in Higher Plants, Annu. Rev. Cell Dev. Biol., 1999, 15(1), 33–62, DOI:10.1146/annurev.cellbio.15.1.33.
Footnote |
| † Electronic supplementary information (ESI) available: ESI Fig. 1–6 and Tables 1–3. See DOI: 10.1039/c8pp00567b |
| This journal is © The Royal Society of Chemistry and Owner Societies 2019 |