The electronic transitions of analogs of red wine pyranoanthocyanin pigments†
Received
5th September 2018
, Accepted 8th November 2018
First published on 14th November 2018
Abstract
There is increasing interest in using natural colorants like anthocyanins in cosmetics, food and pharmaceuticals as replacements for synthetic colorants. During the maturation of red wines, the anthocyanin pigments contained in grapes are transformed via reaction with copigments and metabolic products into pyranoanthocyanins, responsible in part for the final color of the wine. In order to understand structural effects on the absorption spectra of pyranoanthocyanins, the calculated excited state energies and spectroscopic states of a series of substitued pyranoflavylium cation analogs of pyranoanthocyanins have been compared to experimental spectroscopic data for these compounds. The vertical excitation energies, calculated by using the ADC(2) approach, gave excellent agreement with the experimental UV-Vis spectra and the nature of the lowest excited state correlates with the observed photophysical behavior in solution. The present results thus provide a basis for the design of new pyranoflavylium chromophores with the desired colors and photophysics, as well as for understanding the analogous properties of natural pyranoanthocyanin pigments in red wine.
Introduction
Anthocyanins are the natural plant pigments that impart most of the red, purple or blue colors to fruit and flowers, as well as sepals and leaves.1–4 Although anthocyanins are potentially of interest as natural coloring agents in food and consumer products, the complexity of their chemistry above ca. pH 3, which results in loss of most of the color at neutral pH, represent an impediment to more widespread practical application in the absence of economically viable methods of stabilization of the color.3 In this context, the chemical transformations that the anthocyanins present in the grapes (predominantly malvidin 3-O-glucoside) undergo as red wines mature are of particular interest as a potential source of more pH-stable coloring agents. These chemical transformations, involving reaction of the anthocyanins with copigments or yeast metabolites present in red wine form, in addition to other products, pyranoanthocyanins (Scheme 1).5–10 Pyranoanthocyanins make a major contribution to the final color of the wine5,10 and have been implicated in the sensory properties,11,12 anti-oxidant capacity13,14 and potential health benefits15 of moderate consumption of red wines.
 |
| | Scheme 1 Pyranoanthocyanin formation in red wines from the reaction of malvidin-3-O-glucoside. | |
Many aspects of the chemistry and photochemistry of anthocyanins have been clarified by studies of synthetic flavylium cations containing the same basic 7-hydroxyflavylium cation chromophore.1–3,16 Similarly, studies of synthetic pyranoflavylium cations should contribute to a better understanding of the much more complex, but analogous pyranoanthocyanins. In this context, the development of methodologies for the relatively facile preparation of a variety of aryl-substituted pyranoflavylium cations17,18 has recently opened the way for a number of such studies.19–26
Quantum chemical calculations are an important tool for understanding the nature of the excited states of organic chromophores and the origin of substituent and solvent effects27–29 and have been increasingly applied to anthocyanins and pyranoanthocyanins.13,30–42 As part of our interest in new natural plant-pigment-inspired chromophores with desirable colors and chemical and photophysical properties, we have examined the ability of the second order algebraic diagrammatic construction (ADC(2))43 method to predict the excited state energies, the electronic absorption spectra and the charge transfer character of the lowest excited singlet states of a series of eight aryl-substituted pyranoflavylium cations (Chart 1) in vacuum and in an acetonitrile solvent medium modeled by means of the conductor-like screening model (COSMO).44 The favorable agreement of the computational results with experimental data for these synthetic analogs of pyranoanthocyanins points to two important aspects of the present work. Thus, this level of calculation should serve as a reliable starting point for: (1) the design of new pyranoflavylium compounds with the desired colors and/or photophysical properties; (2) provide a deeper understanding of the interplay between chemical structure, color and the photochemical stability of both pyranoflavylium cations and pyranoanthocyanins.
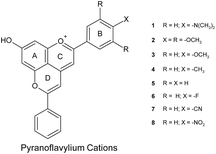 |
| | Chart 1 Molecular structure of the pyranoflavylium cations investigated with the definition and numbering scheme of substituents. | |
Materials and methods
Computational methodology
The ground state geometry optimization for all eight compounds was performed for the gas phase using the Møller–Plesset perturbation theory to second order (MP2)45 combined with the resolution of identity (RI).46 Geometries including solvent effects were obtained by means of density functional theory (DFT) with the B3-LYP functional47 and the COSMO solvation model44 with acetonitrile as an appropriate polar aprotic environment. Additionally, the Grimme dispersion correction D348 was included in the DFT calculations. Vertical excitation energies were computed for ten excited states, always using the second order algebraic diagrammatic construction [ADC(2)]43 method. Also in this case, solvent effects were calculated using COSMO.49 The adiabatic energy for the first excited singlet (S1) and triplet (T1) states was computed for the gas phase by optimizing at ADC(2) level the geometries in the S1 and T1 states, respectively. The static dielectric constant (ε) and/refractive index employed for acetonitrile in the COSMO calculations were 35.85050 and 1.3404,51 respectively. The def2-TZVP basis set52,53 was used in all calculations.
Optimized Cartesian coordinates for the eight pyranoflavylium cations calculated by the MP2 method for the gas phase and by B3-LYP in acetonitrile, respectively, are provided in the ESI (Tables S1–S8†). All DFT, MP2 and ADC(2) calculations were carried out using the Turbomole54 and Gaussian 0955 program suites. Intramolecular charge transfer values, q(CT), computed from an analysis of the transition density matrix,56 and natural transition orbitals (NTO's)57 were calculated and visualized with the TheoDORE56,58,59 program. The electronic spectra were visualized in TmoleX version 4.3.1 in Turbomole.
Experimental absorption spectra
The experimental UV-Vis absorption spectra of the pyranoflavylium cations in the range of 300–700 nm, were recorded on a HP8452A Diode Array Spectrometer in dry acetonitrile (distilled from CaH) containing 0.10 M trifluoroacetic acid (to suppress dissociation of the –OH group). The corresponding molar absorption coefficients at the maxima and the fluorescence rate constants were reported in previous works of the group.18,26 The experimental and calculated spectra were normalized relative to the highest maximum in the range from 300–700 nm to permit comparison.
Results and discussion
Geometry optimizations
The ground state geometries of compounds 1–8 were optimized at the MP2/def2-TZVP level of theory for the isolated systems. COSMO calculations with the B3-LYP/def2-TZVP approach were carried out to simulate the influence of an acetonitrile-like polar aprotic solvent medium. The corresponding geometry optimizations of the first excited singlet state (S1) were performed for the gas phase at the ADC(2)/def2-TZVP level of theory. Table 1 lists the most important geometrical parameter for these compounds, the optimum out-of-plane twist angles between the C-ring of the chromophore and the B-ring bearing the different substituents (see Chart 1). The most significant change in this C-ring/B-ring out-of-plane twist angle was found for the p-dimethylaminophenyl derivative (compound 1), which exhibited a significant increase in non-planarity, and for the p-nitrophenyl derivative (compound 8), which became somewhat more planar. The optimum ground state geometries of all of the eight compounds are shown in Fig. 1.
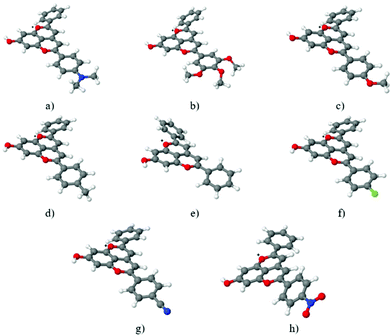 |
| | Fig. 1 Pyranoflavylium cation ground state structures optimized at the MP2/def2TZVP level of theory in the gas phase for compounds 1–8 (a–h). Atom color scheme: red = O, white = H, gray = C, blue = N and green = F. | |
Table 1 Twist angles of ring B relative to ring C (Chart 1) for the optimal geometries of compounds 1–8 in the ground state (S0) in the gas phase and in acetonitrile, for the first excited singlet state (S1) and the change in the C-ring/B-ring out-of-plane twist angle (ΔTwist angle) upon excitation in gas phase
| Compound |
Ground state (S0) |
First excited singlet state (S1) |
|
| Twist angle(°) |
Twist angle (°) |
ΔTwist angle (°) |
| Gas phase (MP2) |
Acetonitrile (B3-LYP) |
Gas phase (ADC(2)) |
Gas phase (ADC(2)) |
|
1
|
9.4 |
4.1 |
33.2 |
−23.8 |
|
2
|
1.2 |
1.9 |
0 |
+1.2 |
|
3
|
18.4 |
9.5 |
16.6 |
+1.8 |
|
4
|
22.1 |
17.1 |
23.1 |
−1.0 |
|
5
|
26.2 |
13.3 |
26.2 |
0 |
|
6
|
23.8 |
20.3 |
21.7 |
+2.1 |
|
7
|
23.3 |
17.0 |
24.3 |
−1.0 |
|
8
|
25.6 |
20.8 |
16.9 |
+8.8 |
Excited states and oscillator strengths
Vertical excitation energies, oscillator strengths and amount of CT (q(CT)) are shown in Table 2 for the five lowest excited states. The charge transfer is computed from ring B to the main body of the pyranoflavylium cations. Table 2 shows that the S1 state is always a bright state carrying significant oscillator strength. One can also find for each compound at least one state that has significant CT character, corresponding to the transfer of charge from ring B to the ACD ring system. More discussion on the changes in the electron density due to electronic excitation can be found below. The solvent effects computed for acetonitrile were generally small (≤0.1 eV) and generally to the red for the lowest excited state, the exceptions being a small blue shift for compound 3 and a much larger (ca. 0.22 eV) blue shift for compound 2. The values of the oscillator strengths were somewhat affected by the solvent environment and the q(CT) parameter decreased slightly for the charge-transfer transitions.
Table 2 Vertical excitation energies ΔE (in eV and nm), oscillator strength f and charge transfer q(CT) character (in units of e) calculated by ADC(2)/def2-TZVP for isolated systems and in a polar environment (acetonitrile). The states with predominant charge transfer character [i.e., q(CT) > 0.5] are indicated in bold
| Compound |
Excited state |
ΔE/eV, nm |
f
|
q(CT) |
ΔE/eV, nm |
f
|
q(CT) |
Exptl.a eV, nm |
| Gas phase |
Acetonitrile |
|
Ref. 18.
|
|
1
|
S1 |
2.20, 564 |
0.89
|
0.63
|
2.22, 558 |
0.95
|
0.62
|
2.25, 552 |
| S2 |
3.15, 394 |
0.16 |
0.19 |
3.07, 404 |
0.12 |
0.18 |
|
| S3 |
3.52, 352 |
0.28 |
0.14 |
3.52, 352 |
0.30 |
0.13 |
|
| S4 |
3.93, 316 |
0.15
|
0.60
|
3.99, 311 |
0.11
|
0.52
|
|
| S5 |
4.08, 304 |
0.18 |
0.32 |
4.13, 300 |
0.25 |
0.29 |
|
|
2
|
S1 |
2.38, 521 |
0.72
|
0.64
|
2.60, 477 |
0.83 |
0.44 |
2.58, 480 |
| S2 |
2.75, 450 |
0.00
|
0.75
|
3.05, 407 |
0.10 |
0.33 |
|
| S3 |
3.10, 400 |
0.20 |
0.22 |
3.22, 386 |
0.07
|
0.73
|
|
| S4 |
3.42, 363 |
0.24 |
0.13 |
3.41, 364 |
0.29 |
0.18 |
|
| S5 |
3.97, 312 |
0.19 |
0.20 |
4.09, 303 |
0.20 |
0.25 |
|
|
3
|
S1 |
2.67, 464 |
0.91
|
0.62
|
2.72, 456 |
0.86 |
0.33 |
2.59, 474 |
| S2 |
3.18, 390 |
0.13 |
0.27 |
3.17, 391 |
0.18 |
0.27 |
|
| S3 |
3.45, 359 |
0.31 |
0.17 |
3.51, 354 |
0.40 |
0.19 |
|
| S4 |
4.01, 309 |
0.01 |
0.05 |
4.25, 292 |
0.02 |
0.06 |
|
| S5 |
4.06, 306 |
0.02
|
0.98
|
4.28, 289 |
0.02
|
0.63
|
|
|
4
|
S1 |
2.87, 432 |
0.78 |
0.22 |
2.81, 441 |
0.66 |
0.19 |
2.78, 446 |
| S2 |
3.23, 384 |
0.23 |
0.30 |
3.24, 382 |
0.27 |
0.22 |
|
| S3 |
3.52, 352 |
0.40 |
0.20 |
3.60, 344 |
0.59 |
0.23 |
|
| S4 |
3.90, 318 |
0.01
|
0.76
|
4.16, 298 |
0.01
|
0.73
|
|
| S5 |
3.93, 315 |
0.01 |
0.07 |
4.21, 295 |
0.02 |
0.05 |
|
|
5
|
S1 |
2.90, 428 |
0.63 |
0.45 |
2.82, 439 |
0.56 |
0.16 |
2.78, 446 |
| S2 |
3.28, 378 |
0.23 |
0.42 |
3.28, 378 |
0.25 |
0.18 |
|
| S3 |
3.56, 348 |
0.50 |
0.38 |
3.67, 338 |
0.65 |
0.26 |
3.48, 356 |
| S4 |
3.89, 319 |
0.01 |
0.16 |
4.18, 296 |
0.02 |
0.05 |
|
| S5 |
3.94, 315 |
0.01
|
0.52
|
4.20, 295 |
0.01
|
0.69
|
|
|
6
|
S1 |
2.89,430 |
0.68 |
0.16 |
2.82, 440 |
0.58 |
0.15 |
2.77, 448 |
| S2 |
3.25, 382 |
0.24 |
0.20 |
3.26, 380 |
0.25 |
0.18 |
|
| S3 |
3.51, 353 |
0.43 |
0.19 |
3.63, 342 |
0.62 |
0.28 |
3.46, 358 |
| S4 |
3.87, 320 |
0.01 |
0.06 |
4.18, 296 |
0.02 |
0.04 |
|
| S5 |
4.21, 295 |
0.00
|
0.51
|
4.42, 281 |
0.00
|
0.62
|
|
|
7
|
S1 |
2.85, 436 |
0.62 |
0.15 |
2.76, 449 |
0.52 |
0.17 |
2.74, 452 |
| S2 |
3.24, 383 |
0.23 |
0.20 |
3.22, 385 |
0.24 |
0.17 |
|
| S3 |
3.51, 353 |
0.62 |
0.28 |
3.66, 339 |
0.81 |
0.26 |
3.48, 356 |
| S4 |
3.77, 329 |
0.01 |
0.06 |
4.09, 303 |
0.01 |
0.05 |
|
| S5 |
4.11, 302 |
0.02
|
0.66
|
4.27, 290 |
0.03
|
0.53
|
|
|
8
|
S1 |
2.87, 433 |
0.57 |
0.16 |
2.76, 449 |
0.50 |
0.15 |
2.77, 448 |
| S2 |
3.20, 388 |
0.22 |
0.13 |
3.19, 388 |
0.24 |
0.14 |
|
| S3 |
3.42, 362 |
0.01 |
0.10 |
3.69, 366 |
0.75 |
0.22 |
3.46, 358 |
| S4 |
3.61, 344 |
0.61 |
0.27 |
3.74, 332 |
0.06 |
0.05 |
|
| S5 |
3.79, 327 |
0.01 |
0.06 |
4.09, 303 |
0.01 |
0.06 |
|
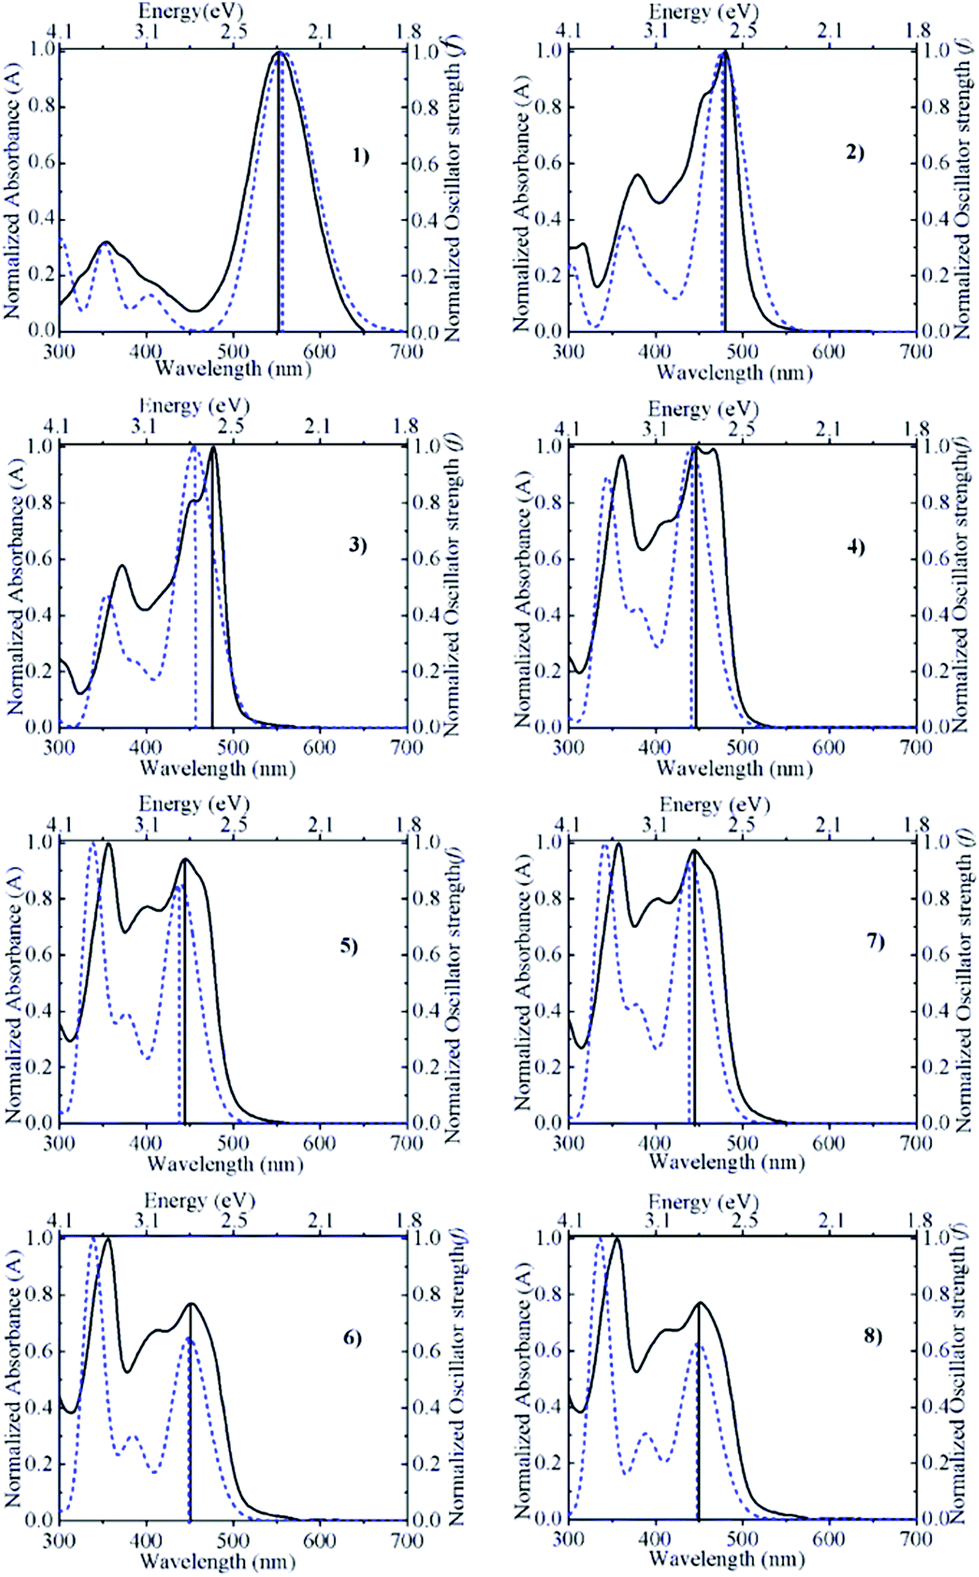
Correlation with experimental absorption spectroscopic measurements
Fig. 2 compares the absorption spectra calculated for acetonitrile with the actual experimental absorption spectra determined in acetonitrile solution containing 0.10 M trifluoroacetic acid (to suppress dissociation of the hydroxyl group of the pyranoflavylium cations). Both spectra were normalized at the wavelength of maximum intensity in order to facilitate the comparison. The match between the calculated and experimental spectra is generally quite good with regards to the position and basic shape of the spectra, with only a somewhat larger difference in the wavelength of maximum intensity in the case of compound 3. In addition, the calculated spectra qualitatively reproduce the change in the relative intensities of the lowest energy S1 transition and the prominent higher energy allowed transition (S3 in all but compound 2; Table 2). One deficiency of the calculations is the absolute magnitude of the oscillator strengths. Estimates of the molar absorption coefficients based on the calculated oscillator strengths (εmax ≈ 27![[thin space (1/6-em)]](https://www.rsc.org/images/entities/char_2009.gif) 000 fosc/Δ½ ≈ 9 × 10⁴fosc, in M−1 cm−1, assuming a spectral bandwidth Δ½ of ca. 0.3 eV)60 are about two (compound 1) to three-fold (compounds 2–8) larger than the experimental values. Rescaling by these factors brings the relative magnitudes of the molar absorption coefficients into much better agreement with experiment (Table 3). Although calculated oscillator strengths are known to be quite sensitive to the method and level of calculation employed, another factor not taken into account here is the fact that the solution spectrum of these compounds is a superposition of the individual spectra of the ensemble of conformations that differ due to differences in the extent of out-of-plane rotation of the B- and/or B′-rings relative to the remainder of the pyranoflavylium chromophore.
000 fosc/Δ½ ≈ 9 × 10⁴fosc, in M−1 cm−1, assuming a spectral bandwidth Δ½ of ca. 0.3 eV)60 are about two (compound 1) to three-fold (compounds 2–8) larger than the experimental values. Rescaling by these factors brings the relative magnitudes of the molar absorption coefficients into much better agreement with experiment (Table 3). Although calculated oscillator strengths are known to be quite sensitive to the method and level of calculation employed, another factor not taken into account here is the fact that the solution spectrum of these compounds is a superposition of the individual spectra of the ensemble of conformations that differ due to differences in the extent of out-of-plane rotation of the B- and/or B′-rings relative to the remainder of the pyranoflavylium chromophore.
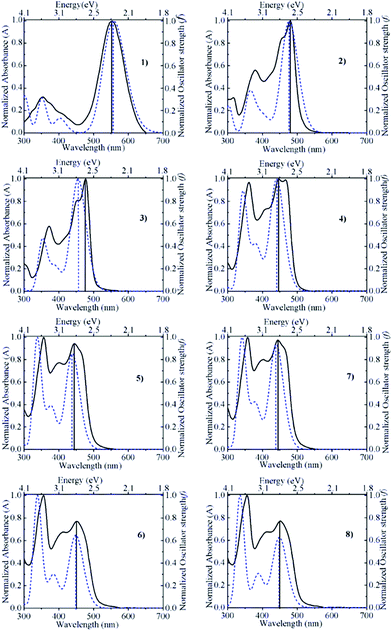 |
| | Fig. 2 Comparison between the normalized absorption spectra calculated by ADC(2)/def2-TZVP/COSMO (dashed curve) and determined experimentally in acetonitrile containing 0.10 M trifluoroacetic acid (solid curve) for compounds 1–8. | |
Table 3 Comparison of the calculated and experimental maximum wavelengths (nm), molar absorption coefficients and measured fluorescence emission rate constants in acetonitrile
| Compound |
State |
Calculateda |
Experimentalb |
| Wavelength (nm) |
Molar abs. Coef.c |
Wavelength (nm) |
Molar abs. Coef. |
k
f × 10−7 s−1d |
|
This work (Table 2).
Maximum wavelengths and molar absorption coefficients (in M−1 cm−1) from ref. 18.
Rescaled molar absorption coefficients estimated by multiplying the calculated oscillator strengths by 45000 M−1 cm−1 (compound 1) or 30000 M−1 cm−1 (compounds 2–8).
Fluorescence emission rate constants in acetonitrile acidified with trifluoroacetic acid, kf (±20%), from ref. 26.
Extremely weak fluorescence and lifetime <40 ps.
Very weak fluorescence with a very short lifetime (41 ps), ref. 26.
|
|
1
|
S1 |
558 |
43000 |
552 |
44200 |
—e |
| S3 |
352 |
13000 |
350 |
14100 |
|
| |
|
2
|
S1 |
477 |
25000 |
480 |
23200 |
—
|
| S4 |
364 |
9000 |
380 |
12900 |
|
| |
|
3
|
S1 |
456 |
26000 |
478 |
26500 |
12 |
| S3 |
354 |
12000 |
372 |
15300 |
|
| |
|
4
|
S1 |
441 |
20000 |
466 |
19200 |
4.2 |
| S3 |
344 |
18000 |
362 |
18800 |
|
| |
|
5
|
S1 |
439 |
17000 |
442 |
15200 |
4.5 |
| S3 |
338 |
19000 |
356 |
16200 |
|
| |
|
6
|
S1 |
440 |
18000 |
444 |
15500 |
3.3 |
| S3 |
342 |
19000 |
358 |
15900 |
|
| |
|
7
|
S1 |
449 |
16000 |
452 |
16000 |
3.1 |
| S3 |
339 |
24000 |
356 |
20700 |
|
| |
|
8
|
S1 |
449 |
15000 |
456 |
16000 |
2.7 |
| S3 |
366 |
22000 |
356 |
20600 |
|
Charge-transfer (CT) character of the electronic excitations
Fig. 3 shows the natural transition orbitals for the lowest energy transition of charge-transfer character for compounds 1–5. These orbitals provide a compact form for the characterization of the electronic excitation at the orbital level. In compounds 1–3, containing the strongest electron-donating substituents, the first excited state (S1) is a predominantly HOMO → LUMO π–π* bright state transition with substantial charge-transfer character (Table 2). The natural transition orbitals shown in Fig. 2 confirm the CT character of the S1 state of these three compounds from ring B primarily to rings C and D (Chart 1) and show the partial participation of the substituent in the CT process. For compound 1, transitions to S2, S3 and S5 are local excitations, while S4 is a dark CT state (Table 2). For compound 2, S2 is a dark CT state, while S3–S5 are local excitations. In compound 3, the next three transitions (involving S2, S3 and S4) are local excitations, followed by a dark CT state (S5) in which the methoxy substituent does not participate.
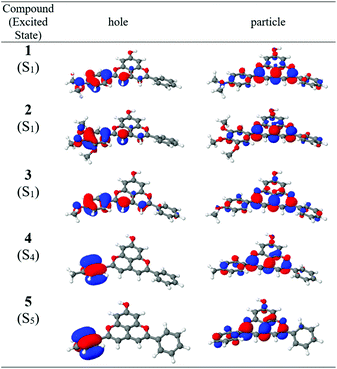 |
| | Fig. 3 Natural transition orbitals (NTO) for the lowest energy charge-transfer excitations of compounds 1–5 in gas phase. The S0 → S1 transitions of compounds 1–3 are highly allowed or bright, while the S0 → S4 transition of compound 4 and the S0 → S5 transition of compound 5 are low oscillator strength dark transitions. | |
Compounds 4–8, with the weaker electron-donating or electron-withdrawing substituents, exhibit excited states that are much more similar to each other. The lowest energy transition is a predominantly HOMO → LUMO π–π* bright local transition (Fig. S1†). The transitions involving S2, S3 and S4 are also local in nature, differing in their oscillator strengths. The transition to S2 is uniformly of moderate intensity and that to S4 of low intensity, while that to S3 increases in intensity (relative to the lowest energy bright transition) as the substituent becomes progressively more electron-withdrawing. The transition to S5 is the lowest energy CT transition, with a small oscillator strength. Finally, all five of the lowest energy transitions of compound 8, which has the strongest electron-withdrawing substituent, are local in nature.
Predicted photophysics of the pyranoflavylium cations
Fig. 4 provides a graphical representation of the first five calculated excited states of the eight pyranoflavylium cations, labelled with an indication of the CT character to these states. This figure shows that, for compound 1, a bright lowest excited singlet state exists which has significant CT character (0.6 e) both in the gas phase and in solution. For compounds 2 and 3, similar CT is found for the gas phase, but is significantly reduced in acetonitrile solution. For compounds 4–8, none of the lowest 3–4 excited states are CT states, with only dark CT states found at higher energies. These results of the calculations nicely rationalize the substituent effects on the photophysical behavior of these compounds that are observed experimentally in acidic acetonitrile solution.24–26 Compound 1, with a strongly electron donating –NMe2 group, has a lowest energy CT absorption band that is spectrally distinct from that of the other seven compounds (Fig. 2). In addition, due to the pronounced charge transfer character, this state is the only one that exhibits a significant increase in the B-ring/C-ring twist angle following excitation. This strongly suggests that the S1 state is a twisted intramolecular charge transfer (TICT) state. Moreover, this compound is essentially non-fluorescent in acidic acetonitrile solution and the decay back to the ground state is ultrafast (unpublished femtosecond pump–probe results). In contrast, compounds 4–8 have, as predicted, localized S1 states with nanosecond fluorescence lifetimes and fluorescence rate constants in the range of 3.5(±1.0) × 107 s−1, with perhaps a slight decreasing trend for the more electron-withdrawing substituents.26 For both compounds 2 and 3, with respectively three and one methoxy substituents in the B-ring, the lowest energy state has significant charge-transfer character in the gas phase (a bright CT transition, labelled CTa in Fig. 2), decreasing somewhat in acetonitrile. The good fluorescence quantum yield (0.43 ± 0.03) and the nanosecond fluorescence lifetime of the p-methoxy substituted compound 3 point to a locally excited S1 state.26 However, both the molar absorption coefficient and the fluorescence rate constant are significantly larger than those of compounds 4–8, consistent with residual CTa character in the lowest excited state of 3 in acetonitrile. Finally, the trimethoxy-substituted compound 2 exhibits photophysics intermediate between compounds 1 and 3. Although its absorption spectrum is much more similar to that of compound 3, it fluoresces very poorly with a very short lifetime (41 ps),26 consistent with S1 having significant charge transfer character (though apparently not a full TICT state).
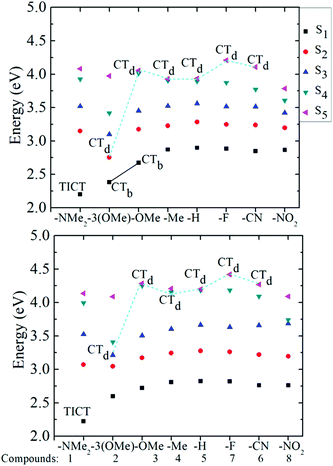 |
| | Fig. 4 The five lowest excited states of compounds 1–8 are shown for the gas phase in the upper panel and in acetonitrile in the lower panel; characterization of the calculated excitation energies according to charge transfer character: TICT, twisted intramolecular charge transfer state, CTb, bright charge transfer state, CTd, dark charge transfer state. States without labels are locally excited states. | |
Adiabatic excitation energies of S1 (ΔEad) and vertical fluorescence emission energies (ΔEfl) computed at the S1 minimum are presented in Table 4. The adiabatic energies are about 0.1–0.2 eV lower than the vertical excitation energies (Table 2) and a further similar decrease is observed between the adiabatic and fluorescence energies. Table 4 also presents estimated radiative lifetimes, in ns, calculated from the expression:61
| |  | (1) |
where
c is the speed of light. Oscillator strengths
f were reduced by a factor of three in order to compensate for the above-mentioned overestimation of experimental molar absorption coefficients. The scaled natural lifetimes agree quite well with the values of the reciprocal of the fluorescence rate constants (1/
kf,
Table 3). Finally,
Table 5 shows the calculated adiabatic and vertical phosphorescence energies and ring-B twist angles of the lowest excited triplet state of compounds
3–8, together with the experimental zero-zero energies for phosphorescence in an acidic isopropanol glass at 77 K.
26
Table 4 Adiabatic excitation and vertical fluorescence emission energies (eV) and computed radiative lifetimes τfl (ns) calculated for the gas phase at the ADC(2) level in comparison to experimental results in acidic acetonitrile solution
| Compound |
Calculated |
Experimentb |
| ΔEad |
ΔEfl (eV) |
τ
fla (ns) |
ΔEfl (eV) |
τ
flc (ns) |
|
Rescaled by a factor of three to compensate for the overestimated oscillator strengths.
Ref. 26.
τ
fl = 1/kf(see Table 3).
|
|
1
|
2.02 |
1.80 |
— |
— |
— |
|
2
|
2.08 |
1.73 |
30.3 |
— |
— |
|
3
|
2.57 |
2.46 |
12.6 |
2.51 |
8.3 |
|
4
|
2.72 |
2.36 |
15.3 |
2.51 |
23.8 |
|
5
|
2.69 |
2.31 |
20.7 |
2.51 |
22.2 |
|
6
|
2.70 |
2.23 |
20.4 |
2.52 |
30.3 |
|
7
|
2.62 |
2.31 |
21.0 |
2.45 |
32.3 |
|
8
|
2.61 |
2.17 |
26.1 |
2.41 |
37.0 |
Table 5 Calculated adiabatic and vertical phosphorescence transition energies ΔEST in comparison to experimental data. All energies in eV
| Compound |
Calculated |
Twist angle T1 min |
Experimenta |
| ΔEST(ad.) |
ΔEST(vert.) |
|
ΔEST (0–0) |
|
Energy of the 0–0 band of the phosphorescence spectrum at 77 K in an isopropanol glass.26
|
|
3
|
2.30 |
2.21 |
8.4 |
2.21 |
|
4
|
2.42 |
2.32 |
12.5 |
2.23 |
|
5
|
2.43 |
2.33 |
16.0 |
2.24 |
|
6
|
2.39 |
2.33 |
14.2 |
2.23 |
|
7
|
2.43 |
2.27 |
13.3 |
2.18 |
|
8
|
2.39 |
2.25 |
8.2 |
2.17 |
Conclusions
The agreement between theory and experiment for the general features of the absorption spectra, for the energies and photophysics of the S1 state and for the energies of the lowest energy triplet state of this series of substituted pyranoflavylium cations indicates that calculations at the level of theory employed here should constitute a reliable tool for the design of new pyranoflavylium cations with desirable colors and photophysical properties. There is a systematic influence of substituents ranging from electron-donating to electron-withdrawing groups on the character of the electronic transition and photophysics. The calculations show that the dimethylamino group in particular is responsible for a significant CT character, which results in a well-separated first absorption band assigned to a TICT state that is non-fluorescent in acetonitrile solution. The pyranoflavylium cations with one or three methoxy substituents still exhibit CT character in S1, but without the red shift of the absorption band found for the dimethylamino compound. The less strongly electron-donating or electron-withdrawing substituents of compounds 4–8, on the other hand, have a relatively small influence on the nature of the lowest electronic transitions and thus also on the color of these compounds. The analysis presented provides a framework for understanding in more detail the interplay between chemical structure, color and the photochemical stability of the pyranoanthocyanin-type pigments that form spontaneously from anthocyanins in red wine.
Conflicts of interest
There are no conflicts to declare.
Acknowledgements
We are grateful for generous support by the School of Pharmaceutical Science and Technology, Tianjin University, China, including computer time on the SPST computer cluster Arran, and also for computer time at the Vienna Scientific Cluster (VSC), Project No. 70376. F. H. Q and G. T. M. S. thank the CNPq and CAPES, Brazil, for fellowships and NAP-PhotoTech, INCT-Catálise (CNPq 465454/2014-3), and CNPq (FHQ Universal grant 408181/2016-3) for funding.
References
- F. H. Quina, P. F. Moreira, C. Vautier-Giongo, D. Rettori, R. F. Rodrigues, A. A. Freitas, P. F. Silva and A. L. Macanita, Photochemistry of anthocyanins and their biological role in plant tissues, Pure Appl. Chem., 2009, 81, 1687–1694 CAS.
- V. O. Silva, A. A. Freitas, A. L. Macanita and F. H. Quina, Chemistry and photochemistry of natural plant pigments: the anthocyanins, J. Phys. Org. Chem., 2016, 29, 594–599 CrossRef CAS.
- F. H. Quina and E. L. Bastos, Chemistry Inspired by the Colors of Fruits, Flowers and Wine, An. Acad. Bras. Cienc., 2018, 90, 681–695 CrossRef PubMed.
- F. Pina, J. Oliveira and V. de Freitas, Anthocyanins and derivatives are more than flavylium cations, Tetrahedron, 2015, 71, 3107–3114 CrossRef CAS.
- R. Brouillard, S. Chassaing and A. Fougerousse, Why are grape/fresh wine anthocyanins so simple and why is it that red wine color lasts so long?, Phytochemistry, 2003, 64, 1179–1186 CrossRef CAS PubMed.
- M. Schwarz, T. C. Wabnitz and P. Winterhalter, Pathway leading to the formation of anthocyanin-vinylphenol adducts and related pigments in red wines, J. Agric. Food Chem., 2003, 51, 3682–3687 CrossRef CAS PubMed.
- H. Fulcrand, M. Duenas, E. Salas and V. Cheynier, Phenolic reactions during winemaking and aging, Am. J. Enol. Vitic., 2006, 57, 289–297 CAS.
- A. Marquez, M. P. Serratosa and J. Merida, Pyranoanthocyanin Derived Pigments in Wine: Structure and Formation during Winemaking, J. Chem., 2013, 713028, DOI:10.1155/2013/713028..
- J. Oliveira, N. Mateus and V. de Freitas, Previous and recent advances in pyranoanthocyanins equilibria in aqueous solution, Dyes Pigm., 2014, 100, 190–200 CrossRef CAS.
- M. Figueiredo-Gonzalez, B. Cancho-Grande, J. Simal-Gandara, N. Teixeira, N. Mateus and V. De Freitas, The phenolic chemistry and spectrochemistry of red sweet wine-making and oak-aging, Food Chem., 2014, 152, 522–530 CrossRef CAS PubMed.
-
C. Quaglieri, G. Iachetti, M. Jourdes, P. Waffo-Teguo and P. L. Teissedre, Are pyranoanthocyanins involved in sensory effect in red wines?, Bio Web Conf (39th World Congress of Vine and Wine), 2016, vol. 7, DOI:10.1051/bioconf/20160702007.
- I. Garcia-Estevez, L. Cruz, J. Oliveira, N. Mateus, V. de Freitas and S. Soares, First evidences of interaction between pyranoanthocyanins and salivary proline-rich proteins, Food Chem., 2017, 228, 574–581 CrossRef CAS PubMed.
- J. Azevedo, J. Oliveira, L. Cruz, N. Teixeira, N. F. Bras, V. De Freitas and N. Mateus, Antioxidant Features of Red Wine Pyranoanthocyanins: Experimental and Theoretical Approaches, J. Agric. Food Chem., 2014, 62, 7002–7009 CrossRef CAS PubMed.
- E. Tomankova, J. Balik, I. Soural, P. Bednar and B. Papouskova, Colour and Antioxidant Properties of Malvidin-3-Glucoside and Vitisin A, Acta Aliment., 2016, 45, 85–92 CrossRef CAS.
- H. Oliveira, N. Wu, Q. Zhang, J. Y. Wang, J. Oliveira, V. de Freitas, N. Mateus, J. R. He and I. Fernandes, Bioavailability studies and anticancer properties of malvidin based anthocyanins, pyranoanthocyanins and non-oxonium derivatives, Food Funct., 2016, 7, 2462–2468 RSC.
- F. Pina, M. J. Melo, C. A. T. Laia, A. J. Parola and J. C. Lima, Chemistry and applications of flavylium compounds: a handful of colours, Chem. Soc. Rev., 2012, 41, 869–908 RSC.
- S. Chassaing, G. Isorez-Mahler, M. Kueny-Stotz and R. Brouillard, Aged red wine pigments as a source of inspiration for organic synthesis the cases of the color-stable pyranoflavylium and flavylium-(4 -> 8)-flavan chrornophores, Tetrahedron, 2015, 71, 3066–3078 CrossRef CAS.
- C. P. da Silva, R. M. Pioli, L. Liu, S. S. Zheng, M. J. Zhang, G. T. M. Silva, V. M. T. Carneiro and F. H. Quina, Improved Synthesis of Analogues of Red Wine Pyranoanthocyanin Pigments, ACS Omega, 2018, 3, 954–960 CrossRef.
- A. Sousa, L. Cabrita, P. Araujo, N. Mateus, F. Pina and V. de Freitas, Color stability and spectroscopic properties of deoxyvitisins in aqueous solution, New J. Chem., 2014, 38, 539–544 RSC.
- J. Oliveira, P. Araujo, A. Fernandes, N. Mateus and V. de Freitas, Synthesis and Structural Characterization of Amino-Based Pyranoanthocyanins with Extended Electronic Delocalization, Synlett, 2016, 2459–2462 CrossRef CAS.
- J. Oliveira, A. Fernandes and V. de Freitas, Synthesis and structural characterization by LC-MS and NMR of a new semi-natural blue amino-based pyranoanthocyanin compound, Tetrahedron Lett., 2016, 57, 1277–1281 CrossRef CAS.
- J. Oliveira, P. Araujo, A. Fernandes, N. F. Bras, N. Mateus, F. Pina and V. de Freitas, Influence of the structural features of amino-based pyranoanthocyanins on their acid-base equilibria in aqueous solutions, Dyes Pigm., 2017, 141, 479–486 CrossRef CAS.
- J. Oliveira, N. Mateus and V. de Freitas, Wine-Inspired Chemistry: Anthocyanin Transformations for a Portfolio of Natural Colors, Synlett, 2017, 28, 898–906 CrossRef CAS.
- A. A. Freitas, C. P. Silva, G. T. M. Silva, A. L. Macanita and F. H. Quina, From vine to wine: photophysics of a pyranoflavylium analog of red wine pyranoanthocyanins, Pure Appl. Chem., 2017, 89, 1761–1767 CAS.
- A. A. Freitas, C. P. Silva, G. T. M. Silva, A. L. Maçanita and F. H. Quina, Ground- and Excited-State Acidity of Analogs of Red Wine Pyranoanthocyanins, Photochem. Photobiol., 2018, 94, 1086–1091 CrossRef CAS PubMed.
- G. T. M. Silva, S. S. Thomas, C. P. Silva, J. C. Schlothauer, M. S. Baptista, A. A. Freitas, C. Bohne and F. H. Quina, Triplet Excited States and Singlet Oxygen Production by Analogs of Red Wine Pyranoanthocyanins, Photochem. Photobiol., 2018 DOI:10.1111/php.12973 . [Epub ahead of print].
- S. A. Mewes, F. Plasser, A. Krylov and A. Dreuw, Benchmarking Excited-State Calculations Using Exciton Properties, J. Chem. Theory Comput., 2018, 14, 710–725 CrossRef CAS PubMed.
- G. M. J. Barca, A. T. B. Gilbert and P. M. W. Gill, Simple Models for Difficult Electronic Excitations, J. Chem. Theory Comput., 2018, 14, 1501–1509 CrossRef CAS PubMed.
- C. A. Guido, B. Mennucci, G. Scalmani and D. Jacquemin, Excited State Dipole Moments in Solution: Comparison between State-Specific and Linear-Response TD-DFT Values, J. Chem. Theory Comput., 2018, 14, 1544–1553 CrossRef CAS PubMed.
- A. A. Freitas, K. Shimizu, L. G. Dias and F. H. Quina, A computational study of substituted flavylium salts and their quinonoidal conjugate-bases: S-0 -> S-1 electronic transition, absolute pK(a) and reduction potential calculations by DFT and semiempirical methods, J. Braz. Chem. Soc., 2007, 18, 1537–1546 CrossRef CAS.
- E. Bogdan, L. Rougier, L. Ducasse, B. Champagne and F. Castet, Nonlinear Optical Properties of Flavylium Salts: A Quantum Chemical Study, J. Phys. Chem. A, 2010, 114, 8474–8479 CrossRef CAS PubMed.
- A. R. F. Carvalho, J. Oliveira, V. de Freitas, N. Mateus and A. Melo, A theoretical interpretation of the color of two classes of pyranoanthocyanins, J. Mol. Struct.: THEOCHEM, 2010, 948, 61–64 CrossRef CAS.
- A. D. Quartarolo and N. Russo, A Computational Study (TDDFT and RICC2) of the Electronic Spectra of Pyranoanthocyanins in the Gas Phase and Solution, J. Chem. Theory Comput., 2011, 7, 1073–1081 CrossRef CAS PubMed.
- S. Alcaro, S. G. Chiodo, M. Leopoldini and F. Ortuso, Antioxidant Efficiency of Oxovitisin, a New Class of Red Wine
Pyranoanthocyanins, Revealed through Quantum Mechanical Investigations, J. Chem. Inf. Model., 2013, 53, 66–75 CrossRef CAS PubMed.
- O. Kurka, J. Roithova and P. Bednar, Examination of small molecule losses in 5-methylpyranopelargonidin MS/MS CID spectra by DFT calculations, J. Mass Spectrom., 2014, 49, 1314–1321 CrossRef CAS PubMed.
- Y. El Kouari, A. Migalska-Zalas, A. K. Arof and B. Sahraoui, Computations of absorption spectra and nonlinear optical properties of molecules based on anthocyanidin structure, Opt. Quantum Electron., 2015, 47, 1091–1099 CrossRef CAS.
- P. Trouillas, F. Di Meo, J. Gierschner, M. Linares, J. C. Sancho-Garcia and M. Otyepka, Optical properties of wine pigments: theoretical guidelines with new methodological perspectives, Tetrahedron, 2015, 71, 3079–3088 CrossRef CAS.
- X. C. Ge, I. Timrov, S. Binnie, A. Biancardi, A. Calzolari and S. Baroni, Accurate and Inexpensive Prediction of the Color Optical Properties of Anthocyanins in Solution, J. Phys. Chem. A, 2015, 119, 3816–3822 CrossRef CAS PubMed.
- I. Cacelli, A. Ferretti and G. Prampolini, Predicting light absorption properties of anthocyanidins in solution: a multi-level computational approach, Theor. Chem. Acc., 2016, 135, 156, DOI:10.1007/s00214-016-1911-z.
- P. Trouillas, J. C. Sancho-Garcia, V. De Freitas, J. Gierschner, M. Otyepka and O. Dangles, Stabilizing and Modulating Color by Copigmentation: Insights from Review Theory and Experiment, Chem. Rev., 2016, 116, 4937–4982 CrossRef CAS PubMed.
- A. Vallverdu-Queralt, M. Biler, E. Meudec, C. Le Guerneve, A. Vernhet, J. P. Mazauric, J. L. Legras, M. Loonis, P. Trouillas, V. Cheynier and O. Dangles, p-Hydroxyphenyl-pyranoanthocyanins: An Experimental and Theoretical Investigation of Their Acid-Base Properties and Molecular Interactions, Int. J. Mol. Sci., 2016, 17, 1842 CrossRef PubMed.
- M. Dekic, R. Kolasinac, N. Radulovic, B. Smit, D. Amic, K. Molcanov, D. Milenkovic and Z. Markovic, Synthesis and theoretical investigation of some new 4-substituted flavylium salts, Food Chem., 2017, 229, 688–694 CrossRef CAS PubMed.
- C. Hattig, Structure optimizations for excited states with correlated second-order methods: CC2 and ADC(2), Adv. Quantum Chem., 2005, 50, 37–60 CrossRef.
- A. Klamt and V. Jonas, Treatment of the outlying charge in continuum solvation models, J. Chem. Phys., 1996, 105, 9972–9981 CrossRef CAS.
- C. Møller and M. S. Plesset, Note on an approximation treatment for many-electron systems, Phys. Rev., 1934, 46, 0618–0622 CrossRef.
- C. Hattig, Geometry optimizations with the coupled-cluster model CC2 using the resolution-of-the-identity approximation, J. Chem. Phys., 2003, 118, 7751–7761 CrossRef CAS.
- A. D. Becke, Density-Functional Thermochemistry .3. The Role of Exact Exchange, J. Chem. Phys., 1993, 98, 5648–5652 CrossRef CAS.
- S. Grimme, J. Antony, S. Ehrlich and H. Krieg, A consistent and accurate ab initio parametrization of density functional dispersion correction (DFT-D) for the 94 elements H-Pu, J. Chem. Phys., 2010, 132, 154104 CrossRef PubMed.
- B. Lunkenheimer and A. Kohn, Solvent Effects on Electronically Excited States Using the Conductor-Like Screening Model and the Second-Order Correlated Method ADC(2), J. Chem. Theory Comput., 2013, 9, 977–994 CrossRef CAS PubMed.
- J. F. Cote, D. Brouillette, J. E. Desnoyers, J. F. Rouleau, J. M. StArnaud and G. Perron, Dielectric constants of acetonitrile, gamma-butyrolactone, propylene carbonate, and 1,2-dimethoxyethane as a function of pressure and temperature, J. Solution Chem., 1996, 25, 1163–1173 CrossRef CAS.
- K. Moutzouris, M. Papamichael, S. C. Betsis, I. Stavrakas, G. Hloupis and D. Triantis, Refractive, dispersive and thermo-optic properties of twelve organic solvents in the visible and near-infrared, Appl. Phys. B: Lasers Opt., 2014, 116, 617–622 CrossRef CAS.
- F. Weigend, M. Haser, H. Patzelt and R. Ahlrichs, RI-MP2: optimized auxiliary basis sets and demonstration of efficiency, Chem. Phys. Lett., 1998, 294, 143–152 CrossRef CAS.
- F. Weigend, F. Furche and R. Ahlrichs, Gaussian basis sets of quadruple zeta valence quality for atoms H-Kr, J. Chem. Phys., 2003, 119, 12753–12762 CrossRef CAS.
- R. Ahlrichs, M. Bar, M. Haser, H. Horn and C. Kolmel, Electronic-Structure Calculations on Workstation Computers - the Program System Turbomole, Chem. Phys. Lett., 1989, 162, 165–169 CrossRef CAS.
-
M. J. Frisch, G. W. Trucks, H. B. Schlegel, G. E. Scuseria, M. A. Robb, J. R. Cheeseman, G. Scalmani, V. Barone, B. Mennucci, G. A. Petersson, H. Nakatsuji, M. Caricato, X. Li, H. P. Hratchian, A. F. Izmaylov, J. Bloino, G. Zheng, J. L. Sonnenberg, M. Hada, M. Ehara, K. Toyota, R. Fukuda, J. Hasegawa, M. Ishida, T. Nakajima, Y. Honda, O. Kitao, H. Nakai, T. Vreven, J. J. A. Montgomery, J. E. Peralta, F. Ogliaro, M. Bearpark, J. J. Heyd, E. Brothers, K. N. Kudin, V. N. Staroverov, R. Kobayashi, J. Normand, K. Raghavachari, A. Rendell, J. C. Burant, S. S. Iyengar, J. Tomasi, M. Cossi, N. Rega, J. M. Millam, M. Klene, J. E. Knox, J. B. Cross, V. Bakken, C. Adamo, J. Jaramillo, R. Gomperts, R. E. Stratmann, O. Yazyev, A. J. Austin, R. Cammi, C. Pomelli, J. W. Ochterski, R. L. Martin, K. Morokuma, V. G. Zakrzewski, G. A. Voth, P. Salvador, J. J. Dannenberg, S. Dapprich, A. D. Daniels, Ö. Farkas, J. B. Foresman, J. V. Ortiz, J. Cioslowski and D. J. Fox, in Gaussian 09, Gaussian, Inc., Wallingford CT, 2009 Search PubMed.
- F. Plasser and H. Lischka, Analysis of Excitonic and Charge Transfer Interactions from Quantum Chemical Calculations, J. Chem. Theory Comput., 2012, 8, 2777–2789 CrossRef CAS PubMed.
- R. L. Martin, Natural transition orbitals, J. Chem. Phys., 2003, 118, 4775–4777 CrossRef CAS.
- F. Plasser, M. Wormit and A. Dreuw, New tools for the systematic analysis and visualization of electronic excitations. I. Formalism, J. Chem. Phys., 2014, 141, 024106 CrossRef PubMed.
- F. Plasser, S. A. Bappler, M. Wormit and A. Dreuw, New tools for the systematic analysis and visualization of electronic excitations. II. Applications, J. Chem. Phys., 2014, 141, 024107 CrossRef PubMed.
- S. I. Gorelsky and A. B. P. Lever, Electronic structure and spectral, of ruthenium diimine complexes by density functional theory and INDO/S. Comparison of the two methods, J. Organomet. Chem., 2001, 635, 187–196 CrossRef CAS.
-
B. H. Bransden and C. J. Joachain, Physics of Atoms and Molecules, Longman Group Limited, New York, 1983 Search PubMed.
Footnote |
| † Electronic supplementary information (ESI) available. See DOI: 10.1039/c8pp00391b |
|
| This journal is © The Royal Society of Chemistry and Owner Societies 2019 |
Click here to see how this site uses Cookies. View our privacy policy here. 
 a,
Cassio P.
Silva
b,
Gustavo T.
Medeiros Silva
a,
Cassio P.
Silva
b,
Gustavo T.
Medeiros Silva