
 Open Access Article
 This Open Access Article is licensed under a Creative Commons Attribution-Non Commercial 3.0 Unported Licence
Visible-light activation of TiO2 by dye-sensitization for degradation of pharmaceutical compounds†
Jennyfer
Diaz-Angulo
 a,
Islen
Gomez-Bonilla
a,
Christian
Jimenez-Tohapanta
a,
Miguel
Mueses
b,
Maria
Pinzon
a and
Fiderman
Machuca-Martinez
*a
a,
Islen
Gomez-Bonilla
a,
Christian
Jimenez-Tohapanta
a,
Miguel
Mueses
b,
Maria
Pinzon
a and
Fiderman
Machuca-Martinez
*a
aEscuela de Ingeniería Química, Universidad del Valle, Cali, Colombia. E-mail: fiderman.machuca@correounivalle.edu.co; jennyfer.diaz@correounivalle.edu.co; Tel: +57 3164487088
bPhotocatalysis and Solar Photoreactors Engineering, Modeling & Application of AOTs, Department of Chemical Engineering, Universidad de Cartagena, Cartagena, Colombia
First published on 20th November 2018
Abstract
This work reports the improvement in the photon absorption and degradation of acetaminophen (ACF) and diclofenac (DFC) by photosensitizing TiO2 with two types of dyes Eosin Y (Ey) and Rhodamine B (RhB). Experimental tests were carried out in a solar simulator for three hours for different systems and both pollutants. The influences of the TiO2 concentration (100, 200 and 800 mg L−1) and the catalyst–dye ratio (2%, 5% and 10%) were investigated. The degradation of the compounds was higher in the presence of TiO2-Ey compared to the TiO2-RhB and TiO2 for both pharmaceutical compounds, which was attributed to the anionic nature of Ey. DFC total degradation was achieved using 100 mg L−1 of catalyst loading and 10% of catalyst–dye ratio and the highest ACF degradation (71%) was obtained at 800 mg L−1 of catalyst loading and 5% of catalyst–dye ratio. The photon absorption was studied for both dyes using the six-flux absorption scattering model (SFM) for estimating the LVRPA (local volumetric rate of photon absorption). This was done by modifying the apparent optical thickness equation. It was found that the presence of dye in the photocatalytic systems considerably increases the LVRPA. The rate coefficients for the degradation of pharmaceutical compounds in the presence of the organic dyes were also obtained.
1. Introduction
Water is fundamental for all forms of life, making it one of the essential resources of nature. About 5 million people die each year by drinking contaminated water, and approximately 2 billion people on the planet lacks access to safe drinking water, because of the increasing contamination of it, even in developed countries.1,2Annual global consumption of pharmaceutical compounds is estimated to be 100![[thin space (1/6-em)]](https://www.rsc.org/images/entities/char_2009.gif) 000 tons and for analgesics like diclofenac (DFC) and acetaminophen (ACF) their consumption is estimated at 940 tons per year in the form of capsules, suppositories, tablets, intravenous solution and ointments.3 Pharmaceuticals for human or animal use usually have a low absorption in the human body; for example the body only absorbs around 5–15% of ACF and the remaining percentage is usually excreted through urine and stool without alterations or as intermediate compounds,4 also DFC is excreted about 15% unchanged.5 Pharmaceutical compound discharge to date has been strongly linked to the mutation of some fish in the United States,6 and to the death of 97% of one type of vulture in India.7 Besides, there are few decrees or legislation that control the level of medicine dumping into rivers.
000 tons and for analgesics like diclofenac (DFC) and acetaminophen (ACF) their consumption is estimated at 940 tons per year in the form of capsules, suppositories, tablets, intravenous solution and ointments.3 Pharmaceuticals for human or animal use usually have a low absorption in the human body; for example the body only absorbs around 5–15% of ACF and the remaining percentage is usually excreted through urine and stool without alterations or as intermediate compounds,4 also DFC is excreted about 15% unchanged.5 Pharmaceutical compound discharge to date has been strongly linked to the mutation of some fish in the United States,6 and to the death of 97% of one type of vulture in India.7 Besides, there are few decrees or legislation that control the level of medicine dumping into rivers.
Many efforts have been made over the last few decades to improve methods for pollutant removal by developing suitable and sustainable treatments. Some technical methods applied to the decontamination of wastewater are advanced oxidation processes (AOPs), which consist of producing oxidizing species for the degradation of recalcitrant pollutants.6,8,9 Among these, most outstanding processes are photocatalysis, ozonation, electrooxidation, sonolysis and photolysis.6,10
Solar heterogeneous photocatalysis is an alternative compared to other forms of wastewater treatment for emerging pollutants because the sun provides the main source of energy. The most common catalyst used in heterogeneous photocatalysis is titanium dioxide (TiO2), since it is non-toxic, can be found in abundance, which makes it very economical and is stable to photochemical and chemical corrosion. This catalyst has a band gap of 3.2 eV, i.e. it can only be excited with UV light of λ < 387 nm provided by sunlight.11,12
Usually TiO2 is doped with N, Fe, S and oxides in order to improve its photocatalytic activity under visible radiation; another technique implemented is the sensitization with dyes which has been widely used in the field of solar cells and the production of hydrogen.13–17
The dye-sensitization process is a technique used to expand the active spectral range of photocatalysts; it has been applied for degradation of chlorophenol, hydrazine, pesticides, phenol and benzyl alcohol. Transition metal based dyes are the best compounds to achieve good electron transfer to the semiconductor, but are expensive and not environment friendly, hence in the sensitization process organic dyes can be used.18–21
Fig. 1 shows the dye sensitization mechanism. A dye adsorbed onto the catalyst surface is excited with visible radiation, then an electron passes from its HOMO (highest occupied molecular orbital) to its LUMO (lowest unoccupied molecular orbital), and subsequently to the conduction band of TiO2.
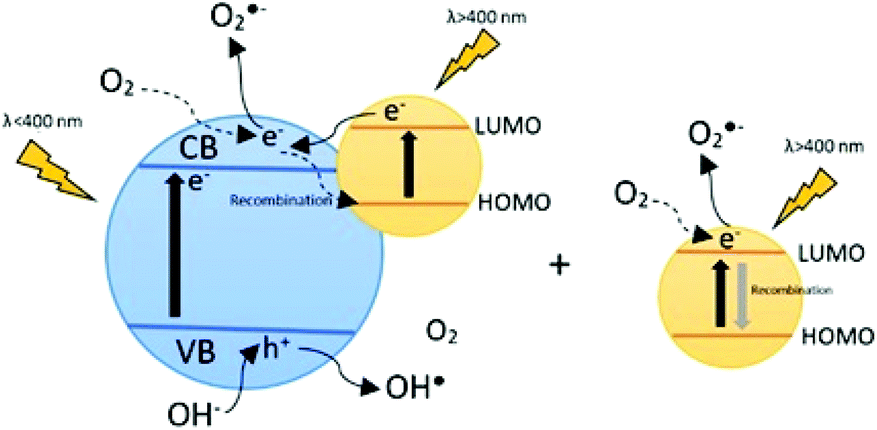 | ||
| Fig. 1 Mechanism of the dye sensitization process with the dye adsorbed onto the catalyst surface and dye in the bulk. | ||
On the other hand, the dye in solution can also absorb light and the electron in the LUMO reacts with dissolved oxygen in order to produce the superoxide anion radical.
Dyes must meet certain essential characteristics for them to be considered photosensitizers. Some of these are: strong absorption of visible light even the part of the near infrared (NIR) region, to be photostable (unless the self-sensitized degradation is required), to have some anchoring groups (SO3H, –COOH, –H2PO3, etc.) to facilitate the strong binding of dye molecules onto the TiO2 surface and the excited state of the photosensitizer should be higher in energy than the conduction band (CB) edge of TiO2. As a result, efficient electron transfer between the excited dye and TiO2 CB will be thermodynamically favorable.18,22,23 Eosin y (Ey) and Rhodamine B (RhB) meet the requirements to be good sensitizers, that is they have the same anchoring group (–COOH), they have low cost and toxicity, their nature is organic, and they can be acquired easily; for these reasons they were chosen as sensitizers.
Therefore, the objective of this study was to investigate the promoting effect of a cationic dye (RhB) and an anionic dye (Ey) on the photon absorption of TiO2 under solar simulated radiation and to evaluate the degradation of DFC and ACF for sensitized and non-sensitized systems including the effect of homogeneous (dye/contaminant) systems.
2. Materials and methods
2.1. Materials
Diclofenac sodium salt (Sigma Aldrich, United States 99.5% w/w purity), acetaminophen (Tecnoquimicas MK, Colombia 88% w/w purity), the catalyst titanium dioxide (Aeroxide TiO2 P25; Evonik. No. CAS 13463-67-7; Essen, Germany with ≥99.5% (w/w) purity) and the dyes, viz. Eosin y (Color index (C.I.) No. 45380; Fisher Chemical – ChemAlert 99% w/w purity) and Rhodamine B (RhB, C.I. 45170; United States 99% w/w purity) were used as received. Additionally, acetonitrile and formic acid HPLC analytical grade with 99.99% V/V purity from Sigma Aldrich were used for preparing the mobile phase.2.2. Reactive system
Polychromatic irradiation (UVB, UVA and visible) was conducted in a device equipped with six fluorescent tubes Repti Glo 5.0 (20 W), emitting wavelengths between 290 and 690 nm with two maxima at 385 and 540 nm (the spectrum can be seen in the ESI†). Photocatalytic reactions were carried out in a batch reactor (Pyrex glass bottle) illuminated from the top as is shown in Fig. S.2.† The device was equipped with two fans, which maintained the solution at 27 ± 1 °C. The reaction mixture was stirred using a magnetic stirrer.2.3. Experimental degradation
Diclofenac and acetaminophen were prepared for the experiments at a concentration of 30 mg L−1. Then catalyst (100, 200 and 800 mg L−1) and dye (2%, 5% and 10% of the catalyst concentration (%w/w)) were added simultaneously to the system according to each case. Later the solution was stirred for 20 minutes in total darkness and subsequently irradiated into a system for 3 hours. All the reactions were carried out at the natural pH (5.8 ± 0.3) of the reaction mixture, for avoiding the interfering effect of other cationic or anionic species. Non-sensitized tests (without the dye) were performed under the same conditions in order to compare the photocatalytic degradation. Aliquots of 7 mL were taken each 0.5 h.2.4. Experimental control
Photolysis and adsorption tests were carried out for each of the organic compounds (Rhodamine B, Eosin Y, diclofenac and acetaminophen) using the same experimental setup. The total accumulative radiation for 3 hours for a photolysis test was of 230 kJ m−2, while adsorption tests were performed for 30 minutes in complete darkness. The concentration and mineralization of the dyes were measured by UV-Vis spectrophotometry and total organic carbon analysis, respectively. The percentage of dye and contaminant adsorbed on the catalyst surface was calculated by the difference between the initial and final concentrations of the solutions i.e., before adding the catalyst and after recovering it by filtration.2.5. Analytical measurement
Concentrations of DFC and ACF were determined by HPLC using a Thermo scientific ultimate 3000 with a diode array detector (DAD) at a wavelength of 276 and 254 nm respectively. The column used was a LiChrospher® 100 RP-18 reversed-phase with a particle size of 5 μm. A mixture of acetonitrile and formic acid (10 mM) operated in isocratic mode was used as the mobile phase for detection of both species in a ratio of (65/35) for DFC and (20/80) for ACF. Diclofenac quantification was carried out with a flow rate of 0.85 ml min−1 and the retention time was 5.1 min, while ACF quantification was performed with a flow rate of 1 ml min−1 and the retention time was 6 min. The injection volume was 25 μL for all samples.Solutions of Ey and RhB were prepared, and then the TiO2 catalyst was added, after 10 minutes the catalyst was recovered by filtration and drying at room temperature. The resulting powder was analyzed by Raman spectroscopy analysis, which was performed on a thermo-scientific DRX SmartRaman spectrometer with a 532 nm laser (see the ESI†).
2.6. Photon absorption estimation
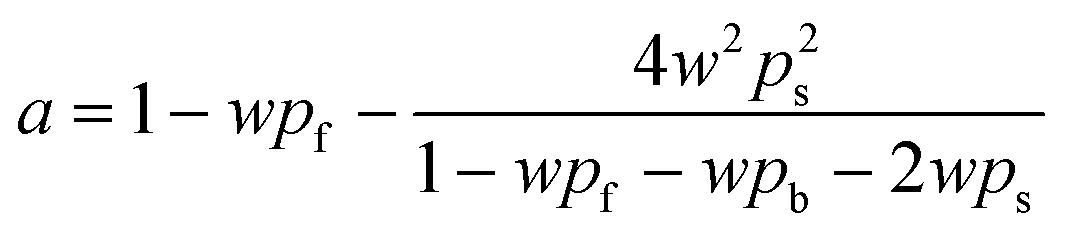
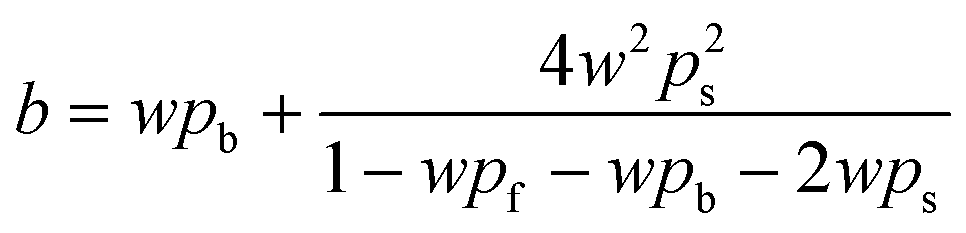
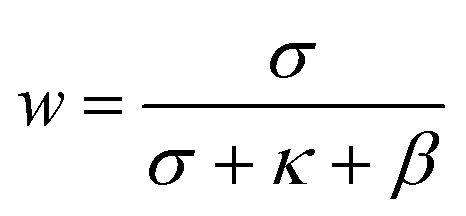
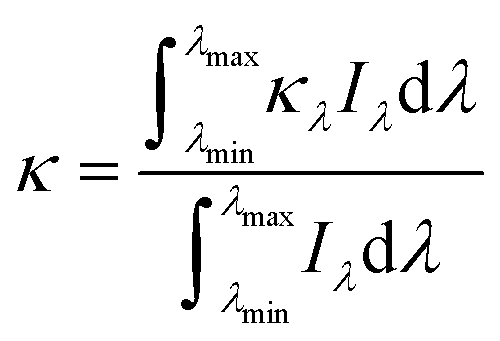
SFM was used for estimating the LVRPA of the systems sensitized and non-sensitized, this model is an approximate solution to the radiative transfer equation (RTE) and it allows us to estimate the photon absorption of the catalyst and dye in suspension using eqn (1).24,25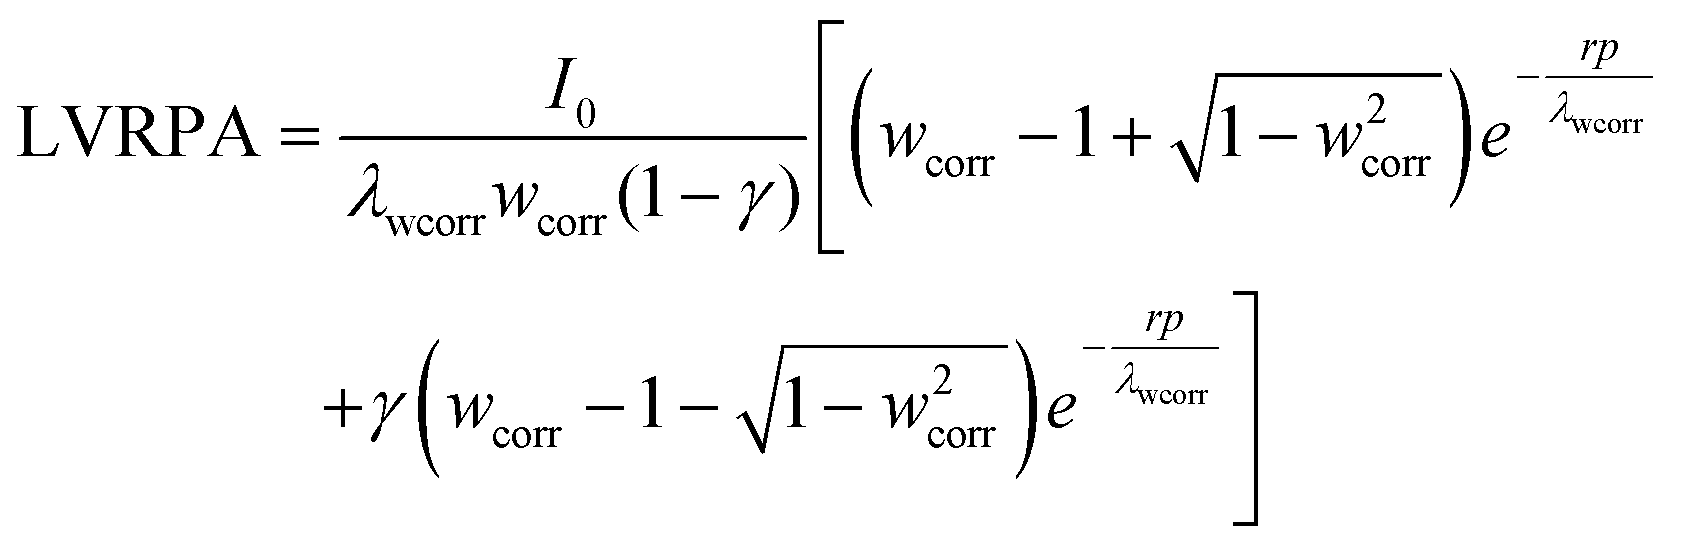 | (1) |
 | (2) |
 | (3) |
 | (4) |
 | (5) |
 | (6) |
 | (7) |
 | (8) |
 | (9) |
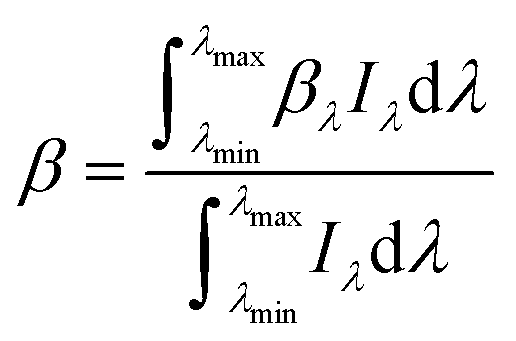
For the sensitized systems the dye also absorb energy, hence it is necessary to introduce the absorption coefficients of the dyes (eqn (10)), which were calculated in this work and they can be seen in Table 1. Dye solutions at different concentrations were prepared using ultrapure water and their absorbance at the maximum wavelength was measured on a Shimadzu (UV-1800) spectrophotometer using a quartz cell of length 1 cm; after obtaining the experimental values, a linear regression was made to the data to find the intercept.33
 | (10) |
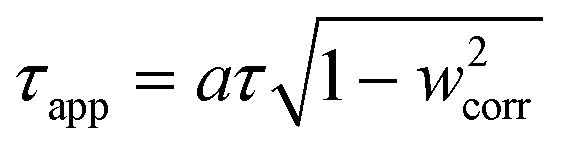
Optical thickness (τ) and apparent optical thickness (τapp) were estimated as:
| τ = [(σ + κ)Ccat + βCdye]δ | (11) |
 | (12) |
In the optical thickness eqn (11) was added the absorption coefficient of the dye because in the system both the catalyst and dye absorb light. The VRPA is the volumetric average of the LVRPA and it can be calculated using the eqn (13).
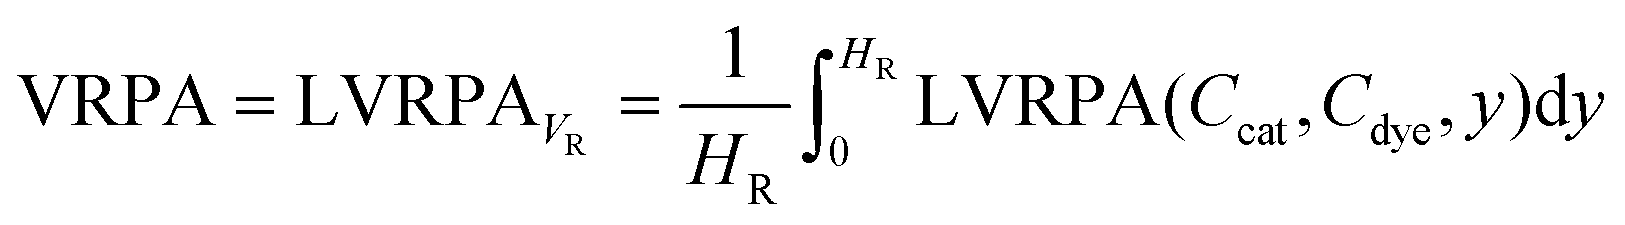 | (13) |
3. Results and discussion
3.1. Photon absorption of the dyes + catalyst
Table 1 shows the LVRPA for sensitized and non-sensitized systems. Both dyes have a similar maximum wavelength of absorption. However, RhB has a higher extinction coefficient and therefore a higher photon absorption.26The maximum photon absorption of each system (TiO2, TiO2-Ey and TiO2-RhB) for the first surface layer exposed to lamps was calculated using the six-flux model (SFM). This mathematical method has been widely used to calculate the LVRPA in heterogeneous photocatalysis,25,27,28 however it has not been used for other types of systems doped or sensitized because the optical properties of the new materials are not available or in the sensitized case, the model does not regard the absorption of the medium. For these reasons the term corresponding to the optical thickness was modified (eqn (11)), including the absorption coefficients of the dyes according to each case in order to consider the photon absorption of the medium.
In Table 1 the LVRPA for 200 mg L−1 of catalyst and 5% of catalyst/dye is shown. The difference between the non-sensitized and sensitized system is remarkable because in sensitized system both catalyst and dye absorb energy, so it is possible taken advantage of visible and ultraviolet energy.
A cross section of the system was made, and then the LVRPA was calculated longitudinally to investigate the extinction of photons for each system. In Fig. 2 the LVRPA profiles are shown.
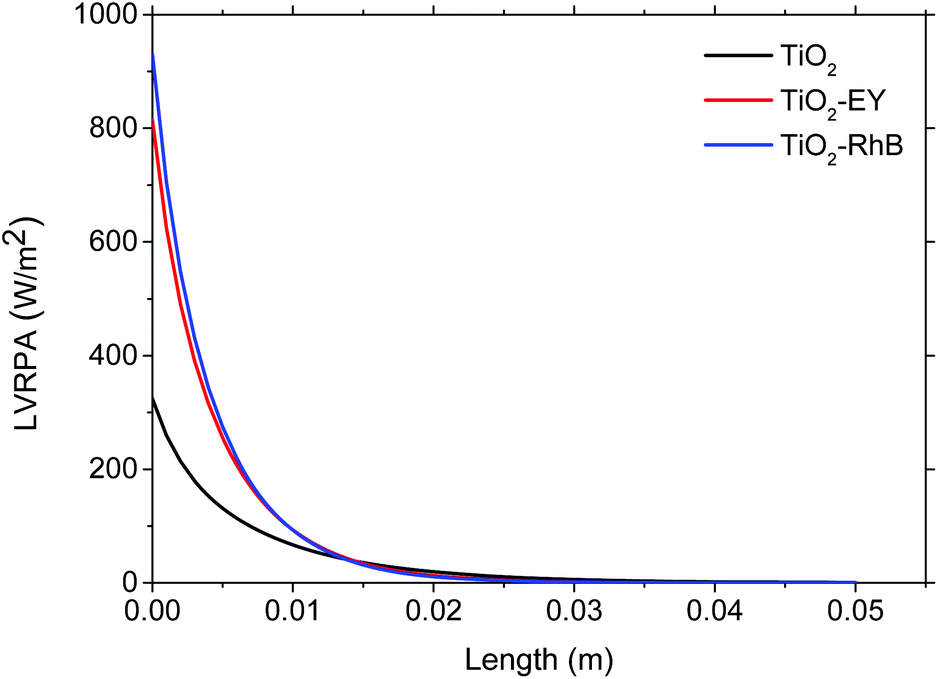 | ||
| Fig. 2 Profile of energy absorption through the fluid for sensitized and non-sensitized systems. | ||
Photons are extinguished about two centimeters deep of the flask. This means that only around 13% of the total volume of the system is used in the catalyst activation for the photocatalytic system and for activating the catalyst and dye in the sensitized systems. However, in the sensitized systems, the LVRPA is much higher.
Regardless of the dye used, the photon absorption improves considerably with respect to the photocatalytic system with only TiO2. This behavior is more evident using RhB as sensitizer because the LVRPAmax increase a 12.45% compared to Ey and a 65.16% compared with a non-sensitized test (see Table 1 and Fig. 2).
3.2. Result of the experimental control
Mineralization of DFC, ACF, Ey and RhB was 4.08%, 9.66%, 6.44% and 9.98% by tests of photolysis. Dye degradation was 21% and 32% for Ey and RhB respectively under visible light and under UV-Vis light the degradation percentages were 35% and 41.5%. These tests were carried out using a load of 800 mg L−1 of TiO2, and 16 mg L−1, which correspond to a catalyst/dye ratio of 2%. This indicates that under visible light dyes present self-sensitization and under UV-Vis light the degradation of the dyes is greater because there is a greater formation of oxidizing species, which is due to the activation of both dye and catalyst.3.3. Effect of the dye sensitization
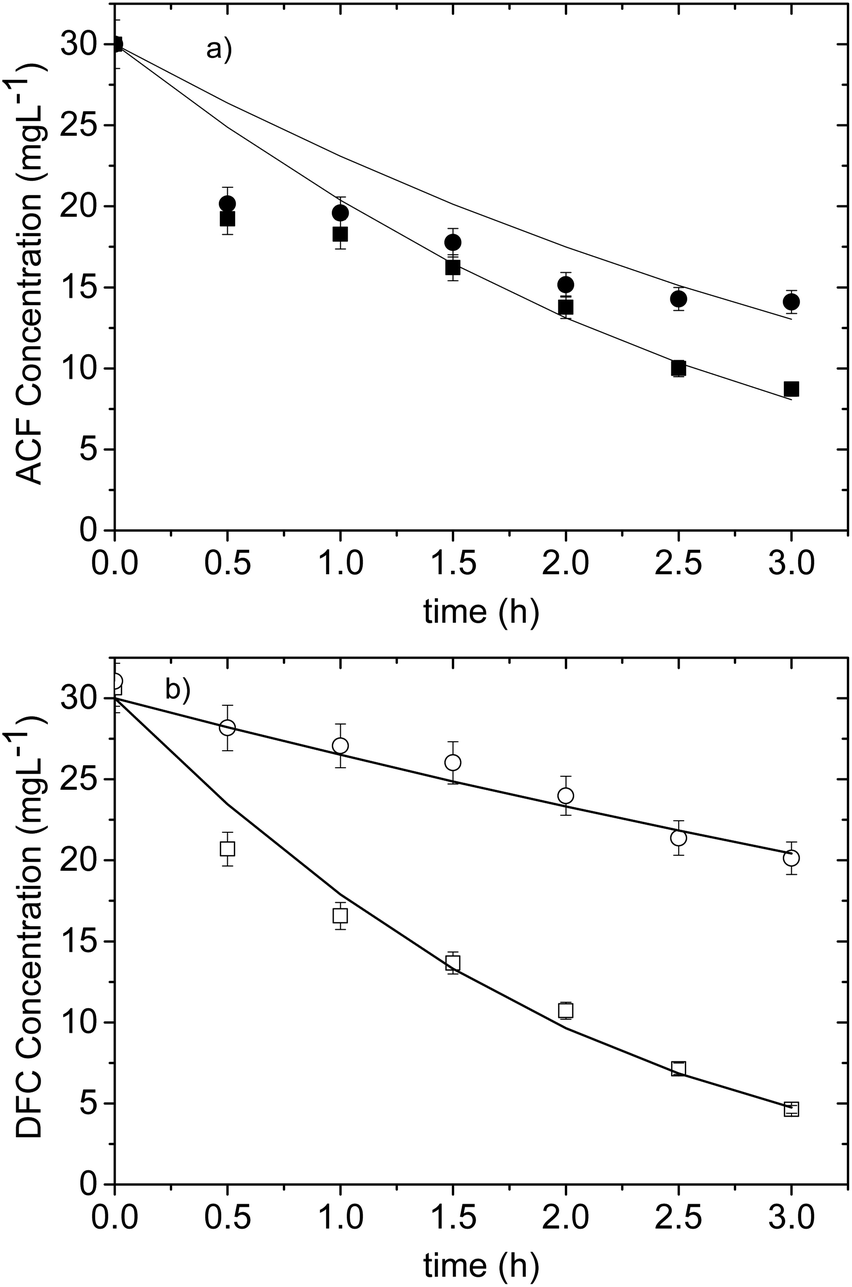
In order to investigate the effect of the sensitization process with dyes, tests for the degradation of ACF and DFC were carried out for the sensitized and non-sensitized systems; besides, the effect of the dyes on the pollutant degradation was determined by performing tests without TiO2.In Fig. 3a, it can be seen that the use of dyes even in the absence of the catalyst has a sensitizing effect that allows the degradation of DFC (20% for RhB and 66% for Ey). This was due to the oxidant species generation caused by reactions between the oxygen dissolved and the electron transferred from the HOMO to the LUMO of the dye.29–31
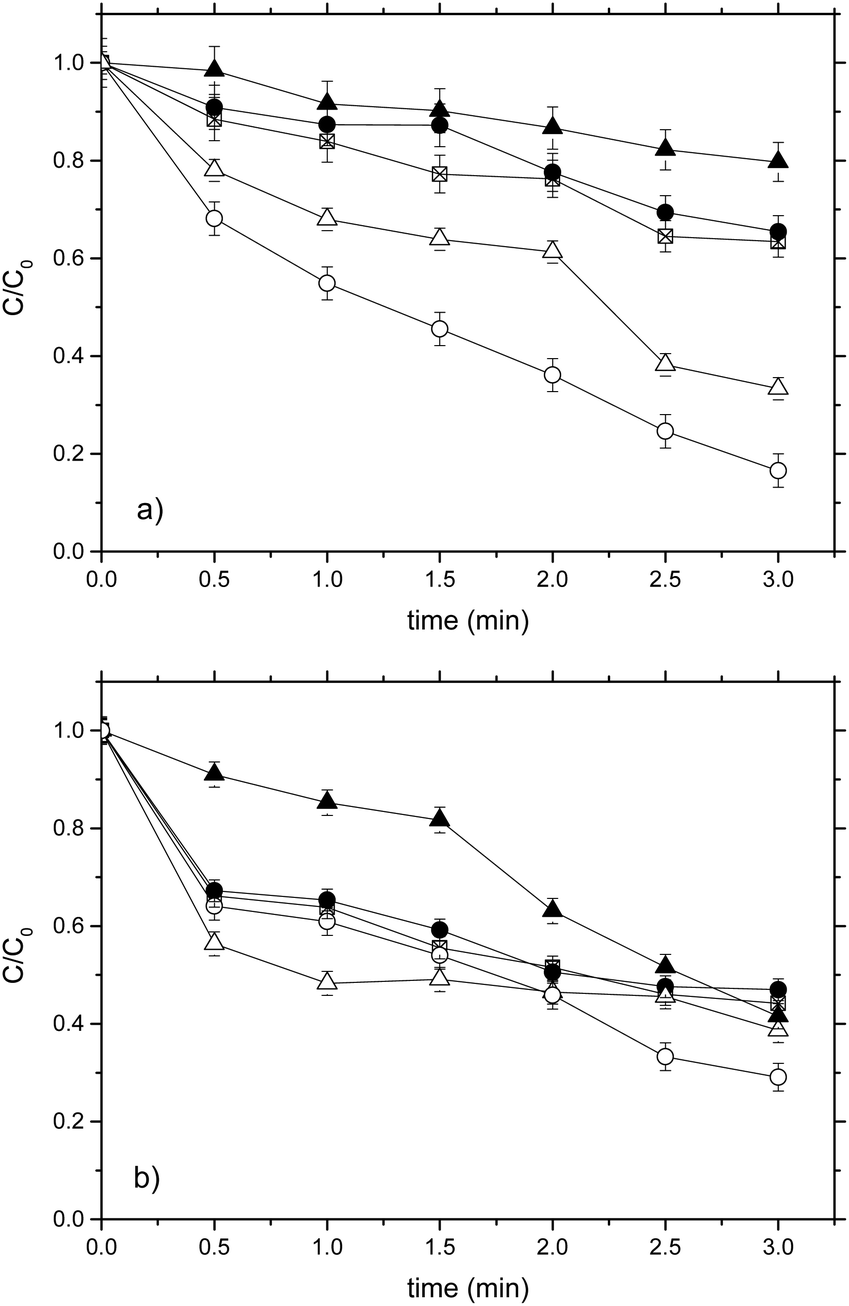 | ||
| Fig. 3 Degradation of pharmaceutical compounds with TiO2, RhB, Ey, TiO2-RhB and TiO2-Ey systems; (a) DCF [Legend: (Δ) 2% RhB without catalyst, (●) 100 mg TiO2 + 2% RhB, (□) 200 mg TiO2 without any dye, (▲) 2% Ey without catalyst, (○) 100 mg TiO2 + 2% Ey] and (b) ACF [Legend: (Δ) 5% RhB without catalyst, (●) 800 mg TiO2 + 5% RhB, (□) 800 mg TiO2 without any dye, (▲) 2% Ey without catalyst, (○) 800 mg TiO2 + 2% Ey]. | ||
In the case of the sensitization of TiO2 with RhB, result more effcient to work without the sensitizer since the degradation percentages were 34.6% and 36.6% for TiO2-RhB and TiO2 respectively. This indicates that RhB did not behave like a good sensitizer for TiO2, because there was no synergistic effect between the catalyst and the dye. Possibly, the oxidizing species generated not only contributed to the degradation of the pollutant but also to the degradation of the dye.32
In contrast, DFC degradation was much higher when Ey was used as a sensitizer (83.4%) in comparison with a non-sensitized test. This indicates that there was an additive effect between sensitization and photocatalysis, so Ey showed a good sensitizing effect on TiO2. A similar case was obtained in ref. 31 where Ey proved to be the best sensitizer to degrade phenolic compounds.
Fig. 3b shows that again both dyes without the catalyst present a significant sensitizing effect in ACF degradation, in this case it was 58.4 and 61.8% for RhB and Ey respectively. This confirms that using dyes even in the absence of catalyst allows the degradation of pharmaceutical compounds. This behavior is more evident for Ey.
However, for the RhB-ACF (absence of catalyst), TiO2-ACF (absence of dye) and TiO2-RhB-ACF systems approximately the same result of degradation is obtained 58.4%, 55.8% and 53% respectively, which indicate that again there was no synergy between the RhB and TiO2 and adding RhB to the photocatalytic system does not improve the degradation of ACF. On the other hand, using EY as a sensitizer the highest ACF degradation (70.9%) was obtained.
3.4. Effect of the adsorption and dye type
The effect of the dye adsorption on the TiO2 surface is of vital importance in the electron transfer from the LUMO of the dye to the conduction band of the catalyst.14,33The adsorption of the dyes onto the catalyst surface depends on the surface charge of TiO2, molecule charges of the dyes and of an anchor group. Ey and RhB have the same anchor group (–COOH), but these dyes present different ionic charges as Ey is anionic in nature and RhB is cationic in nature.
Contaminants are also adsorbed on the catalyst surface, facilitating the attack of the oxidizing species for their degradation, hence an analysis of the species adsorbed on the catalyst can be seen in Fig. 4.
 | ||
| Fig. 4 Organic species adsorption on the catalyst surface. | ||
The sensitizer and contaminants are adsorbed on the catalyst surface to improve the electron transfer and the degradation of the pollutant simultaneously. Ionic charges of each substance in the mixture are different: the catalyst presents positive and neutral charge because the water pH (5.8 ± 0.3) is close to its isoelectric point (pHpzc = 6.25) that is, pH < pzc: Ti − OH + H+ ↔ TiOH2+ and pH > pzc: Ti − OH + OH− ↔ TiO2.34 DFC presents predominantly a negative charge due to its pKa which is 4.1 and ACF has predominantly a neutral charge due to its pKa which is 9.3.35–37
Ey presents a higher adsorption on the catalyst surface after 30 minutes (>30%), and this is attributed to the electrostatic interaction due to the anionic nature of the dye, the positive charge of the catalyst and the anchor group. While RhB was not adsorbed by electrostatic interaction because its global charge is neutral since it has a positive charge due to its cationic nature, and it has a negative charge due to the deprotonation of its OH group at the pH of the solution. For this reason its adsorption was predominantly by its anchor group which was <14%.38
ACF has neutral charge, and this explains its low adsorption on titanium dioxide (<6.8%), and DFC has a negative charge whereby it was adsorbed on TiO2 through the electrostatic interactions (<15%). According to the above, it is possible that the sensitization with Ey for DCF degradation shows a good result since both substances compete for the active sites, favoring the sensitization and DFC degradation simultaneously. However, in the case of ACF, this was not absorbed onto the catalyst surface whereby oxidant species must migrate until the bulk for degrading it.
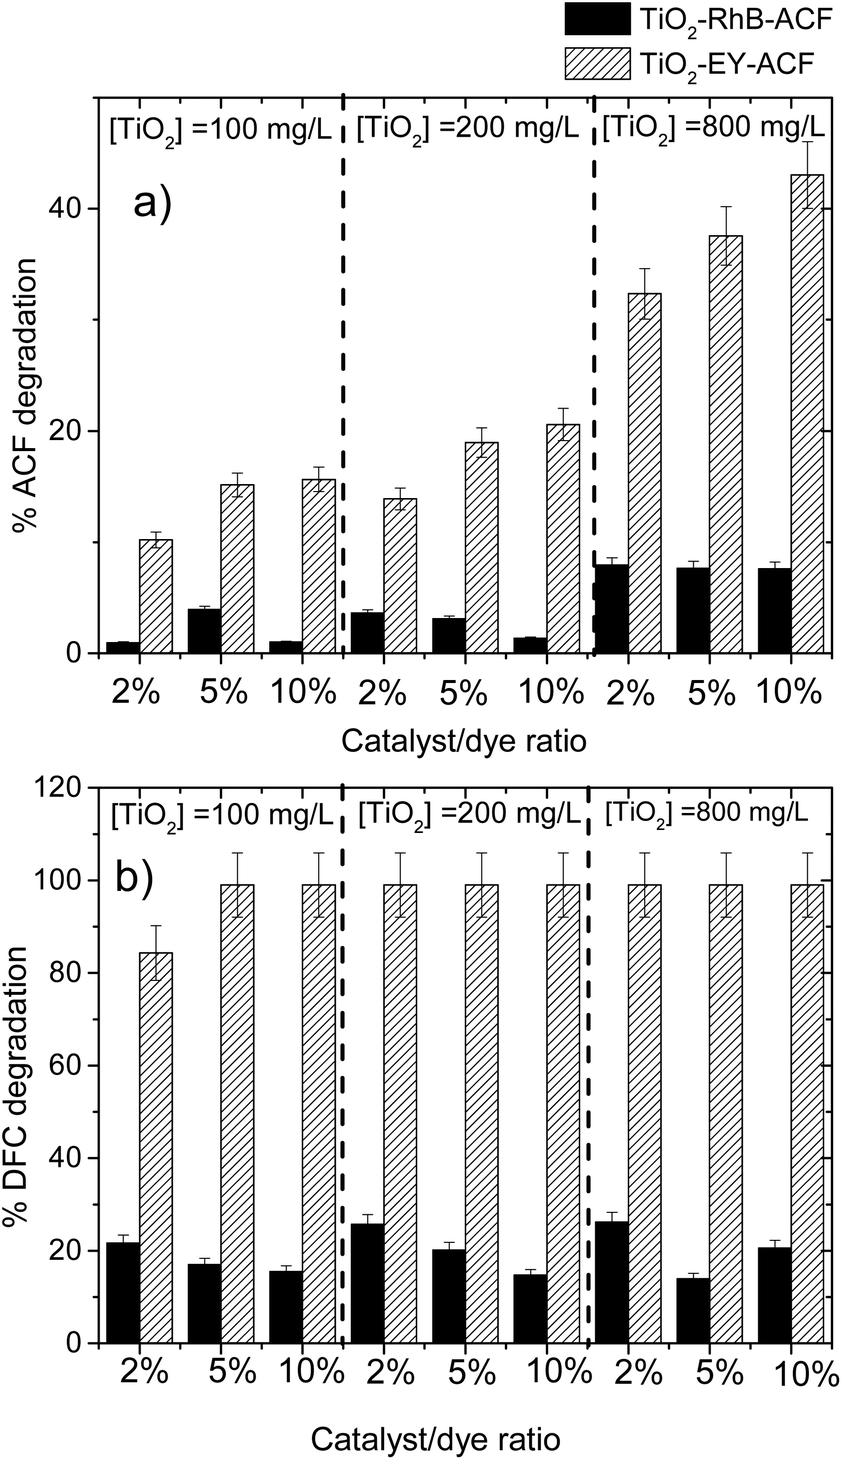
3.5. Effect of the catalyst/dye ratio
The catalyst/dye ratio had a directly proportional impact on the pollutant degradation for both sensitizers, in the case of Ey the best degradation was achieved at a high catalyst/dye ratio, while when we used RhB the best degradation percentage was achieved at a low dye–catalyst ratio for different catalyst loadings.In Fig. 5a the ACF degradation at different catalyst loadings and dye–catalyst ratios for each dye used is shown. It is possible to identify that Ey presents a better sensitizer effect than RhB under all operating conditions. In general terms, the degradation of the pollutant with RhB showed no pattern in the degradation process and the highest result obtained with this dye was 7.9%.
 | ||
| Fig. 5 Degradation of pharmaceutical compounds at different catalyst loadings and catalyst/dye ratios; (a) ACF and (b) DFC. | ||
Fig. 5b shows that total DFC degradation was achieved for almost all systems sensitized with Ey. It can be seen that total DFC degradation was achieved using a 5% catalyst/dye ratio, so increasing the catalyst load or the catalyst/dye ratio does not significantly enhance the DFC degradation; this behavior was also reported in ref. 31.
However, for RhB it is observed that, for each catalyst loading, increase the catalyst/dye ratio do not improve the DFC degradation. This behavior can be explained since in dye sensitized process both RhB and DFC compete for degradation, so to higher RhB concentration the oxidant species preferred attack to dye.
3.6. Effect of catalyst loading
Fig. 6 shows the results of the degradation of ACF and DCF, which were consistent with what would be expected according to the literature31,39,40i.e., at high catalyst concentrations the degradation was enhanced. By increasing the concentration of the catalyst, the contact area also increases; therefore, there is a greater capacity for the photon absorption, which explains that at higher concentrations of TiO2, the degradation of the pollutant will be improved.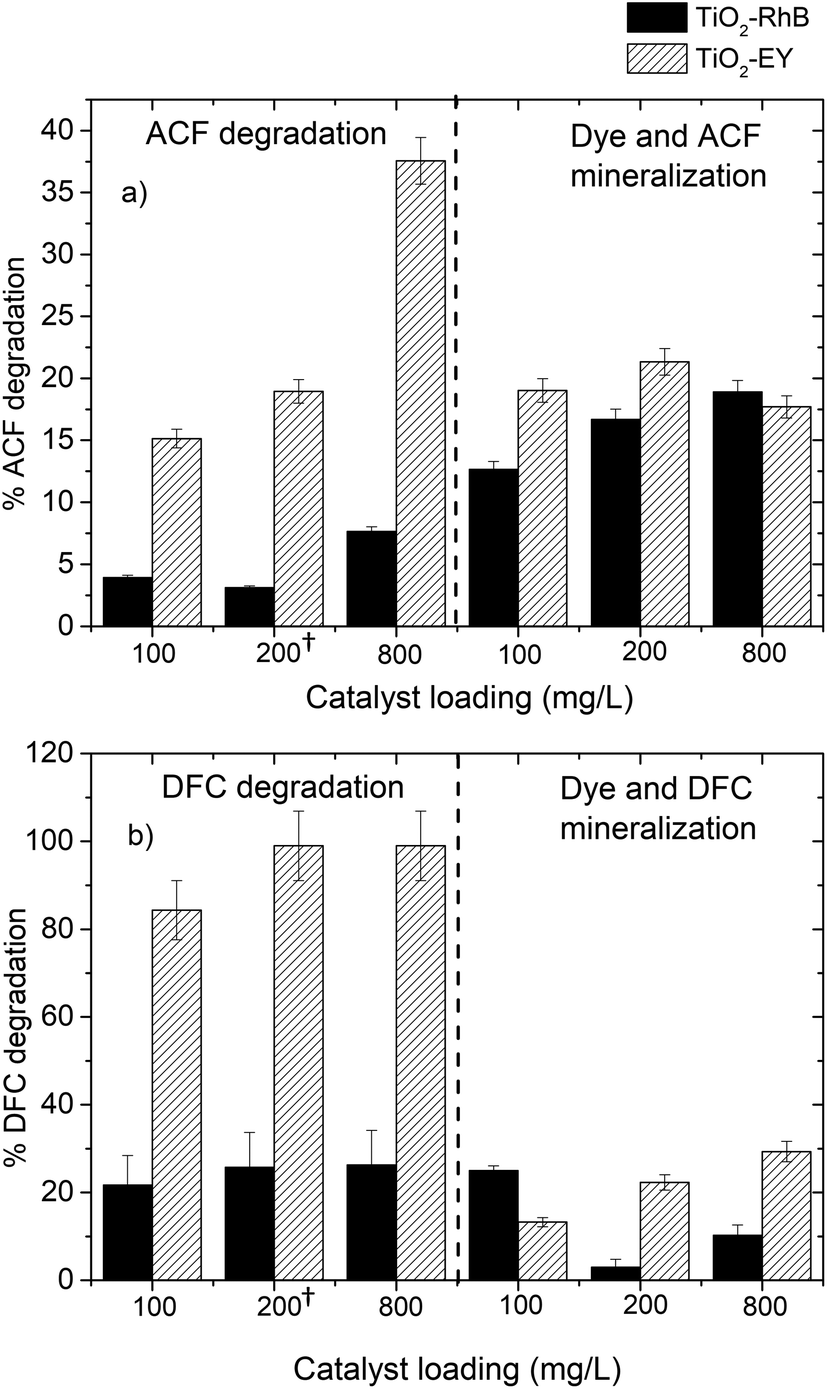 | ||
| Fig. 6 Comparison of the degradation and mineralization (total mineralization refers to dye + contaminant); (a) ACF and (b) DFC. †Data at 2% of catalyst/dye ratio for each dye and pollutants are repeated to do a better comparison of the conditions. | ||
The highest mineralization percentage was achieved by using Ey as a sensitizer and 800 mg L−1 of catalyst. Using RhB as a sensitizer, mineralization percentages obtained are higher than the degradation percentages of ACF, which confirms that the oxidant species generated react with the dye to degrade and mineralize it.
As can be seen in Fig. 6, total degradation of DFC was achieved at a catalyst concentration of 200 mg L−1 using Ey as a sensitizer. Whereas using RhB as a sensitizer total DFC degradation was not achieve even using the highest catalyst concentration. Because the sensitization with RhB was not good.
3.7. Kinetic analysis
In order to evaluate the kinetics degradation of emerging pollutants, multiple experiments of the degradation of DFC and ACF with Ey and RhB dyes as sensitizers and TiO2 as the catalyst were conducted. The data obtained for the degradation of DFC and ACF were fitted to the Langmuir–Hinshelwood type reaction obtained by Vinu, Polisetti, and Madras 2010 for the dye sensitized process, but in this work the effect of photon absorption was added. Variables such as contaminant concentration (Ri), dye concentration (Dye), catalyst concentration and VRPA (volumetric rate photon absorption) were considered. In Table 2 parameter values are given.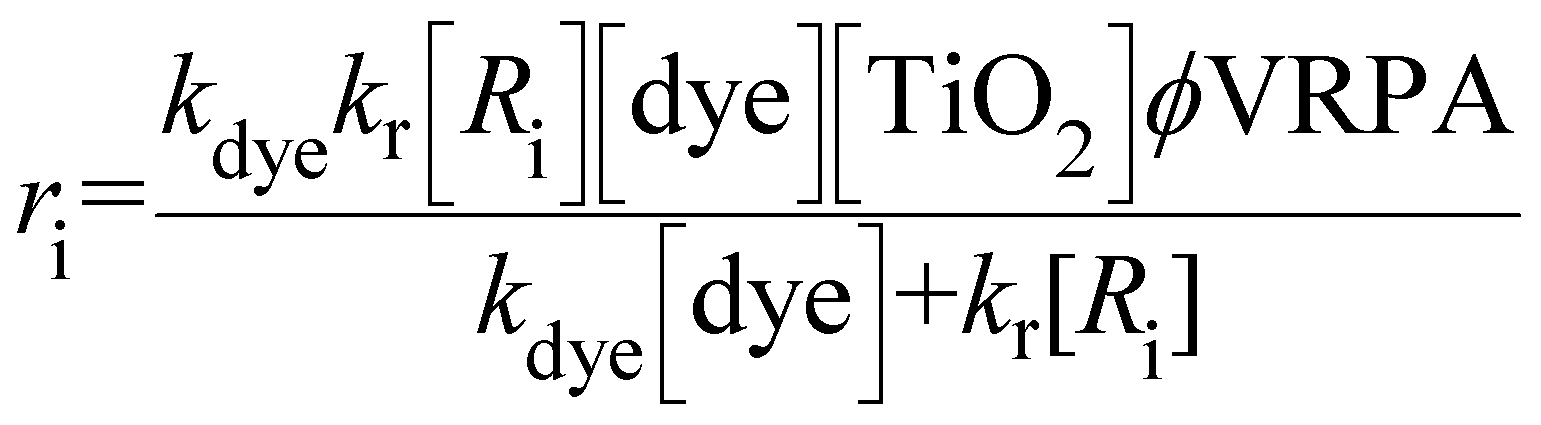 | (14) |
| ACF | DFC | |||
|---|---|---|---|---|
| (L g−1 min−1) | EY | RhB | EY | RhB |
| k dye | 1.093 | 0.9933 | 1.2767 | 0.4267 |
| k r | 0.383 | 0.2005 | 0.5333 | 0.1005 |
Fig. 7 shows that the kinetic model fits well; however, in the case of ACF the fitting kinetics was not so good compared to DFC because this pollutant requires a more complex kinetics, where more parameters are considered, such as adsorption, the attack of oxidizing species generated by dyes, among others.
 | ||
| Fig. 7 Kinetic fitting of 30 mg L−1 of contaminant using sensitized systems; (a) ACF and (b) DFC. [Legends: (●) 800 mgL−1 TiO2 – 5% RhB (■) 800 mgL−1 TiO2 – 5% EY; (○) 200 mgL−1 TiO2 – 2% RhB and (□) 200 mgL−1 TiO2 – 2% EY]. | ||
Table 2 shows the kinetic parameters obtained from fitting; Vinu, Polisetti, and Madras reported that kdye is associated with the sensitizing effect of the dye that involves the processes of electron injection and the generation of oxidizing species such as the superoxide anion radical and the hydroxyl radical, in this case the kdye values for Eosin y were higher than for Rhodamine B independent of the contaminant, i.e. Ey shows a better sensitizing effect which is validated by the experimental data.
k r is associated with the degradation of the contaminant, and for pharmaceutical compounds, DFC had greater degradation than ACF; this is attributed to the nature of the compounds and their resistance to hydroxylation which is the most important step in the degradation of compounds by heterogeneous photocatalysis.
At high dye concentrations the contribution of the term kr[Ri] in the denominator becomes negligible, and the reaction rate is of first order with respect to the concentration of the pollutant since both dyes show similar absorption of photons, while if the concentration of the dye is much lower than that of the pollutant the contribution of kdye[dye] is negligible and the kinetics is of first order with respect to the dye, i.e., for high catalyst/dye ratios, the reaction was controlled by the concentration of the pollutant since [Dye] ⋙ [Ri], while for low catalyst/dye ratios the reaction was controlled by the concentration of the dye because [Ri] ⋙ [Dye].
4. Conclusions
Systems sensitized with dyes presented a LVRPA much higher than the photocatalytic system; however, this does not guarantee a good degradation of pharmaceutical compounds as in the case of RhB.In the absence of the catalyst, dyes showed a sensitizing effect on the degradation of DCF and ACF, this is due to the generation of the oxidizing species product of the reaction between the electron transferred from the excited dye to the dissolved oxygen in the medium.
EY shows a better sensitization effect on TiO2 than RhB in the degradation of both contaminants DFC and ACF.
Photon absorption and one parameter of quantum yield were introduced to a kinetic expression and the rate coefficients for each pollutant and dye were obtained under the best operating conditions, which shows that the sensitization with Ey is more efficient.
Conflicts of interest
The authors declare no conflict of interest.Acknowledgements
The authors thank the Universidad de Cartagena, Universidad del Valle for funding the project 2967 and SENA for funding the project 12030; Diaz-Angulo thanks the Instituto Colombiano de Ciencia y Tecnología for doctoral study funding (convocatory 647).References
- L. Ferreira, E. Rosales, A. S. Danko, M. A. Sanromán and M. M. Pazos, Process Saf. Environ. Prot., 2016, 101, 19–26 CrossRef CAS
.
- S. Merouani, O. Hamdaoui and M. Bouhelassa, Mar. Pollut. Bull., 2017, 126, 557–564 Search PubMed
- N. Zhang, G. Liu, H. Liu, Y. Wang, Z. He and G. Wang, J. Hazard. Mater., 2011, 192(1), 411–418 CAS
- C. C. Su, C. A. Cada, M. L. P. Dalida and M. C. Lu, Sep. Purif. Technol., 2013, 120, 43–51 CrossRef CAS
- A. Achilleos, E. Hapeshi, N. P. Xekoukoulotakis, D. Mantzavinos and D. Fatta-Kassinos, Chem. Eng. J., 2010, 161(1–2), 53–59 CrossRef CAS
- S. Stets, B. do Amaral, J. T. Schneider, I. R. de Barros, M. V. de Liz and R. R. Ribeiro,
et al.
, J. Photochem. Photobiol., A, 2018, 353, 26–33 CrossRef CAS
- L. Rizzo, S. Meric, D. Kassinos, M. Guida, F. Russo and V. Belgiorno, Water Res., 2009, 43(4), 979–988 CrossRef CAS PubMed
- J. Wang and S. Wang, Chem. Eng. J., 2018, 334, 1502–1517 CrossRef CAS
- F. W. Low, C. W. Lai and S. B. Abd Hamid, J. Mater. Sci.: Mater. Electron., 2017, 28(4), 3819–3836 CrossRef CAS
- X. Lu, Y. Shao, N. Gao, J. Chen, Y. Zhang and H. Xiang,
et al.
, Ecotoxicol. Environ. Saf., 2017, 141, 139–147 CrossRef CAS PubMed
- Z. Zhu, H. Cai and D.-W. Sun, Trends Food Sci. Technol., 2018, 75, 23–35 CrossRef CAS
- A. J. Haider, R. H. Al-Anbari, G. R. Kadhim and C. T. Salame, Energy Procedia, 2017, 119, 332–345 CrossRef CAS
- G. Richhariya, A. Kumar, P. Tekasakul and B. Gupta, Renewable Sustainable Energy Rev., 2017, 69, 705–718 CrossRef CAS
- D. H. Song, H. Y. Kim, H. S. Kim, J. S. Suh, B. H. Jun and W. Y. Rho, Chem. Phys. Lett., 2017, 687, 152–157 CrossRef CAS
- N. A. Ramos-Delgado, M. A. Gracia-Pinilla, L. Maya-Treviño, L. Hinojosa-Reyes, J. L. Guzman-Mar and A. Hernández-Ramírez, J. Hazard. Mater., 2013, 263(Pt 1), 36–44 CrossRef CAS PubMed
- A. Arce-sarria, F. Machuca-mart and C. Bustillo-lecompte, Catalysts, 2018, 8, 1–14 CrossRef
- R. Malik, P. S. Rana, V. K. Tomer, V. Chaudhary and S. Duhan, Microporous Mesoporous Mater., 2016, 225, 245–254 CrossRef CAS
- E.-T. Yun, H.-Y. Yoo, W. Kim, H.-E. Kim, G. Kang and H. Lee,
et al.
, Appl. Catal., B, 2017, 203, 475–484 CrossRef CAS
- P. Chowdhury, S. Athapaththu, A. Elkamel and A. K. Ray, Sep. Purif. Technol., 2017, 174, 109–115 CrossRef CAS
- E. Safaralizadeh and S. Janitabar, Res. Chem. Intermed., 2017, 43(2), 1197–1209 CrossRef CAS
- M. Rani and S. K. Tripathi, Renewable Sustainable Energy Rev., 2016, 61, 97–107 CrossRef CAS
- K. Vignesh, A. Suganthi, M. Rajarajan and R. Sakthivadivel, Appl. Surf. Sci., 2012, 258(10), 4592–4600 CrossRef CAS
- J. He, J. Zhao, T. Shen, H. Hidaka and N. Serpone, J. Phys. Chem. B, 1997, 101(44), 9027–9034 CrossRef CAS
- A. Brucato, G. Li Puma and J. N. Khor, Environ. Sci. Technol., 2004, 38, 3737–3745 CrossRef
- J. Colina-Márquez, F. Machuca-Martínez and G. L. Puma, Environ. Sci. Technol., 2010, 44(13), 5112–5120 CrossRef PubMed
- D. Chatterjee, Catal. Commun., 2010, 11(5), 336–339 CrossRef CAS
- H. L. Otálvaro-Marín, M. Angel Mueses, J. C. Crittenden and F. Machuca-Martinez, Chem. Eng. J., 2017, 315, 283–295 CrossRef
- I. Grčić and G. Li Puma, Appl. Catal., B, 2017, 222–234 CrossRef
- J. C. Yu, Y. Xie, H. Y. Tang, L. Zhang, H. C. Chan and J. Zhao, J. Photochem. Photobiol., A, 2003, 156(1–3), 235–241 CrossRef CAS
- L. Pan, J. J. Zou, S. Wang, Z. F. Huang, X. Zhang and L. Wang, Appl. Surf. Sci., 2013, 268, 252–258 CrossRef CAS
- R. Vinu, S. Polisetti and G. Madras, Chem. Eng. J., 2010, 165(3), 784–797 CrossRef CAS
- Y.-C. Hsiao, T.-F. Wu, Y.-S. Wang, C.-C. Hu and C. Huang, Appl. Catal., B, 2014, 148–149, 250–257 CrossRef CAS
- U. Mehmood, A. Al-Ahmed, F. A. Al-Sulaiman, M. I. Malik, F. Shehzad and A. U. H. Khan, Renewable Sustainable Energy Rev., 2017, 79, 946–959 CrossRef CAS
- H. Lachheb, E. Puzenat, A. Houas, M. Ksibi, E. Elaloui and C. Guillard,
et al.
, Appl. Catal., B, 2002, 39(1), 75–90 CrossRef CAS
- L. Lonappan, T. Rouissi, S. Kaur, M. Verma and R. Y. Surampalli, Bioresour. Technol., 2018, 249, 386–394 CrossRef CAS PubMed
- S. Manoharan, S. Sahoo, P. Pazhamalai and S. J. Kim, J. Hydrogen Energy, 2018, 43(3), 1667–1674 CrossRef CAS
- W. Zhong, Z. Xiao, G. Qian and X. Liu, Electrochim. Acta, 2017, 247, 779–786 CrossRef CAS
- Q. Wang, C. Chen, D. Zhao, M. Wanhong and J. Zhao, Langmuir, 2008, 24(14), 7338–7345 CrossRef CAS PubMed
- A. Zyoud, N. Zaatar, I. Saadeddin, M. H. Helal, G. Campet and M. Hakim,
et al.
, Solid State Sci., 2011, 13(6), 1268–1275 CrossRef CAS
- W. S. Kuo, Y. H. Chiang and L. S. Lai, Dyes Pigm., 2008, 76(1), 82–87 CrossRef
Footnote |
| † Electronic supplementary information (ESI) available. See DOI: 10.1039/c8pp00270c |
| This journal is © The Royal Society of Chemistry and Owner Societies 2019 |