A mitochondria-targeted near-infrared fluorescent probe with a large Stokes shift for real-time detection of hypochlorous acid†
Xiaojie
Jiao
a,
Kun
Huang
ab,
Song
He
a,
Chang
Liu
*a,
Liancheng
Zhao
ac and
Xianshun
Zeng
 *ac
*ac
aTianjin Key Laboratory for Photoelectric Materials and Devices, and Key Laboratory of Display Materials and Photoelectric Devices, Ministry of Education, School of Materials Science & Engineering, Tianjin University of Technology, Tianjin 300384, China. E-mail: xshzeng@tjut.edu.cn; kmn667@163.com; Fax: (+86)22-60215226; Tel: (+86)22-60216748
bSchool of Chemistry and Chemical Engineering, China West Normal University, Nanchong 637002, China
cSchool of Materials Science and Engineering, Harbin Institute of Technology, Harbin 150001, China
First published on 29th November 2018
Abstract
Hypochlorous acid (HOCl) has been known to be intertwined with various pathophysiological processes. In this paper, a novel mitochondria-targeted near-infrared (NIR) fluorescent probe L based on a chromenylium-phenothiazine conjugate has been designed and synthesized for the detection of hypochlorous acid. Due to the HOCl-promoted intramolecular charge transfer processes, the probe L shows near-infrared fluorescence emission at 672 nm, large Stokes shifts of 97 nm, fast response, and high selectivity and sensitivity. Furthermore, the probe L is biocompatible, cell-membrane permeable and mitochondria-targetable, and can be used for endogenous HOCl imaging in living cells.
Introduction
Intracellular reactive oxygen species (ROS, such as H2O2, 1O2 and O2−) are a series of chemically reactive species which contain oxygen atoms existing in living organisms.1,2 Among them, HOCl is one of the vital members, which plays a crucial role in a wide range of physiological and pathological processes in our human body,2,3 including respiration,4,5 intracellular signal transduction,6 and immune responses.7 However, the mis-regulation of HOCl production in biological systems can cause a series of organ dysfunctions, and an excessive amount of HOCl in cells may cause oxidative damage to nucleic acids, change the protein structure, and attack lipid molecules,8–11 thereby contributing to aging and age-related diseases ranging from cardiovascular disease, neurodegenerative disease, diabetes to cancer.8 Thus, visually monitoring the distribution and functions of cellular HOCl is crucial for further understanding the physiological and pathological process of HOCl-associated diseases in biological systems.12To date, there have been several analytical tools such as high-performance liquid chromatography, electroanalysis, potentiometry, colorimetry, fluorometry, and optical imaging that have sufficient sensitivity and selectivity for the detection of HOCl under various requirements.13 In view of the in situ analysis and spatial-temporal imaging patterns, the fluorescence imaging method exhibits some sort of indispensability for the visual investigation of the physiological processes of HOCl at the cellular level.14 Thus, much effort has recently been devoted to developing efficient fluorescent probes for the detection of HOCl by taking advantage of its strong oxidation properties. They mainly include the aryl boronic ester-based probes,15,16 hydrazine-based probes,17–21 electron-rich atom (such as S, Se, P)-based probes,22–28 and some electron-rich functional group (such as p-alkoxyaniline, p-methoxyphenol analogues)-based probes.29–36 Although many of these probes have been successfully utilized to image HOCl in cellular environments, the probe with a near-infrared (NIR) emission nature for real-time detection of HOCl at the subcellular level is still rare.37–40 As a result, the development of novel real-time responsive NIR probes for visualizing the distribution and functions of HOCl is of considerable importance for understanding its physiological and pathological process.
Encouragingly, by summarizing the probes reported in recent years, we found that the phenothiazine moiety was an excellent candidate to prepare a real-time responsive probe for HOCl. In 2015, Wang et al. reported probes PZ-Py41 and PMN-TPP42 with the phenothiazine moiety for HOCl detection (Table S1†). In 2018, Lin and co-workers demonstrated that PZ-HA exhibited excellent properties, including fast responsiveness, good selectivity, low cytotoxicity and well membrane-permeability for HOCl imaging.43 More recently, Gupta's group reported a new phenothiazine appended BODIPY derivative HCP with an extremely low detection limit (4.1 nM).44 In our earlier studies, probes PT-1, PT-2,45Ptz-AO12 and Dcp-EPtz46 have also been prepared by using the phenothiazine moiety for HOCl detection. They are reported to be fast-responsive probes but exhibit the emission maximum at a relatively shorter wavelength (λem < 650 nm) which limited their further application (Table S1†).
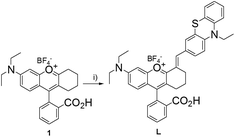
Bearing the above in mind, we herein report a rational design and synthesis of a NIR probe L (Scheme 1) by incorporating the phenothiazine moiety into the chromenylium-cyanine fluorophore, a type of NIR dye with cell permeability and low cytotoxicity developed by Lin and his coworkers.47 After reaction with HOCl, the probe L displays an extremely fast (3 s) turn-on fluorescence response at 672 nm. We assessed in detail its optical properties and selectivity toward a number of different interfering ions or reactive molecules. The results indicate that the probe L possesses NIR emission, a large Stokes shift (ca. 100 nm), a prominent turn-on fluorescence signal (50-fold fluorescence enhancement) and high selectivity. Furthermore, the probe L is mitochondria-targetable, and can be used for endogenous HOCl imaging in living cells.
Results and discussion
Optical responses to HOCl
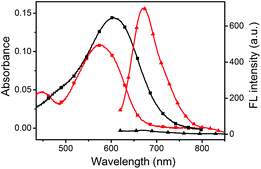
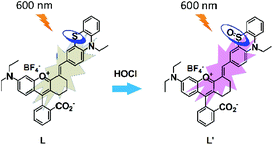
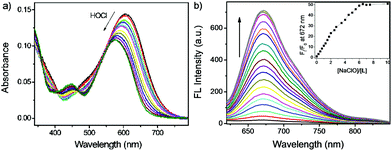
The UV-vis absorption and fluorescence emission properties of the probe L were initially elucidated in PBS buffer (10 mM, pH = 7.4, containing 50% EtOH). L displays absorption peaks at 608 nm (ε = 1.44 × 104 cm−1 M−1), which can be assigned to the π–π* transition of the chromenylium-cyanine chromophore. Upon excitation at 600 nm, the chromenylium-cyanine chromophore exhibits a very weak fluorescence emission band at 672 nm (Φ = 0.0011). When reacted with 10 equiv. NaOCl, the absorption maximum of the chromophore blue-shifted from 608 nm to 575 nm (ε = 1.09 × 104 cm−1 M−1), and furthermore, the fluorescence intensity of L at 672 nm increased remarkably (Φ = 0.056, upon addition of 10 equiv. of NaOCl), and exhibited a large Stokes shift of 97 nm (Fig. 1).As illustrated in Scheme 2, the HOCl-promoted spectral changes of the probe L could be explained by the intramolecular charge transfer (ICT) mechanism.43,48 Before reaction with HOCl, the probe L exhibited long wavelength absorption and very weak fluorescence emission spectra due to the ICT process between the electron-rich S atom and the electron-deficient chromenylium-cyanine moiety. After reaction with HOCl, the electron-rich phenothiazine group was oxidized to yield a sulfoxide, which blocked the ICT process from the S atom to the electron-deficient chromenylium-cyanine fluorophore and led to a blue-shifted absorption (33 nm) and largely enhanced the fluorescence emission spectra of the fluorophore. To verify the proposed detection mechanism of L towards HOCl, the high-resolution mass spectra (HRMS) of L′ (L + HOCl) was recorded (Fig. S1†), which provided reliable evidence for the HOCl-induced oxidation of the S atom of the phenothiazine moiety to produce the fluorescent product L′ (m/z: 629.2499; calcd: 629.2469). The result confirmed that the probe L was converted to its sulfoxide L′.
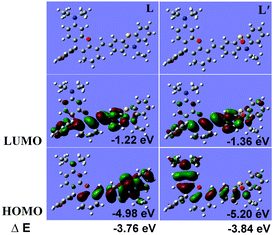
We further employed density functional theory (DFT) to shed light on the spectral phenomena with the B3LYP exchange functional using 6-31+G(d) basis sets employing a suite of Gaussian 09 programs (in gas phase).49–51 As shown in Fig. 2, the results showed that the HOMO (highest occupied molecular orbital) of the probe L mainly distributed in the phenothiazine-vinyl moiety (mainly in phenothiazine) and the LUMO (lowest unoccupied molecular orbital) mainly distributed in the chromenylium-vinyl moiety. After oxidation by HOCl, however, the HOMO of L′ distributed mainly in the whole π-conjugate framework of the oxidized chromenylium-phenothiazine, while the LUMO still distributed mainly in the chromenylium-vinyl moiety. Besides, the energy gap of L was lower than that of L′ suggesting that the effect of the ICT process on L′ should be less intensive than that on the probe L. A facile charge-transfer process and a low HOMO–LUMO energy gap presumably accounts for the poor emission quantum yield of L, while the higher emission quantum yield of L′ is put down to the blocked ICT process and the increase of the HOMO–LUMO energy gap.52 These theoretical data results were in accordance with the absorption spectrum of L and L′ which showed an intense and broad absorption band in the NIR spectra, a conspicuous characteristic of ICT dyes, and also corresponding with the absorption blue shift of L upon reaction with HOCl and a large Stokes shift in emission.53
To evaluate the responding properties of the probe L toward HOCl, the colorimetric and fluorometric titration experiments were carried out (Fig. 3). As shown in Fig. 3a, the absorbance of the chromenylium-cyanine chromophore at 608 nm decreased with the increasing concentrations of OCl−. After the addition of 0–30.0 equivalents of OCl−, the absorbance at 608 nm shifted hypsochromically to 575 nm along with a synchronous emergence of a novel absorption band centered at 448 nm. Meanwhile, the fluorescence intensity of the probe increased synchronously with the addition of an incremental amount of OCl− (Fig. 3b), which led to over 50-fold fluorescence enhancement under saturated conditions (inset of Fig. 3b). Plotting the emission intensity at 672 nm versus the concentration of OCl− followed the sigmoidal curves and furnished the fluorescence turn-on constant (Kturn-on = 6.47 μM, R2 = 0.9952) (Fig. S2†).54 With the increase of OCl− from 0 to 2.5 μM, a linear correlation between the emission intensity (672 nm) and OCl− concentration was found to be y = 0.22841 + 2.70391[OCl−] (R = 0.989) (Fig. S3†). Following the HOCl-dependent changes of fluorescence intensity at 672 nm, the limit of detection (LOD) of the probe L was determined to be 92 nM from the 3σ/k method (k is the slope of the fluorescence intensity versus OCl− concentration and σ is the standard deviation of the blank, n = 9) (Fig. S3†).55
Selectivity of the probe L toward HOCl
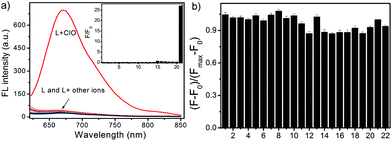
To exclude interferences caused by other species, it is crucial to examine the specific nature of L towards HOCl. The selectivity of L was scrutinized among other oxidative species such as H2O2, ONOO−, NO, O2−, ˙OH and TBHP, and other ions, such as Ac−, AcO−, Br−, Cl−, F−, CO32−, SO42−, NO2−, Mg2+, Ca2+, Cu2+, K+, Na+, and Fe3+. As shown in Fig. 4a, the probe L showcased the high specificity for OCl−. An obvious fluorescence change was neither observed in the presence of 10.0 equiv. of reactive oxygen and nitrogen species (ROS and RNS) such as H2O2, ONOO−, NO, O2−, or ˙OH, which exist in neutrophils, macrophages and dendritic cells upon an inflammatory stimulus,56 nor in the presence of 10.0 equiv. of other chemical species including Ac−, AcO−, Br−, Cl−, F−, CO32−, SO42−, NO2−, Mg2+, Ca2+, Cu2+, K+, Na+, Fe3+, and TBHP. However, the introduction of the major intracellular reactive oxygen species OCl−![[thin space (1/6-em)]](https://www.rsc.org/images/entities/char_2009.gif) 57 (10.0 equiv.) led to a significantly enhanced fluorescence emission at 672 nm.
57 (10.0 equiv.) led to a significantly enhanced fluorescence emission at 672 nm.
To explore the possibility of using L as a practical selective fluorescent probe for HOCl, competition experiments were simultaneously carried out, in which L (10 μM) was firstly mixed with 10 equiv. of other oxidative species and ions followed by the addition of 10 equiv. of OCl−. Fluorescence emission spectroscopy was used to monitor the competition events. As shown in Fig. 4b, in the presence of the above-mentioned background species, the probe L still exhibits an excellent fluorescence turn-on effect for the detection of OCl−. The results clearly demonstrated that the probe L was able to differentiate HOCl from other ROS and RNS, such as H2O2, ONOO−, NO, O2−, and ˙OH, produced in innate immune cells in response to an inflammatory stimulus.56,57
Time-dependent fluorescence assays of L toward HOCl
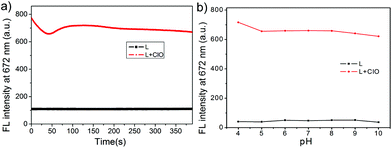
Due to the highly reactive and short lifespan character of HOCl in living systems, the probe with the ability of real-time monitoring of HOCl levels under physiological conditions is of great value. Thus, we subsequently measured the time-dependent fluorescence response and the photostability of L toward HOCl under excitation at 600 nm. As shown in Fig. 5a, the probe alone displayed an almost stable emission signal output when continuously excited under a 600 nm laser within 400 s.With the addition of OCl−, the emission intensity of L increased immediately and then attained the maximum within quite a short time (in few seconds), and then there was a slight fluctuation of the fluorescence intensity in the subsequent 90 s due to the complex conversions of the radical intermediate of the phenothiazine moiety to the final sulfoxide L′.58 Finally, the fluorescence intensity became almost stable from 90 s to 400 s under continuous 600 nm laser excitation, indicating that the probe L was converted completely to the sulfoxide L′ (Scheme 2). Although the structural conversions during the oxidation process led to a signal fluctuation, in fact, a slight decrease took place by 400 s which caused about 6% attenuation of the intensity, there was a sufficient turn on effect for HOCl detection, meaning that the probe L displayed a real time fluorescence response towards HOCl.
The pH effect of the probe L
Due to the differences in the pH values in various cell compartments,59 keeping the stable output of the fluorescence signal in acidic, neutral and alkaline environments is a very important property of the probe. We therefore assessed the fluorescence spectral responses of L and those of L in the presence of OCl− (10.0 equiv.) in different pH environments. As shown in Fig. 5b, the fluorescence intensity of the probe L was stable in the pH range of 4.0–10.0. In the presence of OCl−, however, the fluorescence signal of the probe L increased dramatically in the pH range of 4.0–10.0. The pH response of L covered the physiological pH range perfectly (4.0–8.0), implying that the strong pH tolerance of L allowed the HOCl determination under physiological conditions.Fluorescence image of HOCl in living cells
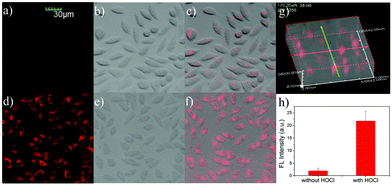
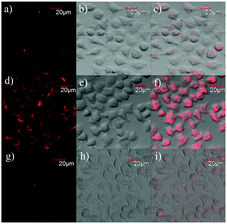
The above key optical features, including good selectivity, higher fluorescence turn-on ratio, response in real time, and working appropriately under physiological conditions, demonstrated that the probe L should be useful as a vehicle for monitoring HOCl in living cells. As MTT assays confirmed that the probe L has lower toxicity towards live cells when the concentration of the probe was 5 μM and the cells were incubated for 24 h (Fig. S4 and S5†), we assessed whether the probe L can image HOCl in live cells (including L929, HeLa, and RAW 264.7 cells) by means of laser scanning confocal microscopy.Firstly, mouse fibroblast L929 cells were fed with the probe (5.0 μM) and incubated at 37 °C for 30 min in the growth medium of RPMI-1640 and then rinsed with DPBS, and very weak emission intensities were observed with an excitation of 559 nm in the cells (Fig. 6a). In contrast, after treatment with NaOCl (25 μM) and then fed for another 30 min, the fluorescence outputs in 620–710 nm were largely increased (Fig. 6d and h). Comparing the fluorescence images with the bright field images (Fig. 6e), it was found that the fluorescence signals of L were located in some specific areas of cytoplasm (Fig. 6f). To further confirm that the probe L was internalized into the cells, rather than just attached on the surface of the cells, we simultaneously captured a three-dimensional (3D) image of L929 cells after incubating it with L and OCl−. As can be seen from Fig. 6g, the probe L was deep into the cells. Furthermore, the experiments in HeLa cells showed the same results as those in L929 cells (Fig. S6†). Thus, the results suggested that the probe was able to detect HOCl in living cells.
Subsequently, we performed confocal fluorescence imaging of the probe L to HOCl using the murine macrophage cells RAW264.7 which could generate endogenous HOCl when they were stimulated with lipopolysaccharide (LPS) and phorbol myristate acetate (PMA)60 as the biological test model. As expected, when RAW 264.7 cells were incubated with L for 30 min and then rinsed with DPBS buffer, the cells exhibited weak fluorescence signals in 620–710 nm (Fig. 7a). When the cells were stimulated with 1 μg mL−1 LPS for 16 h and 1.5 μg mL−1 PMA for 30 min together and then incubated with L for 30 min, a significant increase in the intracellular fluorescence was observed (Fig. 7d). Compared with Fig. 7d, there was obviously a suppressed fluorescence signal shown in Fig. 7g as a general antioxidant N-acetylcysteine (NAC) was used to clear the HOCl generated by LPS/PMA stimulation. These results suggested that L was able to detect and image endogenous HOCl in RAW264.7 cells.
Investigation of the sub-cellular localization of L
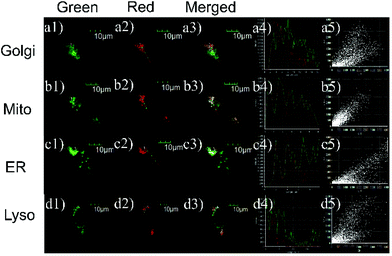
Encouraged by the aforementioned experimental results, the cellular distribution properties of probe L were explored by colocalization with the commercial subcellular organelle markers, namely, Golgi-Tracker Green, LysoTracker Green DND-26, ER-Tracker Green, and MitoTracker Green. As shown in Fig. 8, fluorescence images of L overlapped well with those of mitochondria localization agents. Specifically, we obtained high Pearson's co-localization coefficients (0.92) for L with MitoTracker Green, while the co-localization coefficients of L with other trackers were low. The result indicated that the probe L mainly distributed in mitochondrial areas with high co-localization coefficients. We think that this may be because the probe L is a positively charged and low molecular weight organic compound with lipophilic properties. As is reported, small molecules of this type are more likely to penetrate the cell membrane and aggregate in special organelles easily, such as endoplasmic reticulum or mitochondria.61–63Experimental
Preparation of L
Compound 1 was prepared according to the reported procedures by the reaction of distilled cyclohexanone and 2-(4-(diethylamino)-2-hydroxy-benzoyl)benzoic acid,64 and was used for the succeeding reaction without further purification.In a 50 mL round-bottomed flask, compound 1 (0.21 mmol) and 10-ethyl-10H-phenothiazine-3-carbaldehyde (0.22 mmol) were dissolved in 6 mL acetic acid, then the reaction mixture was heated to 90 °C and further stirred at 90 °C overnight. The solvent was removed by using a rotary evaporator under reduced pressure, and then the crude product was purified by silica gel chromatography with ethanol/dichloromethane (1![[thin space (1/6-em)]](https://www.rsc.org/images/entities/char_2009.gif) :
:![[thin space (1/6-em)]](https://www.rsc.org/images/entities/char_2009.gif) 300 to 1
300 to 1![[thin space (1/6-em)]](https://www.rsc.org/images/entities/char_2009.gif) :
:![[thin space (1/6-em)]](https://www.rsc.org/images/entities/char_2009.gif) 30) as the eluent to afford compound L as a dark blue solid, in 30% yield; mp: 161–162 °C. HRMS: [M–BF4−]+ = 613.2525; calcd: 613.2509; 1H NMR (400 MHz, CDCl3) δ 7.96 (d, 1H, J = 8.0 Hz), 7.64 (dd, 1H, J = 8.0 Hz, 7.6 Hz), 7.54 (dd, 1H, J = 8.0 Hz, 7.6 Hz), 7.28 (s, 1H), 7.22–7.11 (m, 5H), 6.93–6.85 (m, 3H), 6.51 (d, 1H, J = 8.0 Hz), 6.43 (s, 1H), 6.37 (d, 1H, J = 8.0 Hz), 3.95 (q, 2H, J = 6.8 Hz), 3.36 (q, 4H, J = 6.8 Hz), 2.82–2.77 (m, 1H), 2.65–2.60 (m, 1H), 2.08–2.03 (m, 1H), 1.68–1.60 (m, 3H), 1.44 (t, 3H, J = 6.8 Hz), 1.18 (t, 6H, J = 6.8 Hz). 13C NMR (100 MHz, CDCl3) δ 169.9, 152.7, 149.7, 144.5, 143.9, 134.3, 131.4, 130.9, 130.8, 129.3, 128.9, 128.8, 128.7, 128.2, 128.0, 127.4, 127.3, 125.4, 125.0, 123.9, 123.8, 122.5, 115.1, 114.6, 109.3, 108.6, 105.8, 97.3, 44.6, 41.9, 27.3, 23.2, 22.3, 13.0, 12.6.
30) as the eluent to afford compound L as a dark blue solid, in 30% yield; mp: 161–162 °C. HRMS: [M–BF4−]+ = 613.2525; calcd: 613.2509; 1H NMR (400 MHz, CDCl3) δ 7.96 (d, 1H, J = 8.0 Hz), 7.64 (dd, 1H, J = 8.0 Hz, 7.6 Hz), 7.54 (dd, 1H, J = 8.0 Hz, 7.6 Hz), 7.28 (s, 1H), 7.22–7.11 (m, 5H), 6.93–6.85 (m, 3H), 6.51 (d, 1H, J = 8.0 Hz), 6.43 (s, 1H), 6.37 (d, 1H, J = 8.0 Hz), 3.95 (q, 2H, J = 6.8 Hz), 3.36 (q, 4H, J = 6.8 Hz), 2.82–2.77 (m, 1H), 2.65–2.60 (m, 1H), 2.08–2.03 (m, 1H), 1.68–1.60 (m, 3H), 1.44 (t, 3H, J = 6.8 Hz), 1.18 (t, 6H, J = 6.8 Hz). 13C NMR (100 MHz, CDCl3) δ 169.9, 152.7, 149.7, 144.5, 143.9, 134.3, 131.4, 130.9, 130.8, 129.3, 128.9, 128.8, 128.7, 128.2, 128.0, 127.4, 127.3, 125.4, 125.0, 123.9, 123.8, 122.5, 115.1, 114.6, 109.3, 108.6, 105.8, 97.3, 44.6, 41.9, 27.3, 23.2, 22.3, 13.0, 12.6.
Preparation of samples
The stock solution of L was 10 mM in DMSO. The stock solution of HOCl was 1 mM, thinned down with Milli-Q water, and other interference species such as t-BuOOH, Ac−, AcO−, Br−, Cl−, F−, CO32−, SO42−, NO2−, Mg2+, Ca2+, Cu2+, K+, Na+, Fe3+, and NO3− were prepared in 50 mM concentration in Milli-Q water. The concentrations of HOCl (ε292 = 350 cm−1 M−1) and H2O2 (ε240 = 43.6 cm−1 M−1) were estimated according to their UV-Vis absorption spectra;65 hydroxyl radical (˙OH), nitric oxide (NO), peroxynitrite (ONOO−) and superoxide (O2˙−) were prepared before use according to the reported procedures.Conclusions
In summary, we have designed and synthesized a novel mitochondria-targeted near-infrared fluorescent probe L by incorporating the phenothiazine moiety into the chromenylium-cyanine fluorophore for the detection of hypochlorous acid. Based on the oxidation-promoted intramolecular charge transfer processes, the probe L for hypochlorous acid demonstrates near-infrared fluorescence emission, a large Stokes shift of 97 nm, fast response, high selectivity and sensitivity. Furthermore, the probe L is cell-membrane permeable and mitochondria-targetable, has low cytotoxicity, and can be used for endogenous HOCl imaging in living cells. This mitochondria-targeted near-infrared fluorescent probe should be very useful for the investigation of the biofunction of HOCl at organelle levels.Conflicts of interest
There are no conflicts to declare.Acknowledgements
We gratefully acknowledge the Natural Science Foundation of China (NNSFC 21272172), and the Natural Science Foundation of Tianjin (12JCZDJC21000).Notes and references
- Y. Tang, F. Feng, F. He, S. Wang, Y. Li and D. Zhu, J. Am. Chem. Soc., 2006, 128, 14972 CrossRef CAS.
- M. Schieber and N. S. Chandel, Curr. Biol., 2014, 24, 453 CrossRef PubMed.
- J. D. Lambeth, Free Radical Biol. Med., 2007, 43, 332 CrossRef CAS PubMed.
- A. Daugherty, J. L. Dunn, D. L. Rateri and J. W. Heinecke, J. Clin. Invest., 1994, 94, 437 CrossRef CAS PubMed.
- K. C. Huang, C. C. Yang, K. T. Lee and C. T. Chien, Kidney Int., 2003, 64, 704 CrossRef CAS.
- S. M. Wu and S. V. Pizzo, Arch. Biochem. Biophys., 2001, 391, 119 CrossRef CAS.
- S. Weitzman and L. Gordon, Blood, 1990, 76, 655 CAS.
- D. Pattison and M. Davies, Chem. Res. Toxicol., 2001, 14, 1453 Search PubMed.
- Y. Liu, Z. Zhao, J. Miao and B. Zhao, Anal. Chim. Acta, 2016, 921, 77 CrossRef CAS PubMed.
- H. Zhu, J. Fan, J. Wang, H. Mu and X. Peng, J. Am. Chem. Soc., 2015, 136, 12820 CrossRef PubMed.
- M. J. Morgan and Y. S. Kim, NOX1, reactive oxygen species, JNK, and necrotic cell death, Cell Death in Biology & Diseases, Springer, New York, 2014, p. 135 Search PubMed.
- L. Liang, C. Liu, X. Jiao, L. Zhao and X. Zeng, Chem. Commun., 2016, 52, 7982 RSC.
- L. Moberg and B. Karlberg, Anal. Chim. Acta, 2000, 407, 127 CrossRef CAS.
- Y. Zhang, Y. Liu, X. Feng and B. Zhao, Sens. Actuators, B, 2017, 240, 18 CrossRef CAS.
- Q. Xu, K. Lee, S. Lee, K. Lee, W. Lee and J. Yoon, J. Am. Chem. Soc., 2013, 135, 9944 CrossRef CAS.
- Q. Wang, C. Liu, J. Chang, Y. Lu, S. He, L. Zhao and X. Zeng, Dyes Pigm., 2013, 99, 733 CrossRef CAS.
- L. Long, D. Zhang, X. Li, J. Zhang, C. Zhang and L. Zhou, Anal. Chim. Acta, 2013, 775, 100 CrossRef CAS PubMed.
- S. Goswami, S. Das, K. Aich, P. Nandi, K. Ghoshal, C. Quah, M. Bhattacharyya, H. Fun and H. A. Aziz, RSC Adv., 2014, 4, 24881 RSC.
- P. Xing, K. Gao, B. Wang, J. Gao, H. Yan, J. Wen, W. Li, Y. Xu, H. Li, J. Chen, W. Wang and S. Sun, Chem. Commun., 2016, 52, 5064 RSC.
- Z. Yang, M. Wang, M. She, B. Yin, Y. Huang, P. Liu, J. Li and S. Zhang, Sens. Actuators, B, 2014, 202, 656 CrossRef CAS.
- (a) F. Wei, Y. Lu, S. He, L. Zhao and X. Zeng, Anal. Methods, 2012, 4, 616 RSC; (b) F. Wei, Y. Lu, S. He, L. Zhao and X. Zeng, J. Fluoresc., 2012, 22, 1257 CrossRef CAS.
- S. Kenmoku, Y. Urano, H. Kojima and T. Nagano, J. Am. Chem. Soc., 2007, 129, 7313 CrossRef CAS PubMed.
- B. Wang, P. Li, F. Yu, P. Song, X. Sun, S. Yang, Z. Lou and K. Han, Chem. Commun., 2013, 49, 1014 RSC.
- Z. Lou, P. Li, Q. Pan and K. Han, Chem. Commun., 2013, 49, 2445 RSC.
- (a) X. Jiao, C. Liu, Q. Wang, K. Huang, S. He, L. Zhao and X. Zeng, Anal. Chim. Acta, 2017, 969, 49 CrossRef CAS; (b) B. Zhang, X. Yang, R. Zhang, Y. Liu, R. Xue, X. Min, Y. Ye and Y. Zhao, Anal. Chem., 2017, 89, 10384 CrossRef CAS PubMed; (c) C. Liu, Q. Wang, X. Jiao, H. Yao, S. He, L. Zhao and X. Zeng, Dyes Pigm., 2019, 160, 989 CrossRef CAS.
- X. Wang, L. Zhou, F. Qiang, F. Wang, R. Wang and C. Zhao, Anal. Chim. Acta, 2016, 911, 114–120 CrossRef CAS PubMed.
- G. Cheng, J. Fan, W. Sun, J. Cao, C. Hu and X. Peng, Chem. Commun., 2014, 50, 1018 RSC.
- Q. Lin, Y. Huang, X. Fan, X. Zheng, X. Chen, X. Zhan and H. Zheng, Talanta, 2017, 170, 496 CrossRef CAS.
- (a) Y. Koide, Y. Urano, S. Kenmoku, H. Kojima and T. Nagano, J. Am. Chem. Soc., 2007, 129, 10324 CrossRef CAS PubMed; (b) Z.-N. Sun, F.-Q. Liu, Y. Chen, P. K. H. Tam and D. Yang, Org. Lett., 2008, 10, 2171 CrossRef CAS PubMed.
- S. Izumi, Y. Urano, K. Hanaoka, T. Terai and T. Nagano, J. Am. Chem. Soc., 2009, 131, 10189 CrossRef CAS.
- Y. Zhao, H. Li, Y. Xue, Y. Ren and T. Han, Sens. Actuators, B, 2017, 241, 335 CrossRef CAS.
- K. Cui, D. Zhang, G. Zhang and D. Zhu, Tetrahedron Lett., 2010, 51, 6052 CrossRef CAS.
- W. Zhang, C. Guo, L. Liu, J. Qin and C. Yang, Org. Biomol. Chem., 2011, 9, 5560 RSC.
- Y. Zhou, J. Li, K. Chu, K. Liu, C. Yao and J. Li, Chem. Commun., 2012, 48, 4677 RSC.
- Y. Yue, C. Yin, F. Huo, J. Chao and Y. Zhang, Sens. Actuators, B, 2014, 202, 551 CrossRef CAS.
- K. Huang, S. He and X. Zeng, Tetrahedron Lett., 2017, 58, 2004 CrossRef CAS.
- J. Li, X. Yang, D. Zhang, Y. Liu, J. Tang, Y. Li, Y. Zhao and Y. Ye, Sens. Actuators, B, 2018, 265, 84 CrossRef CAS.
- B. Zhu, L. Ping, S. Wei, X. Wang, C. Liu, Y. Wang, Z. Wang, Y. Wang and B. Tang, Anal. Chem., 2016, 88, 12532 CrossRef CAS PubMed.
- Y. Yue, F. Huo, C. Yin, J. Escobedo and R. M. Strongin, Analyst, 2016, 141, 1859 RSC.
- X. Chen, F. Wang, J. Hyun, T. Wei, J. Qiang, X. Ren, I. Shin and J. Yoon, Chem. Soc. Rev., 2016, 45, 2976 RSC.
- H. Xiao, K. Xin, H. Dou, G. Yin, Y. Quan and R. Wang, Chem. Commun., 2015, 51, 1442 RSC.
- H. Xiao, J. Li, J. Zhao, G. Yin, Y. Quan, J. Wang and R. Wang, J. Mater. Chem. B, 2015, 3, 1633 RSC.
- B. Deng, M. Ren, X. Kong, K. Zhou and W. Lin, Sens. Actuators, B, 2018, 255, 963 CrossRef CAS.
- M. Vedamalai, D. Kedaria, R. Vasita and I. Gupta, Sens. Actuators, B, 2018, 263, 137 CrossRef CAS.
- C. Liu, X. Jiao, S. He, L. Zhao and X. Zeng, Talanta, 2017, 174, 234 CrossRef CAS PubMed.
- D. Zheng, X. Qiu, C. Liu, X. Jiao, S. He, L. Zhao and X. Zeng, New J. Chem., 2018, 42, 5135 RSC.
- Y. Wei, C. Dan, T. Ren, Y. Li, Z. Zeng and L. Yuan, Anal. Chem., 2016, 88, 1842 CrossRef CAS PubMed.
- Z. R. Grabowski, K. Rotkiewicz and W. Rettig, Chem. Rev., 2003, 103, 3899 CrossRef PubMed.
- F. Chen, G. Liu, Y. Shi, P. Xi, J. Cheng, J. Hong, R. Shen, X. Yao, D. Bai and Z. Zeng, Talanta, 2014, 124, 139 CrossRef CAS PubMed.
- Y. Li, Y. Wang, S. Yang, Y. Zhao, L. Yuan, J. Zheng and R. Yang, Anal. Chem., 2015, 87, 2495 CrossRef CAS PubMed.
- M. J. Frisch, G. W. Trucks, H. B. Schlegel, G. E. Scuseria, M. A. Robb, J. R. Cheeseman, G. Scalmani, V. Barone, B. Mennucci, G. A. Petersson, H. Nakatsuji, M. Caricato, X. Li, H. P. Hratchian, A. F. Izmaylov, J. Bloino, G. Zheng, J. L. Sonnenberg, M. Hada, M. Ehara, K. Toyota, R. Fukuda, J. Hasegawa, M. Ishida, T. Nakajima, Y. Honda, O. Kitao, H. Nakai, T. Vreven, J. A. Montgomery Jr., J. E. Peralta, F. Ogliaro, M. Bearpark, J. J. Heyd, E. Brothers, K. N. Kudin, V. N. Staroverov, R. Kobayashi, J. Normand, K. Raghavachari, A. Rendell, J. C. Burant, S. S. Iyengar, J. Tomasi, M. Cossi, N. Rega, J. M. Millam, M. Klene, J. E. Knox, J. B. Cross, V. Bakken, C. Adamo, J. Jaramillo, R. Gomperts, R. E. Stratmann, O. Yazyev, A. J. Austin, R. Cammi, C. Pomelli, J. W. Ochterski, R. L. Martin, K. Morokuma, V. G. Zakrzewski, G. A. Voth, P. Salvador, J. J. Dannenberg, S. Dapprich, A. D. Daniels, O. Farkas, J. B. Foresman, J. V. Ortiz, J. Cioslowski and D. J. Fox, Gaussian 09, Revision A.01, Gaussian, Inc., Wallingford, CT, 2009 Search PubMed.
- F. Ali, S. Aute, S. Sreedharan, H. A. Anila, H. K. Saeed, C. G. Smythe, J. A. Thomas and A. Das, Chem. Commun., 2018, 54, 1849 RSC.
- Z. Zhang, G. Zhang, J. Wang, S. Sun and Z. Zhang, Comput. Theor. Chem., 2016, 1095, 44 CrossRef CAS.
- X. Jiao, C. Liu, K. Huang, S. Zhang, S. He, L. Zhao and X. Zeng, Org. Biomol. Chem., 2015, 13, 6647 RSC.
- Q. Wang, X. Jiao, C. Liu, S. He, L. Zhao and X. Zeng, J. Mater. Chem. B, 2018, 6, 4096 RSC.
- A. Ozcan and M. Ogun, Basic principles and clinical significance of oxidative stress, ed. S. J. T. Gowder, InTech, 2015 Search PubMed.
- S. Sugiyama, K. Kugiyama, M. Aikawa, S. Nakamura, H. Ogawa and P. Libby, Arterioscler., Thromb., Vasc. Biol., 2004, 24, 1309 CrossRef CAS PubMed.
- H. J. Shine and E. E. Mack, J. Org. Chem., 1965, 30, 2130 CrossRef CAS.
- O. A. Krasheninina, D. S. Novopashina, A. A. Lomzov and A. G. Venyaminova, ChemBioChem, 2014, 15, 1939 CrossRef CAS PubMed.
- S. E. GomezMejiba, Z. Zhai, M. S. Gimenez, M. T. Ashby, J. Chilakapati, K. Kitchin, R. P. Mason and D. C. Ramirez, J. Biol. Chem., 2010, 285, 20062 CrossRef CAS PubMed.
- K. Liu, H. Shang, X. Kong, M. Ren, J. Wang, Y. Liu and W. Lin, Biomaterials, 2016, 100, 162 CrossRef CAS PubMed.
- G. Zhang, Y. Sun, X. He, W. Zhang, M. Tian, R. Feng, R. Zhang, X. Li, L. Guo, X. Yu and S. Zhang, Anal. Chem., 2015, 87, 12088 CrossRef CAS PubMed.
- J. Wu, Y. Zou, C. Li, W. Sicking, I. Piantanida, T. Yi and C. Schmuck, J. Am. Chem. Soc., 2012, 134, 1958 CrossRef CAS PubMed.
- L. Yuan, W. Lin, Y. Yang and H. Chen, J. Am. Chem. Soc., 2012, 134, 1200 CrossRef CAS PubMed.
- J. M. Aubry, B. Cazin and F. Duprat, J. Org. Chem., 1989, 54, 726 CrossRef CAS.
Footnote |
| † Electronic supplementary information (ESI) available. See DOI: 10.1039/c8ob02583e |
| This journal is © The Royal Society of Chemistry 2019 |

