
 Open Access Article
 This Open Access Article is licensed under a
 Creative Commons Attribution 3.0 Unported Licence
DANPY (dimethylaminonaphthylpyridinium): an economical and biocompatible fluorophore†
Lewis E.
Johnson
 *a,
Jason S.
Kingsbury‡
*b,
Delwin L.
Elder‡
a,
Rose Ann
Cattolico
*c,
Luke N.
Latimer
a,
William
Hardin
c,
Evelien
De Meulenaere§
d,
Chloe
Deodato
c,
Griet
Depotter
d,
Sowmya
Madabushi
c,
Nicholas W.
Bigelow
a,
Brittany A.
Smolarski
b,
Trevor K.
Hougen
b,
Werner
Kaminsky
a,
Koen
Clays
d and
Bruce H.
Robinson
a
*a,
Jason S.
Kingsbury‡
*b,
Delwin L.
Elder‡
a,
Rose Ann
Cattolico
*c,
Luke N.
Latimer
a,
William
Hardin
c,
Evelien
De Meulenaere§
d,
Chloe
Deodato
c,
Griet
Depotter
d,
Sowmya
Madabushi
c,
Nicholas W.
Bigelow
a,
Brittany A.
Smolarski
b,
Trevor K.
Hougen
b,
Werner
Kaminsky
a,
Koen
Clays
d and
Bruce H.
Robinson
a
aDepartment of Chemistry, University of Washington, Box 351700, Seattle, WA 98195, USA. E-mail: lewisj@uw.edu
bDepartment of Chemistry, Ahmanson Science Center, California Lutheran University, 60 West Olsen Rd., Thousand Oaks, CA 91360, USA. E-mail: jkingsbu@callutheran.edu
cDepartment of Biology, University of Washington, Box 351800, Seattle, WA 98195, USA. E-mail: racat@uw.edu
dDepartment of Chemistry, Katholieke Universiteit Leuven, Leuven, Belgium B-3001
First published on 19th March 2019
Abstract
Dyes with nonlinear optical (NLO) properties enable new imaging techniques and photonic systems. We have developed a dye (DANPY-1) for photonics applications in biological substrates such as nucleic acids; however, the design specification also enables it to be used for visualizing biomolecules. It is a prototype dye demonstrating a water-soluble, NLO-active fluorophore with high photostability, a large Stokes shift, and a favorable toxicity profile. A practical and scalable synthetic route to DANPY salts has been optimized featuring: (1) convergent Pd-catalyzed Suzuki coupling with pyridine 4-boronic acid, (2) site-selective pyridyl N-methylation, and (3) direct recovery of crystalline intermediates without chromatography. We characterize the optical properties, biocompatibility, and biological staining behavior of DANPY-1. In addition to stability and solubility across a range of polar media, the DANPY-1 chromophore shows a first hyperpolarizability similar to common NLO dyes such as Disperse Red 1 and DAST, a large two-photon absorption cross section for its size, substantial affinity to nucleic acids in vitro, an ability to stain a variety of cellular components, and strong sensitivity of its fluorescence properties to its dielectric environment.
Introduction
Fluorescent dyes are one of the principal tools for detection and quantification of molecules of interest in molecular biology, clinical diagnostics, and analytical chemistry. A multitude of such dyes have been developed to facilitate the study of particular biological targets, including membranes, proteins, and nucleic acids. The sensitivity and spatial resolution for fluorescent dyes can be enhanced by methods such as encapsulation or photoswitching,1 chemical transformation to an active form upon interaction with a substrate,2 conjugation with nanoparticles,3,4 interactions with nano-engineered surfaces,5 or nonlinear optical (NLO) techniques. Commonly used NLO applications include second-harmonic generation6–8 (SHG, often referred to as SHIM in the context of imaging/microscopy), which can be performed using dyes that possess a large first hyperpolarizability (β), and two-photon excited fluorescence9–11 (TPEF), which relies on a large second hyperpolarizability (γ). While the structure of dye molecules can be optimized to maximize first or second hyperpolarizability, all molecules exhibit nonzero γ, whereas non-centrosymmetric structures are required for nonzero β.12Development of dyes with large first hyperpolarizability has been heavily driven by photonics due to the capability of these dyes to achieve large electro-optic (EO) constants (r33) and ultrafast response to radio-frequency signals.13,14 While current-generation organic electro-optic (OEO) materials are typically monolithic organic glasses composed of chromophores functionalized with pendant groups to control processability and thermal stability,13,15 OEO materials based on chromophores blended with deoxyribonucleic acids (DNA) have also been examined due to favorable near-infrared optical properties of DNA such as low loss and a tunable refractive index.9,16 The DNA used in these films is often complexed with surfactants such as cetyltrimethylammonium bromide (CTAB) to form a processable, alcohol-soluble, and homogeneous material.9 OEO waveguide modulators have been demonstrated, as have other electronic devices fabricated from DNA-containing materials, such as light-emitting diodes (LEDs) and field-effect transistors (FETs).17 These initial electro-optic studies were usually performed with older-generation, alcohol-soluble dyes such as Disperse Red 1 (DR1, Fig. 1); substantially higher performance would be needed for state-of-the-art device applications.
 | ||
| Fig. 1 Disperse red 1 (DR1, top left) is an older generation dye used in early organic EO devices. Ethidium bromide (bottom left) is a common fluorescent stain for nucleic acids. DAST (top center) is a cationic dye used for organic EO applications that has a large β and forms non-centrosymmetric crystals. DANPY-1 (bottom center) combines features from ethidium bromide and DAST to retain a large β as well as compatibility with biological environments. Isoc (top right) is a neutral EO dye that has also been explored for nucleic acid-related applications. Prodan (lower right) is a neutral membrane dye sharing the same dimethylaminonaphthalene donor as DANPY. | ||
Both SHG activity and EO activity of a molecule are proportional to β, which requires a molecular structure that lacks inversion symmetry.12 The asymmetric structure creates an anharmonic potential when the electrons in the material are perturbed by an applied electric field. Symmetry is typically broken via a push–pull structure (Fig. 1), in which an electron-donating moiety (e.g. dialkylamine or diarylamine) is connected to an electron-accepting moiety (e.g. pyridinium, nitro, or cyano) by a conjugated bridge. Such an arrangement allows electron density to more easily polarize in the donor → acceptor direction than in the acceptor → donor direction. Furthermore, the bulk material itself must be non-centrosymmetric, and this typically requires aligning the dye molecules with electric field poling (rotating dipoles by applying a voltage while the material is heated above its glass transition temperature), except in rare cases such as DAST (4-N,N-dimethylamino-4′-N′-methyl-stilbazolium tosylate; Fig. 1) where individual dye molecules crystallize acentrically to form a ferroelectric material.18
However, one of the challenges in incorporating dyes with high nonlinear optical activity into biological systems such as nucleic acids derives from a choice between divergent design criteria: (1) dyes are typically optimized for high nonlinear optical performance and stability if intended for use in photonics applications, or (2) dyes can be modified for affinity to biological substrates, safety, and fluorescence performance if intended for biological staining. We have used theory-aided design to reduce this gap, producing a dye (DANPY-1) that combines a wide variety of favorable properties into a single molecule accessible through a short and scalable synthesis.
There are two principal strategies that can be followed to accelerate the design process for a biologically compatible, NLO-active chromophore. The first approach is to start with existing NLO-active dyes, screen for water solubility and affinity for targets of interest, and then modify the core structures with pendant groups as needed. This approach has been successful for nucleic acid staining with isophorone derivatives such as Isoc19 (Fig. 1). These dyes are related to a class of ring-locked, aminophenyltetraene-based compounds used for high-performance EO devices, such as the CLD-1 chromophore developed by Zhang, Dalton, and co-workers,20 but have relatively low affinities for their intended targets. A similar attempt at complexation with nucleic acids using other uncharged OEO dyes met with limited success.21 Greater success was achieved for NLO-based imaging of membranes using glyconjugates of isophorone-based dyes.22 The second approach is to start with proven biological stains and screen for those that have NLO activity or could easily have their symmetry broken to produce a NLO response. This approach has been applied to candidates such as ethidium bromide23 and Hoechst 33342.24 We decided upon a hybrid approach, mixing components from NLO-active dyes such as DAST (Fig. 1) and nucleic acid stains such as ethidium bromide and applying design rules developed by Del Castillo et al., which require a single positive charge and at least three aromatic rings.25 Computational screening21 of over 600 dyes chosen via chemical intuition and combinatorics identified a dye26 now known as DANPY-1 (Fig. 1) that was predicted to have substantial hyperpolarizability, reasonable polarity for aqueous environments, and that was easily disconnected by retrosynthetic analysis. The dye is similar to the previously reported membrane dye BNBP,27 but is cationic instead of zwitterionic and has fewer long, hydrophobic alkyl chains. DANPY-1 also shares substantial structural commonality with the membrane stain Prodan28 (Fig. 1) but with a charged methylpyridinium acceptor instead of an uncharged propanone acceptor. Preliminary characterization of DANPY-1 included affinity to DNA,26,29 capability to form thin films in polymer hosts, sum-frequency generation (SFG) response on surfaces, including how the dye affects the SFG response of DNA,30 genotoxicity tests in yeast,31 and exploratory characterization of potential biological applications.32,33 In the present work, we disclose a convergent, three-step synthesis of DANPY-1 from commercially available materials, along with extensive characterization of structural, photophysical, and biocompatibility-related properties in order to demonstrate that the DANPY fluorophore meets the design expectations for both nonlinearity and biocompatibility. We expect these findings to enable development of an entire family of DANPY-derived dyes32 for biological imaging by altering substituents as a way to tune absorbance/fluorescence properties, hyperpolarizability, and hydrophobicity.
Synthesis
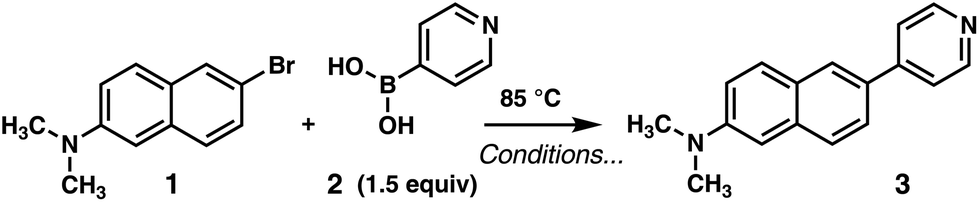
Our preparative studies began with the Suzuki–Miyaura cross coupling of pyridyl boronic acid 2 with 6-bromo-N,N-dimethylnaphthalen-2-amine (1), itself accessible by dimethylation of commercially available 6-bromo-naphthalen-2-amine (see Table 1); synthesis of 1 is detailed in the ESI.† An alternative synthesis in which the Suzuki coupling was performed directly on 6-bromo-2-naphthylamine followed by exhaustive methylation26 proved substantially less efficient due to solubility of the starting material and/or background deactivation of the catalyst. Two challenges to the success of the Suzuki coupling included the electron-rich nature34 of electrophile 1 and the low organic solubility of 2. Since commercial samples of 2 can be decolorized by recrystallization from MeCN–H2O, an opening trial utilized 1![[thin space (1/6-em)]](https://www.rsc.org/images/entities/char_2009.gif) :1 MeCN–EtOH as solvent, affording 28% of 3 (Table 1, entry 1). A base screen revealed that K2CO3 was of similar efficacy to Na2CO3 (Table 1, entry 2). Addition of the boronic acid in two portions improved the yield and lowered reaction time, yet heterogeneity remained a concern (entry 3). A MIDA (N-methyliminodiacetic acid) boronate was tested under conditions optimal for less stable 2-heterocyclic nucleophiles,35 but conversion was incomplete in spite of the yield improving to 71% (entry 4). This could be the result of slower transmetallation for the pyridine 4-boronic ester formed by alcoholysis in situ. In any case, Burke and co-workers’ preference for DMF–alcohol solvent media35 proved enabling, and a control experiment to probe the singular influence of 4:1 DMF–EtOH as solvent diminished reaction time further and allowed direct crystallization of product in 50% yield after workup (entry 5). Final refinements in reaction efficiency were achieved by catalyst/ligand screening. As shown in entry 6, a combination of 3 mol% Pd2(dba)3 and 4 catalyst equiv. of SPhos36,37 gave >98% conversion in 4 h and 95% of 3 after a filtration through silica gel. Loading was further reduced to 1 mol% Pd2(dba)3/4 mol% SPhos on a gram scale with regard to 1; 64% of product 3 was isolated in a single crop as thin needles by crystallization from CHCl3 (entry 7).
:1 MeCN–EtOH as solvent, affording 28% of 3 (Table 1, entry 1). A base screen revealed that K2CO3 was of similar efficacy to Na2CO3 (Table 1, entry 2). Addition of the boronic acid in two portions improved the yield and lowered reaction time, yet heterogeneity remained a concern (entry 3). A MIDA (N-methyliminodiacetic acid) boronate was tested under conditions optimal for less stable 2-heterocyclic nucleophiles,35 but conversion was incomplete in spite of the yield improving to 71% (entry 4). This could be the result of slower transmetallation for the pyridine 4-boronic ester formed by alcoholysis in situ. In any case, Burke and co-workers’ preference for DMF–alcohol solvent media35 proved enabling, and a control experiment to probe the singular influence of 4:1 DMF–EtOH as solvent diminished reaction time further and allowed direct crystallization of product in 50% yield after workup (entry 5). Final refinements in reaction efficiency were achieved by catalyst/ligand screening. As shown in entry 6, a combination of 3 mol% Pd2(dba)3 and 4 catalyst equiv. of SPhos36,37 gave >98% conversion in 4 h and 95% of 3 after a filtration through silica gel. Loading was further reduced to 1 mol% Pd2(dba)3/4 mol% SPhos on a gram scale with regard to 1; 64% of product 3 was isolated in a single crop as thin needles by crystallization from CHCl3 (entry 7).
|
|
|||||
|---|---|---|---|---|---|
| Entry | Catalyst/ligand | Base | Solvent | t (h) | Isolated yield |
| a Reactions performed on 0.2 mmol of 1, 0.05 M, in a sealed vial under N2 atm. b 2 added in two batches. c With 4-pyridinylboronic acid MIDA ester. d 1 g scale. | |||||
| 1 | 3 mol% Pd(PPh3)4; none | Na2CO3 | MeCN/EtOH | 24 | 28% |
| 2 | 3 mol% Pd(PPh3)4; none | K2CO3 | MeCN/EtOH | 24 | 30% |
| 3b | 3 mol% Pd(PPh3)4; none | Na2CO3 | MeCN/EtOH | 12 | 39% |
| 4c | 3 mol% Pd2(dba)3; XPhos | K2CO3 | 4:1 DMF:EtOH |
12 | 71% (6% rsm) |
| 5 | 3 mol% Pd(PPh3)4; none | Na2CO3 | 4:1 DMF:EtOH |
8 | 50% (crystals) |
| 6 | 3 mol% Pd2(dba)3; SPhos | Na2CO3 | 4:1 DMF:EtOH |
4 | 95% |
| 7d | 1 mol% Pd2(dba)3; SPhos | Na2CO3 | 4:1 DMF:EtOH |
4 | 64% (crystals) |
Completing the synthesis required site-selective N-alkylation. We find that gentle warming of a dilute solution of 3 and 1.3 equiv. of MeI in dry acetonitrile affords DANPY-1 as a bright red, microcrystalline solid in high yield following silica gel chromatography and recrystallization (Scheme 1). The full synthesis was scaled up, producing 2.6 g of DANPY-1 to support characterization, photophysical studies, biological staining studies, and toxicity testing. The salt is hygroscopic and best stored under nitrogen or in a desiccator to prevent absorption of water. Experiments suggest that the study of other ion pairs is likely to be straightforward, either using alternative electrophiles such as methyl tosylate or through metathesis with silver(I) salts. For example, the iodide anion can be converted to nitrate in quantitative yield by treatment of DANPY-1 with 1.05 equivalents of silver nitrate (Scheme 1).
 | ||
| Scheme 1 Pyridinium installation and anion exchange. | ||
Tuning of dye properties (e.g. hydrophobicity or strength of electron-donating or electron-accepting groups) can be readily achieved by altering the N-substitution of the naphthylamine prior to the Suzuki coupling32,38 or during quaternization of the pyridine in the final step of the synthesis.32 Other DANPY derivatives will be discussed in upcoming work; the remainder of this article will focus on rigorous characterization and applications of DANPY-1.
Structural characterization
Structural characterization of DANPY-1 was performed by high field 1H and 13C NMR spectroscopy. NMR spectral data are available in the ESI,† along with both thin-film and DFT-computed infrared and Raman spectra (Fig. S1†). Furthermore, since DANPY-1 is a salt, elemental analysis was used to identify the counterion. CHNOX analysis performed by Galbraith laboratories on samples from a multi-gram batch of DANPY-1 identified the composition of the material from duplicate tests as 55.19 ± 0.16% C, 4.94 ± 0.04% H, 6.99 ± 0.05% N, with oxygen near the detection limit of 0.5%. The large non-CHON fraction (33%) is consistent with an iodide counterion (expected: 55.4% C, 4.91% H, 7.18% N, 35.2% I). Corroboration of iodide as the counterion was performed by elemental analysis on a separate batch of DANPY-1 for which the anion had been previously reported29,30 as acetate due to presence of a stoichiometric quantity of co-crystallized acetic acid (see ESI†).DANPY-1 proved difficult to grow X-ray diffraction (XRD)-quality crystals of sufficient size with an iodide counterion. Nonetheless, satisfactory crystals were eventually obtained from a slightly less polar chromatography fraction at the tailing edge of the DANPY-1 peak. This fraction was found to have a triiodide (I3−) counterion. These findings suggest some oxidation of the iodomethane starting material to form molecular iodine, although partial oxidation of the counterion on the silica gel may represent another potential source of this impurity. The crystal structure (CCDC: 1838228†) is shown in Fig. 2; details of crystallographic characterization are reported as ESI.†
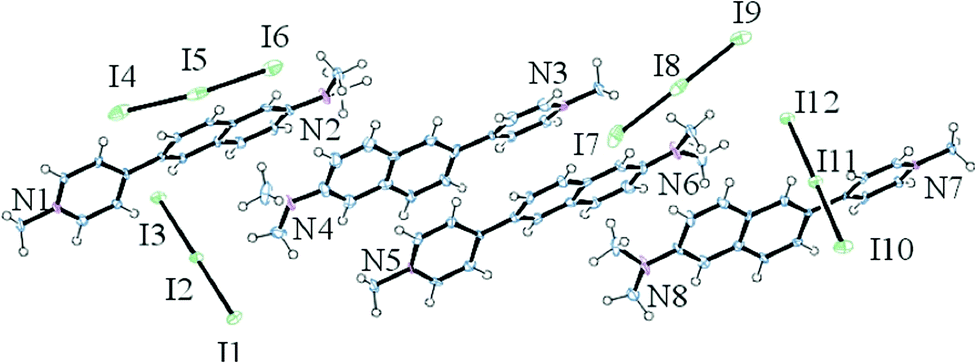 | ||
| Fig. 2 ORTEP structure of DANPY-1 with triiodide (I3−) counterion, with thermal ellipsoids at 50% probability. The space group is P21/n and the cell parameters are a = 28.113(3) Å, b = 13.9070(15) Å, and c = 20.473(16) Å. | ||
The crystallographic data confirms that unlike DAST, DANPY-1 with a triiodide counterion crystallizes centrosymmetrically; i.e. would not be expected to have a bulk SHG response. It is not yet known whether it can be acentrically crystallized with a larger counterion such as tosylate. The crystal structure also indicates that the molecule is slightly distorted from planar, with a naphthyl–pyridyl dihedral angle of 25.9°. The small dihedral angle is consistent with density functional theory (DFT) calculations at the B3LYP/cc-pVTZ level of theory in an implicit methanol solvent (polarizable continuum model, PCM) environment. These calculations yielded a dihedral angle of 20.17° at the equilibrium geometry, consistent with the crystal structure, and a torsional barrier of 25 kJ mol−1 from a relaxed potential energy surface scan of the aryl–aryl dihedral angle (Fig. S2†). The rotamer in which the pyridinium and naphthalene are co-planar is about 5 kJ mol−1 higher in energy than the equilibrium geometry and, therefore, thermally accessible at 300 K. Furthermore, the rigidity of DANPY-1 is enhanced compared to DAST due to the fused naphthalene ring. The larger fused ring system improves compatibility with a planar, aromatic environment such as a nucleic acid helix, increasing the potential for intercalation. Further structural details are provided in the ESI.†
Optical properties in solution
We evaluated linear optical properties of DANPY-1 in water, methanol, dimethylsulfoxide (DMSO), chloroform, and pH 8 0.5× TAE (20 mM Tris, 10 mM acetic acid, 0.5 mM EDTA) buffer. We determined the extinction coefficient of free DANPY-1 in pH 8 TAE buffer at λmax (414 ± 2 nm) to be 16900 ± 20 M−1 cm−1 based on four measurements of a 60 μM solution of DANPY-1 prepared from 4.94 mg of dye which had been vacuum-dried and weighed under dry nitrogen. UV/Visible absorbance was measured in various solvents with 15 μM concentrations; spectra are shown in Fig. 3A. The dye was readily soluble at this concentration in all solvents tested. Fluorescence behavior of DANPY-1 was also characterized using the same set of 15 μM solutions used for the absorbance measurements; spectra are shown in Fig. 3B.
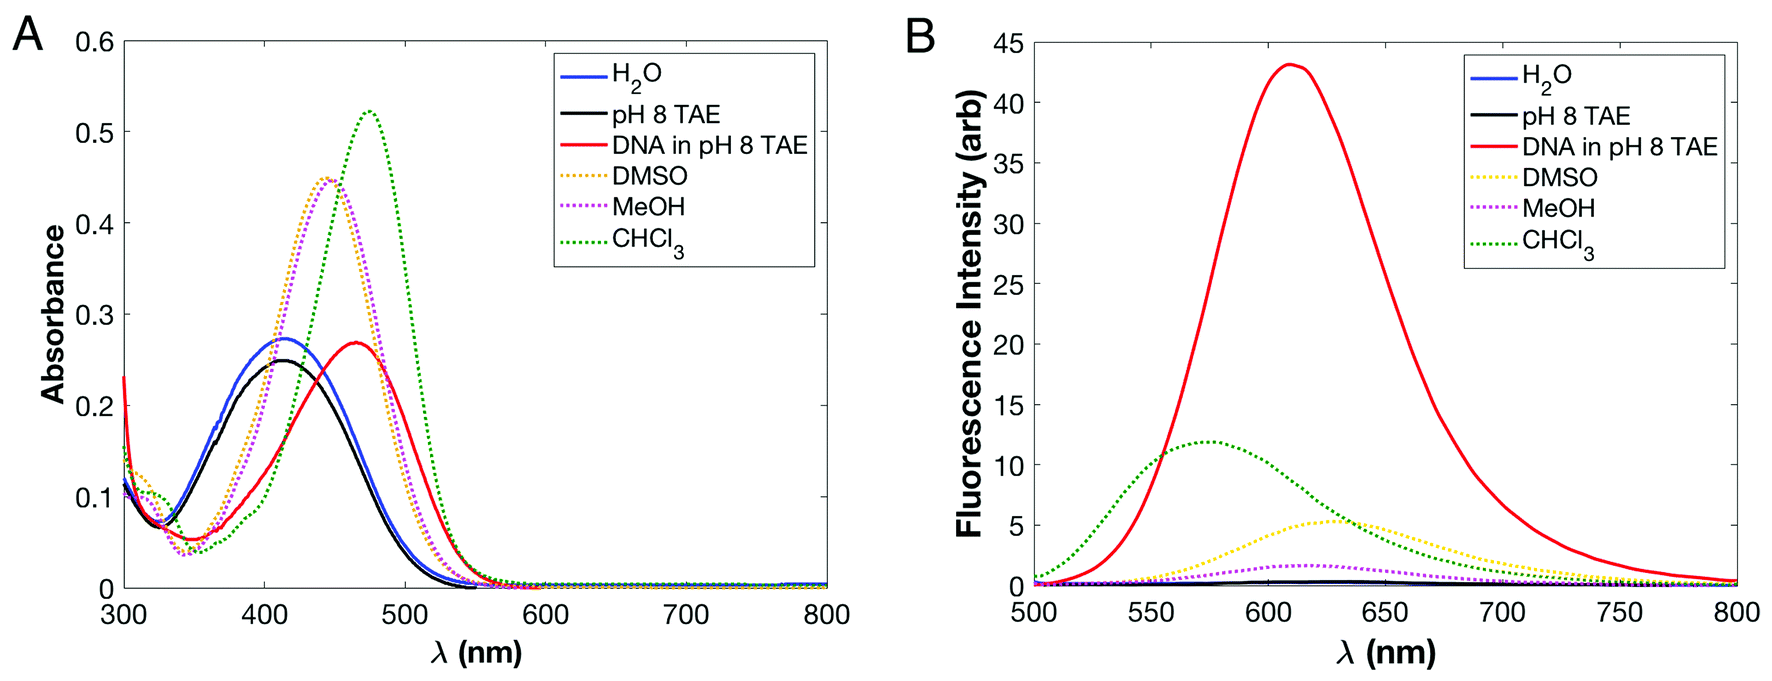 | ||
| Fig. 3 Absorbance (A) and fluorescence at 450 nm excitation (B) of DANPY-1 as a function of solvent. The fluorescence intensity in water or pure TAE buffer is very low and is shown on a logarithmic scale in Fig. S3.† | ||
The dominant absorbance peak was determined to be an intramolecular charge transfer (ICT) excitation based on DFT calculations; details are discussed as ESI.† The strength of the principal charge transfer absorbance band in DANPY-1 increases substantially as solvent polarity is decreased; increases in fluorescence intensity were even more dramatic. Furthermore, we observed a large hypsochromic shift in absorbance, with the absorbance maximum moving 61 nm to the blue on going from chloroform (least polar) to water (most polar). By contrast, the fluorescence maximum was observed to undergo a large bathochromic shift, moving 44 nm to the red between chloroform and water. Absorbance and fluorescence data are detailed in Table 2. The nearly symmetric solvatochromic shift is consistent with observations collected on other pyridinium-based chromophores, including BNBP,39 and is indicative of reversal of the sign of the molecular dipole upon excitation, which was confirmed by DFT calculations (Table S3†). Coupled with the large Stokes shift (209 nm, or 8170 cm−1, in H2O), the strong sensitivity of DANPY-1's absorbance and fluorescence maxima to different dielectric environments shows promise for wavelength-dependent sensing of substrates with different polarities. While the magnitude and dielectric sensitivity of DANPY's Stokes shift are similar to that of Prodan, instead of undergoing a small bathochromic shift in absorbance and a large bathochromic shift in fluorescence,40 the signs of the solvatochromic shifts are opposed due to intramolecular charge transfer reducing the dipole moment of the first excited state of DANPY-1. In contrast, charge transfer in Prodan involves a transition from a neutral but polar ground state to an excited state with even greater charge separation.41
| Solvent | Abs. max (nm) | Rel. abs vs. DI H2O | ε max (M−1 cm−1) | Fluor. max (nm) | Stokes shift (cm−1) | Rel. fluor vs. DI H2O |
|---|---|---|---|---|---|---|
| DI H2O | 412 | 1 | 18600 |
621 | 8170 | 1 |
| 0.5× TAE (pH 8) | 414 | 0.91 | 16900 |
625 | 8160 | 1.2 |
| TAE/DNA | 465 | 0.98 | 18200 |
609 | 5090 | 190 |
| DMSO | 442 | 1.64 | 30500 |
627 | 6680 | 23 |
| Methanol | 448 | 1.64 | 30500 |
618 | 6140 | 7.3 |
| Chloroform | 473 | 1.91 | 35500 |
577 | 3810 | 53 |
In addition to characterizing solvatochromic response, we also examined the effect of adding an excess of DNA in 0.5× pH 8 TAE buffer, such that the final solution was 300 μM in DNA base pairs (salmon sperm DNA). The fluorescence intensity increased dramatically when DNA was added, with Imax,TAE+DNA/Imax,TAE = 164 (190× vs. H2O). In order to correct for changes in the extinction coefficient upon binding, we also calculated the effective fluorescence efficiency,42
 | (1) |
To further explore the large difference in fluorescence of DANPY-1 in different environments, we measured absolute fluorescence quantum yields (ϕ) via the integrating sphere method43 and fluorescence lifetimes (τf) via time-correlated single-photon counting.44 Fluorescence lifetimes were fit to a double-exponential model using DecayFit;45a1 is the weight on the first of the two exponentials. Experimental details are further discussed as ESI.† To evaluate suitability for TPEF-based techniques, we measured two-photon absorption (TPA) cross-sections (δTPA) by the TPEF method,6,46 using a Ti:sapphire laser with a fundamental wavelength of 800 nm and 129 μM aqueous fluorescein at pH 11 as a reference, for which δTPA has been previously measured47 to be 36 GM. TPA values are typically reported in Goppert–Mayer units; 1 GM = 10−50 cm4 s per photon. Results are shown in Table 3, and methodology is discussed as ESI;† uncertainty in δTPA is estimated at 25% based on measurements at three laser power levels.
| Solvent | τ 1 (ns) | a 1 | τ 2 (ns) | Quantum yield (ϕ) | δ TPA (GM) |
|---|---|---|---|---|---|
| a TPEF signal was substantially red-shifted from one-photon fluorescence peak; see ESI. b Smaller than instrument resolution; not significant and included only for completeness of fit. c No TPEF signal was detected. | |||||
| Chloroform | 0.142 | 0.994 | 3.34 | 0.068 | 71 |
| DMSO | 0.222 | 0.997 | 3.31 | 0.045 | 61 |
| Methanol | 0.057 | 0.999 | 4.57 | 0.010 | —a |
| pH 8 TAE | 0.004b | 0.999 | 4.45 | 0.005 | —c |
| TAE w/DNA | 2.72 | 0.509 | 0.709 | 0.174 | 30 |
DANPY-1 has a minuscule (≤0.01) fluorescence quantum yield in polar, protic solvents such as methanol or water. However, its quantum yield when bound to DNA is comparable to that of ethidium bromide (0.15) and propidium iodide (0.16).48,49 While substantially lower than Hoechst 33258 (0.42)49 and SYBR variants49 SYBR Gold (0.6) and SYBR Green (0.8), which are often used for nucleic acid visualization, the large Q and extinction coefficient (3× that of ethidium bromide,50 where ε = 5450 M−1 cm−1 at λmax = 480 nm) suggest that DANPY-1 could be competitive for the gel electrophoresis of nucleic acids or other cellular components with less polar media than water, particularly due to its relative synthetic ease and low toxicity.
Quantum yields in polar aprotic solvents are low but are larger than in water or methanol, suggesting that hydrogen bonding may have a substantial role in quenching fluorescence from DANPY-1. A major factor behind the low quantum yield of DANPY-1 is likely non-radiative relaxation due to rotation of the aryl–aryl bond between the donor and acceptor regions of the dye.51,52 The effects of torsional flexibility were examined via a viscosity-dependent fluorescence study using methanol:glycerol mixtures; integrated fluorescence intensity at constant concentration increased by over a factor of 3 from methanol (low viscosity) to 1:2 methanol:glycerol (high viscosity), strongly supporting the role of aryl–aryl rotation in non-radiative relaxation.53 Similar effects have been observed in BODIPY dyes with flexible aryl–aryl bonds.54 The quantum yield of DANPY-1 in chloroform is also an order of magnitude lower than that observed from BNBP,27 which is substituted with butyl chains at each nitrogen; the side chains may produce drag in a dense solvent environment that inhibits aryl–aryl rotation. However, DANPY-1 exhibits a similar dependence on solvent dielectric constant to BNBP, in which the Stokes shift increases with dielectric constant and the quantum yield decreases with dielectric constant.
DANPY-1 in solution exhibits short (∼100 ps) fluorescence lifetimes, consistent with other dyes with flexible aryl–aryl bonds.52 The fluorescence lifetime of DANPY-1 exhibits only a small variation with solvent, unlike BNBP,27 suggesting that the interaction of the side chains with the solvent environment has a large effect on the fluorescence lifetime. While over 99% of the fluorescence intensity is associated with this rapid relaxation, fitting of the fluorescence decay curves (Fig. S4†) is substantially improved by including a small fraction of a second exponential with a longer (3–5 ns) lifetime. More substantial double-exponential behavior has been observed for Prodan in polar solvents.55 DANPY-1 exhibited substantially longer fluorescence lifetimes when bound to DNA, and substantial double-exponential behavior (a1 ∼0.5), which may suggest that the dye binds within multiple environments in the DNA. The increase in fluorescence lifetime is consistent with that observed for ethidium bromide.56
DANPY-1 has a substantial TPA cross section (Table 3) for its size, approximately twice that of aqueous fluorescein when measured in chloroform or DMSO, or comparable to aqueous fluorescein when it is bound to DNA. The TPA cross sections of DANPY-1 in each environment studied are substantially larger than the 19–20 GM observed for similarly-sized Prodan.57 Larger organic molecules can have much higher TPA cross sections, including several carbazole derivatives engineered for combined SHG/TPEF imaging,6 as can organometallic complexes that incorporate large, conjugated ligands with values on the order of 1000 GM.58 In sum, the small size and simplicity, synthetic approachability, and high photostability of DANPY-1 makes it a compelling candidate for TPEF.
The photochemical stability of DANPY-1 was assessed by two experiments: (1) a 91-day photostability study in which the maximum absorbance of DANPY-1 solutions (ambient light at room temperature, dark at room temperature, dark at +5 °C, and dark at −20 °C (one solution per condition) was measured by UV/Visible spectroscopy; and (2) chemical stability toward several common laboratory reagents was monitored over a period of two weeks. Photostability was excellent, with samples stored in the dark (ambient or +5 °C) experiencing a ∼3% decrease in the absorbance intensity of λmax after 91 days and the benchtop (ambient light) sample experiencing a 7.3% decrease in absorbance intensity. Additional photostability and chemical stability results are compiled and included as ESI (Fig. S6†).
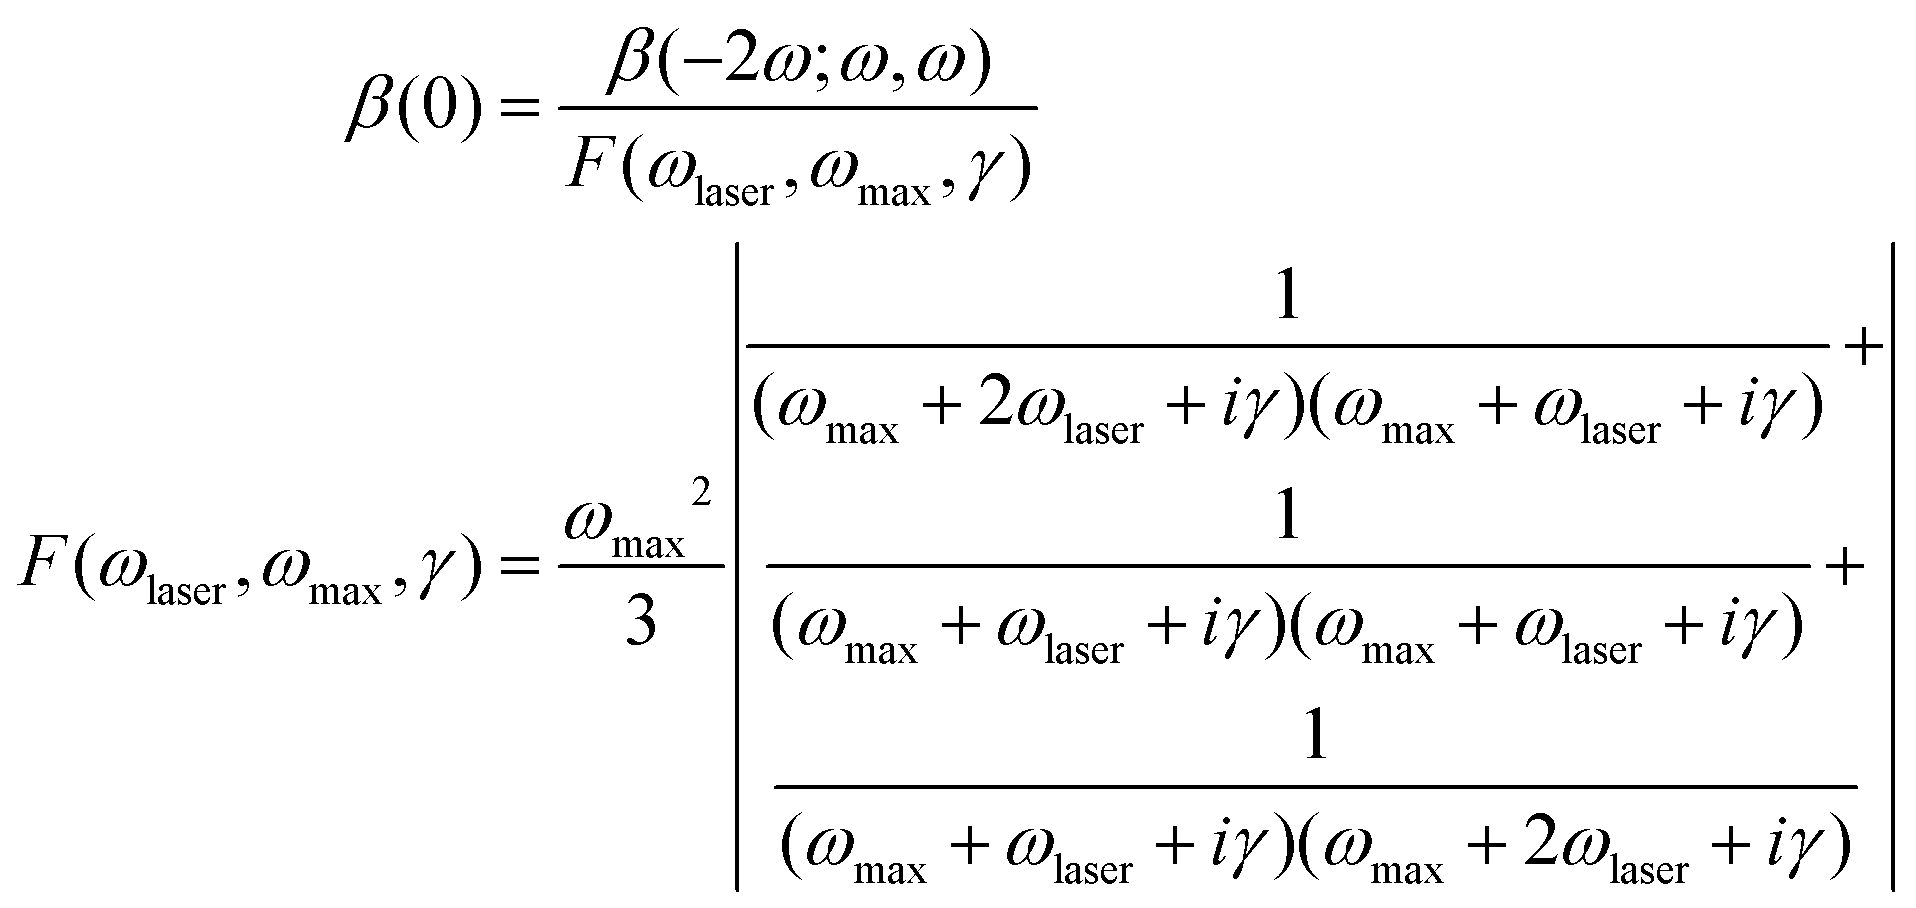
The hyperpolarizability of DANPY-1 was determined in both dichloromethane (DCM) and methanol by Hyper-Rayleigh scattering59 (HRS). HRS experiments were performed using a Ti:sapphire laser with a fundamental wavelength of 800 nm and referenced against Crystal Violet.60 Signal contamination from two-photon fluorescence was suppressed using high-frequency demodulation.61 The hyperpolarizability at 800 nm was extrapolated to the static limit using the damped two-level model,62–64
 | (2) |
Hyperpolarizabilities are compiled in Table 4, along with DFT computed values determined using analytic differentiation66 at the M062X/6-31+G(d) level of theory with a PCM solvent; this model has proven highly applicable in comparing hyperpolarizabilities among high-performance chromophores.67 Calculations were run using Gaussian 09.68 Unlike HRS, DFT calculations are capable of determining the sign of hyperpolarizability for a chromophore. The experimental HRS values for DANPY-1 were previously reported69 based on acetate as a counterion but have been corrected for the now definitive iodide anion and for the purity of the solution.
| Dye | Solvent | λ laser (nm) | λ max (nm) | |βzzz(λ)| (exp) | |βzzz(0)| (TLM) | β zzz (0) (DFT) |
|---|---|---|---|---|---|---|
| a Identical cation to DAST; different counterion. b HRS referenced to chloroform solvent assuming βHRS CHCl3 of 0.15 × 10⁻³⁰ esu. c Electric field-induced second harmonic generation (EFISH) measurement, uncertainty not reported by authors. | ||||||
| DANPY-1 | DCM | 800 (HRS) | 484 | 461 ± 4 | 138 ± 1 | −155 |
| DANPY-1 | Methanol | 800 (HRS) | 448 | 358 ± 5 | 66 ± 1 | −151 |
| DAST:PF6− | MeCN | 800 (HRS)70 | 470 | 440 ± 10a | 112 ± 3 | −255 |
| DR1 | CHCl3 | 780 (HRS)71 | 478 | 468 ± 30b | 150 ± 10 | 153 |
| Isoc | CHCl3 | 1907 (EFISH)72 | 496 | 242c | 166 | 160 |
DANPY-1 exhibits comparable hyperpolarizability to DR1, DAST, and isophorone derivative Isoc,19 indicating that substantial NLO activity is retained despite replacing the conjugated bridge with an aryl–aryl linkage. Its hyperpolarizability is also competitive with carbazole dyes, and given its small π electron count (16), is near the ‘apparent limit’ of hyperpolarizability in organic molecules,73,74 indicative of very efficient nonlinear optical activity. A potential explanation for the high efficiency based on the two-state model62 is the large dipole change between the ground and first excited states (Table S3†). The experimentally measured hyperpolarizability of DANPY-1 is more sensitive to the solvent environment than that predicted by DFT calculations. Some discrepancies between the experimental and DFT results can be attributed to the DFT functional itself,67 application of the two-level model for frequency extrapolation, or from limitations of the PCM model versus an actual solvent.75 Interestingly, the trend between DCM and methanol indicates that hyperpolarizability is substantially suppressed by more polar environments. The decrease in hyperpolarizability with increasing solvent polarity contrasts with the behavior exhibited by neutral chromophores75 and is consistent with the hypsochromic shift in absorbance. Collectively, these results imply that DANPY-1 will exhibit a stronger SFG, SHG, or EO response if ordered in a less polar environment.
Nucleic acid binding
To characterize the in vitro interactions between DANPY-1 and DNA in solution, we performed binding titrations by absorption spectroscopy and electronic circular dichroism (CD) spectroscopy (Jasco J-720), using salmon sperm DNA as a substrate. As these experiments used isolated materials, they only provide evidence of the magnitude of binding affinity towards the substrate tested and do not confer any information about possible interference from other substrates in a living cell. Spectroscopy data were analyzed using a standard macromolecular identical and independent site binding model,76 in which the binding is represented as a reversible reaction between a ligand (L, the dye) and binding sites on a macromolecule (N, the DNA) to form a complex (LN) with equilibrium constant | (3) |
At a wavelength where the bound and unbound dye are the only significant absorbing species, the equilibrium constant can be determined by titrating the macromolecule into a solution of the dye,50,77 with the fraction of dye bound (fb) related to the absorbance as
 | (4) |
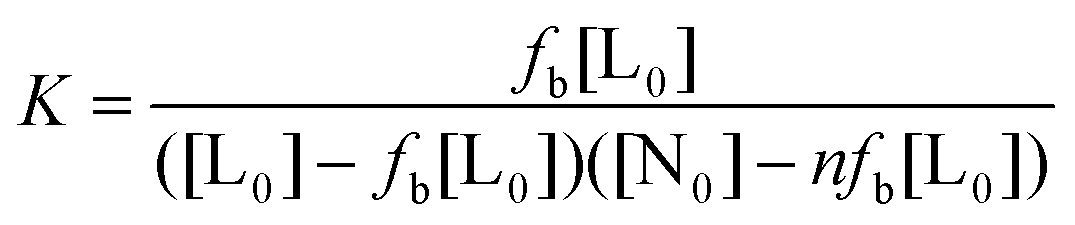 | (5) |
Binding titrations were performed using fresh solutions of DANPY-1 and salmon sperm DNA in either pH 7.2 1× TE buffer (10 mM Tris, 1 mM EDTA) or pH 8 0.5× TAE buffer. These conditions were chosen to represent cytoplasm (pH 7.2) and typical gel electrophoresis buffers (pH 8). Solutions were mixed on a roller to ensure homogeneity and allowed to stand overnight before use. Titration curves are shown in Fig. 4, along with the UV/Visible spectra from the pH 8 titration; experimental details are included as ESI.†
 | ||
| Fig. 4 (A) Photometric titrations of DANPY-1 with salmon sperm DNA. Blue circles – titration of 2.5 mL of 49 μM DANPY-1 in pH 7.2 TE buffer with 30 μL aliquots of 1.52 mM DNA. Red squares – titration of 2.5 mL of 40 μM DANPY-1 in pH 7.2 TE buffer with 30 μL aliquots of 1.52 mM DNA. Black diamonds – titration of 2.5 mL of 51 μM DANPY-1 in 0.5× pH 8.0 TE buffer with 30 μL aliquots of 1.71 mM DNA. DNA solutions were in the same buffer and at the same pH as the corresponding dye solutions. (B) UV/Visible spectra from pH 8 titration after correcting for dilution, showing red-shift of DANPY-1 absorbance maximum upon interaction with DNA. | ||
Binding titrations were also run with ethidium bromide as a positive control; results are given in Table 5 with ethidium bromide titration curves included as ESI (Fig. S7†). RNA binding was also observed in preliminary experiments (ESI, Fig. S8†), but insufficient data was obtained to calculate a reliable binding constant.
| Dye | K (M−1, pH 7.2 TE) | n (pH 7.2) | K (M−1, pH 8 TAE) | n (pH 8 TAE) |
|---|---|---|---|---|
| DANPY-1 | 21900 ± 3600 |
1.79 ± 0.03 | 10900 ± 300 |
2.34 ± 0.11 |
| Ethidium bromide | 19600 ± 900 |
1.74 ± 0.05 | 22500 ± 1300 |
1.49 ± 0.04 |
At pH 7.2, DANPY-1 has a DNA affinity comparable to ethidium bromide, and both dyes exhibit a binding stoichiometry with n ∼2, suggesting that DANPY-1 may bind by intercalation as is known for ethidium bromide at this pH. The affinity of DANPY-1 to DNA was also similar to that observed78 between the iodide salt of DAST and salmon DNA in water (22000 M−1). However, the fluorescence amplification of bound versus unbound dye in water was over an order of magnitude larger for DANPY-1 than DAST (190× vs. 9.5×), which may implicate different binding modes. The equilibrium constant for DANPY-1 is also substantially larger than those observed for uncharged, isophorone-based dyes explored for DNA-based biophotonics, for which the best compound (Isoc) has an affinity of 6890 M−1.19 By contrast, the high-performing minor groove binder Hoechst 33342 has an affinity to poly(dAT) of 3.23 × 10⁷ ± 1.25 × 10⁷ M−1 in 10 mM cacodylate buffer at pH 6.8,79 much higher than either ethidium bromide or DANPY-1 at pH 7.2. The binding affinity of DANPY-1 decreased to about half that of ethidium bromide at pH 8 and n increased, indicating a potential transition to a different binding mode in which each binding site involves more base pairs. On the other hand, n decreased with increasing pH for ethidium bromide, suggesting a greater contribution from simple electrostatic attraction to the exterior of the double helix.77 The DANPY-1 pH 8 binding curve also shows some sigmoidal character, potentially indicative of multiple binding modes between the dye and DNA under increasingly basic conditions.
Structural information concerning the binding mode of DANPY-1 was further explored by CD spectroscopy in pH 7.2 TE buffer, comparing against ethidium bromide and focusing on the ultraviolet region in which DNA exhibits substantial CD. A higher concentration of ethidium bromide was used such that the absorbance of the two samples was similar. Results are shown in Fig. 5.
 | ||
| Fig. 5 Electronic circular dichroism spectra for 198 μM DNA in pH 7.2 TE buffer (black line), 274 μM DNA + 44.4 μM DANPY-1in pH 7.2 TE buffer (red line), and 292 μM DNA + 103 μM ethidium bromide in pH 7.2 TE buffer. DANPY-1 induces a change in DNA that decreases the magnitude of circular dichroism at 245 nm with no other observed effects, unlike ethidium bromide, which also alters the 275 nm DNA peak and forms two new peaks (295 nm and 310 nm). | ||
DANPY-1 causes a decrease in the magnitude of the observed CD of the DNA at 245 nm, similar to that previously observed for isophorone derivatives Isoa and Isoc and potentially indicative of a partial B-DNA to A-DNA transition.19 Combined with the strong fluorescence enhancement and binding stoichiometry, this shift could suggest an intercalation binding mode and a similar mechanism for fluorescence enhancement to ethidium bromide. However, unlike DANPY-1, ethidium bromide causes large-scale disruption of the DNA helix, with shifts in CD observed across the entire 225 nm to 375 nm wavelength range in a manner consistent with prior literature,50 including the formation of dye-associated peaks.80 The smaller disruption to the structure of the DNA helix upon complexation with DANPY-1 suggests that DANPY-1 is less likely to exhibit genotoxic effects than ethidium bromide, a conclusion further supported by results of an Ames Test (see Toxicity section).
Gel electrophoresis
In addition to solution-phase measurements of binding affinity and fluorescence, which were conducted at high DNA concentrations (e.g., 30 to 50 μM), gel electrophoresis was used to determine the sensitivity of DANPY-1 to micro-quantities of small sized DNA sequences. Commercially available DNA reference ladders containing sequences of known size (from 100 to 15000 bp) were electrophoretically separated on 0.8% agarose gels. DNA-dye complexes were formed using three complementary techniques: (1) adding DANPY-1 to the agarose gel while the agarose was in molten pre-pour phase (0.96 μg mL−1); (2) adding DANPY-1 to the agarose gel running buffer (0.32 μg mL−1) or (3) post-staining gels with DANPY-1 solution (1.92 μg mL−1). All methods of dye addition gave an identical response (see ESI†). The resulting DANPY-1 stained DNA fragments were visualized using blue light (400–500 nm range). As shown in Fig. 6, DANPY-1 complexed with DNA sequences within each ladder array, regardless of nucleic acid fragment size. Total DNA load per lane in Fig. 6 was 2.0 μg.
 | ||
| Fig. 6 Visualization of oligomeric DNA using DANPY-1 dye. Commercially acquired DNA ladders having sequences of different size distributions were loaded onto 0.8% agarose gels. When DNA was electrophoretically separated, then post-stained and illuminated with blue light, excellent visualization of: (A) 10 kb, (B) 12 kb and (C) 1.5 kb components was observed. | ||
Toxicity
Third party testing of DANPY-1 genotoxicity was accomplished by Nelson Laboratories (Salt Lake City, UT), with some assays performed in partnership with Sinclair Research Center (Auxvasse, MO). Complete toxicity results and detailed methodologies used in their genesis are available in the “Final reports” provided by these laboratories (see ESI†). Four total tests were run – two evaluating effects on mammals and two on cultured cells.The ISO/USP Intracutaneous Reactivity Irritation Test (Test 1) measured the impact of DANPY-1 when applied to the skin of Albino New Zealand White rabbits. The ISO/USP Medical Device Systemic Toxicity Test (Test 2) monitored the effects of DANPY-1 on Albino CD-1 mouse health before, immediately after, and for three days following intravenous dye injection into the mice (e.g., clinical observations were made and body weight was determined). Both the ISO/USP Intracutaneous Reactivity Irritation Test and the ISO/USP Medical Device Systemic Toxicity Test animals showed no differences in measured parameters after DANPY-1 dye administration relative to those observed for the negative controls.
DANPY-1 toxicity data generated from unicellular assays was more ambiguous. The Ames assay (Test 3) screens for potential mutagenic effects on bacteria. In this test, five histidine-dependent strains of Salmonella typhimurium (TA97a, TA98, TA100, TA1535, and TA102) were exposed to various concentrations of DANPY-1 dye. The treated bacterial cultures were then monitored for successful mutagenic reversion (e.g., the loss of autotrophic dependence on exogenous histidine addition to the growth medium). No significant differences from the negative control were observed at the concentrations of DANPY-1 tested. However, the Minimal Essential Media Elution test (Test 4) that monitors cytotoxicity by examining mouse fibroblast L929 cellular morphology (e.g., the rounding of the cells to their complete lysis) gave indication that DANPY-1 could potentially have a negative impact on cell function. The buffer control for this assay showed a mild impact, and the highest concentration of dye tested (212 μM) exhibited moderate morphological cytotoxicity.
Observations concerning the impact of DANPY-1 on cultured eukaryotic cells were extended by monitoring the growth of the unicellular alga Chrysochromulina tobinii (Haptophyta) in the presence of the dye. Cells were exposed to different concentrations of DANPY-1 (0 to 18 μM). Flow cytometric assessment showed that initially (time 0), the percentage of stained cells observed in a culture directly correlated to the amount of dye added (e.g., at 7.0 μM concentration, almost all cells were labeled; Fig. 7A insert). Subsequent total cell counts suggests that robust cell division continued to occur in the presence of the dye for almost all cultures, except the culture having the highest DANPY-1 addition (Fig. 7A). A closer analysis of stained versus unstained cells revealed that at lower dye concentrations (e.g., 5.0 μM), unstained cells dominated as the culture density increased over time (Fig. 7B). In contrast, at more elevated dye treatments (e.g., 18 μM), although nearly 100% of the cells initially stain, cells apparently failed to divide and culture density decreased (Chrysochromulina cells are limited solely by a plasma membrane and most likely lyse). Interestingly, after approximately one week of culture, the 18 μM DANPY-1 treated culture finally increased in cell number. Few cells in this newly generated population were stained (Fig. 7C). Whether the DANPY-1 dye was: (1) degraded by or interacts with a component of the growth medium (the alga extrudes a broad range of organic molecules into the minimal fresh water medium in which it is grown),81 (2) was metabolized by the alga, or (3) a dye-refractile sub-population of Chrysochromulina tobinii cells was generated (see Lakeman et al.82 for discussion) requires further study.
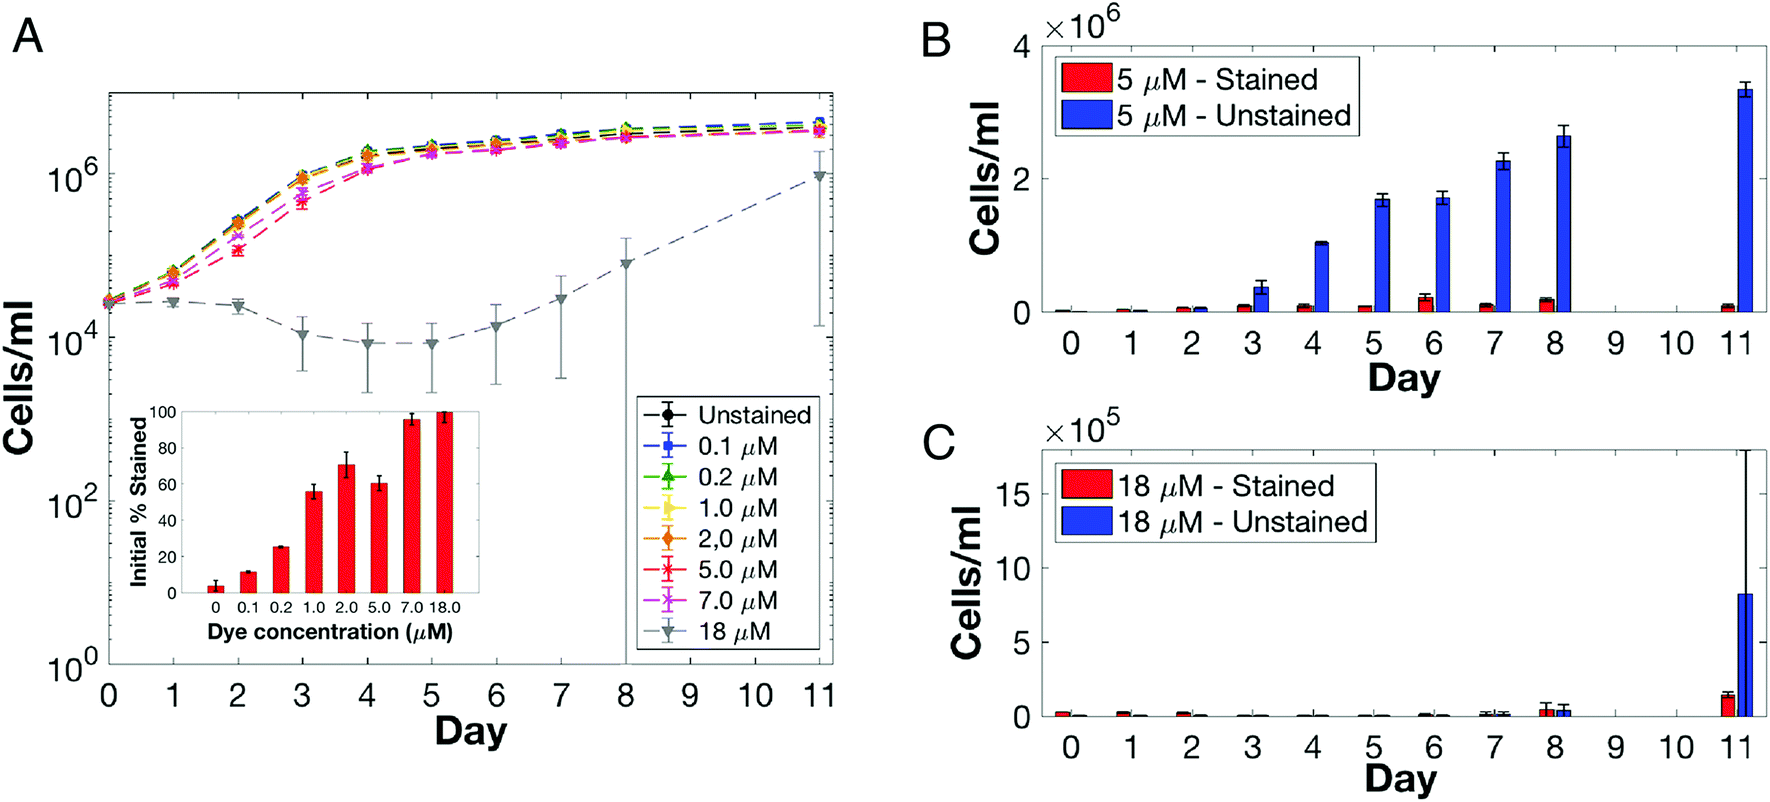 | ||
| Fig. 7 Impact of DANPY-1 on the survival of Chrysochromulina tobinii (Haptophyta). Growth curves for entire population when exposed to different concentrations of DANPY-1 (fraction of cells stained at 0 time is shown in the inset) (A); increase in cells within the culture populations that were treated with either (B) 5.0 μM or (C) 18 μM DANPY-1; stained (red) and unstained (blue) cells within the culture. Note cell concentration difference between B and C. | ||
Biological staining
While in vitro binding studies demonstrated affinity of DANPY-1 to nucleic acids (e.g., Fig. 4), these studies did not provide insight into the interaction of the dye with additional components of living cells. To generate an overview of in vivo DANPY-1 staining potential, a selection of eukaryotic organisms were exposed to the dye, and cellular responses were examined using confocal microscopy. Organisms were chosen for their broad taxonomic representation and their unique cellular structures. Microscopy experiments included both confocal fluorescence microscopy and nonlinear (TPEF and SHG) confocal microscopy.Confocal linear fluorescence microscopy
Giardia lamblia (Sarcomastigothphora) is a eukaryote that parasitizes the small intestine of vertebrates. This protist cell is “reduced” – lacking typical intracellular components such as mitochondria and peroxisomes.83 DANPY-1 appeared to localize perinuclear and also to network throughout the cytoplasm of this organism (Fig. 8A).84–86 Dinoflagellates (Dinoflagellata) are unique protists in that their chromosomes, which lack typical histones, are permanently condensed. Both dinoflagellate representatives chosen for this study have a complex cell covering (the amphiesma) that is sandwiched between an exterior outermost membrane and the plasma membrane of the cell.87 This structure is comprised of a series of sacks that encase an undefined array of organic materials that are taxonomically determined.88,89 When Prorocentrum micans was DANPY-1 stained, not only were large chromosomes readily visible, but additional cellular target sites were also seen, including a sharp delineation of the amphiesma and apical spine (Fig. 8B). Prorocentrum minimum staining showed a more subtle intracellular DANPY-1 distribution, suggesting endoplasmic reticulum (ER) targeting and vesicular dye affinities (Fig. 8C). Staining of the cell covering was minimum. Chromosomes were not visible – most likely since Prorocentrum minimum has ∼7.0 pg DNA per cell while a Prorocentrum micans cell contains ∼217 pg DNA per cell.90 When the yeast Saccharomyces cerevisiae (Ascomycota) was exposed to DANPY-1, a fine labyrinth of labeling was observed throughout the cell, suggesting ER localization (see West et al.91 for discussion of ER distribution in this organism). The plasma membrane also seemed to be targeted (Fig. 8D). | ||
| Fig. 8 Localization of DANPY-1 in eukaryotic cells. (A) Giardia lamblia stained with 0.5 μM DANPY-1; (B) Prorocentrum micans (15 μM); (C) Prorocentrum minimum (1 μM); (D) Saccharomyces cerevisiae (10 μM); (E) Phaeodactylum tricornuta (Hoechst staining; 0.5 μM DANPY-1 did not enter cell). The scale is identical in panels A–D. | ||
Notably, all of our studies were performed without the use of a dye carrier molecule (e.g., DMSO), which might be required for effective staining of some cell types. For example, the unicellular diatom Phaeodactylum tricornutum (Heterokonta) did not allow DANPY-1 penetration after 35 minutes of treatment, even though the vital dye Hoechst readily stained the nuclei of this cell (Fig. 8E). The cell wall (or theca) of this organism is comprised mainly of a sulphated glucuronomannan.92
In summary, it appears that DANPY-1 cellular staining is not limited to one cellular component, but affinity of this dye may be determined by both the concentration and molecular composition of the target site. Following the broad imaging survey presented above, future cytological studies can now focus on co-localization of DANPY-1 with commercially available organelle-specific markers.
Confocal nonlinear microscopy
Preliminary evaluation of DANPY-1 as a dye for nonlinear microscopy techniques was conducted using HeLa cells in Dulbecco's Modified Eagle Medium (DMEM) and a Zeiss inverted confocal microscope with 810 nm excitation and linear polarization of the incident laser. Cells were examined at 10° polarization increments; images are shown for both horizontal and vertical polarization orientations. In contrast with the linear confocal experiments, DMSO was used as a solubility/penetration aid, consistent with prior experiments on carbazole derivatives.6 Penetration of the dye into the cells and emergence of the SHG signal was followed in real time. Total experiment time was 50–60 min, with 7 μM dye added at minute 1 of imaging.TPEF (Fig. 9, horizontal polarization in panel A and vertical polarization in panel B) appeared rapidly, with signal observed from inside the cells within the first minute after addition, stabilizing quickly in the endoplasmic reticulum, mitochondria, and some signal was observed in the denser parts of the nucleus. TPEF in these regions remained stable for the next 30–35 minutes, during which time no SHG signal was detectable.
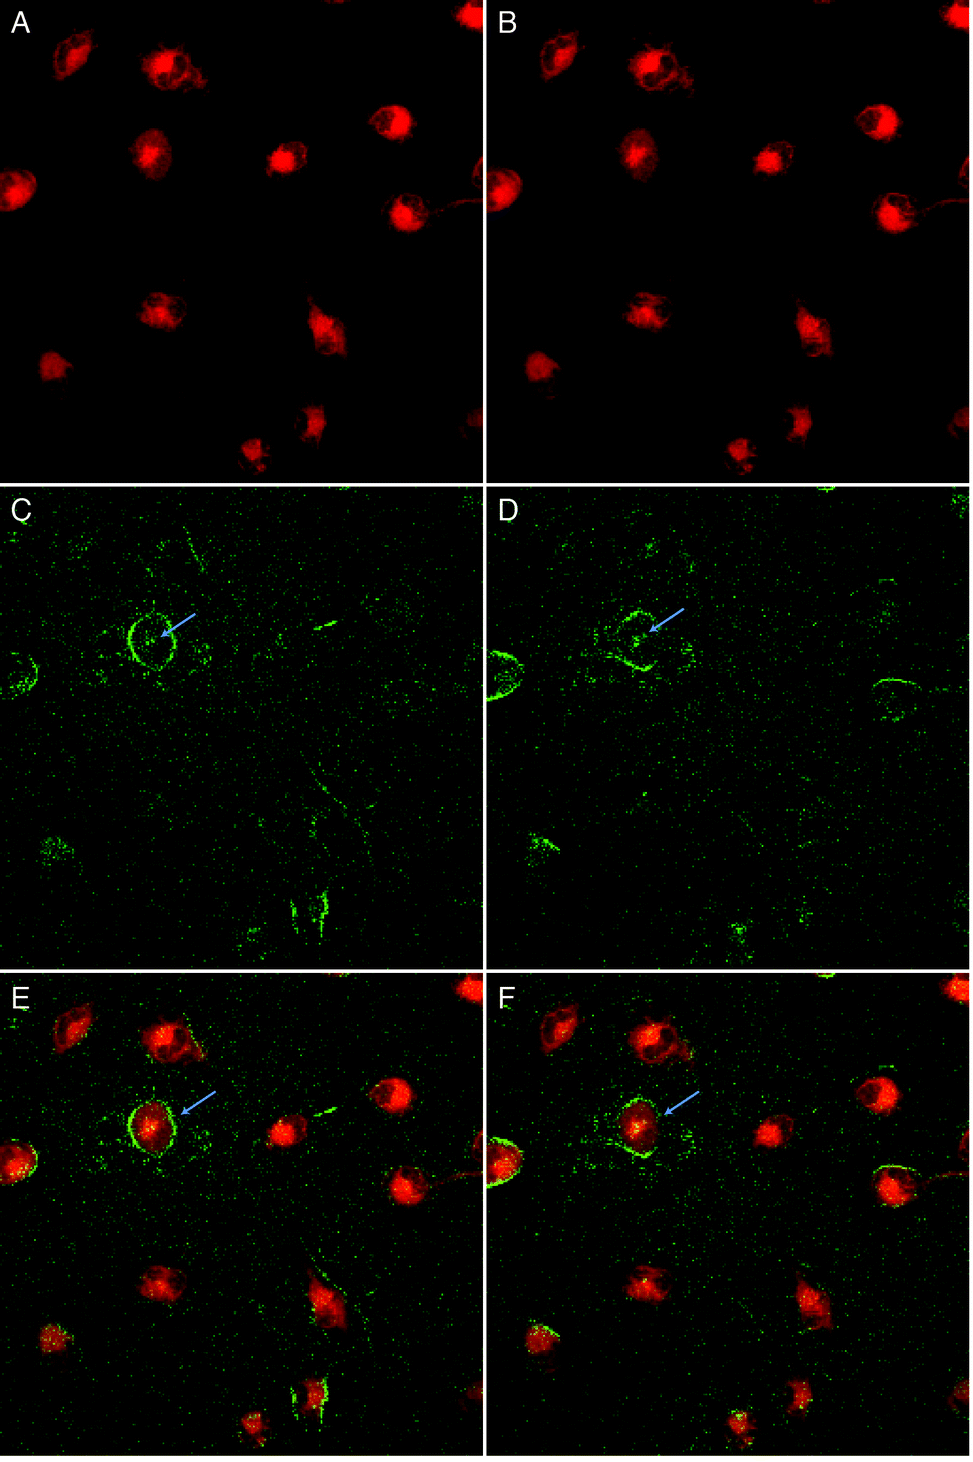 | ||
| Fig. 9 TPEF (A, B, red), SHG (B, C, green) and combined TPEF/SHG (E, F) micrographs of HeLa cells stained with 7 μM DANPY-1 at 45 minutes after dye exposure, using an excitation wavelength of 810 nm. The laser is horizontally polarized in the panels on the left and vertically on the right. The blue arrows indicate a cell in which a SHG signal is observed from nuclear region. | ||
SHG signals (Fig. 9, horizontal polarization in panel C and vertical polarization in panel D) were initially detected in the endoplasmic reticulum after 30–35 minutes of dye application, but this signal only persists for 5–10 minutes. After this point, the SHG signal becomes more prominent in the plasma membranes and persists until the end of the experiment (50–60 min). Superpositions of the TPEF and SHG channels at 45 minutes are shown in panels E (horizontal) and F (vertical) of Fig. 9 and the time evolution of the SHG signal is shown in Fig. S9.† DANPY-1 has considerable hydrophobic character, explaining affinity for membranes once inside a cellular environment. Notably, SHG signal strength can also vary with membrane density and ordering93 and DMSO can alter membrane morphology.94 However, a discussion of the effects of solubilization/penetration enhancers on SHG is beyond the scope of the present work. The appearance of SHG in the plasma membrane was not correlated with cell death. In previous studies,6 SHG has sometimes been observed shortly before cell death, when compromised membrane integrity allows dye molecules to enter the membranes more easily. The weaker SHG signal observed in the region that most likely contains organelles such as the endoplasmic reticulum and mitochondria (Fig. S9,† left column) is not very commonly seen, but also not unprecedented.6 Because SHG can also be generated by chiral well-ordered structures such as collagen and myosin, even cultured cells can occasionally show “auto-SHG” in the absence of a dye.95,96 The source of the signal in the nucleus of the cell highlighted with the blue arrows in Fig. 9 is inconclusive and could be SHG from DANPY-1 bound to DNA or auto-SHG from microtubules of the mitotic spindle.
Since non-centrosymmetric ordering of the dye molecules is required for SHG, the presence of a SHG signal indicates that the dye molecules are aligning within the membranes. Such a response is further illustrated by the 90° shift in the SHG signal when the laser polarization was rotated from horizontal to vertical (compare Fig. 9, panels C and D). In contrast, no significant change is observed for the orientation-independent TPEF signal (compare Fig. 9, panels A and B). The delay in the visibility of any SHG signal can potentially be due to the time required for the dye to go from a random or centrosymmetric distribution to a non-centrosymmetric distribution within a single leaflet of the membrane. Furthermore, the difference in timing between appearance of signals in the TPEF and SHG imaging channels rules out that the signal observed in the SHG channel is TPEF leaking into the SHG filtered channel. The slow response time for the appearance of a SHG signal may be linked to the shape and conformational dynamics of the DANPY-1 molecule.
The applicability of DANPY-1 for SHG microscopy can be contrasted with the voltage-sensitive dye di-8-ANEPPS, which is a member of the ANEP (aminonaphthylethyleneylpyridinium) family of dyes. Unlike the broad range of cellular compartments targeted by DANPY-1, di-8-ANEPPS targets the plasma membrane specifically. Like DANPY-1, di-8-ANEPPS appears rapidly in the TPEF channel, about 1 minute after adding dye. However, unlike DANPY-1, a SHG signal appears rapidly after addition di-8-ANEPPS, about another minute after the appearance of the TPEF signal.97 A significant disadvantage of the ANEP family of dyes is that they need an antioxidant (e.g. catalase) in the medium to reduce cytotoxicity.98 In comparable experiments to those performed with DANPY-1 cells stained with di-8-ANEPPS without antioxidant survive for 8 minutes or less while being imaged. In contrast, cells stained with DANPY-1 remained intact throughout the experiment (∼60 minutes). These experiments suggest that DANPY-1 may have lower phototoxicity versus the ANEP family of dyes.
Conclusion and outlook
The development of DANPY-1 as a dye represents an intriguing outgrowth of rational molecular design. It was first developed for DNA-based electro-optic modulation, optimized to meet design criteria involving hyperpolarizability, compatibility with a nucleic acid environment, and photostability, but it also exhibits substantial one and two-photon fluorescence, making it of value for imaging. The fluorophore's strong solvatochromism, large Stokes shift, and SHG activity (large β) make it a useful core for the development of future fluorescent probes. The combination of high photostability and low phototoxicity of DANPY-1 could prove advantageous for imaging techniques in which higher laser intensities are required. While binding of the first-generation dye (DANPY-1) is not specific for DNA, its high affinity, together with its hyperpolarizability and fluorescence enhancement on binding, outperform prior attempts at nonlinear nucleic acid probes.19 The sensitivity of DANPY-1 is further substantiated by gel electrophoresis experiments, and it has been demonstrated to enter and stain a diverse range of cell components in several species of eukaryotes. Though further studies are warranted, preliminary third-party toxicity tests indicate that DANPY-1 has an acceptable safety profile for routine laboratory use – certainly an added benefit. This powerful combination of valuable optical properties, biological utility in profiling live cells, and a readily accessible, gram-scale synthesis present DANPY-1 as a promising imaging platform for a variety of linear and nonlinear techniques and across a range of appropriately conjugated targets.Conflicts of interest
The authors declare no competing financial interests.Acknowledgements
We are grateful for financial and technical support from many parties. Work conducted in the Chemistry Department at UW was supported by Air Force Research Laboratory (FA8659-06-D-5401), the Air Force Office of Scientific Research (FA9550-15-1-0319), and the National Science Foundation (DMR-1303080 and DMR-0120967); computing resources were supported by the UW Student Technology Fund. Any opinions, findings, and conclusions or recommendations expressed in this article are those of the author(s) and do not necessarily reflect the views of the National Science Foundation. Part of this work was conducted at the Molecular Analysis Facility (MAF), a National Nanotechnology Coordinated Infrastructure site at the University of Washington which is supported in part by the National Science Foundation (grant NNCI-1542101), the University of Washington, the Molecular Engineering & Sciences Institute, and the Clean Energy Institute. Work conducted in the Chemistry Department at California Lutheran University was supported by startup funds awarded to JSK; LEJ and JSK further thank the Pomona College Chemistry Department for temporary research space and supplies for some initial reactions performed in 2013. Research in the University of Washington Department of Biology was supported by the UW Commercialization Gap Fund (CGF 2014-6596), as well the US Department of Energy under contract DE-EE0003046 awarded to the National Alliance for Advanced Biofuels and Bioproducts and by NOAA NA070AR4170007 to RAC. We recognize Dr Alexander Paredez and Dr Jennifer Nemhauser (UW Biology) who graciously provided confocal microscope access and Sacchromyces cerviciae cells, respectively. Work at KU Leuven was supported by internal funding. Independent toxicity studies were conducted by Nelson Labs (Salt Lake City, Utah), and funded by the UW CGF. The authors thank Prof. Marcel Ameloot and Dr Rick Paesen (University of Hasselt) for use of their confocal microscope and HeLa cells, and Kristine Parra (UW WCET) and Dr Liam Bradshaw (MAF) for experimental assistance with fluorescence lifetime and TPA measurements. We further acknowledge Dr Stephanie Benight, Dr Andreas Tillack, Dr Martin Sadilek, Zachary Watanabe-Gastel, Derek Frei, Wes Winn, and Hannah Zeitler (UW Chemistry); Dr Mike Casford and Prof. Paul Davies (University of Cambridge); Prof. Malkiat Johal, Yun-Jun Kim, and Conner Kummerlowe (Pomona College); and Aric Rininger (UW Biology) for helpful discussion and technical assistance. Finally, the authors wish to dedicate this work to Dr Emily Heckman and Dr James Grote of Air Force Research Laboratory, whose pioneering studies on DNA-based electronic and optical systems enabled the search for new dyes for these applications that led to the development of DANPY-1.References
- T. J. Chozinski, L. A. Gagnon and J. C. Vaughan, Twinkle, twinkle little star: photoswitchable fluorophores for super-resolution imaging, FEBS Lett., 2014, 588(19), 3603–3612 CrossRef CAS PubMed.
- Z. Guo, S. Park, J. Yoon and I. Shin, Recent progress in the development of near-infrared fluorescent probes for bioimaging applications, Chem. Soc. Rev., 2014, 43(1), 16–29 RSC.
- K. Saha, S. S. Agasti, C. Kim, X. Li and V. M. Rotello, Gold nanoparticles in chemical and biological sensing, Chem. Rev., 2012, 112(5), 2739–2779 CrossRef CAS PubMed.
- K. Aslan, I. Gryczynski, J. Malicka, E. Matveeva, J. R. Lakowicz and C. D. Geddes, Metal-enhanced fluorescence: an emerging tool in biotechnology, Curr. Opin. Biotechnol., 2005, 16(1), 55–62 CrossRef CAS PubMed.
- K. Zhong, L. Wang, J. Li, S. Van Cleuvenbergen, C. Bartic, K. Song and K. Clays, Real-Time Fluorescence Detection in Aqueous Systems by Combined and Enhanced Photonic and Surface Effects in Patterned Hollow Sphere Colloidal Photonic Crystals, Langmuir, 2017, 33(19), 4840–4846 CrossRef CAS PubMed.
- E. De Meulenaere, W.-Q. Chen, S. Van Cleuvenbergen, M.-L. Zheng, S. Psilodimitrakopoulos, R. Paesen, J.-M. Taymans, M. Ameloot, J. Vanderleyden, P. Loza-Alvarez, X.-M. Duan and K. Clays, Molecular engineering of chromophores for combined second-harmonic and two-photon fluorescence in cellular imaging, Chem. Sci., 2012, 3(4), 984 RSC.
- J. E. Reeve, H. L. Anderson and K. Clays, Dyes for biological second harmonic generation imaging, Phys. Chem. Chem. Phys., 2010, 12(41), 2758–2759 RSC.
- J. E. Reeve, H. A. Collins, K. D. Mey, M. M. Kohl, K. J. Thorley, O. Paulsen, K. Clays and H. L. Anderson, Amphiphilic Porphyrins for Second Harmonic Generation Imaging, J. Am. Chem. Soc., 2009, 131(8), 2758–2759 CrossRef CAS PubMed.
- J. G. Grote, N. Ogata, J. A. Hagen, E. Heckman, M. J. Curley, P. P. Yaney, M. O. Stone, D. E. Diggs, R. L. Nelson, J. S. Zetts, F. K. Hopkins and L. R. Dalton, Deoxyribonucleic Acid (DNA) based nonlinear optics, Proc. SPIE, 2003, 5211, 53–62 CrossRef CAS.
- D. Kim, H. G. Ryu and K. H. Ahn, Recent development of two-photon fluorescent probes for bioimaging, Org. Biomol. Chem., 2014, 12(26), 4550–4566 RSC.
- J. Qi, W. Qiao and Z. Y. Wang, Advances in Organic Near-Infrared Materials and Emerging Applications, Chem. Rec., 2016, 16(3), 1531–1548 CrossRef CAS PubMed.
- L. R. Dalton, P. Gunter, M. Jazbinsek, O.-P. Kwon and P. A. Sullivan, Organic Electro-Optics and Photonics, Cambridge University Press/Materials Research Society, Cambridge, UK, 2015 Search PubMed.
- W. Heni, Y. Kutuvantavida, C. Haffner, H. Zwickel, C. Kieninger, S. Wolf, M. Lauermann, Y. Fedoryshyn, A. F. Tillack, L. E. Johnson, D. L. Elder, B. H. Robinson, W. Freude, C. Koos, J. Leuthold and L. R. Dalton, Silicon–Organic and Plasmonic–Organic Hybrid Photonics, ACS Photonics, 2017, 4(7), 1576–1590 CrossRef CAS.
- L. R. Dalton, S. J. Benight, L. E. Johnson, D. B. Knorr, I. Kosilkin, B. E. Eichinger, B. H. Robinson, A. K. Y. Jen and R. M. Overney, Systematic Nanoengineering of Soft Matter Organic Electro-optic Materials†, Chem. Mater., 2011, 23(3), 430–445 CrossRef CAS.
- D. L. Elder, C. Haffner, W. Heni, Y. Fedoryshyn, K. E. Garrett, L. E. Johnson, R. A. Campbell, J. D. Avila, B. H. Robinson, J. Leuthold and L. R. Dalton, Effect of Rigid Bridge-Protection Units, Quadrupolar Interactions, and Blending in Organic Electro-Optic Chromophores, Chem. Mater., 2017, 29(15), 6457–6471 CrossRef CAS.
- A. Samoc, M. Samoc, J. G. Grote, A. Miniewicz and B. Luther-Davies, Optical properties of deoxyribonucleic acid (DNA) polymer host, Proc. SPIE, 2006, 6401, 640106 CrossRef.
- J. G. Grote, DNA: new class of polymer, Proc. SPIE, 2006, 6117, 61170J CrossRef.
- F. Pan, M. S. Wong, C. Bosshard and P. Günter, Crystal Growth and Characterization of the Organic Salt 4-N,N-Dimethylamino-4′-N′- methyl-stilbazolium Tosylate (DAST), Adv. Mater., 1996, 8(7), 592–595 CrossRef CAS.
- M. Deiana, K. Matczyszyn, J. Massin, J. Olesiak-Banska, C. Andraud and M. Samoc, Interactions of Isophorone Derivatives with DNA: Spectroscopic Studies, PLoS One, 2015, 10(6), e0129817 CrossRef PubMed.
- C. Zhang, L. R. Dalton, M.-C. Oh, H. Zhang and W. H. Steier, Low Vπ Electrooptic Modulators from CLD-1: Chromophore Design and Synthesis, Material Processing, and Characterization, Chem. Mater., 2001, 13(9), 3043–3050 CrossRef CAS.
- B. H. Robinson, L. E. JohnsonM. Rawal, S. J. Benight, L. N. Latimer, Z. H. Watnabe-Gastel, D. Frei, P. A. Sullivan and L. R. Dalton, NLO Chromophore/Surfactant Systems for DNA-Based Biophotonics - AFRL Subcontract Report, University of Washington, Seattle, WA, 2011.
- S. Redon, J. Massin, S. Pouvreau, E. De Meulenaere, K. Clays, Y. Queneau, C. Andraud, A. Girard-Egrot, Y. Bretonnière and S. Chambert, Red Emitting Neutral Fluorescent Glycoconjugates for Membrane Optical Imaging, Bioconjugate Chem., 2014, 25(4), 773–787 CrossRef CAS PubMed.
- J. Olesiak-Banska, P. Hanczyc, K. Matczyszyn, B. Norden and M. Samoc, Nonlinear absorption spectra of ethidium and ethidium homodimer, Chem. Phys., 2012, 404, 33–35 CrossRef CAS.
- J. Olesiak-Banska, K. Matczyszyn, R. Zalesny, N. A. Murugan, J. Kongsted, H. Agren, W. Bartkowiak and M. Samoc, Revealing spectral features in two-photon absorption spectrum of Hoechst 33342: a combined experimental and quantum-chemical study, J. Phys. Chem. B, 2013, 117(40), 12013–12019 CrossRef CAS PubMed.
- P. Del Castillo, R. W. Horobin, A. Bláquez-Castro and J. C. Stockert, Binding of cationic dyes to DNA: distinguishing intercalation and groove binding mechanisms using simple experimental and numerical models, Biotech. Histochem., 2010, 85(4), 247–256 CrossRef CAS PubMed.
- L. E. Johnson, Multi-Scale Modeling of Organic Electro-Optic Materials, Doctor of Philosophy, University of Washington, Seattle, 2012 Search PubMed.
- H. Ephardt and P. Fromherz, Fluorescence of Amphiphilic Hemicyanine Dyes without Free Double Bonds, J. Phys. Chem., 1993, 97(17), 4540–4547 CrossRef CAS.
- T. Parasassi, E. K. Krasnowska, L. Bagatolli and E. Gratton, Laurdan and Prodan as Polarity-Sensitive Fluorescent Membrane Probes, J. Fluoresc., 1998, 8(4), 365–373 CrossRef CAS.
- L. E. Johnson, L. N. Latimer, S. J. Benight, Z. H. Watanabe, D. L. Elder, B. H. Robinson, C. M. Bartsch, E. M. Heckman, G. Depotter and K. Clays, Novel cationic dye and crosslinkable surfactant for DNA biophotonics, Proc. SPIE, 2012, 8464, 0D1–0D10 CrossRef.
- L. E. Johnson, M. T. Casford, D. L. Elder, P. B. Davies and M. S. Johal, SFG characterization of a cationic ONLO dye in biological thin films, Proc. SPIE, 2013, 8817, 88170P CrossRef.
- E. C. Carroll, Toxicity analysis of novel fluorescent probe DANPY-1 and nucleic acid probe structure-toxicity optimization, Bachelor of Arts, Pomona College, Claremont, CA, 2014 Search PubMed.
- L. E. Johnson, R. A. Cattolico, B. H. Robinson, L. N. Latimer, Z. W. Gastel and W. Hardin, Fluorescent dyes and related methods, US9410947B2, 2016 Search PubMed.
- L. E. Johnson, R. A. Cattolico, B. H. Robinson, L. N. Latimer, Z. W. Gastel and W. Hardin, Fluorescent dyes and related methods, US9702870, 2017 Search PubMed.
- J. Z. Deng, D. V. Paone, A. T. Ginnetti, H. Kurihara, S. D. Dreher, S. A. Weissman, S. R. Stauffer and C. S. Burgey, Copper-Facilitated Suzuki Reactions: Application to 2-Heterocyclic Boronates, Org. Lett., 2009, 11(2), 345–347 CrossRef CAS PubMed.
- D. M. Knapp, E. P. Gillis and M. D. Burke, A General Solution for Unstable Boronic Acids: Slow-Release Cross-Coupling from Air-Stable MIDA Boronate, J. Am. Chem. Soc., 2009, 131(20), 6961–6963 CrossRef CAS PubMed.
- R. Martin and S. L. Buchwald, Palladium-Catalyzed Suzuki−Miyaura Cross-Coupling Reactions Employing Dialkylbiaryl Phosphine Ligands, Acc. Chem. Res., 2008, 41(11), 1461–1473 CrossRef CAS PubMed.
- K. Billingsley and S. L. Buchwald, Highly Efficient Monophosphine-Based Catalyst for the Palladium-Catalyzed Suzuki−Miyaura Reaction of Heteroaryl Halides and Heteroaryl Boronic Acids and Esters, J. Am. Chem. Soc., 2007, 129(11), 3358–3366 CrossRef CAS PubMed.
- J. S. Kingsbury, D. L. Elder, L. E. Johnson, B. A. Smolarski, H. E. Zeitler and E. G. Armburster, Derivatives of the NLO-Active Dye DANPY (Dimethylaminonaphthylpyridinium) by the Bucherer Reaction: Tricyclic 2-Amino-6-bromonaphthalenes from 6-Bromo-2-naphthol, 2018, manuscript in preparation Search PubMed.
- P. Fromherz, Monopole-Dipole Model for Symmetrical Solvatochromism of Hemicyanine Dyes, J. Phys. Chem., 1995, 99(18), 7188–9192 CrossRef CAS.
- G. Weber and F. J. Farris, Synthesis and spectral properties of a hydrophobic fluorescent probe: 6-propionyl-2-(dimethylamino)naphthalene, Biochemistry, 1979, 18(14), 3075–3078 CrossRef CAS PubMed.
- Y. Yang, D. Li, C. Li, Y. Liu and K. Jiang, Hydrogen bond strengthening induces fluorescence quenching of PRODAN derivative by turning on twisted intramolecular charge transfer, Spectrochim. Acta, Part A, 2017, 187, 68–74 CrossRef CAS PubMed.
- N. C. Garbett, N. B. Hammond and D. E. Graves, Influence of the Amino Substituents in the Interaction of Ethidium Bromide with DNA, Biophys. J., 2004, 87(6), 3974–3981 CrossRef CAS PubMed.
- A. K. Gaigalas and L. Wang, Measurement of the fluorescence quantum yield using a spectrometer with an integrating sphere detector, J. Res. Natl. Inst. Stand. Technol., 2008, 113(1), 17–28 CrossRef CAS PubMed.
- D. Phillips, R. C. Drake, D. V. O'Connor and R. L. Christensen, Time Correlated Single-Photon Counting (Tcspc) Using Laser Excitation, Instrum. Sci. Technol., 1985, 14(3–4), 267–292 CrossRef CAS.
- S. Preus, DecayFit - Fluorescence Decay Analysis Software, 1.4; FluorTools, 2014 Search PubMed.
- C. Xu and W. W. Webb, Measurement of two-photon excitation cross sections of molecular fluorophores with data from 690 to 1050 nm, J. Opt. Soc. Am. B, 1996, 13(3), 481–491 CrossRef CAS.
- M. A. Albota, C. Xu and W. W. Webb, Two-photon fluorescence excitation cross sections of biomolecular probes from 690 to 960 nm, Appl. Opt., 1998, 37(31), 7352–7356 CrossRef CAS PubMed.
- R. Sinclair, An Eye for a Dye, The Scientist, 2000 (April), https://www.the-scientist.com/technology-profile/an-eye-for-a-dye-56054 Search PubMed.
- J. T. Keer and L. Birch, Essentials of Nucleic Acid Analysis, Royal Society of Chemistry, London, UK, 2008 Search PubMed.
- F. M. Pohl, T. M. Jovin, W. Baehr and J. J. Holbrook, Ethidium Bromide as a Cooperative Effector of a DNA Structure, Proc. Natl. Acad. Sci. U. S. A., 1972, 69(12), 3805–3809 CrossRef CAS.
- D. A. Skoog, F. J. Holler and T. A. Neiman, Principles of Instrumental Analysis, Thomson Learning, Boston, MA, 5th edn, 1998 Search PubMed.
- M. Y. Berezin and S. Achilefu, Fluorescence Lifetime Measurements and Biological Imaging, Chem. Rev., 2010, 110(5), 2641–2684 CrossRef CAS PubMed.
- G. Oster and Y. Nishijima, Fluorescence and Internal Rotation: Their Dependence on Viscosity of the Medium1, J. Am. Chem. Soc., 1956, 78(8), 1581–1584 CrossRef CAS.
- M. K. Kuimova, G. Yahioglu, J. A. Levitt and K. Suhling, Molecular Rotor Measures Viscosity of Live Cells via Fluorescence Lifetime Imaging, J. Am. Chem. Soc., 2008, 130(21), 6672–6673 CrossRef CAS PubMed.
- R. Adhikary, C. A. Barnes and J. W. Petrich, Solvation Dynamics of the Fluorescent Probe PRODAN in Heterogeneous Environments: Contributions from the Locally Excited and Charge-Transferred States, J. Phys. Chem. B, 2009, 113(35), 11999–12004 CrossRef CAS PubMed.
- D. P. Heller and C. L. Greenstock, Fluorescence lifetime analysis of DNA intercalated ethidium bromide and quenching by free dye, Biophys. Chem., 1994, 50(3), 305–312 CrossRef CAS PubMed.
- S. de Reguardati, J. Pahapill, A. Mikhailov, Y. Stepanenko and A. Rebane, High-accuracy reference standards for two-photon absorption in the 680–1050 nm wavelength range, Opt. Express, 2016, 24(8), 9053–9066 CrossRef CAS PubMed.
- B. A. Babgi, M. S. Kodikara, M. Morshedi, H. Wang, C. b. Quintana, T. Schwich, G. J. Moxey, N. V. Steerteghem, K. Clays, R. Stranger, M. P. Cifuentes and M. G. Humphrey, Linear Optical, Quadratic and Cubic Nonlinear Optical, Electrochemical, and Theoretical Studies of “Rigid-Rod” Bis-Alkynyl Ruthenium Complexes, ChemPlusChem, 2018, 83(7), 630–642 CrossRef CAS.
- K. Clays and A. Persoons, Hyper-Rayleigh scattering in solution, Rev. Sci. Instrum., 1992, 63(6), 3285 CrossRef CAS.
- G. Olbrechts, R. Strobbe, K. Clays and A. Persoons, High-frequency demodulation of multi-photon fluorescence in hyper-Rayleigh scattering, Rev. Sci. Instrum., 1998, 69(6), 2233–2241 CrossRef CAS.
- K. Wostyn, K. Binnemans, K. Clays and A. Persoons, Hyper-Rayleigh scattering in the Fourier domain for higher precision: Correcting for multiphoton fluorescence with demodulation and phase data, Rev. Sci. Instrum., 2001, 72(8), 3215–3220 CrossRef CAS.
- J. L. Oudar and D. S. Chemla, Hyperpolarizabilities of the Nitroanilines and their Relations to the Excited State Dipole Moment, J. Chem. Phys., 1977, 66(6), 2664–2668 CrossRef CAS.
- B. C. Canfield, M. G. Kuzyk, S. E. Hightower and A. D. Q. Li, Use of quadratic electroabsorption for measurement of the hyperpolarizability, J. Opt. Soc. Am. B, 2005, 22, 723–734 CrossRef CAS.
- J. Campo, W. Wenseleers, J. M. Hales, N. S. Makarov and J. W. Perry, Practical Model for First Hyperpolarizability Dispersion Accounting for Both Homogeneous and Inhomogeneous Broadening Effects, J. Phys. Chem. Lett., 2012, 3(16), 2248–2252 CrossRef CAS PubMed.
- S. J. Cyvin, J. E. Rauch and J. C. Decius, Theory of Hyper-Raman Effects (Nonlinear Inelastic Light Scattering): Selection Rules and Depolarization Ratios for the Second-Order Polarizability, J. Chem. Phys., 1965, 43(11), 4083 CrossRef CAS.
- J. E. Rice and N. Handy, The calculation of frequency-dependent polarizabilities as pseudo-energy derivatives, J. Chem. Phys., 1991, 94(7), 4959–4971 CrossRef CAS.
- L. E. Johnson, L. R. Dalton and B. H. Robinson, Optimizing Calculations of Electronic Excitations and Relative Hyperpolarizabilities of Electrooptic Chromophores, Acc. Chem. Res., 2014, 47(11), 3258–3265 CrossRef CAS PubMed.
- M. J. Frisch, G. W. Trucks, H. B. Schlegel, G. E. Scuseria, M. A. Robb, J. R. Cheeseman, G. V. B. Scalmani, B. Mennucci, G. A. Petersson, H. Nakatsuji, M. Caricato, X. Li, H. P. Hratchian, A. F. Izmaylov, J. Bloino, G. Zheng, J. L. Sonnenberg, M. Hada, M. Ehara, K. Toyota, R. Fukuda, J. Hasegawa, M. Ishida, T. Nakajima, Y. Honda, O. Kitao, H. Nakai, T. Vreven, J. J. A. Montgomery, J. E. Peralta, F. Ogliaro, M. Bearpark, J. J. Heyd, E. Brothers, K. N. Kudin, V. N. Staroverov, R. Kobayashi, J. Normand, K. Raghavachari, A. Rendell, J. C. Burant, S. S. Iyengar, J. Tomasi, M. Cossi, N. Rega, J. M. Millam, M. Klene, J. E. Knox, J. B. Cross, V. Bakken, C. Adamo, J. Jaramillo, R. Gomperts, R. E. Stratmann, O. Yazyev, A. J. Austin, R. Cammi, C. Pomelli, J. W. Ochterski, R. L. Martin, K. Morokuma, V. G. Zakrzewski, G. A. Voth, P. Salvador, J. J. Dannenberg, S. Dapprich, A. D. Daniels, Ö. Farkas, J. B. Foresman, J. V. Ortiz, J. Cioslowski and D. J. Fox, Gaussian 09, Revision A.1, Gaussian, Inc., Wallingford, CT, 2009 Search PubMed.
- L. E. Johnson, L. N. Latimer, S. J. Benight, Z. H. Watanabe, D. L. Elder, B. H. Robinson, C. M. Bartsch, E. M. Heckman, G. Depotter and K. Clays, Novel cationic dye and crosslinkable surfactant for DNA biophotonics, Proc. SPIE, 2012, 8464, 84640D1–84640D10 CrossRef.
- B. J. Coe, J. A. Harris, J. J. Hall, B. S. Brunschwig, S.-T. Hung, W. Libaers, K. Clays, S. J. Coles, P. N. Horton, M. E. Light, M. B. Hursthouse, J. Garín and J. Orduna, Syntheses and Quadratic Nonlinear Optical Properties of Salts Containing Benzothiazolium Electron-Acceptor Groups, Chem. Mater., 2006, 18(25), 5907–5918 CrossRef CAS.
- K. Firestone, Frequency-agile hyper-Rayleigh scattering studies of nonlinear optical chromophores, Doctor of Philosophy, University of Washington, Seattle, WA, 2005 Search PubMed.
- S. Ermer, S. M. Lovejoy, D. S. Leung, H. Warren, C. R. Moylan and R. J. Twieg, Synthesis and Nonlinearity of Triene Chromophores Containing the Cyclohexene Ring Structure, Chem. Mater., 1997, 9(6), 1437–1442 CrossRef CAS.
- A. Al-Yasari, P. Spence, H. El Moll, N. Van Steerteghem, P. N. Horton, B. S. Brunschwig, K. Clays and J. Fielden, Fine-tuning polyoxometalate non-linear optical chromophores: a molecular electronic “Goldilocks” effect, Dalton Trans., 2018, 47(31), 10415–10419 RSC.
- M. G. Kuzyk, Using fundamental principles to understand and optimize nonlinear-optical materials, J. Mater. Chem., 2009, 19(40), 7444 RSC.
- D. H. Bale, B. E. Eichinger, W. Liang, X. Li, L. R. Dalton, B. H. Robinson and P. J. Reid, Dielectric dependence of the first molecular hyperpolarizability for electro-optic chromophores, J. Phys. Chem. B, 2011, 115(13), 3505–3513 CrossRef CAS PubMed.
- I. Tinoco, K. Sauer, J. C. Wang and J. D. Puglisi, Physical Chemistry: Principles and Applications in Biological Sciences, Prentice-Hall, Upper Saddle River, NJ, 4th edn, 2002 Search PubMed.
- A. R. Peacocke and J. N. H. Skerrett, The interaction of aminoacridines with nucleic acids, Trans. Faraday Soc., 1956, 52, 261 RSC.
- N. Nizomov, E. N. Kurtaliev, S. N. Nizamov and G. Khodjayev, Spectral-luminescent study of the interaction of some styrylcyanine dyes with bovine serum albumin and DNA in aqueous solutions, J. Mol. Struct., 2009, 936(1–3), 199–205 CrossRef CAS.
- N. P. Bazhulina, A. M. Nikitin, S. A. Rodin, A. N. Surovaya, Y. V. Kravatsky, V. F. Pismensky, V. S. Archipova, R. Martin and G. V. Gursky, Binding of Hoechst 33258 and its derivatives to DNA, J. Biomol. Struct. Dyn., 2009, 26(6), 701–718 CrossRef CAS PubMed.
- N. C. Garbett, P. A. Ragazzon and J. B. Chaires, Circular dichroism to determine binding mode and affinity of ligand-DNA interactions, Nat. Protoc., 2007, 2(12), 3166–3172 CrossRef CAS PubMed.
- R. A. Cattolico, C. Deodato and B. P. Durham, unpublished data.
- M. B. Lakeman, P. von Dassow and R. A. Cattolico, The strain concept in phytoplankton ecology, Harmful Algae, 2009, 8(5), 746–758 CrossRef.
- R. D. Adam, Biology of Giardia lamblia, Clin. Microbiol. Rev., 2001, 14(3), 447–475 CrossRef CAS PubMed.
- J. Krtková, E. B. Thomas, G. C. M. Alas, E. M. Schraner, H. R. Behjatnia, A. B. Hehl and A. R. Paredez, Rac Regulates Giardia lamblia Encystation by Coordinating Cyst Wall Protein Trafficking and Secretion, mBio, 2016 DOI:10.1128/mBio.01003-16.
- M. Abodeely, K. N. DuBois, A. Hehl, S. Stefanic, M. Sajid, W. deSouza, M. Attias, J. C. Engel, I. Hsieh, R. D. Fetter and J. H. McKerrow, A Contiguous Compartment Functions as Endoplasmic Reticulum and Endosome/Lysosome in Giardia lamblia, Eukaryotic Cell, 2009, 8(11), 1665–1676 CrossRef CAS PubMed.
- B. J. Soltys and R. S. Gupta, Cell surface localization of the 60 kDa heat shock chaperonin protein (hsp60) in mammalian cells, Cell Biol. Int., 1997, 21(5), 315–320 CrossRef CAS PubMed.
- I. Pozdnyakov and S. Skarlato, Dinoflagellate amphiesma at different stages of the life cycle, Protistology, 2012, 7, 108–115 Search PubMed.
- J. D. Dodge, Fine structure of the pyrrophyta, Bot. Rev., 1971, 37(4), 481–508 CrossRef.
- A. C. M. Kwok and J. T. Y. Wong, Cellulose Synthesis Is Coupled to Cell Cycle Progression at G1 in the Dinoflagellate Crypthecodinium cohnii, Plant Physiol., 2003, 131(4), 1681–1691 CrossRef CAS PubMed.
- T. C. LaJeunesse, G. Lambert, R. A. Andersen, M. A. Coffroth and D. W. Galbraith, Symbiodinium (Pyrrhophyta) Genome Sizes (DNA Content) Are Smallest among Dinoflagellates1, J. Phycol., 2005, 41(4), 880–886 CrossRef CAS.
- M. West, N. Zurek, A. Hoenger and G. K. Voeltz, A 3D analysis of yeast ER structure reveals how ER domains are organized by membrane curvature, J. Cell Biol., 2011, 193(2), 333–346 CrossRef CAS PubMed.
- T. Le Costaouëc, C. Unamunzaga, L. Mantecon and W. Helbert, New structural insights into the cell-wall polysaccharide of the diatom Phaeodactylum tricornutum, Algal Res., 2017, 26, 172–179 CrossRef.
- L. Jin, A. C. Millard, J. P. Wuskell, X. Dong, D. Wu, H. A. Clark and L. M. Loew, Characterization and application of a new optical probe for membrane lipid domains, Biophys. J., 2006, 90(7), 2563–2575 CrossRef CAS PubMed.
- M. A. de Menorval, L. M. Mir, M. L. Fernandez and R. Reigada, Effects of dimethyl sulfoxide in cholesterol-containing lipid membranes: a comparative study of experiments in silico and with cells, PLoS One, 2012, 7(7), e41733 CrossRef CAS PubMed.
- P. J. Campagnola, A. C. Millard, M. Terasaki, P. E. Hoppe, C. J. Malone and W. A. Mohler, Three-Dimensional High-Resolution Second-Harmonic Generation Imaging of Endogenous Structural Proteins in Biological Tissues, Biophys. J., 2002, 82(1), 493–508 CrossRef CAS PubMed.
- S. Bancelin, C. A. Couture, M. Pinsard, M. Rivard, P. Drapeau and F. Legare, Probing microtubules polarity in mitotic spindles in situ using Interferometric Second Harmonic Generation Microscopy, Sci. Rep., 2017, 7(1), 6758 CrossRef CAS PubMed.
- E. De Meulenaere , personal observation.
- P. Schaffer, H. Ahammer, W. Müller, B. Koidl and H. Windisch, Di-4-ANEPPS causes photodynamic damage to isolated cardiomyocytes, Pflügers Arch., 1994, 426(6), 548–551 CrossRef CAS PubMed.
Footnotes |
| † Electronic supplementary information (ESI) available: Detailed synthetic and experimental protocols, 1H and 13C NMR spectra, potential energy surface analysis, detailed crystallographic information, detailed methodology for DNA binding analysis, third-party toxicology data (Ames test, MEM elution cytotoxicity, rabbit irritation test, and mouse systemic toxicity test), nonlinear fitting code, and coordinates for computed structures. CCDC 1838228. For ESI and crystallographic data in CIF or other electronic format see DOI: 10.1039/c8ob02536c |
| ‡ These authors contributed equally to this work. |
| § Present address: Marine Biology Research Division, Scripps Institution of Oceanography, La Jolla, CA 92093. USA. |
| This journal is © The Royal Society of Chemistry 2019 |