
 Open Access Article
 This Open Access Article is licensed under a Creative Commons Attribution-Non Commercial 3.0 Unported Licence
Thermally reduced fluorographenes as efficient electrode materials for supercapacitors†
Martin
Petr
 a,
Petr
Jakubec
*b,
Václav
Ranc
b,
Veronika
Šedajová
b,
Rostislav
Langer
b,
Miroslav
Medveď
b,
Piotr
Błoński
b,
Josef
Kašlík
b,
Vojtěch
Kupka
b,
Michal
Otyepka
*b and
Radek
Zbořil
b
a,
Petr
Jakubec
*b,
Václav
Ranc
b,
Veronika
Šedajová
b,
Rostislav
Langer
b,
Miroslav
Medveď
b,
Piotr
Błoński
b,
Josef
Kašlík
b,
Vojtěch
Kupka
b,
Michal
Otyepka
*b and
Radek
Zbořil
b
aRegional Centre for Advanced Technologies and Materials, Department of Experimental Physics, Faculty of Science, Palacký University Olomouc, 17. listopadu 1192/12, 771 46 Olomouc, Czech Republic
bRegional Centre for Advanced Technologies and Materials, Department of Physical Chemistry, Faculty of Science, Palacký University Olomouc, 17. listopadu 1192/12, 771 46 Olomouc, Czech Republic. E-mail: p.jakubec@upol.cz; michal.otyepka@upol.cz
First published on 31st October 2019
Abstract
There is an urgent need for a simple and up-scalable method for the preparation of supercapacitor electrode materials due to increasing global energy consumption worldwide. We have discovered that fluorographene exhibits great potential for the development of new kinds of supercapacitors aimed at practical applications. We have shown that time control of isothermal reduction of fluorographite at 450 °C under a hydrogen atmosphere led to the fine-tuning of fluorine content and electronic properties of the resulting fluorographene derivatives. Charge transfer resistances (Rct) of the thermally reduced fluorographenes (TRFGs) were decreased with respect to the pristine fluorographene; however, the Rctvs. time-of-reduction plot showed a v-shaped profile. The specific capacitance vs. time-of-reduction of TRFG followed the v-shaped trend, which could be the result of the decreasing content of sp3 carbons and increasing content of structural defects. An optimized material exhibited values of specific capacitance up to 539 F g−1 recorded at a current density of 0.25 A g−1 and excellent cycling durability with 100% specific capacitance retention after 1500 cycles in a three-electrode configuration and 96.7% of specific capacitance after 30![[thin space (1/6-em)]](https://www.rsc.org/images/entities/char_2009.gif) 000 cycles in a two-electrode setup.
000 cycles in a two-electrode setup.
Introduction
Considering the significant increase in world population and its reliance on energy-based devices, we assume that global energy consumption will significantly rise. It has been estimated that the demand for energy resources will have increased by 100% by the year 2050.1,2 When we take into account that fossil fuel resources are strictly limited, it is understandable that research focused on sustainable energy resources coupled with suitable energy storage technologies attracts intense interest. Supercapacitors belong to the group of energy storage devices that display significant advantages such as high-power density, long cycle life, and a small size when compared to batteries or fuel cells.3 They can store more energy than classical conventional capacitors while preserving a similar cell construction. However, the energy stored in supercapacitors (SCs) is about one order of magnitude lower than that of batteries. As the energy density (E) is related to capacitance (C) and voltage window (V) by the equation E = ½CV2, it can be concluded that E can be increased by increasing one or both terms.4 The voltage range can be enhanced by employing organic electrolytes or ionic liquids instead of aqueous electrolytes (due to the thermodynamic stability of water beyond 1.23 V).5 However, both kinds of electrolytes usually combine unfavourable properties such as low flash point, high-volatility, low electrical conductivity or low ionic conductivity at room temperature and, last but not least, toxicity and high cost. Moreover, a few ppm of water can significantly decrease the voltage window,6 which imposes high demands on cell construction. The energy density also depends on the material used for the electrode. In general, all materials can be sorted into two basic groups.7 The first group is represented by faradaic materials with redox active components which store charge via a fast and reversible faradaic reaction (pseudo-capacitive effect).8 It has been reported several times before that materials such as transition metal oxides,9–12 conductive polymers,13,14 or their composites15 rank among the typical examples. Conducting polymers possess many advantages such as low cost, high-conductivity in a doped state, and broad voltage window. However, swelling and shrinking of polymers represent a major problem leading to the mechanical degradation of materials, which results in hindering the electrochemical performance during testing.5 Pseudo-capacitive materials such as MnO2 enable to enhance the specific capacitance over 1000 F g−1, but they usually suffer from low electrical conductivity and compatibility with organic electrolytes.16,17 Short cycling ability limited their practical application as well. The other group is electro-chemical double-layer capacitors (EDLCs) which store energy electrostatically via a reversible ion absorption/desorption process at the electrode/electrolyte interface. Conway reported that an optimal material for an EDLC supercapacitor must have three key parameters as follows: (1) high specific area, (2) good intra- and interparticle conductivity in porous systems, and (3) good electrolyte accessibility to the intrapore space.18 Generally, carbon-based materials such as activated carbon,19–21 carbon nanotubes,22,23 carbon nanofibers,24,25 templated porous carbons,26 carbon aerogels27–31 and carbide-derived carbons32–34 are able to meet these requirements. However, a major part of these materials possess values of specific capacitance only in the range of 75–175 F g−1.7 Graphene, a two-dimensional carbon material, exhibits prominent intrinsic chemical and physical properties such as excellent electrical and thermal conductivity, mechanical strength, and large surface area.35 On the basis of these findings, it has been proposed that graphene can be used as a competitive material for SCs.36 Despite the above-mentioned qualities, graphene sheets exhibit strong inertness to chemical reactions37 and are prone to restacking, which reduces their usability it the field of supercapacitors.38 Therefore, considerable scientific effort has been devoted to strategies to overcome these limitations. This may involve managed changes of morphology during the synthesis of graphene sheets including for instance the creation of different porous 3D structures.39–41 Different ways to boost the capacitance include also the formation of various graphene composites,42 doping of graphene with heteroatoms,43–45 application of metal oxides11,46–48 or metal–organic frameworks,49–54 and functionalization of graphene sheets with different molecules through both covalent and non-covalent interactions.55–57 Halogenation of graphite represents an interesting approach to create few-layer graphene-like structures with extraordinary electrochemical properties.58 For instance, the intercalation of bromine, chlorine and fluorine atoms significantly improves the delamination process and endows the materials with a significantly higher surface area.59–61 Beyond these benefits, it has been also reported that the doping of halogen atoms highly affects the electronic properties such as conductivity.62–65 An et al. prepared an optimized fluorinated graphene hydrogel with capacitance values up to 227 F g−1 at a current density of 1 A g−1 in 6 M KOH.66 Kou et al. synthesized a graphene based material (OMG-Cl) doped by chlorine giving the capacitance value of 250 F g−1 at a current density of 0.5 A g−1 in 1 M H2SO4 and 220 F g−1 in 6 M KOH. The high capacitive performance was explained by an additional fast faradaic reaction induced from Cl-doping species.63 Kakaei et al. reported chlorine-doped reduced graphene oxide nanosheets, which exhibited the capacitance value of 178.4 F g−1 at a current density of 1 A g−1 in 1 M H2SO4.64 Ye et al. described the fluffy reduced graphene oxide film doped with iodine with the capacitance of 238 F g−1 at a current density of 0.5 A g−1 in 1 M H2SO4.65 Bulusheva et al. analyzed the structure and supercapacitor performance of graphene materials obtained from brominated and fluorinated graphites and concluded that the capacitance of a material doped with fluorine increased up to 158 F g−1 at a scan rate of 2 mV s−1 (in 1 M H2SO4).67Herein, we report a simple and up-scalable method for the preparation of partially fluorinated graphene derivatives based on thermal reduction of a fully fluorinated sample employing a reducing hydrogen gas. We have shown that the capacitance is influenced by the number of fluorine atoms as well as the hydrogenation process. An optimized material exhibits values of specific capacitance up to 539 F g−1 recorded at a current density of 0.25 A g−1. This capacitor system can be cycled reversibly in the voltage range of 0.1–0.6 V and exhibits excellent cycling durability, with 100% specific capacitance retention after 1500 cycles in a three-electrode configuration and 96.7% specific capacitance after 30000 cycles in a two-electrode setup. Moreover, the evolution of structural changes and related electronic properties is explained in detail using both experimental and theoretical approaches. The environmentally friendly nature of our derivatives (one-step synthesis without any presence of heavy metals, neutral character of the electrolyte) holds great potential in developing new kinds of supercapacitors for practical applications.
Experimental
Microscopy techniques
A Hitachi SU6600 scanning electron microscope (SEM) equipped with a field emission gun (FEG) and transmission electron microscope JEOL JEM 2100 operating at 200 kV (TEM) were used for morphology investigation. High-resolution TEM images including STEM-HAADF (high-angle annular dark-field imaging) analyses for elemental mapping of the products were performed with an FEI Titan HRTEM (high-resolution TEM) microscope operating at 200 kV. For these analyses, a droplet of the dispersion of the material in DMF at a concentration of ∼0.1 mg mL−1 was deposited onto a carbon-coated copper grid and dried. AFM images were obtained using the NTegra Spectra instrument (NT-MDT, Russia) in the tapping mode using NSG30 probes. In total, 5 μL of the ethanolic dispersion (c = 1 mg L−1) of the analyzed nanomaterial was deposited on a SiO2 wafer and left to dry for 30 minutes. The sample was measured immediately after that.Raman
Raman data were measured on a DXR Raman spectrometer (Thermo Scientific, USA) with a laser operating at 633 nm. The sample (0.1 mg) was deposited on a silicon wafer (1 × 1 cm) and an excitation laser was focused on its surface. The laser power on the sample was set to 2 mW, and the exposition time was 3s. Each measured Raman spectrum was an average of 512 experimental microscans. Raman spectra were processed using control software (Omnic, version 8, Thermo Scientific, USA).XPS
The XPS measurements were carried out with the PHI 5000 VersaProbe II XPS system (Physical Electronics) with a monochromatic Al-Kα source (15 kV, 50 W) and photon energy of 1486.7 eV. All spectra were recorded in a vacuum of 1.2 × 10⁻⁷ Pa at a room temperature of 20 °C. The analyzed area of the sample was a spot of 200 μm in diameter. The survey spectra were recorded at a pass energy of 187.850 eV with an electronvolt step of 0.8 eV; the high-resolution spectra were recorded at a pass energy of 23.500 eV with an electronvolt step of 0.2 eV. Dual beam charge compensation was used for all measurements. The spectra were evaluated with the MultiPak (Ulvac - PHI, Inc.) software. All binding energy (BE) values were referenced to the carbon peak C 1s at 284.80 eV.BET
The surface area and pore size analysis of GF powders was performed by means of N2 adsorption/desorption measurements at 77 K on a volumetric gas adsorption analyzer (3Flex, Micromeritics, USA) up to 0.965 P/P0. Prior to the analysis, the samples were degassed under high vacuum (10−4 Pa) at 130 °C for 12 hours while high purity (99.999%) N2 and He gases were used for the measurements. The Brunauer–Emmett–Teller area (BET) was determined with respect to Rouquerol criteria for BET determination68 assuming a molecular cross-sectional area of 16.2 Å2 for N2 (77 K). Pore size distribution was analyzed by the N2-DFT slit pore kernel.Electrochemical methods
The electrochemical analyzer PGSTAT 128N (Eco-Chemie, The Netherlands) using software package NOVA 1.11.2 was used for performing electrochemical experiments including cyclic voltammetry, galvanostatic charge–discharge characteristics, and electrochemical impedance spectroscopy. A three-electrode system was used as a proof-of-concept in order to collect all information about the electrochemical performance of the fluorographene samples. Following this set-up, a glassy carbon electrode (GCE) was used as a working electrode, a platinum electrode served as the counter electrode, and a Ag/AgCl electrode was used as the reference electrode, respectively. The GCE electrodes were modified with the samples applying a drop-coating technique as follows: a 10 μL drop of a powder suspension (0.2 g L−1) was coated onto the surface of the GCE electrode and allowed to dry at ambient temperature to form a thin film. Electrochemical impedance spectroscopy (EIS) measurements were performed by applying an AC voltage with a 5 mV amplitude over a frequency range 0.1 Hz to 10 kHz at the open circuit potential (OCP). All the obtained data were fitted using a modified Randles circuit. Sodium sulphate (Na2SO4; c = 1 mol L−1) was used as the electrolyte in all experiments. The gravimetric capacitance for the three-electrode system was calculated both from cyclic voltammograms and galvanostatic charge/discharge curves as follows: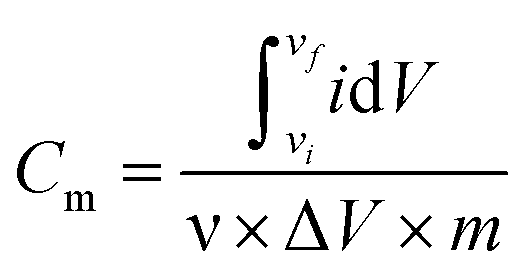
where Cm is the gravimetric capacitance of the electrode (F g−1),
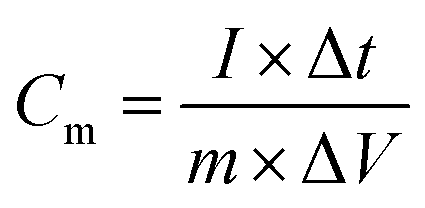
 is the voltammetric charge obtained by the integration of the area under the reverse peak of the cyclic voltammogram, ν is the scan rate (V s−1), ΔV is the potential window, m is the mass of the material deposited on the working electrode, I is the discharge current (A), and t is the discharge time (s).
A symmetrical supercapacitor device (EL-CELL, GmbH, Germany) was used to test the cycling stability of the FG-20H sample. Briefly, an active material without any additives (for instance binders, carbon black etc.) was dispersed in ultrapure water (≈4 mg ml−1) and sonicated for 1 hour. Then, 400 μl of dispersion was drop-coated on the surface of the gold disc electrode and dried under an infra lamp to achieve a mass loading of at least 2 mg cm−2. For the assembly of the supercapacitor device, two gold disc electrodes with the same loading of the active material were placed in a plastic sleeve (El-Cell sleeves with the Whatman® glass microfiber membrane). The separator membrane was soaked with 100 μl of the electrolyte. Stainless steel plungers were used to press the electrodes and the whole device was tightened and connected.
Computational methods
The first-principles calculations were performed by applying the spin-polarized density functional theory (SDFT) with the Perdew, Burke, and Ernzerhof (PBE)69 exchange and correlation functional and projected augmented wave potentials (PAW), as implemented in the Vienna ab initio simulation package (VASP).70–73 The wave functions were expanded in the plane-wave basis set with a minimum cutoff of 400 eV. The Brillouin zone integrations were performed with 6 × 6 × 1 (structure and cell optimization) Γ-centered Monkhorst–Pack k-point mesh74 per conventional 3 × 3 triclinic cell containing 18 carbon atoms, with the larger 6 × 6 triclinic cell containing 72 carbon atoms and the orthorhombic cell containing 48 ad-atoms. All optimized structures were converged to forces of less than 10−2 eV Å−1, with a criterion 10−6 eV for each SCF cycle.The thermodynamic stability of graphene-based structures expressed as the averaged binding energy was calculated as:
To evaluate the possibility of the formation of a specific arrangement on graphene, we calculated the Boltzmann probability at 450 K of fifteen lowest-in-energy structures as follows:
where pi is the probability of the i-th configuration, ETi is its total energy per computational cell (the summation runs over all considered configurations), kB is the Boltzmann constant, and T is the thermodynamic temperature.
Reagents
Fluorinated graphite polymer (>61 wt% F) and sodium sulfate (Na2SO4, 99% purity) were purchased from Sigma-Aldrich (Czech Republic). Milli-Q Water (MQ water, 18.3 MΩ, Millipore Corp., Milford, MA, USA) was used for the preparation of all electrolyte solutions.Synthesis of fluorographene derivatives
Defluorination was performed by isothermal annealing of approximately 25 mg of the precursor (fluorinated graphite polymer (>61 wt% F)) at a temperature of 450 °C (heating ramp 15 °C min−1) under continuous flushing of the reaction chamber XRK 900 mounted to an X-ray diffractometer X`Pert PRO MPD with pure hydrogen gas (6.0) with flow rate 40 mL min−1 and relative overpressure 1 bar for a time period ranging from 12 to 24 hours. The temperature of 450 °C was selected as the most suitable temperature for the continuous defluorination process.Results and discussion
Complex characterization of the prepared samples was performed in order to understand the electrochemical properties of fluorographene derivatives in detail. The morphology of the precursor and the samples labelled as FG-20H and FG-20Ham was evaluated by both SEM and TEM. The SEM image of the precursor (Fig. 1a) shows a typical graphite-like structure as expected. On the other hand the material thermally treated under a hydrogen atmosphere for 20 hours (FG-20H sample) consisted of thin and almost transparent flakes with a lateral size up to 2 μm as shown in Fig. 1b. Interestingly, a similar few-layer structure was also observed for the sample collected after the cycling stability measurement (Fig. 1c; FG-20Ham). The TEM images perfectly reflect the results obtained by the SEM measurement. The selected area electron diffraction (SAED) patterns confirmed the amorphous nature of all samples. Moreover, the occurrence of the same sharp rings for both FG-20H and FG-20Ham samples confirms the fact that the sample does not undergo any significant changes during the stability measurement (insets of Fig. 1e and f). High-resolution TEM (HRTEM) confirmed a thin layer structure of the FG-20H sample with the same size as previously described by SEM imaging (Fig. 1g–i). Moreover, EDS elemental mapping revealed that the elements such as oxygen, nitrogen, carbon, and fluorine were homogeneously distributed over the surface (Fig. 1j). It is worth noting that the presence of hydrogen ad-atoms cannot be excluded because of the reducing reaction conditions. The EDAX spectrum of the FG-20H sample is shown in Fig. 1k. All the obtained microscopy data suggested that the thickness of the FG-20 sample was in units of nm. The AFM image (Fig. 1l) and the corresponding height-profile (inset of Fig. 1l) scan showed that the thickness of the flakes ranged from 1.0 to 1.9 nm, indicating only few-layer structures.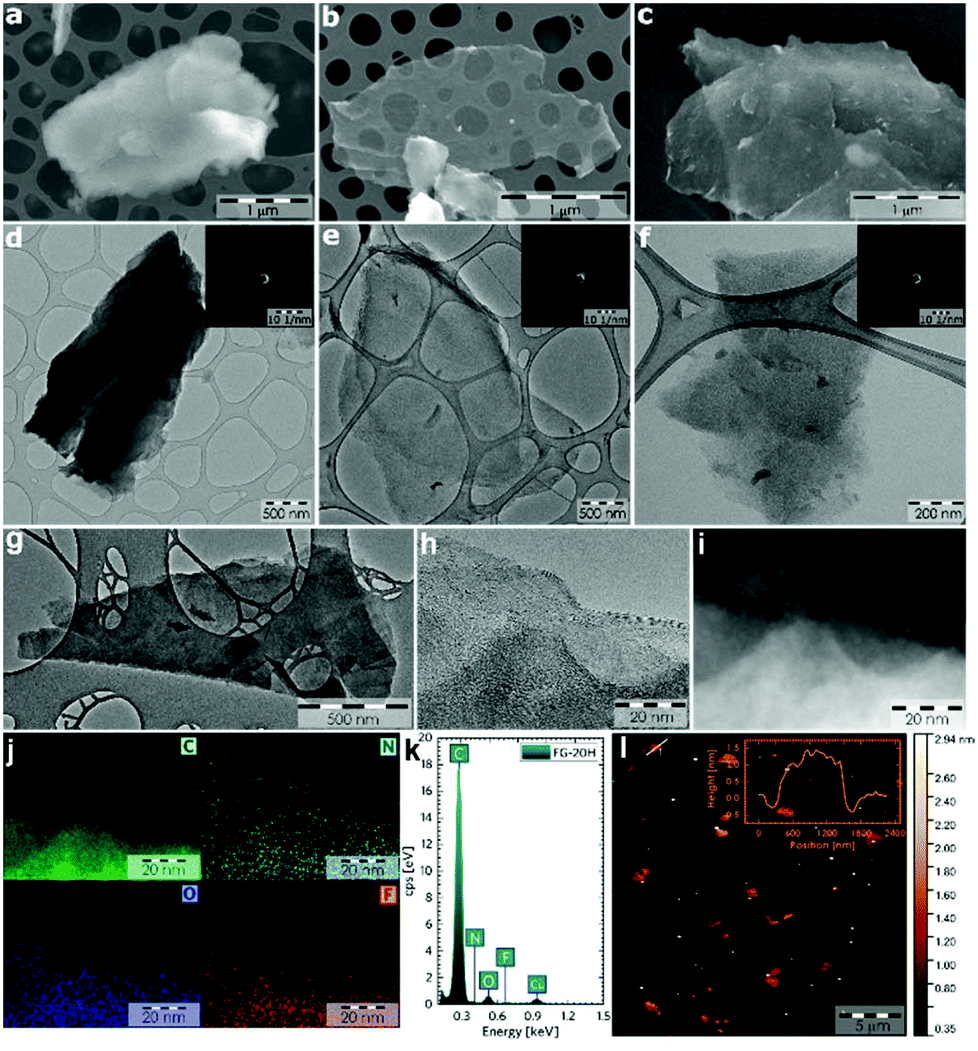 | ||
| Fig. 1 (a–c) SEM and (d–f) TEM images of the FG sample, FG-20H and FG-20Ham samples (FG-20Ham: sample collected after the cycling stability measurement; inset: SAED patterns of the abovementioned samples). (g, h) HRTEM micrographs of the FG-20H sample. (i) Darkfield HRTEM image used for EDS chemical mapping. (j) EDS chemical mapping of carbon, nitrogen, oxygen, and fluorine; (k) EDAX spectrum of the FG-20H sample. (l) AFM image of the FG-20H sample; inset: height profile of the FG-20H sample. All scale-bars were unified from a graphical point-of-view in order to provide better visibility. | ||
While microscopy techniques can be regarded as very local evaluation methods, Raman scattering can be used to estimate an average number of layers in graphene-based materials as well as the number and origin of defects.75,76 The D peak is related to the presence of atomic scale defects including the sp3 carbon atoms; the G peak is connected to the first order scattering of the stretching vibration mode E2g, which is typical of the sp2 carbon domains.77 The ratio of D to G bands (ID/IG) can serve as a tool for the characterization of defects in graphene-based materials.78 While the FG-12H sample exhibits a ID/IG ratio of 1.14, the FG-20H sample gives the ID/IG value of 0.87, indicating an increased content of sp2 hybridized carbon atoms (Fig. 2a and b). Conversely, the FG-24H sample exhibits the ratio of ID/IG around 1.05, indicating an increasing number of atomic scale defects accompanied by the disruption of π-conjugated domains (Fig. 2c). A small upshift of the D band from 1363 cm−1 to 1332 cm−1 for FG-20H can be ascribed to the rearrangement or cleavage of C-ad-atom bonds. The non-monotonous evolution of the ID/IG ratio indicates the complexity of structural changes in the material that is also reflected in the time of reaction of its electrochemical properties (vide infra).
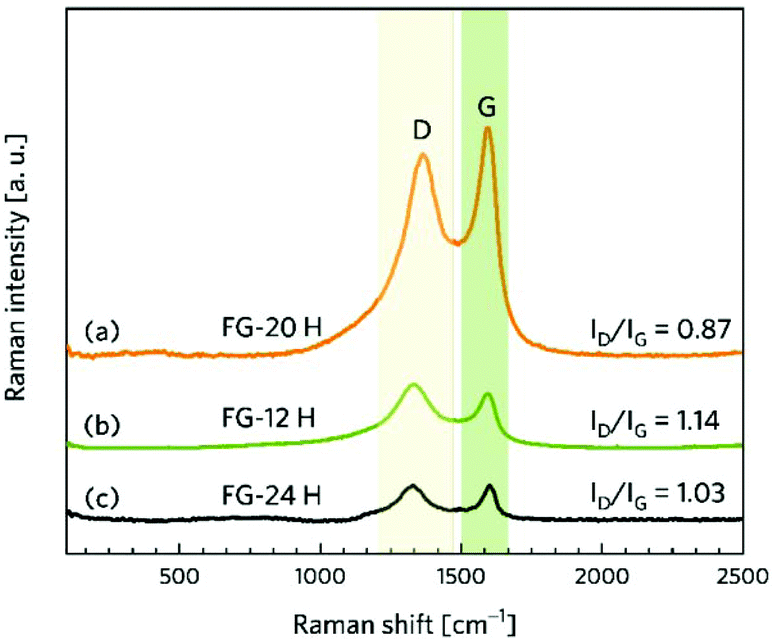 | ||
| Fig. 2 Raman spectra of (a) FG-20H, (b) FG-12H, (c) and FG-24H samples and the corresponding intensity ratios ID/IG. | ||
X-ray photoelectron spectroscopy (XPS) was conducted to provide a better insight into the composition of the TRFG samples. Table 1 shows that the content of fluorine drops significantly during the first 12 hours of the isothermal reduction. Then, roughly reaching constant values of 0.9% between 14 and 18 hours. It decreases again to 0.5% after 24 hours of reduction. Conversely, the relative content of carbon atoms exhibits an increasing trend. This phenomenon can be related to the rearrangement or cleavage of C-ad-atom bonds during the thermal decomposition of the FG samples. A similar trend was observed for the FG samples prepared at different temperatures79,80 and also for the FG samples prepared at a constant temperature but different pressures, as reported previously.81
| Time of synthesis | C 1s | O 1s | F 1s |
|---|---|---|---|
| (hours) | (atomic %) | ||
| Precursor | 45.78 | 0.21 | 54.01 |
| FG-2H | 74.84 | 2.23 | 22.94 |
| FG-12H | 95.01 | 3.62 | 1.37 |
| FG-14H | 95.29 | 3.85 | 0.86 |
| FG-16H | 95.62 | 3.51 | 0.87 |
| FG-18H | 95.75 | 3.38 | 0.87 |
| FG-20H | 95.83 | 3.34 | 0.83 |
| FG-22H | 95.92 | 3.35 | 0.73 |
| FG-24H | 96.00 | 3.48 | 0.52 |
Fig. 3a shows a survey spectrum of the FG-20H sample and its elemental composition (inset of Fig. 3a). The presence of the N 1s peak in the spectrum may be attributed to the presence of dimethylformamide, which was used as a solvent. The C 1s spectra were further fitted using a Gaussian function with a Shirley background correction. The deconvoluted C 1s XPS spectra of the FG-20H sample (Fig. 3b) show seven symmetric component peaks, corresponding to carbon atoms in different functional groups. The two first peaks located at 284.63 eV and 284.94 eV can be assigned to the sp2 C![[double bond, length as m-dash]](https://www.rsc.org/images/entities/char_e001.gif) C bond and sp3 C–C bond, respectively. It is possible to recognize that the peak intensity of the CC bond in sp2 hybridization is higher with respect to the peak intensity of the CC bond in sp3 hybridization. These findings along with the C 1s HR-XPS spectra for the FG-12H and the FG-24H samples (see Fig. S3†) are fully in line with the time evolution of the ID/IG ratio in Raman spectra. The peaks located at 286.01, 287.35, 290.36, and 291.74 eV were ascribed to C–C–F/C–O, CO, C–F, and C–F2 covalent bonds, respectively. The peak placed at 288.44 eV in the C 1s spectrum reflects partial transformation of the covalent C–F bond to the corresponding semi-ionic C–F bond.82 This phenomenon can be related to the shift in the electron cloud of the covalent C–F bonds induced by the formation of H-bonds.83 The BET measurement was used to evaluate the specific surface area (SSA) of different TRFG samples. Fig. S1a† depicts the N2 adsorption–desorption isotherms recorded at 77 K as well as the density functional theory (DFT) calculations of the pore size distribution of the TRFG samples. According to IUPAC conventions, the shape of all isotherms can be assigned to the combination of type I and IV, which is typical of microporous and mesoporous structures, respectively. The presence of a narrow hysteresis loop indicates an open porous structure, where there is no significant delay in the capillary evaporation of nitrogen. The FG-12H sample exhibits a SSA of 308 m2 g−1, while the FG-20H and FG-24H samples show a similar SSA of 335 m2 g−1. A small increase in the BET surface area (at around 8%) can be related to the thermal decomposition of the samples prepared with a longer period of synthesis. The hierarchical pore distribution of all FG samples (Fig. S1b†) indicates the presence of micropores with the size of <1 nm and mesopores with the size ranging from 2 to 10 nm. While the content of the larger pores does not change significantly, the micropores become notably more abundant at the final phase of the reaction (24H), suggesting that the material undergoes severe structural changes such as the release of fragments and formation of vacancies.
C bond and sp3 C–C bond, respectively. It is possible to recognize that the peak intensity of the CC bond in sp2 hybridization is higher with respect to the peak intensity of the CC bond in sp3 hybridization. These findings along with the C 1s HR-XPS spectra for the FG-12H and the FG-24H samples (see Fig. S3†) are fully in line with the time evolution of the ID/IG ratio in Raman spectra. The peaks located at 286.01, 287.35, 290.36, and 291.74 eV were ascribed to C–C–F/C–O, CO, C–F, and C–F2 covalent bonds, respectively. The peak placed at 288.44 eV in the C 1s spectrum reflects partial transformation of the covalent C–F bond to the corresponding semi-ionic C–F bond.82 This phenomenon can be related to the shift in the electron cloud of the covalent C–F bonds induced by the formation of H-bonds.83 The BET measurement was used to evaluate the specific surface area (SSA) of different TRFG samples. Fig. S1a† depicts the N2 adsorption–desorption isotherms recorded at 77 K as well as the density functional theory (DFT) calculations of the pore size distribution of the TRFG samples. According to IUPAC conventions, the shape of all isotherms can be assigned to the combination of type I and IV, which is typical of microporous and mesoporous structures, respectively. The presence of a narrow hysteresis loop indicates an open porous structure, where there is no significant delay in the capillary evaporation of nitrogen. The FG-12H sample exhibits a SSA of 308 m2 g−1, while the FG-20H and FG-24H samples show a similar SSA of 335 m2 g−1. A small increase in the BET surface area (at around 8%) can be related to the thermal decomposition of the samples prepared with a longer period of synthesis. The hierarchical pore distribution of all FG samples (Fig. S1b†) indicates the presence of micropores with the size of <1 nm and mesopores with the size ranging from 2 to 10 nm. While the content of the larger pores does not change significantly, the micropores become notably more abundant at the final phase of the reaction (24H), suggesting that the material undergoes severe structural changes such as the release of fragments and formation of vacancies.
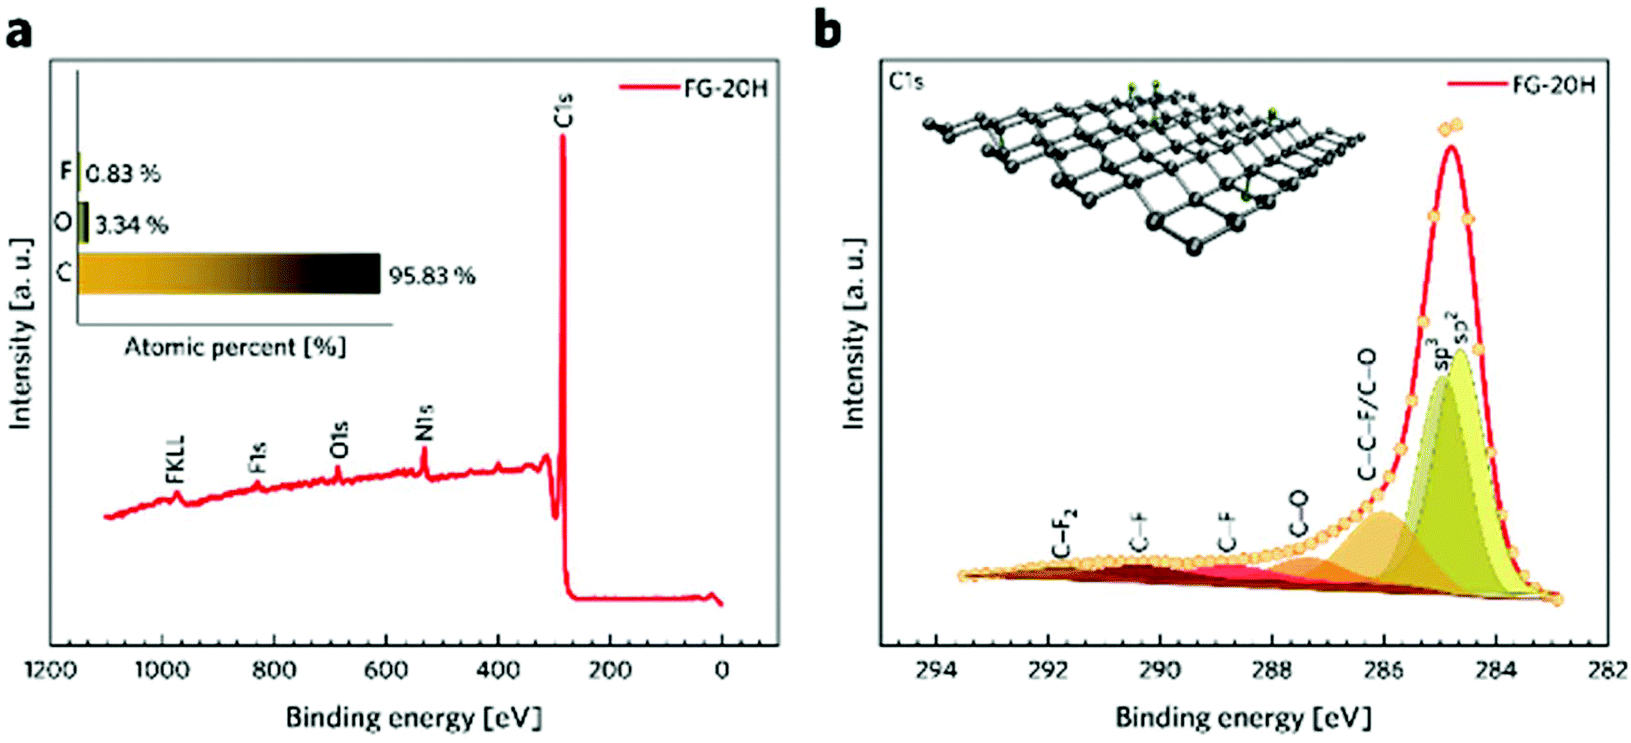 | ||
| Fig. 3 (a) XPS survey and elemental analysis (inset) of the FG-20H sample. (b) HR-XPS spectra of C 1s from the FG-20H sample. | ||
Electrochemical performance of fluorographene derivatives
For testing the electrochemical performance of fluorographene derivatives at the electrode|electrolyte interface, both potential and current should be monitored. Hence, a three-electrode system using a reference electrode was selected as a more suitable system compared to the 2-electrode cell. An aqueous solution of 1 M sodium sulphate was used as an electrolyte. We chose this neutral electrolyte because of its easy application involving work under open-air conditions, non-corrosive character, and environmentally friendly as well as relatively easily explainable charge-storage mechanism. Fig. 4a displays a scheme of fluorographene synthesis in a hydrogen-reducing atmosphere at a constant temperature of 450 °C. Fig. 4b shows a voltammetric response of the TRFG samples within the potential range of 0.1 to 0.6 V (scan rate of 50 mV s−1). The potential window between 0.1 and 0.6 V was selected as a stable region where no faradaic reaction occurred and where the contribution from the evolution of oxygen was negligible. As it is clearly evident, the process of defluorination significantly enhances the current response (capacitance) of the TRFG derivatives as the time changes. We have observed that the maximum capacitance can be reached within 20 hours. After that, the electrochemical performance drops down to an almost constant value (Fig. 4c). We have also found that the shapes of all CV curves were approximately rectangular and exhibited a good symmetry, even at a high scan rate, which proves the excellent capacitive behaviour and rate performance, as shown in Fig. 4d. It is worth noting that the fully fluorinated graphene with one fluorine atom per carbon acts as a high-quality insulating material with a resistance higher than 1012 Ω.84 Partially fluorinated systems behave like semiconductors, whose bandgaps are highly dependent on the extent of fluorination.85 Therefore, a decreasing capacitive performance after 20 hours of synthesis can be explained in terms of elemental composition as well as defect changes. When the FG sample undergoes thermal treatment at 450 °C in a reduction atmosphere of hydrogen gas, the ratio of F/C changes from 1.44 to 0.54, as it is evident from the XPS analysis. Once the amount of fluorine atoms decreases, the resistivity decreases as well, to the point (20 hours of the synthesis) when another defluorination process has no significant effect on lowering the resistivity. A further increase in the resistivity could be related to the increasing C—C vs. C—F ratio, which changes the type of defect responsible for the conductivity. Data describing the resistivity are further discussed in the section of impedance spectroscopy. While single-layer graphene exhibits an enhanced electron transfer because of its sp2 hybridized carbon atoms forming a π-conjugated system, fluorographene loses the conductivity with every carbon atom in sp3 hybridization. It can be hypothesized that the contents of fluorine atoms as well as the number and type of defect play an important role in fluorographene chemistry. In order to understand the charge storage mechanism in detail, the electrode kinetic was studied. The total amount of charge stored in the electrode material is given by the combination of capacitive and intercalation effects. Apart from this, the capacitive process is composed of two different mechanisms: redox reaction and electric double-layer formation between the electrode/electrolyte interface (ion adsorption/desorption). According to the power law, the dependence of the scan rate on the current can be expressed by the following equation:| i = aνb |
i is plotted against logv at a fixed potential, the value of b can be obtained from the slope of a linear fit. In general, the b-factor has two states like b = 0.5 referring to the diffusion-controlled intercalation process of ions into the electrode material (when the system satisfies Cottrell's equation, then: i = aν½) or b = 1 for surface capacitive contribution or non-diffusive processes (i = aν).87 Fig. S2† represents plot logi vs. logv at different potentials, and Fig. 4e shows that the obtained b-factor is close to 1 at particular potentials. This evidences that the capacitive contribution prevails throughout the intercalation process.
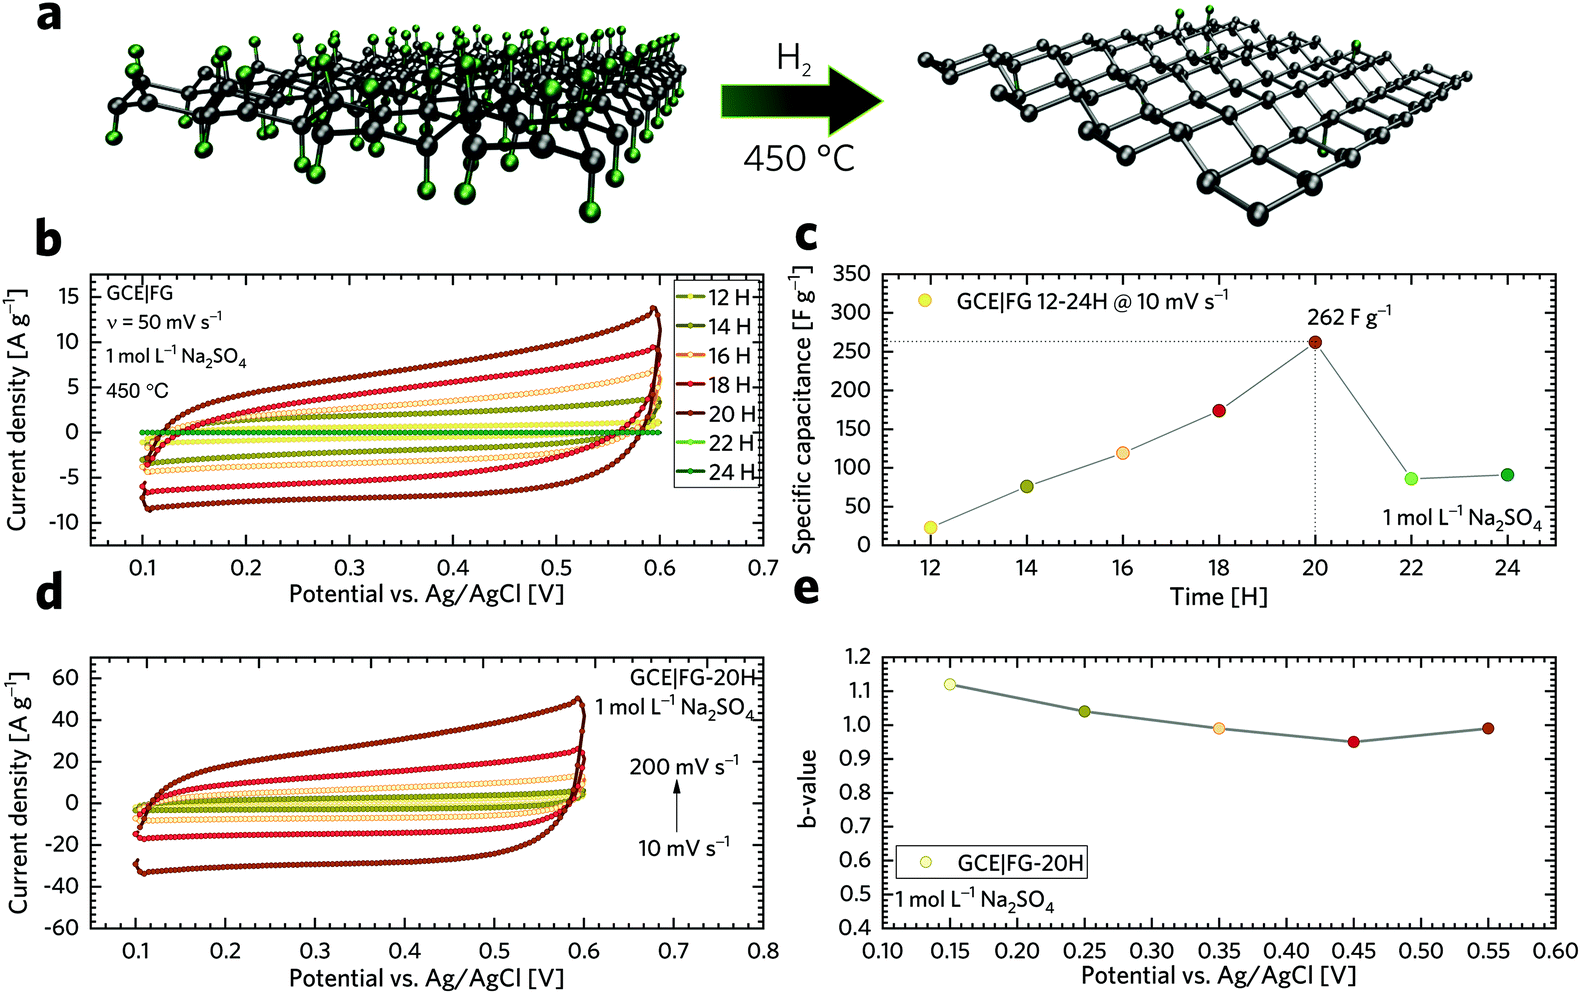 | ||
| Fig. 4 (a) Scheme of fluorographene synthesis. (b) CVs of GCEs modified with fluorographene samples recorded at a constant scan rate of 50 mV s−1. (c) Change of specific capacitance of FG samples with increasing time of synthesis. (d) CVs for the GCE modified with GF-20 H at different potential scan rates ranging from 10 to 200 mV s−1. (e) Variation of the b-value with the potential for the FG-20H sample. | ||
The capacitive performance was further investigated using a galvanostatic charge/discharge (GCD) technique, as shown in Fig. 5a. It is worth noting that GCD can illustrate either EDLC or pseudo-capacitive behaviour as well as the internal resistance of the tested materials. Its application has then paramount importance for the testing of supercapacitors. As can be seen, the GCD profiles of the FG samples exhibit an almost symmetrical charge–discharge shape without obvious redox waves, indicating good capacitive performance. Linear GCD profiles also confirm that the TRFG samples could be regarded as EDLC. Fig. 5b displays the trend of specific capacitance (Csp) evolution in time for the synthesis of the TRFG samples (the data were recorded at a constant current density of 1 A g−1). Evidently, the maximum of specific capacity was reached after 20 hours of synthesis, giving the value of Csp 300 F g−1. Then, the Csp dropped down up to 150 F g−1. This trend reflects the results obtained by means of cyclic voltammetry and could be attributed to the variation of sp2/sp3 carbon, as described previously. Subsequently, the sample labelled FG-20H was selected as the best candidate for further evaluation. Fig. 5c demonstrates the GCD curves of GCEs modified with the FG-20H sample recorded at different current densities ranging from 0.25 A g−1 to 5 A g−1. As is evident, all spectra remain almost symmetrical even at low current densities, implying a good capacitive behaviour. Fig. 5d shows the corresponding trend of Csp evolution in time for the sample labelled FG-20H. It is obvious that the maximum of Csp (539 F g−1) was reached at the current density of 0.25 A g−1. Such a value is higher than those previously reported for other carbon-based electrode materials measured under the same conditions.88–90 Subsequently, it is possible to recognize a typical decrease in capacitance, giving the value of Csp 230 F g−1 at 5 A g−1. Fig. 5e depicts a contour plot as a function of Csp (F g−1) for all the synthesized samples at current densities ranging from 0.25 to 5 A g−1. The maximum of Csp perfectly reflects all the results mentioned above. The life-time (cycling stability) of the FG-20H sample was also evaluated, as depicted in Fig. 5f. We found that Csp remains perfectly stable for 1500 cycles in a three electrode setup, indicating that the FG-20H sample can be used as a suitable candidate for supercapacitor fabrication. We have also employed a two-electrode cell in order to prove the statement about the practical applicability of the FG-20H sample. Fig. S4a† shows that the tested sample was stable for 30000 charging/discharging cycles with a capacitance retention of 96.7%. As shown in Fig. S4b–d,† two cells connected in series were also able to continuously power a red LED diode without obvious fading.
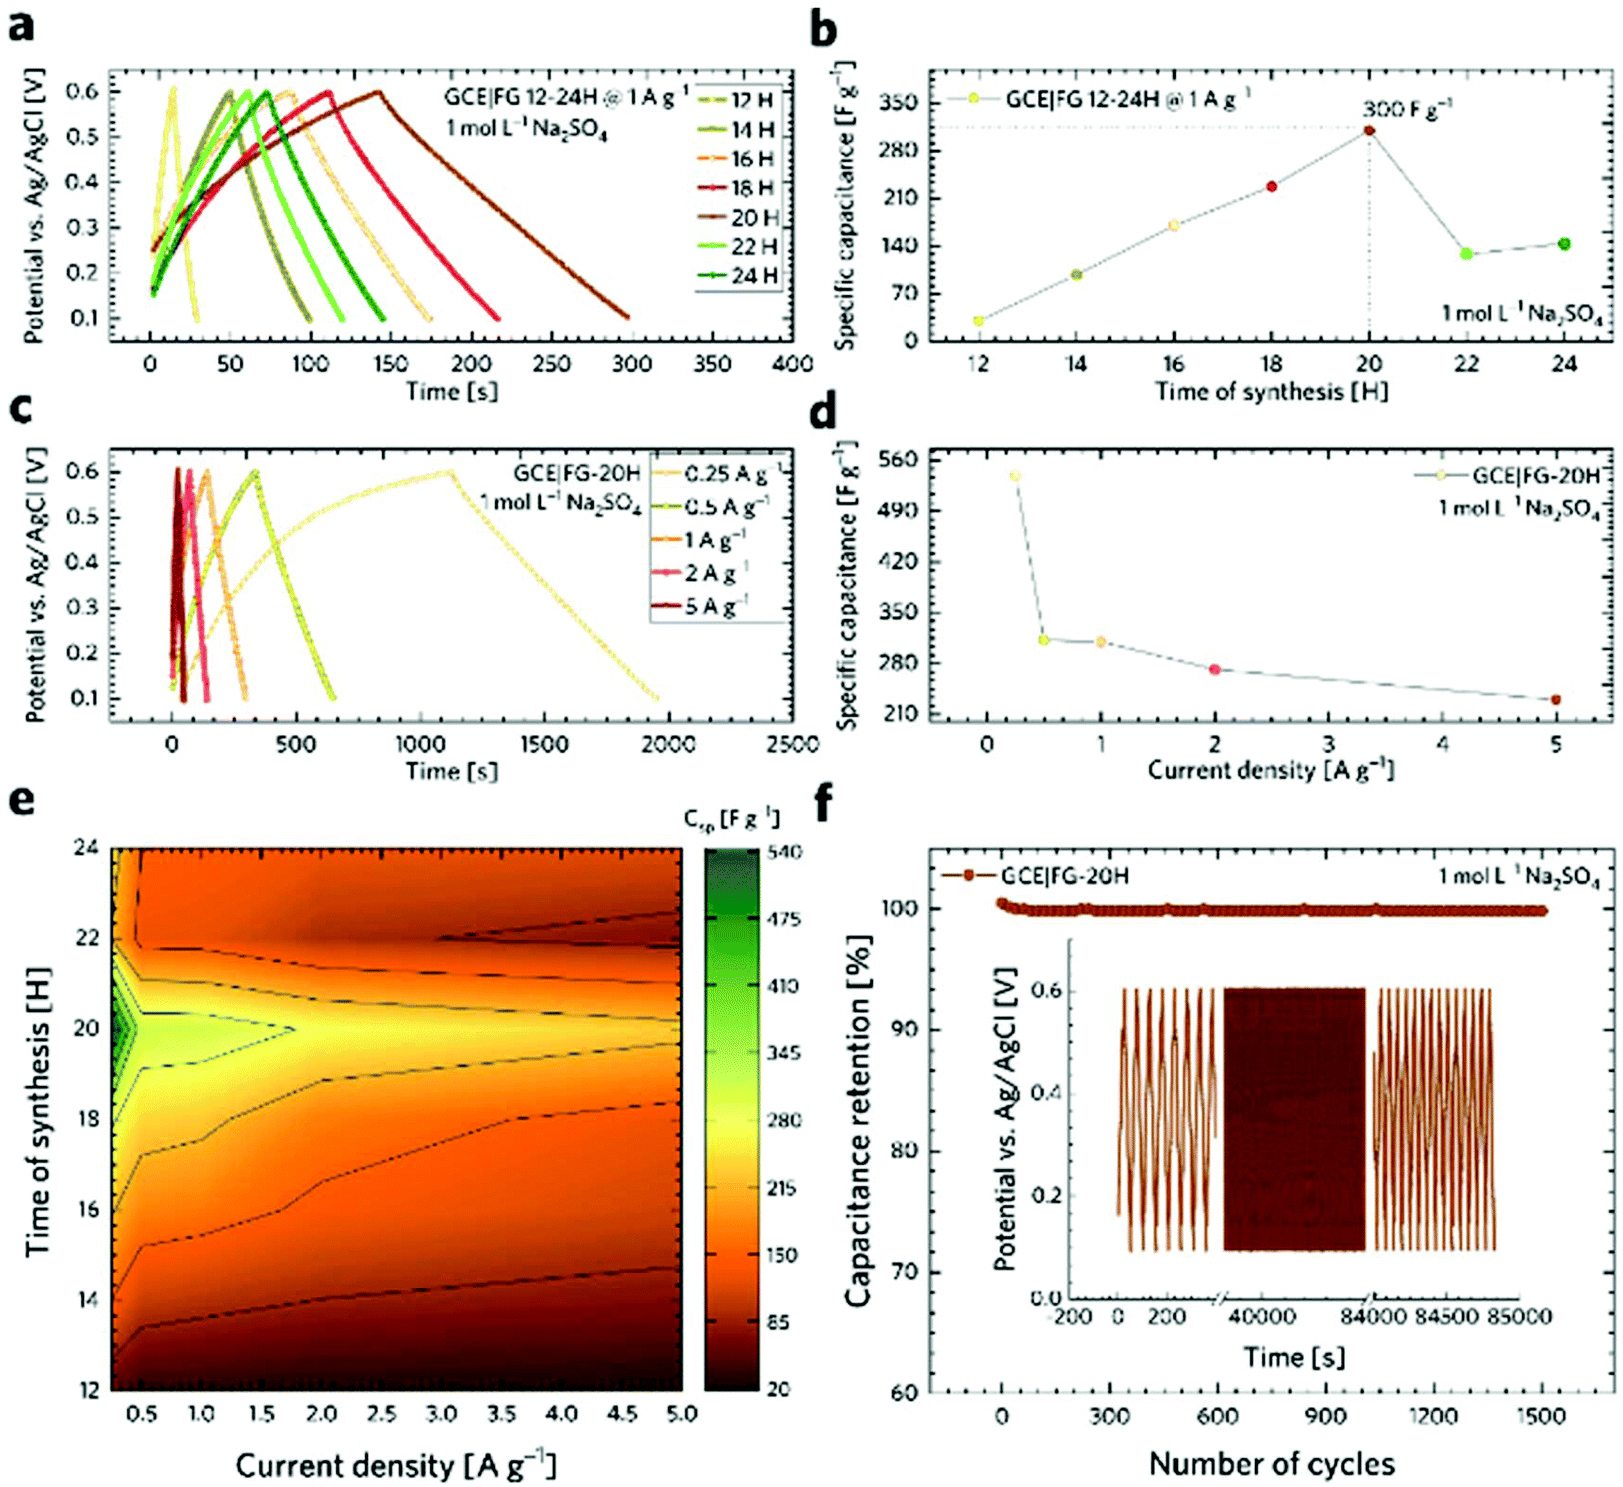 | ||
| Fig. 5 (a) Galvanostatic charge–discharge (GCD) profiles of GCEs modified with fluorographene samples prepared at a constant temperature of 450 °C at different times. (b) The trend of specific capacitance evolution in time during the FG sample synthesis. (c) The GCD curves of the FG-20H sample at different current densities ranging from 0.25 to 5 A g−1, (d) the change of specific capacitance of the FG-20H sample with increasing current density, (e) the contour plot of specific capacitance evolution in time of the FG sample recorded at different current densities. (f) Cycling stability of the FG-20H sample. All measurements were performed in 1 M Na2SO4 aqueous electrolyte. | ||
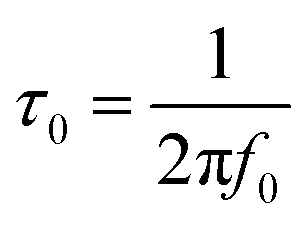
In order to gain a better insight into the electrochemical performance of fluorographene derivatives, we used the method of electrochemical impedance spectroscopy (EIS). The recorded spectra in the form of Nyquist plots (Fig. 6a) were analyzed using an equivalent circuit, as shown in Fig. 6b. As can be seen, in a high-frequency region (f < 1.2 kHz), none of the spectra exhibit a semicircle responsible for the charge-transfer resistance, Rct, indicating the good conductivity of the tested samples. It is well known that a microporous structure enables a fast ion exchange which can cause a decrease in Rct.91,92 Furthermore, the presence of the semi-ionic C–F bond can also positively influence the electronic conductivity, as previously published.66 Apart from this, the presence of the semicircle is also connected with the faradaic reaction taking place at the electrode|electrolyte interface. On the basis of this evidence, we can conclude that all the tested materials can be considered EDLC supercapacitors. Furthermore, all the impedance spectra reveal a vertical line in the low-frequency region, which signifies a good diffusive behaviour of the electrolyte ions in the system. The slope of the ∼45° line (medium frequency region; f < 1.32 Hz) describes the diffusion of ions from the electrolyte into the electrode interface, corresponding to the Warburg impedance.93,94 An almost linear vertical line in the Nyquist plot (low-frequency region, f < 0.5 Hz) indicates a good capacitive behaviour. Since the vertical line of the sample FG-20H is more parallel to the y-axis, it can be concluded that the capacitance of this sample should be higher with respect to the others. The fitted data exhibit Rct values with a decreasing trend ranging from 47.1 Ω (FG-12H) to 4.7 Ω (FG-20H), indicating an enhanced electron transfer. Furthermore, it is possible to observe an increase in the charge-transfer resistivity for the materials labelled FG-22H (24.9 Ω) and FG-24H (40.1 Ω), as shown in Fig. 6c. The trend of increasing resistivity could be related to the increase in the carbon atom content during the thermal decomposition of the fluorographene samples, which changes the type of defect responsible for the conductivity, as mentioned previously in a discussion concerning Raman spectroscopy. We also employed the Bode analysis in order to extract more details from the impedance spectra of the FG-20H sample. As can be seen in Fig. 6d, the phase angle is close to the zero at high frequencies (orange region), indicating mostly resistive properties. When the frequency decreases, the phase angle reflects a more capacitive behaviour (blue region; phase angle −45°) until reaching fully capacitive response in the mHz region (green region, phase angle −76°). It is worth noting that this value is close to −90°, which is typical of an ideal capacitor.95 The frequency at −45° should be also regarded as a point where the resistive and capacitive contribution is equal. The time constant (taken at the −45° phase angle) is the time necessary for discharging the tested material with an efficiency of 63%, and can be expressed as follows:96
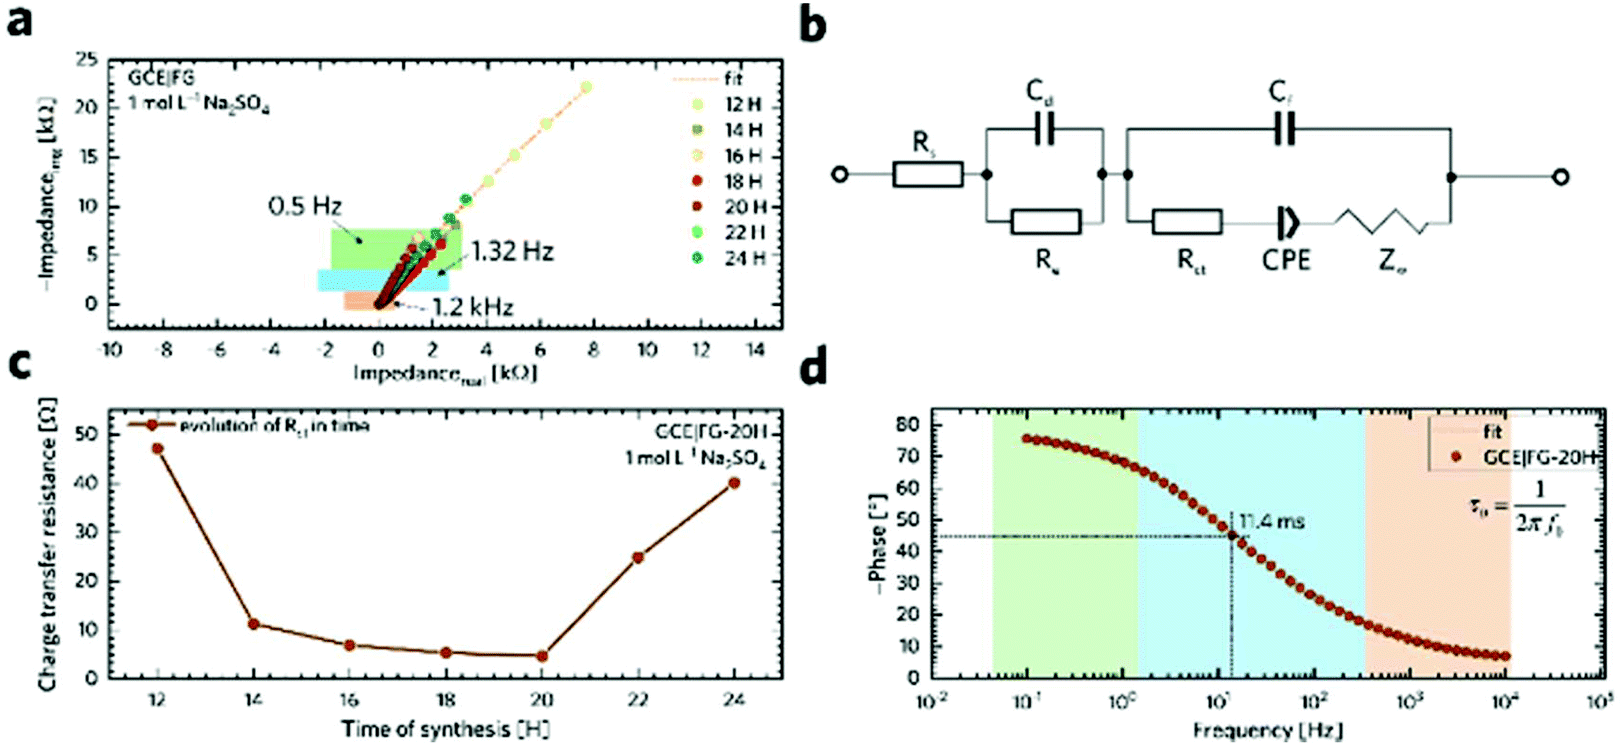 | ||
| Fig. 6 (a) Nyquist plots of GCEs modified with fluorographene samples prepared at a constant temperature of 450 °C for different times recorded in a frequency range from 0.01 Hz to 10 kHz at an open circuit potential (OCP) with 5 mV amplitude. (b) Modified Randles circuit used for data fitting. (c) The trend of Rct change in time during the FG sample synthesis. (d) Bode representation of the FG-20H sample. All measurements were performed in 1 M Na2SO4 aqueous electrolyte. | ||
Using this formula, the time constant was calculated to be 11.4 ms. This value is very promising compared to previously published results for carbon derivatives such as carbon onions.97,98 These results strongly suggest that fluorographene holds great potential as a material for supercapacitors.
Computational insights into the reaction mechanism and structure–property relationships
To rationalize experimental observations occurring during the reaction, the following mechanism can be proposed (Scheme 1). In the first phase (0–12H), defluorination under the hydrogen atmosphere is accompanied by the binding of the atomic hydrogen (produced by a side reaction of released fluorine atoms with hydrogen molecules) to the lattice. The presence of hydrogen ad-atoms is in line with a relatively high proportion of sp3 carbon atoms in the FG-12H sample. During the second phase (12–20H), the material is stabilized by a thermodynamically favourable release of hydrogen, which increases the number of sp2 carbon atoms on the lattice. Fig. S5–S7† show that this process leads to the decrease in the band gaps in agreement with the increase of the specific capacitance and decrease of the charge transfer resistance. The final phase (20–24H) is apparently connected with the disruption of the material by releasing hydrogenated/fluorinated molecular fragments reflected in the increased porosity of the material. Feasibility of the fragmentation in the final phase is demonstrated by negative reaction energies for the release of C6H6 and C6H12 fragments (Fig. S8†). The evolution of electrochemical properties might also be related to a decrease in the fluorine concentration during the second and third phase of the reaction (Table 1). To address this issue, we analyzed the band structure of various heavily defluorinated structures (see the ESI†). We found that the migration of F ad-atoms over the lattice was feasible (the energy barrier is ca. 0.87–1.05 eV) and the topology of ad-atoms can indeed significantly affect the band structure of the material (Fig. S9 and S10†). However, this mechanism on its own does not satisfactorily explain the relatively high ratio of sp3/sp2 carbon atoms in heavily defluorinated samples and its variations in the second phase of the reaction. To sum up, although the changes in the content and topology of F ad-atoms can contribute to altering the electric behavior of the samples, our calculations strongly support the above-described mechanism as the main reaction pathway, which is consistent with the experimental observations.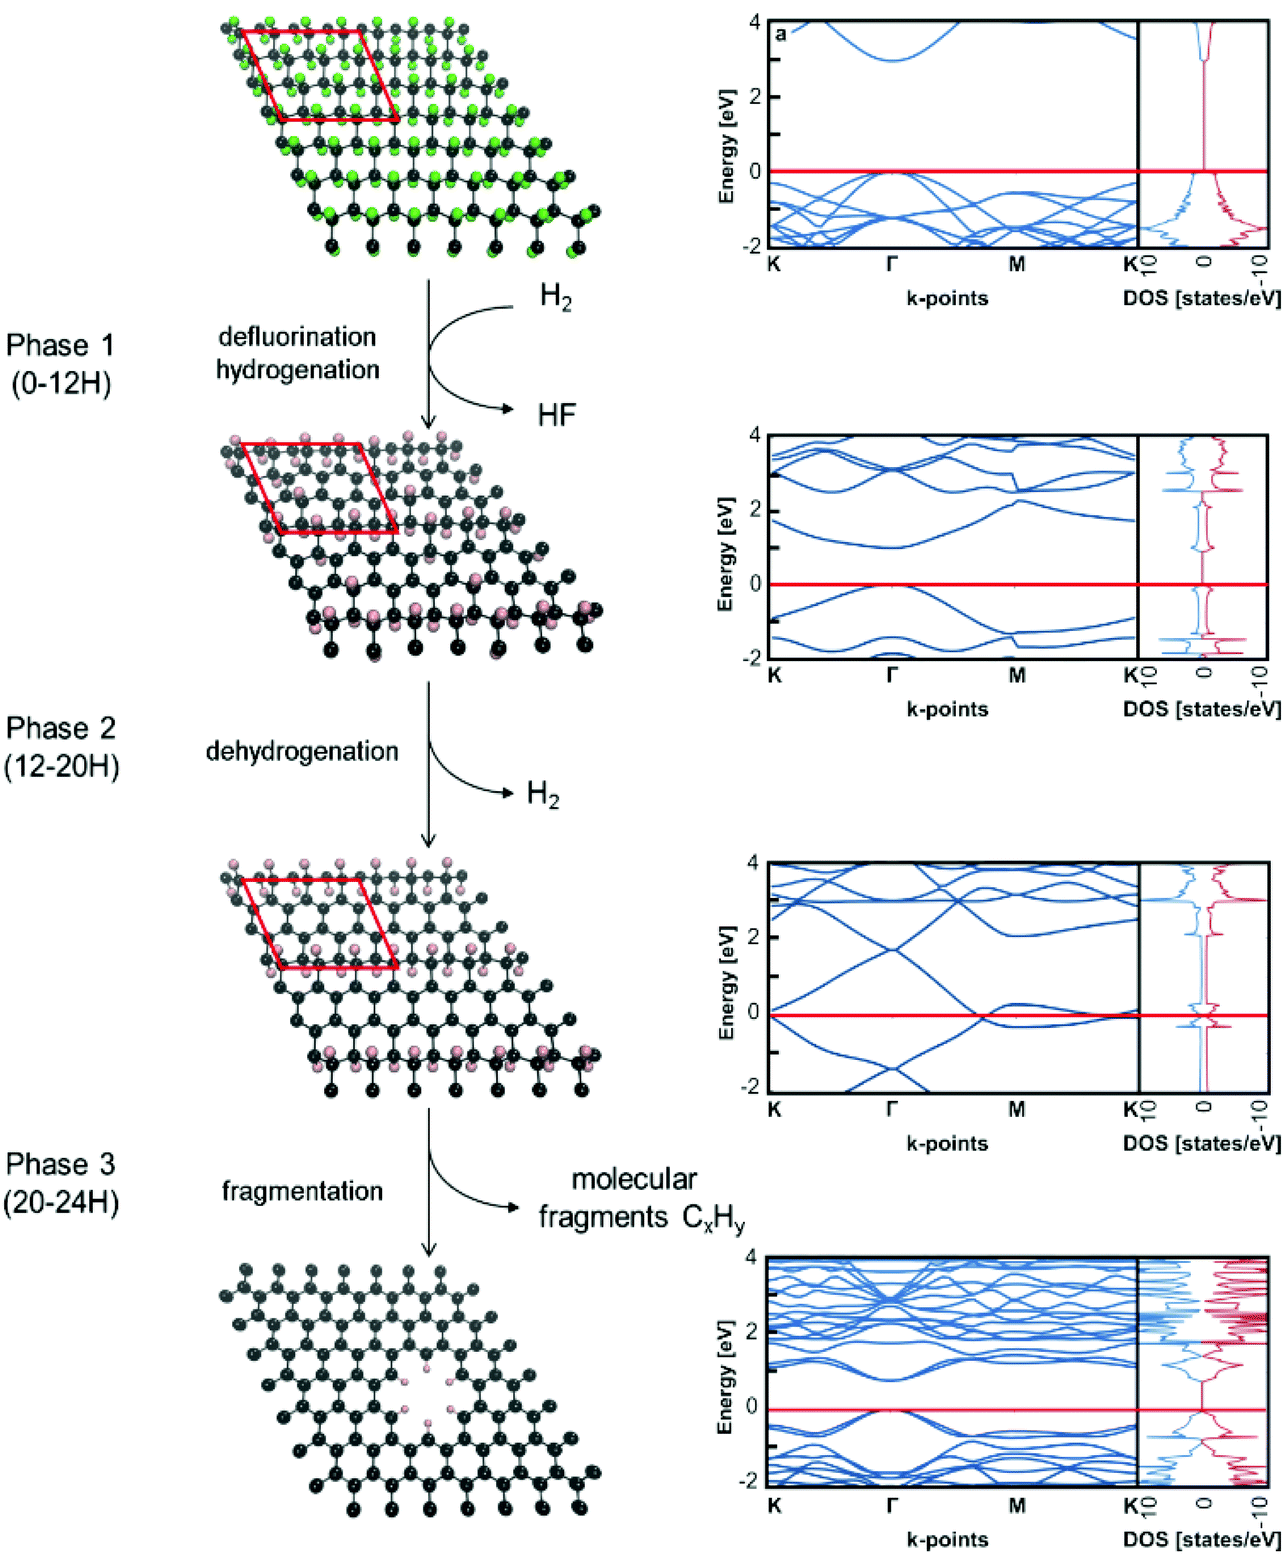 | ||
| Scheme 1 Proposed mechanism of defluorination of the fluorographene sample under a reducing hydrogen atmosphere. The Fermi level in the band structure and DOS (states per eV per computational cell) is set to zero. | ||
Conclusions
In summary, a new way of synthesis of fluorographene derivatives was developed employing a method of thermal decomposition of a fully fluorinated sample in the presence of a reducing hydrogen atmosphere. Our results demonstrate that the number of fluorine atoms attached to the surface of graphene can be easily controlled by changing time at a constant temperature of 450 °C. We have shown that the capacitance is influenced by both the number of fluorine atoms and the hydrogenation process. An optimized material exhibits values of specific capacitance up to 539 F g−1 recorded at a current density of 0.25 A g−1. The optimized material can be cycled reversibly in the voltage range of 0.1–0.6 V and exhibits excellent cycling durability, with 100% specific capacitance retention after 1500 cycles in a three-electrode configuration and 96.7% specific capacitance after 30000 cycles in a two-electrode setup. Moreover, a mechanism for charge storage was explained in detail using both experimental and theoretical approaches. The environmentally friendly nature of our derivatives (one-step synthesis without any presence of heavy metals, neutral character of the electrolyte) holds great potential in developing new kinds of supercapacitors for practical applications.
Conflicts of interest
There are no conflicts to declare.Acknowledgements
The authors gratefully acknowledge the support by the Operational Programme Research, Development and Education - European Regional Development Fund, project no. CZ.02.1.01/0.0/0.0/16_019/0000754 and CZ.02.1.01/0.0/0.0/15_003/0000416 of the Ministry of Education, Youth and Sports of the Czech Republic. The authors also gratefully acknowledge the financial support from an ERC Consolidator Grant (H2020) No. 683024 and the student project IGA_PrF_2019_031. We thank Ondřej Tomanec, Jana Stráská and Dr Eirini Ioannou, for HRTEM, TEM + SAED and SEM measurements.References
- N. S. Lewis and D. G. Nocera, Proc. Natl. Acad. Sci. U. S. A., 2006, 103, 15729–15735 CrossRef CAS PubMed
.
- L. Dai, D. W. Chang, J.-B. Baek and W. Lu, Small, 2012, 8, 1130–1166 CrossRef CAS PubMed
- A. S. Arico, P. Bruce, B. Scrosati, J. M. Tarascon and W. Van Schalkwijk, Nat. Mater., 2005, 4, 366–377 CrossRef CAS PubMed
- J. Zhang, J. Jiang, H. Li and X. S. Zhao, Energy Environ. Sci., 2011, 4, 4009 RSC
- F. Béguin, V. Presser, A. Balducci and E. Frackowiak, Adv. Mater., 2014, 26, 2219–2251 CrossRef
- G. Wang, L. Zhang and J. Zhang, Chem. Soc. Rev., 2012, 41, 797–828 RSC
- G. Yu, X. Xie, L. Pan, Z. Bao and Y. Cui, Nano Energy, 2013, 2, 213–234 CrossRef CAS
- P. J. Hall, M. Mirzaeian, S. I. Fletcher, F. B. Sillars, A. J. R. Rennie, G. O. Shitta-Bey, G. Wilson, A. Cruden and R. Carter, Energy Environ. Sci., 2010, 3, 1238 RSC
- X. Lang, A. Hirata, T. Fujita and M. Chen, Nat. Nanotechnol., 2011, 6, 232–236 CrossRef CAS PubMed
- M. Zhi, C. Xiang, J. Li, M. Li and N. Wu, Nanoscale, 2013, 5, 72–88 RSC
- V. Augustyn, P. Simon and B. Dunn, Energy Environ. Sci., 2014, 7, 1597 RSC
- E. Frackowiak, V. Khomenko, K. Jurewicz, K. Lota and F. Béguin, J. Power Sources, 2006, 153, 413–418 CrossRef CAS
- Z. Song and H. Zhou, Energy Environ. Sci., 2013, 6, 2280 RSC
- G. A. Snook, P. Kao and A. S. Best, J. Power Sources, 2011, 196, 1–12 CrossRef CAS
- J. Jiang, Y. Li, J. Liu, X. Huang, C. Yuan and X. W. D. Lou, Adv. Mater., 2012, 24, 5166–5180 CrossRef CAS PubMed
- M. Toupin, T. Brousse and D. Bélanger, Chem. Mater., 2004, 16, 3184–3190 CrossRef CAS
- D. Kong, J. Luo, Y. Wang, W. Ren, T. Yu, Y. Luo, Y. Yang and C. Cheng, Adv. Funct. Mater., 2014, 24, 3815–3826 CrossRef CAS
-
B. E. Conway, Electrochemical Supercapacitors Scientific Fundamentals and Technological Applications, Springer US, 1st edn, 1999 Search PubMed
- G. Wang, H. Wang, X. Lu, Y. Ling, M. Yu, T. Zhai, Y. Tong and Y. Li, Adv. Mater., 2014, 26, 2676–2682 CrossRef CAS
- J. Gamby, P. L. Taberna, P. Simon, J. F. Fauvarque and M. Chesneau, J. Power Sources, 2001, 101, 109–116 CrossRef CAS
- B. Li, F. Dai, Q. Xiao, L. Yang, J. Shen, C. Zhang and M. Cai, Adv. Energy Mater., 2016, 6, 1600802 CrossRef
- M. F. L. De Volder, S. H. Tawfick, R. H. Baughman and A. J. Hart, Science, 2013, 339, 535–539 CrossRef CAS PubMed
- Z. Niu, W. Zhou, X. Chen, J. Chen and S. Xie, Adv. Mater., 2015, 27, 6002–6008 CrossRef CAS PubMed
- C. Fu, A. Mahadevegowda and P. S. Grant, J. Mater. Chem. A, 2015, 3, 14245–14253 RSC
- C. Merino, P. Soto, E. Vilaplana-Ortego, J. M. Gomez de Salazar, F. Pico and J. M. Rojo, Carbon, 2005, 43, 551–557 CrossRef CAS
- C. Young, T. Park, J. W. Yi, J. Kim, Md. S. A. Hossain, Y. V. Kaneti and Y. Yamauchi, ChemSusChem, 2018, 11, 3546–3558 CrossRef CAS PubMed
- X. Xu, J. Zhou, D. H. Nagaraju, L. Jiang, V. R. Marinov, G. Lubineau, H. N. Alshareef and M. Oh, Adv. Funct. Mater., 2015, 25, 3193–3202 CrossRef CAS
- P. Hao, Z. Zhao, Y. Leng, J. Tian, Y. Sang, R. I. Boughton, C. P. Wong, H. Liu and B. Yang, Nano Energy, 2015, 15, 9–23 CrossRef CAS
- G. Zu, J. Shen, L. Zou, F. Wang, X. Wang, Y. Zhang and X. Yao, Carbon, 2016, 99, 203–211 CrossRef CAS
- X. Wei, S. Wan and S. Gao, Nano Energy, 2016, 28, 206–215 CrossRef CAS
- X.-L. Wu, T. Wen, H.-L. Guo, S. Yang, X. Wang and A.-W. Xu, ACS Nano, 2013, 7, 3589–3597 CrossRef CAS
- M. Oschatz, S. Boukhalfa, W. Nickel, J. P. Hofmann, C. Fischer, G. Yushin and S. Kaskel, Carbon, 2017, 113, 283–291 CrossRef CAS
- V. Presser, M. Heon and Y. Gogotsi, Adv. Funct. Mater., 2011, 21, 810–833 CrossRef CAS
- H. Su, H. Huang, H. Zhang, X. Chu, B. Zhang, B. Gu, X. Zheng, S. Wu, W. He, C. Yan, J. Chen and W. Yang, ACS Appl. Energy Mater., 2018, 1, 3544–3553 CrossRef CAS
- L. Dai, Acc. Chem. Res., 2013, 46, 31–42 CrossRef CAS PubMed
- Y. Wang, Z. Shi, Y. Huang, Y. Ma, C. Wang, M. Chen and Y. Chen, J. Phys. Chem. C, 2009, 113, 13103–13107 CrossRef CAS
- T. Kuila, S. Bose, A. K. Mishra, P. Khanra, N. H. Kim and J. H. Lee, Prog. Mater. Sci., 2012, 57, 1061–1105 CrossRef CAS
- Y. Wang, Y. Wu, Y. Huang, F. Zhang, X. Yang, Y. Ma and Y. Chen, J. Phys. Chem. C, 2011, 115, 23192–23197 CrossRef CAS
- H. Jiang, P. S. Lee and C. Li, Energy Environ. Sci., 2013, 6, 41–53 RSC
- S. Han, D. Wu, S. Li, F. Zhang and X. Feng, Adv. Mater., 2014, 26, 849–864 CrossRef CAS
- L. Qie, W. Chen, H. Xu, X. Xiong, Y. Jiang, F. Zou, X. Hu, Y. Xin, Z. Zhang and Y. Huang, Energy Environ. Sci., 2013, 6, 2497 RSC
- A. Borenstein, O. Hanna, R. Attias, S. Luski, T. Brousse and D. Aurbach, J. Mater. Chem. A, 2017, 5, 12653–12672 RSC
- X. Yu, Y. Kang and H. S. Park, Carbon, 2016, 101, 49–56 CrossRef CAS
- N. Parveen, M. O. Ansari, S. A. Ansari and M. H. Cho, J. Mater. Chem. A, 2016, 4, 233–240 RSC
- P. Chen, J.-J. Yang, S.-S. Li, Z. Wang, T.-Y. Xiao, Y.-H. Qian and S.-H. Yu, Nano Energy, 2013, 2, 249–256 CrossRef CAS
- Z.-S. Wu, G. Zhou, L.-C. Yin, W. Ren, F. Li and H.-M. Cheng, Nano Energy, 2012, 1, 107–131 CrossRef CAS
- Y. Zhang, L. Li, H. Su, W. Huang and X. Dong, J. Mater. Chem. A, 2015, 3, 43–59 RSC
- Y. Yan, B. Li, W. Guo, H. Pang and H. Xue, J. Power Sources, 2016, 329, 148–169 CrossRef
- P. Pachfule, D. Shinde, M. Majumder and Q. Xu, Nat. Chem., 2016, 8, 718–724 CrossRef CAS PubMed
- W. Xia, C. Qu, Z. Liang, B. Zhao, S. Dai, B. Qiu, Y. Jiao, Q. Zhang, X. Huang, W. Guo, D. Dang, R. Zou, D. Xia, Q. Xu and M. Liu, Nano Lett., 2017, 17, 2788–2795 CrossRef CAS
- X. Cao, B. Zheng, X. Rui, W. Shi, Q. Yan and H. Zhang, Angew. Chem., Int. Ed., 2014, 53, 1404–1409 CrossRef CAS
- Y. Yan, P. Gu, S. Zheng, M. Zheng, H. Pang and H. Xue, J. Mater. Chem. A, 2016, 4, 19078–19085 RSC
- Y. Yan, Y. Luo, J. Ma, B. Li, H. Xue and H. Pang, Small, 2018, 14, 1801815 CrossRef PubMed
- Y. Xu, B. Li, S. Zheng, P. Wu, J. Zhan, H. Xue, Q. Xu and H. Pang, J. Mater. Chem. A, 2018, 6, 22070–22076 RSC
- V. Georgakilas, M. Otyepka, A. B. Bourlinos, V. Chandra, N. Kim, K. C. Kemp, P. Hobza, R. Zboril and K. S. Kim, Chem. Rev., 2012, 112, 6156–6214 CrossRef CAS PubMed
- D. D. Chronopoulos, A. Bakandritsos, M. Pykal, R. Zbořil and M. Otyepka, Appl. Mater. Today, 2017, 9, 60–70 CrossRef PubMed
- V. Georgakilas, J. N. Tiwari, K. C. Kemp, J. A. Perman, A. B. Bourlinos, K. S. Kim and R. Zboril, Chem. Rev., 2016, 116, 5464–5519 CrossRef CAS PubMed
- H. L. Poh, P. Šimek, Z. Sofer and M. Pumera, Chem. – Eur. J., 2013, 19, 2655–2662 CrossRef CAS PubMed
- E. Widenkvist, D. W. Boukhvalov, S. Rubino, S. Akhtar, J. Lu, R. A. Quinlan, M. I. Katsnelson, K. Leifer, H. Grennberg and U. Jansson, J. Phys. D: Appl. Phys., 2009, 42, 112003 CrossRef
- J. Zhou, J. Lian, L. Hou, J. Zhang, H. Gou, M. Xia, Y. Zhao, T. A. Strobel, L. Tao and F. Gao, Nat. Commun., 2015, 6, 8503 CrossRef CAS PubMed
- Y. Zhu, H. Cui, X. Meng, J. Zheng, P. Yang, L. Li, Z. Wang, S. Jia and Z. Zhu, ACS Appl. Mater. Interfaces, 2016, 8, 6481–6487 CrossRef CAS PubMed
- F. Karlický, K. Kumara Ramanatha Datta, M. Otyepka and R. Zbořil, ACS Nano, 2013, 7, 6434–6464 CrossRef PubMed
- Z. Kou, B. Guo, Y. Zhao, S. Huang, T. Meng, J. Zhang, W. Li, I. S. Amiinu, Z. Pu, M. Wang, M. Jiang, X. Liu, Y. Tang and S. Mu, ACS Appl. Mater. Interfaces, 2017, 9, 3702–3712 CrossRef CAS PubMed
- K. Kakaei, M. Hamidi and S. Husseindoost, J. Colloid Interface Sci., 2016, 479, 121–126 CrossRef CAS PubMed
- X. Ye, Y. Zhu, H. Jiang, L. Wang, P. Zhao, Z. Yue, Z. Wan and C. Jia, Chem. Eng. J., 2019, 361, 1437–1450 CrossRef CAS
- H. An, Y. Li, P. Long, Y. Gao, C. Qin, C. Cao, Y. Feng and W. Feng, J. Power Sources, 2016, 312, 146–155 CrossRef CAS
- L. G. Bulusheva, V. A. Tur, E. O. Fedorovskaya, I. P. Asanov, D. Pontiroli, M. Riccò and A. V. Okotrub, Carbon, 2014, 78, 137–146 CrossRef CAS
-
J. Rouquerol, F. Rouquerol, P. Llewellyn, G. Maurin and K. S. W. Sing, Adsorption by Powders and Porous Solids: Principles, Methodology and Applications, Elsevier Science, 2013 Search PubMed
- J. P. Perdew, K. Burke and M. Ernzerhof, Phys. Rev. Lett., 1996, 77, 3865–3868 CrossRef CAS
- P. E. Blöchl, Phys. Rev. B: Condens. Matter Mater. Phys., 1994, 50, 17953–17979 CrossRef
- G. Kresse and D. Joubert, Phys. Rev. B: Condens. Matter Mater. Phys., 1999, 59, 1758–1775 CrossRef CAS
- G. Kresse and J. Furthmüller, Phys. Rev. B: Condens. Matter Mater. Phys., 1996, 54, 11169–11186 CrossRef CAS PubMed
- G. Kresse and J. Furthmüller, Comput. Mater. Sci., 1996, 6, 15–50 CrossRef CAS
- H. J. Monkhorst and J. D. Pack, Phys. Rev. B: Solid State, 1976, 13, 5188–5192 CrossRef
- A. Gupta, G. Chen, P. Joshi, S. Tadigadapa and P. C. Eklund, Nano Lett., 2006, 6, 2667–2673 CrossRef CAS
- A. C. Ferrari, Solid State Commun., 2007, 143, 47–57 CrossRef CAS
- A. C. Ferrari, J. C. Meyer, V. Scardaci, C. Casiraghi, M. Lazzeri, F. Mauri, S. Piscanec, D. Jiang, K. S. Novoselov, S. Roth and A. K. Geim, Phys. Rev. Lett., 2006, 97(18), 187401 CrossRef CAS
- A. Eckmann, A. Felten, A. Mishchenko, L. Britnell, R. Krupke, K. S. Novoselov and C. Casiraghi, Nano Lett., 2012, 12, 3925–3930 CrossRef CAS
- M. Herraiz, M. Dubois, N. Batisse, S. Hajjar-Garreau and L. Simon, Dalton Trans., 2018, 47, 4596–4606 RSC
- M. Dubois, K. Guérin, Y. Ahmad, N. Batisse, M. Mar, L. Frezet, W. Hourani, J.-L. Bubendorff, J. Parmentier, S. Hajjar-Garreau and L. Simon, Carbon, 2014, 77, 688–704 CrossRef CAS
- W. Lai, D. Xu, X. Wang, Z. Wang, Y. Liu, X. Zhang and X. Liu, Phys. Chem. Chem. Phys., 2017, 19, 19442–19451 RSC
- C. Sun, Y. Feng, Y. Li, C. Qin, Q. Zhang and W. Feng, Nanoscale, 2014, 6, 2634–2641 RSC
- X. Yin, Y. Feng, Q. Zhao, Y. Li, S. Li, H. Dong, W. Hu and W. Feng, J. Mater. Chem. C, 2018, 6, 6378–6384 RSC
- R. R. Nair, W. Ren, R. Jalil, I. Riaz, V. G. Kravets, L. Britnell, P. Blake, F. Schedin, A. S. Mayorov, S. Yuan, M. I. Katsnelson, H. M. Cheng, W. Strupinski, L. G. Bulusheva, A. V. Okotrub, I. V. Grigorieva, A. N. Grigorenko, K. S. Novoselov and A. K. Geim, Small, 2010, 6, 2877–2884 CrossRef CAS PubMed
- W. Feng, P. Long, Y. Feng and Y. Li, Adv. Sci., 2016, 3, 1500413 CrossRef
- H. Lindström, S. Södergren, A. Solbrand, H. Rensmo, J. Hjelm, A. Hagfeldt and S.-E. Lindquist, J. Phys. Chem. B, 1997, 101, 7717–7722 CrossRef
- J. Wang, J. Polleux, J. Lim and B. Dunn, J. Phys. Chem. C, 2007, 111, 14925–14931 CrossRef CAS
- S. Cho, K.-H. Shin and J. Jang, ACS Appl. Mater. Interfaces, 2013, 5, 9186–9193 CrossRef CAS PubMed
- K. Xia, Z. Huang, L. Zheng, B. Han, Q. Gao, C. Zhou, H. Wang and J. Wu, J. Power Sources, 2017, 365, 380–388 CrossRef CAS
- Z. Chen, L. Hou, Y. Cao, Y. Tang and Y. Li, Appl. Surf. Sci., 2018, 435, 937–944 CrossRef CAS
- C. Largeot, C. Portet, J. Chmiola, P.-L. Taberna, Y. Gogotsi and P. Simon, J. Am. Chem. Soc., 2008, 130, 2730–2731 CrossRef CAS PubMed
- R. K. Kalluri, M. M. Biener, M. E. Suss, M. D. Merrill, M. Stadermann, J. G. Santiago, T. F. Baumann, J. Biener and A. Striolo, Phys. Chem. Chem. Phys., 2013, 15, 2309 RSC
- M. Li, C. Liu, H. Cao, H. Zhao, Y. Zhang and Z. Fan, J. Mater. Chem. A, 2014, 2, 14844 RSC
- S. Buller, M. Thele, R. W. A. A. DeDoncker and E. Karden, IEEE Trans. Ind. Appl., 2005, 41, 742–747 CrossRef CAS
- J. Zhang and X. S. Zhao, ChemSusChem, 2012, 5, 818–841 CrossRef CAS PubMed
- A. Noori, M. F. El-Kady, M. S. Rahmanifar, R. B. Kaner and M. F. Mousavi, Chem. Soc. Rev., 2019, 48, 1272–1341 RSC
- D. Pech, M. Brunet, H. Durou, P. Huang, V. Mochalin, Y. Gogotsi, P.-L. Taberna and P. Simon, Nat. Nanotechnol., 2010, 5, 651–654 CrossRef CAS PubMed
- B. Abdulhakeem, B. Farshad, M. Damilola, T. Fatemeh, F. Mopeli, D. Julien and M. Ncholu, RSC Adv., 2014, 4, 39066 RSC
Footnote |
| † Electronic supplementary information (ESI) available: BET analysis, The plot of logi vs. logν of the FG-20H sample, HR-XPS spectra of C 1s derived from FG-12H and FG-24H samples, LED diode + life-time stability test, theoretical calculations. See DOI: 10.1039/c9nr07255a |
| This journal is © The Royal Society of Chemistry 2019 |