
 Open Access Article
 This Open Access Article is licensed under a
 Creative Commons Attribution 3.0 Unported Licence
Elucidating ligand effects in thiolate-protected metal clusters using Au24Pt(TBBT)18 as a model cluster†
Sakiat
Hossain
 a,
Yukari
Imai
a,
Daiki
Suzuki
a,
Woojun
Choi
b,
Zhaoheng
Chen
a,
Taiyo
Suzuki
a,
Mahiro
Yoshioka
a,
Tokuhisa
Kawawaki
ac,
Dongil
Lee
*b and
Yuichi
Negishi
*ac
a,
Yukari
Imai
a,
Daiki
Suzuki
a,
Woojun
Choi
b,
Zhaoheng
Chen
a,
Taiyo
Suzuki
a,
Mahiro
Yoshioka
a,
Tokuhisa
Kawawaki
ac,
Dongil
Lee
*b and
Yuichi
Negishi
*ac
aDepartment of Applied Chemistry, Faculty of Science, Tokyo University of Science, 1-3 Kagurazaka, Shinjuku-ku, Tokyo 162-8601, Japan. E-mail: negishi@rs.kagu.tus.ac.jp
bDepartment of Chemistry, Yonsei University, Seoul 03722, Korea. E-mail: dongil@yonsei.ac.kr
cPhotocatalysis International Research Center, Tokyo University of Science, 2641 Yamazaki, Noda, Chiba 278-8510, Japan
First published on 16th October 2019
Abstract
2-Phenylethanethiolate (PET) and 4-tert-butylbenzenethiolate (TBBT) are the most frequently used ligands in the study of thiolate (SR)-protected metal clusters. However, the effect of difference in the functional group between these ligands on the fundamental properties of the clusters has not been clarified. We synthesized [Au24Pt(TBBT)18]0, which has the same number of metal atoms, number of ligands, and framework structure as [Au24Pt(PET)18]0, by replacing ligands of [Au24Pt(PET)18]0 with TBBT. It was found that this ligand exchange is reversible unlike the case of other metal-core clusters. A comparison of the geometrical/electronic structure and stability of the clusters between [Au24Pt(PET)18]0 and [Au24Pt(TBBT)18]0 revealed three things with regard to the effect of ligand change from PET to TBBT on [Au24Pt(SR)18]0: (1) the induction of metal-core contraction and Au–S bond elongation, (2) no substantial effect on the HOMO–LUMO gap but a clear difference in optical absorption in the visible region, and (3) the decrease of stabilities against degradation in solution and under laser irradiation. By using these two clusters as model clusters, it is expected that the effects of the structural difference of ligand functional-groups on the physical properties and functions of clusters, such as catalytic ability and photoluminescence, would be clarified.
Introduction
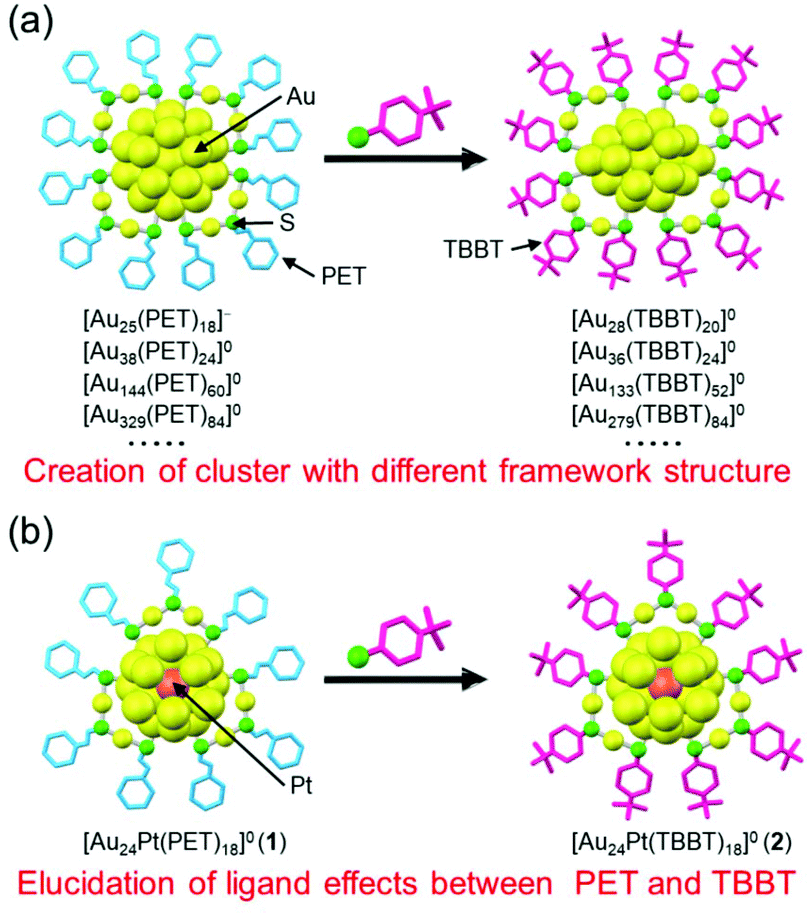
When a metal is reduced to fine particles of ∼1 nm in diameter, the particles exhibit physical and chemical properties and functions that are different from ordinary metals. These physical and chemical properties and functions change significantly depending on the number of constituent atoms. Metal clusters with these characteristics are expected to be applied in diverse fields, such as energy, environment, and medical care.To control the physical and chemical properties of such metal clusters, synthesis with atomic precision is essential. Thiolates (SRs),1–19 selenolates,20,21 alkynylates groups,22 phosphines,23,24 and carbon monoxide25,26 can be used as ligands, and then metal clusters can be synthesized with atomic precision. Among them, thiolate-protected gold clusters (Aun(SR)m) have a high stability in the solution and solid state, and exhibit multiple physical/chemical properties and functions that are suitable for application including photoluminescence, redox behavior, and catalysis.27 For these reasons, Aun(SR)m clusters have been the subject of increasing research in recent years.5
In the study of Aun(SR)m clusters, when 2-phenylethanethiolate (PET; Scheme S1(a)†) or 4-tert-butylbenzenethiolate (TBBT; Scheme S1(b)†) is used as a ligand, the single crystallization of clusters is relatively easy and the determination of the geometrical structure of Aun(SR)m clusters is possible by single-crystal X-ray diffraction analysis (SCXRD).28,29 Therefore, to understand the correlation between the chemical composition and geometrical structure and that between geometrical structure and physical properties, PET and TBBT have been the two most commonly used ligands in the study of Aun(SR)m clusters. Because these SRs have substantially different functional groups (Scheme S1†), the resulting Aun(SR)m clusters have different chemical compositions and geometrical structures.28,29 For example, when PET is used as the ligand, Aun(PET)m clusters, such as [Au25(PET)18]−, [Au38(PET)24]0, [Au52(PET)32]0, [Au144(PET)60]0, and [Au329(PET)84]0, are formed, whereas, in the case of TBBT, Aun(TBBT)m clusters, such as [Au28(TBBT)20]0, [Au36(TBBT)24]0, [Au52(TBBT)32]0, [Au133(TBBT)52]0, and [Au279(TBBT)84]0, are generated. The numbers of gold atoms and ligands are the same in [Au52(PET)32]0 and [Au52(TBBT)32]0, but their framework structures are significantly different.30,31 Aun(SR)m clusters with various chemical compositions and geometrical structures have been synthesized by using a number of such ligands that are suitable for single crystallization (Fig. 1(a)).
 | ||
| Fig. 1 Comparison between (a) previous work and (b) this work. | ||
In addition to the chemical composition of the cluster, the stability, electronic structure, and functions of Aun(SR)m clusters change depending on the functional-group structure of the ligand.9,28–42 For example, it has been demonstrated that properties of Au25(SR)18, such as the stability in solution, reducibility, dissociation pattern under laser irradiation, quantum yield of photoluminescence, and catalytic activity, along with other properties, differ depending on the functional-group structure of the ligand. Therefore, the selection of the ligand functional group is essential in the functionalization of Aun(SR)m clusters. Although PET and TBBT are the most frequently used ligands when studying Aun(SR)m clusters, the effects of the ligand type (difference in functional group) on the electronic structure, stability, and function of Aun(SR)m clusters are not well-known. To obtain detailed information regarding the effects of these different uses, it is essential to synthesize Aun(SR)m clusters with the same number of metal atoms, number of ligands, and framework structure using PET and TBBT. However, no reports exist on the synthesis of the pair of Aun(SR)m clusters described above.
The difference in bulkiness of the functional groups of the two ligands is closely related to this reason. In general, the Aun(TBBT)m clusters are synthesized by replacing the PET ligand of the Aun(PET)m clusters with TBBT via a ligand-exchange reaction.43–46 Because TBBT has a bulky phenyl group next to S, unlike PET (Scheme S1†), an increase in the number of exchanged ligands in this reaction causes repulsion between the phenyl groups at the cluster surface, which result in stress induction on the framework structure of the cluster. As a result, ligand exchange from PET to TBBT causes changes in the chemical composition and framework structure of the cluster (Fig. 1(a)).43 Thus, it can be presumed that to synthesize the pair of Aun(SR)m clusters using PET and TBBT, it is necessary to use a cluster with a strong metal framework that can withstand the stress induced by repulsion between the ligands, as a precursor. Previous studies have shown that when the central atom of Au25(SR)18 (SR = PET or 1-dodecanethioate) is replaced with palladium (Pd) or platinum (Pt) ([Au24M(SR)18]0; M = Pd or Pt), the framework structure of the cluster becomes stronger.47,48 Furthermore, recent studies have revealed that this type of central-atom substitution can create an electrochemical catalyst with a high hydrogen-generation ability.8,49
The purpose of this study was to: (1) synthesize metal clusters with the same number of metal atoms, number of ligands, and framework structure using PET and TBBT; and (2) elucidate the effect of the difference in functional groups between PET and TBBT on the cluster through a direct comparison of the geometrical/electronic structure and stability between the obtained pair of clusters (Fig. 1(b)). To this end, we exchanged the ligand of [Au24Pt(PET)18]0 from PET to TBBT. Consequently, we synthesized [Au24Pt(TBBT)18]0 with the same number of metal atoms, number of ligands, and framework structures as [Au24Pt(PET)18]0. We found that this ligand exchange is reversible unlike the case of other metal-core clusters. For the two [Au24Pt(SR)18]0 (SR = PET or TBBT) obtained in this way, we studied their geometrical/electronic structure and stability. We could clarify details on the effect of differences between the two functional groups on the geometrical structure, optical absorption, electrochemical properties, stability in solution, and that against laser irradiation.
Results and discussion
Synthesis of [Au24Pt(TBBT)18]0
The objective cluster was synthesized by stirring [Au24Pt(PET)18]0 (cluster 1) (Fig. S1 and Scheme S2(a)†) and 4-tert-butylbenzenethiol in toluene to exchange the ligand of the cluster from PET to TBBT. After the reaction was completed, excess thiol and by-products were removed from the product by washing with methanol, and the product purity was further improved by thin-layer chromatography (TLC; Fig. S2 and Scheme S2(b)†).Fig. 2(a) shows the optical absorption spectrum of the obtained product (cluster 2). In the absorption spectrum, peaks appear at approximately 1125 and 630 nm. Overall, the characteristics of this absorption spectrum are similar to those of cluster 1.48Fig. 2(b) shows the negative-ion electrospray ionization (ESI) mass spectrum of cluster 2. In the mass spectrum, a peak that is attributed to [Au24Pt(TBBT)18]2− appeared at m/z = 3948.2 (inset of Fig. 2(b)). In the positive-ion ESI mass spectrum of cluster 2, which included Cs+ in the solution, a peak that is attributed to [Au24Pt(TBBT)18Cs2]2+ appeared at m/z = 4081.2 as a main peak (Fig. S3†). In the X-ray photoelectron spectrum of cluster 2, a weak-intensity peak that is attributed to Pt 4f7/2 and 4f5/2 was observed at around 75.4 and 79.2 eV, respectively (Fig. S4†). In the reversed-phase high-performance liquid chromatogram (HPLC), a single sharp peak was observed at the retention time that is expected for the neutral cluster (Fig. S5†). These results show that a neutral [Au24Pt(TBBT)18]0 with the same number of metal atoms, number of ligands, and charge state as cluster 1 was synthesized.
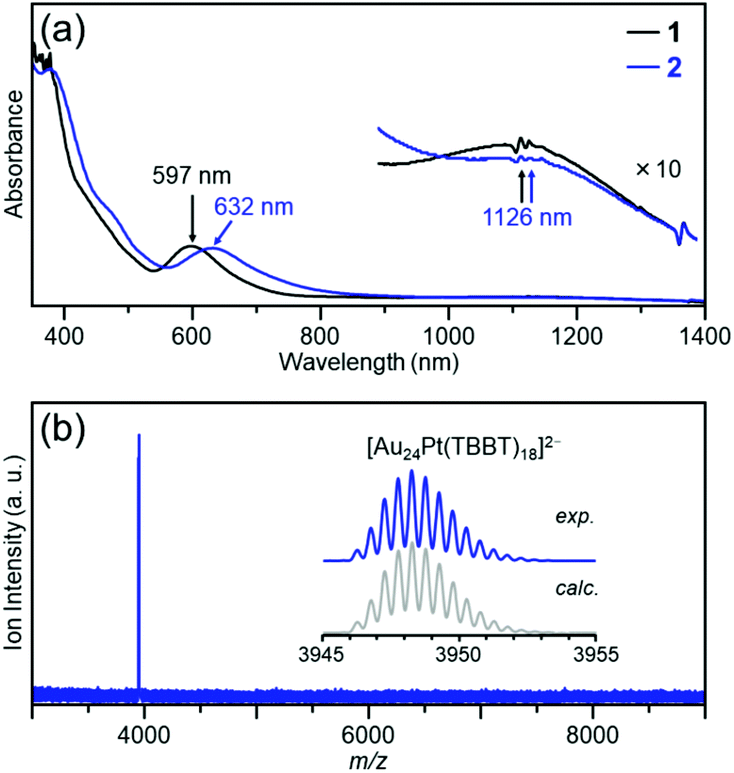 | ||
| Fig. 2 Characterization of the product (cluster 2); (a) optical absorption spectrum and (b) negative-ion ESI mass spectrum. In (a), optical absorption spectrum of cluster 1 is also shown for comparison purpose. In (b), cluster 2 was ionized to di-anion [Au24Pt(TBBT)18]2− during electrospraying. This ionization of the cluster is often observed in the literature.49 | ||
To confirm that cluster 2 has a framework structure which is similar to that of cluster 1, we determined the geometrical structure of cluster 2via SCXRD. We used a slow evaporation method for crystallization and obtained dark-green single crystals (Fig. S6†). Fig. 3 shows the overall structure of cluster 2 that was determined by SCXRD. Cluster 2 has a geometrical structure in which six Au2(TBBT)3 staples surround an icosahedral Au12Pt core. This geometry is similar to that of cluster 1.50
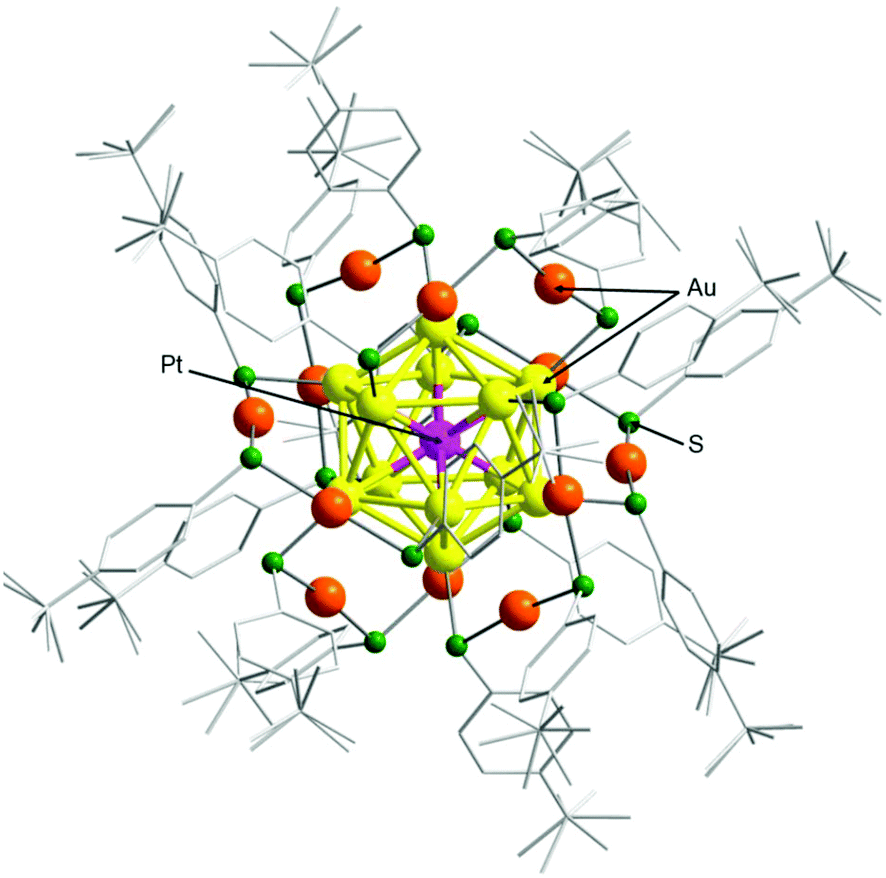 | ||
| Fig. 3 Geometrical structure determined by SCXRD for cluster 2. In the crystal, the counter anion was not observed, which is consistent with the interpretation that the product was neutral [Au24Pt(TBBT)18]0. | ||
Unfortunately, it is challenging to determine the position of Pt using only SCXRD in this geometrical structure. Pt belongs to the same period as Au in the periodic table, and both elements have similar electron numbers (Pt; 78, Au; 79). Because the elements are discriminated by electron density in SCXRD, it is difficult to distinguish Pt from Au, which have very similar electron densities. However, for [Au24Pt(SR)18]0, density functional theory (DFT) calculations predicted that the geometrical structure in which Pt is located at the center of the metal core is thermodynamically most stable.51 The optical absorption spectrum of cluster 1 is similar to the theoretical absorption spectrum that is predicted for [Au24Pt(SR)18]0 with the geometry described above.48 The optical absorption spectrum of cluster 2 is similar to that of cluster 1 (Fig. 2(a)). These results indicate that Pt is located at the center of the metal core in cluster 2 (Fig. 3).
We found that cluster 2 can be returned to cluster 1 by a reaction between cluster 2 and 2-phenylethanethiol (Fig. 4). PET and TBBT have different functional-group structures and charge states52 of S. However, this result demonstrates that when both clusters have a similar framework structure, the ligand exchange from TBBT to PET is also possible similar to that from PET to TBBT.
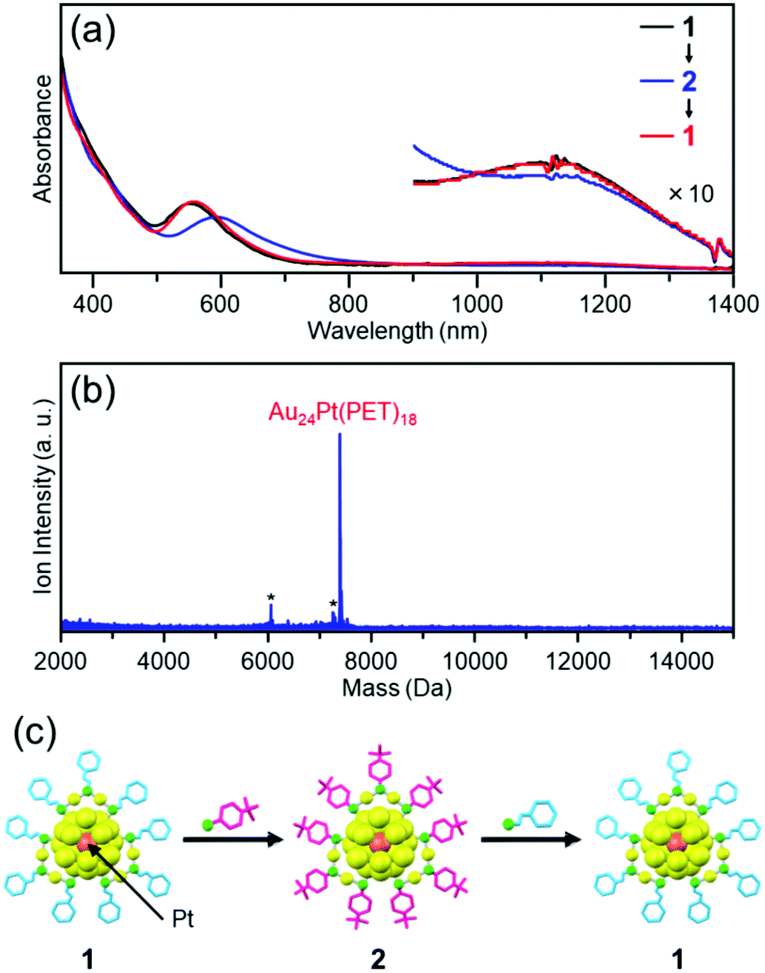 | ||
| Fig. 4 Reaction of cluster 2 with 2-phenylethanethiol. (a) Optical absorption spectrum of the product with those of cluster 1 and starting cluster 2. (b) Negative-ion MALDI mass spectrum of the product. (c) Schematic of the reversibility of the reaction. In (b), the asterisks indicate laser-fragments (see Fig. 9). | ||
In this way, we succeeded in exchanging the PET ligand with TBBT while maintaining the number of metal atoms, the number of ligands, and the framework structure of cluster 1. As described above, in the reaction between an Aun(PET)m cluster and 4-tert-butylbenzenethiol, changes commonly occur in the number of metal atoms, number of ligands, and/or framework structure of the cluster with the number of exchanged ligands (Fig. 1(a)).28,29,43–46 In this work, we have succeeded in preventing the deformation of the framework structure by using cluster 1, which has a strong metal framework, as a precursor cluster.
Several examples exist in the syntheses of a pair of Aun(SR)m clusters using PET and TBBT, such as [Au20(SR)16]0 and [Au52(SR)32]0.30,31,53,54 However, for [Au20(SR)16]0, the geometrical structure of [Au20(PET)16]0 has not yet been clarified experimentally.55 Regarding [Au52(SR)32]0, as described above, the framework structures of [Au52(PET)32]0 and [Au52(TBBT)32]0 are different.30,31 In contrast, cluster 2 has the same framework structure as cluster 1. By using these two clusters, it is possible to elucidate the effect of the difference in the functional group between PET and TBBT on the structure, stability, and physical and chemical properties of the clusters.
Ligand effects
By using clusters 1 and 2, the effects of the difference in functional group between PET and TBBT on the geometric structure, electronic structure, and stability of Aun(SR)m clusters were investigated.Fig. 5(a) compares the Pt–Ausurf (Ausurf is Au of the metal core surface) bond lengths between clusters 1 and 2.50 As described below, in both cases, the geometrical structure is distorted owing to the Jahn–Teller effect.56 Because of the resulting strain, for cluster 1, twelve bond lengths are distributed continuously in a bond-length range of 2.76–2.80 Å. However, in cluster 2, the twelve bonds are divided into two types of bond lengths, six are approximately 2.76 Å and the remaining six are approximately 2.79 Å. Similar differences in distributions of bond lengths were observed in the bond-length distribution of the Ausurf–Ausurf (Fig. 5(b)), the Ausurf–Ssurf (Fig. 5(c); Ssurf is S bonded to Ausurf), the S–C (Fig. 5(d), Ausurf–Austaple (Fig. S7(a) and Table S1;† Austaple is Au in staple), and Austaple–S (Fig. S7(b) and Table S1†) bonds. These results show that, although clusters 1 and 2 have broadly similar framework structures, differences exist in the distortion of their structures. According to the space-filling model, the phenyl groups are strongly gathered three by three at the cluster surface in cluster 2 (Fig. 6). It can be considered that cluster 2 has a geometrical structure with a high symmetry compared with cluster 1 because of this interaction between phenyl groups.
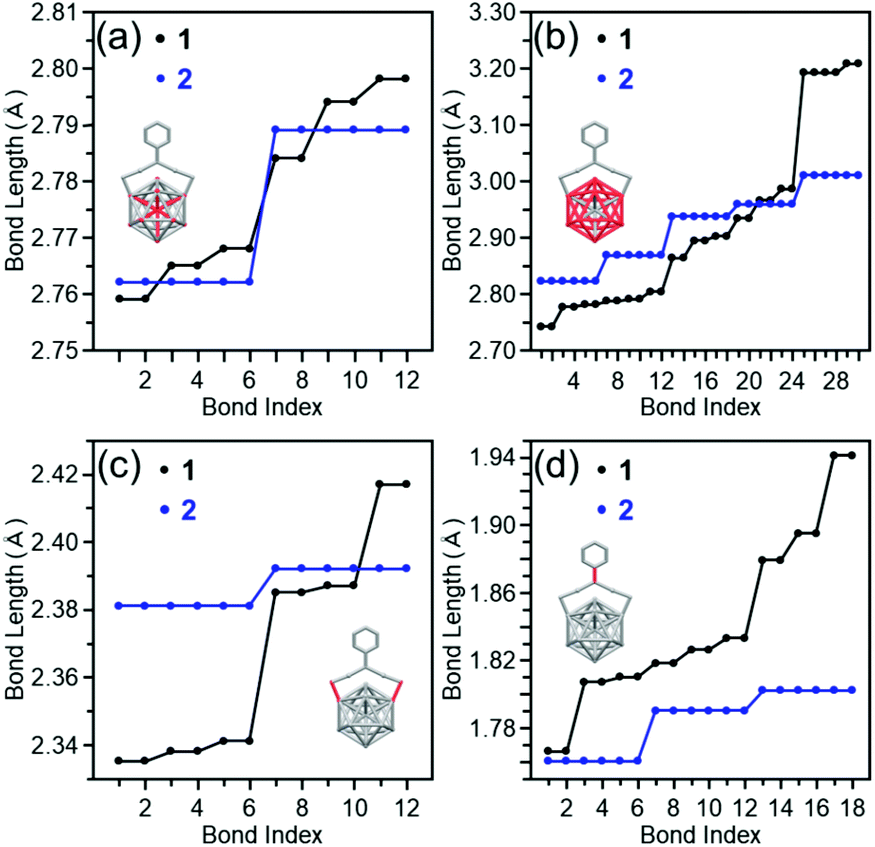 | ||
| Fig. 5 Comparison of bond lengths between clusters 1 and 2; (a) Pt–Ausurf, (b) Ausurf–Ausurf, (c) Ausurf–Ssurf, and (d) S–C bonds. The bond lengths of cluster 1 were extracted from ref. 50. | ||
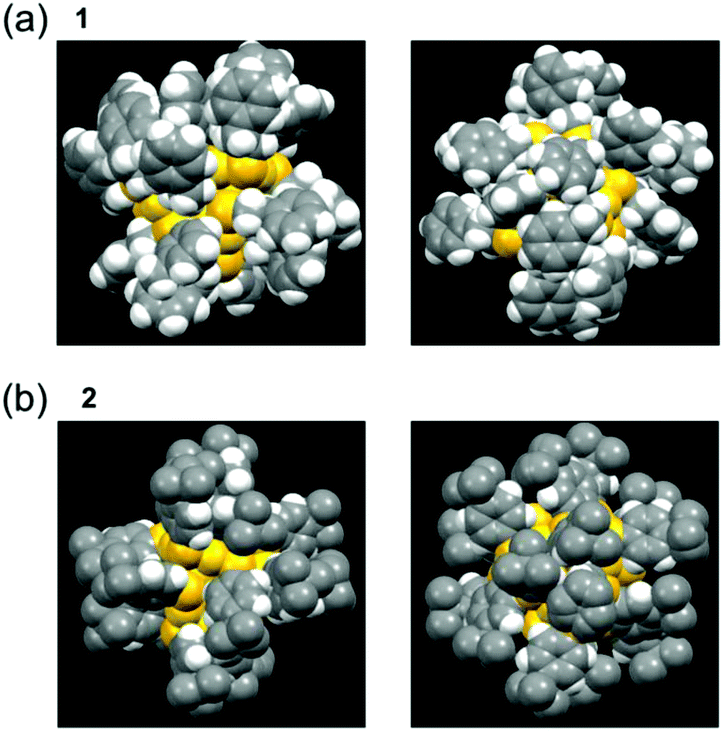 | ||
| Fig. 6 Space-filling models obtained from SCXRD for clusters (a) 1 and (b) 2. The space-filling models of cluster 1 were reproduced from ref. 50. In (a) and (b), two patterns from different angles are shown for each cluster. Copyright 2016 Royal Society of Chemistry. | ||
Considering the average bond length (Table 1), the Pt–Ausurf and Ausurf–Ausurf bonds are shorter and the Ausurf–Ssurf bond is longer in cluster 2 than in cluster 1. Therefore, cluster 2 has a compact metal core and Au2(SR)3 staples away from the metal core surface compared with the cluster 1. Based on the pKa values of the aromatic ligand (pKa = ∼10 in DMSO), 4-tert-butylbenzenethiol, and the aliphatic ligand (pKa = ∼17 in DMSO), 2-phenylethanethiol,52 TBBT is assumed to possess S with a lesser electron-donating property compared with PET. Because of this difference in pKa, in cluster 2, the Au–S bond is thought to be weaker than in cluster 1 and the Au2(SR)3 staple is distant from the metal core.29
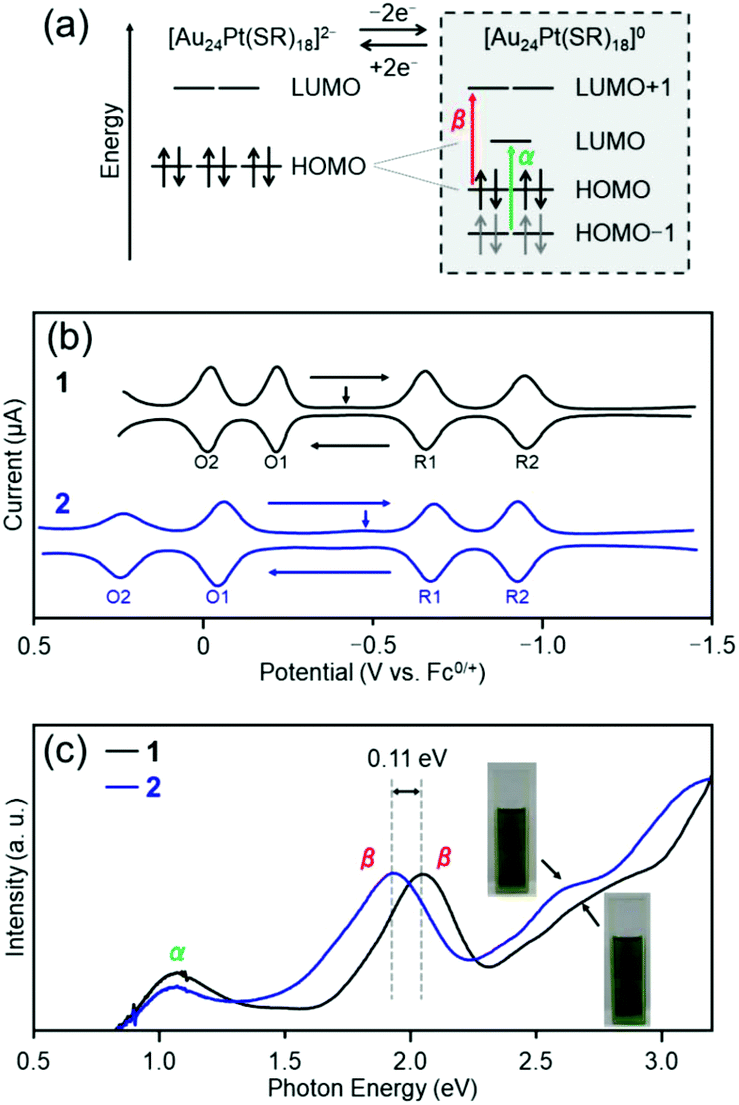 | ||
| Fig. 7 Electronic structures of clusters 1 and 2; (a) orbitals predicted by DFT calculation for Au24Pt(SR)18, (b) SWV curves and (c) optical absorption spectra. The schematic in (a) is adapted from ref. 56. In (c), the vertical arrows indicate the solution open-circuit potential. Copyright 2015 American Chemical Society. | ||
In this study, to examine the effect of the difference in ligands on the electronic structure of [Au24Pt(SR)18]0, square-wave voltammetry (SWV) was performed for both clusters. The SWV curves of clusters 1 and 2 are shown in Fig. 7(b). The shapes of the curves of the two clusters are similar to those of [Au24Pt(C6)18]0,56 which indicates that the Jahn–Teller effect is present in clusters 1 and 2 like in [Au24Pt(C6)18]0. For both clusters, the HOMO–LUMO gap (right side in Fig. 7(b)) was estimated by subtracting the charging energy (EO1 − EO2) from the electrochemical energy gap (ER1 − EO1; here, ER1 indicates the peak potential of R1) (Table S2†).56 Both were found to have a HOMO–LUMO gap of a similar magnitude (0.30 eV for cluster 1 and 0.33 eV for cluster 2). Therefore, the difference in distortion of the framework structure has a minimal influence on the extent of degenerate resolution. Conversely, a large difference was found in EO1 − EO2, which indicates that there is a significant difference in the charging energy57 between clusters 1 and 2.
Based on the optical absorption spectra (Fig. 2(a)), we also considered the effect of difference between the two functional groups on the α and β transition (right side in Fig. 7(a)). Fig. 7(c) shows the optical absorption spectra of the trichloroethylene solutions of clusters 1 and 2, with the horizontal axis represented in terms of energy (eV). The first peak α appears near 1125 nm (1.10 eV) in both absorption spectra. As mentioned previously, this peak can be attributed to the transition from HOMO−1 to LUMO. Because the d orbital of Pt is largely involved in HOMO−1,56 the energy of HOMO−1 changes considerably if the substitution position of Pt is different.51 However, Pt is located at the center of the metal core in clusters 1 and 2. Therefore, there is a minimal difference in the positions of this orbital between the two clusters, which results in no substantial change in the position of peak α in the spectrum between the two clusters. On the other hand, there is a difference in the position of peak β near 600 nm (1.95 eV) between the two clusters; in cluster 2, the peak shifts to a low-energy region by approximately 35 nm (0.11 eV) compared with cluster 1. Owing to this difference in peak position in the visible-light region, the colors of the cluster solution are slightly different (Fig. 7(c)). For LUMO+1, the orbital that is derived from S is also involved, in addition to the orbital of the metal core.58 Because aliphatic hydrocarbon and aromatic hydrocarbon are present next to S in PET and TBBT, respectively, the charge state of S should differ between PET and TBBT (see pKa values described in the previous section). The difference in the charge state of S is considered to be the cause of the difference in the energy level between HOMO and LUMO+1 for the two clusters.
For the resistance against degradation in a solution, the clusters were dissolved in a solvent and the change was examined by using optical absorption spectroscopy. The time dependence of the change in the optical absorption spectrum of the toluene solution of cluster 1 and cluster 2 at 80 °C is shown in Fig. 8(a) and (b), respectively. Because the optical absorption of toluene appears at a wavelength longer than 1100 nm, peak α (Fig. 7(a) and (c)) could not be observed in this experiment. For cluster 1, there was no substantial change in the optical absorption spectrum over the course of 5 h, as shown in Fig. 8(a). In contrast, the shape of the optical absorption spectrum for cluster 2 changed gradually with time (Fig. 8(b)). A similar phenomenon was observed for the toluene solution at 60 °C (Fig. S8†) and the tetrahydrofuran (THF) solution at 60 °C (Fig. S9†). These results indicate that ligand exchange from PET to TBBT reduces the [Au24Pt(SR)18]0 stability in a solution.
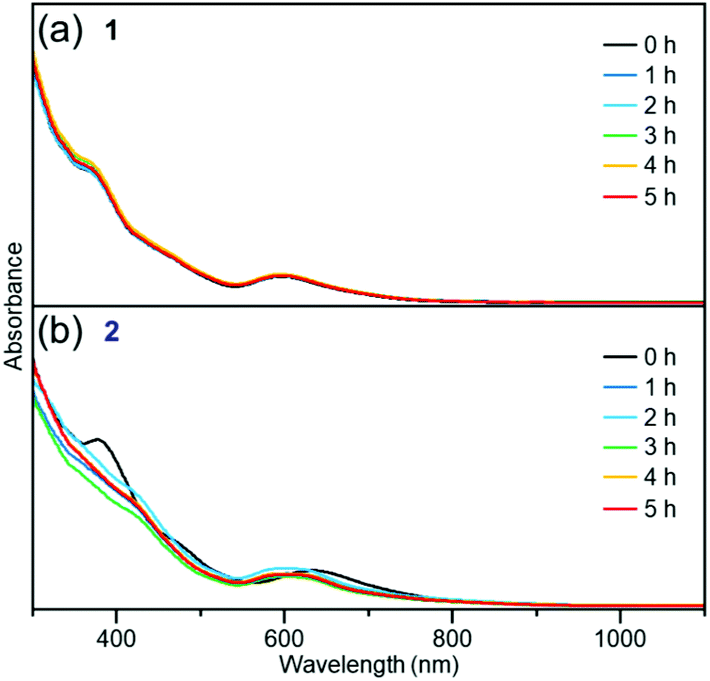 | ||
| Fig. 8 Time dependences of absorption spectra of (a) cluster 1 in toluene (1 × 10⁻⁵ M) at 80 °C and (b) cluster 2 in toluene (1 × 10⁻⁵ M) at 80 °C. | ||
Previous studies on Au25(PET)18 revealed that when Au25(PET)18 is allowed to stand in solution, the clusters undergo oxidation and induce a peeling-off reaction of the Au(I)-PET complex.40 Because [Au24Pt(SR)18]0 has a geometrical and electronic structures similar to Au25(SR)18,50,56 [Au24Pt(SR)18]0 degradation in solution in this study is presumed to be caused by the same reaction. Based on the O1 peak position in the SWV curve (Fig. 7(b)), cluster 2 requires more energy for oxidation than cluster 1, which means that cluster 2 has an electronic structure that is more difficult to oxidize than cluster 1. In cluster 2, although the ligands are strongly gathered three by three at the cluster surface, different from cluster 1, it is unlikely that the proportion of metal surfaces that are exposed to oxygen attack is high (Fig. 6). However, in cluster 2, the Au–S bond is extended compared with cluster 1 (Table 1). From these results, it can be considered that cluster 2 is more easily degraded in a solution than cluster 1 because in cluster 2 the Au–S bond is more prone to breakage than in cluster 1.
For stability under laser irradiation, we compared the extent of dissociation of the two clusters in matrix-assisted laser desorption/ionization (MALDI) mass spectrum.59Fig. 9(a) and (b) show the negative-ion MALDI mass spectra of clusters 1 and 2 measured at identical laser intensities, respectively. In Fig. 9(a), peaks assigned to Au24Pt(PET)17 and Au20Pt(PET)14 were observed as main peaks, in addition to the peak attributed to the parent Au24Pt(PET)18. The peak of Au24Pt(PET)17 is assumed to be formed by PET detachment from Au24Pt(PET)18 and the peak of Au20Pt(PET)14 is assigned to Au4(PET)4 detachment from cluster 1 (Fig. S10(a)†). These dissociation peaks were observed in our previous study on cluster 1.60Fig. 9(b) shows the MALDI mass spectrum of cluster 2, which was measured at the same laser intensity. In the mass spectrum, no peak appears that could be attributable to the parent cluster (cluster 2), which suggests that cluster 2 underwent dissociation at this laser intensity. These results demonstrate that cluster 2 is more unstable under laser irradiation than cluster 1. Actually, to the best of our knowledge, there are no reports in which the parent TBBT-protected metal cluster was observed in the MALDI mass spectrum.43
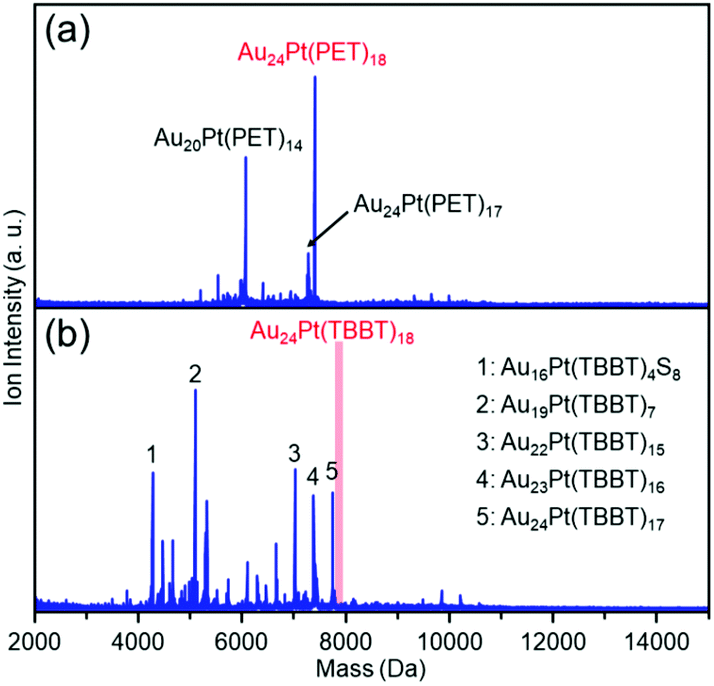 | ||
| Fig. 9 Negative-ion MALDI mass spectra of clusters (a) 1 and (b) 2 recorded at same laser fluence. Only main fragment-peaks are assigned in these spectra. Details of laser-fragment patterns are described in Fig. S10.† | ||
As described above, in cluster 2, the Au–S bond is extended compared with cluster 1. Because the dissociation of both clusters involves SR detachment, the difference in this bonding strength is thought to be responsible for the difference in stability. However, the dissociation pattern differs in both clusters. For example, for cluster 2, the main peaks are Au23Pt(TBBT)16, Au22Pt(TBBT)15, and Au19Pt(TBBT)7, which are produced by the dissociation of Au(TBBT)2, Au2(TBBT)3, or Au5(TBBT)11 from cluster 2, respectively (Fig. S10(b)†). However, for cluster 1, this type of dissociation pattern was not observed even at an increased laser intensity (Fig. S10(a)†). From these results, it is inferred that the difference in dissociation mechanism is also involved in the origin of the difference in stability against laser dissociation. Despite many uncertainties regarding the factors of the difference in stability remain, we expect that in the future more information would be obtained on the dissociation mechanism of the two clusters, which would improve the understanding of the difference in their ease of dissociation.
Conclusions
In this study, we successfully synthesized [Au24Pt(TBBT)18]0 with the same number of metal atoms, number of ligands, and framework structure as [Au24Pt(PET)18]0, which has a strong metal core, by replacing the ligand from PET to TBBT. We found that this ligand exchange is reversible unlike the case of other metal-core clusters. By using the obtained pair of clusters, [Au24Pt(PET)18]0 and [Au24Pt(TBBT)18]0, we examined the effects of functional-group difference on the geometrical structure, electronic structure, and stability of the clusters. As a result, we found that the following three effects are induced when the ligand is changed from PET to TBBT in [Au24Pt(SR)18]0:(1) The metal core shrinks and the Au–S bond expands.
(2) There is no significant difference in HOMO–LUMO gap, but a clear difference is caused in the optical absorption in the visible region.
(3) The stability worsens in a solution and under laser irradiation.
By using these two clusters as model clusters, we expect that the effects of the structural difference of ligand functional-groups on the physical properties and functions of clusters, such as catalytic ability61 and photoluminescence,62 would be clarified.
However, it should be noted that the effect of the functional-group difference revealed in this study is that in [Au24Pt(SR)18]0. If the framework structure of the cluster were changed, the magnitude of the stress generated by repulsion between the ligands and the resulting effect of the difference in the functional-group structure on the cluster would also differ. This study confirmed that when the metal core is strengthened, thiolate-protected metal clusters with the same number of metal atoms, number of ligands, and framework structure can be synthesized by using PET and TBBT. We expect that, based on this concept, other clusters with the same number of metal atoms, number of ligands, and framework structure would be synthesized by using PET and TBBT. If this is achieved, we could acquire a greater understanding of the effect of the difference between the two functional groups on the basic properties of the cluster and enlarge the scope of application using each ligand's property.
Experimental
Chemicals
All chemicals were obtained commercially and used without further purification. Hydrogen tetrachloroaurate tetrahydrate (HAuCl4·4H2O) and chloroplatinic acid hexahydrate (H2PtCl6·6H2O) were from Tanaka Kikinzoku. Sodium tetrahydroborate (NaBH4), tetraoctylammonium bromide ((C8H17)4NBr), and silica gel (spherical, 63–210 μm) were from FUJIFILM Wako Pure Chemical Co. THF, ethanol, methanol, toluene, hexane, acetonitrile, acetone, dichloromethane, and hydrogen peroxide (H2O2, 30 wt%) were from Kanto Chemical Co., Inc. 2-Phenylethanethiol was from Aldrich. 4-tert-Butylbenzenethiol and trans-2-[3-(4-tert-butylphenyl)-2-methyl-2-propenylidene]malononitrile (DCTB) were from Tokyo Chemical Industry. Co., Ltd. Cesium acetate (CH3COOCs) was from Nacalai Tesque. Pure Milli-Q water (18.2 MΩ cm) was generated with a Merck Millipore Direct 3 UV system.Syntheses
![[thin space (1/6-em)]](https://www.rsc.org/images/entities/char_2009.gif) :hexane = 5:3) as an eluent, and a second green fraction was collected. This fraction contained cluster 1 and [Au25(PET)18]0. [Au25(PET)18]0 was decomposed selectively in the mixture to obtain a high-purity cluster 1. Crude product was dissolved in 5 mL of dichloromethane, and 5 mL of H2O2 was added to this solution. After stirring for 5 h, the H2O2 phase was removed and dichloromethane was removed by evaporation. The byproduct from the decomposition process by using H2O2 was removed by column chromatography using silica gel as a stationary phase and a mixture of solvent (toluene:hexane = 5:3) as a mobile phase. The first fraction contained the objective cluster, and ∼5 mg of green cluster 1 was obtained.
:hexane = 3:7). The product purity was confirmed by HPLC and ESI-MS and an optical absorption spectrum.
:hexane = 5:3) as an eluent, and a second green fraction was collected. This fraction contained cluster 1 and [Au25(PET)18]0. [Au25(PET)18]0 was decomposed selectively in the mixture to obtain a high-purity cluster 1. Crude product was dissolved in 5 mL of dichloromethane, and 5 mL of H2O2 was added to this solution. After stirring for 5 h, the H2O2 phase was removed and dichloromethane was removed by evaporation. The byproduct from the decomposition process by using H2O2 was removed by column chromatography using silica gel as a stationary phase and a mixture of solvent (toluene:hexane = 5:3) as a mobile phase. The first fraction contained the objective cluster, and ∼5 mg of green cluster 1 was obtained.
:hexane = 3:7). The product purity was confirmed by HPLC and ESI-MS and an optical absorption spectrum.
Crystallization
Approximately 3 mg of the cluster 2 was dissolved in a solvent mixture of 1 mL dichloromethane and 3 drops of ethanol. The solution was placed in a smaller vial and capped loosely. The smaller vial was placed inside a bigger empty vial, which was capped tightly. Vial capping was done so that solvents evaporated slowly. Hexagonal-shaped crystals were observed after 10 days.Characterization
Optical absorption spectra of clusters 1 and 2 were obtained in dichloromethane or trichloroethylene solutions at room temperature with a spectrometer (JASCO, V-670 or Shimadzu, UV 3600). The wavelength-dependent optical data (I(w)) were converted to energy-dependent data (I(E)) by the following equation, which conserved the integrated spectral areas: I(E) = I(w)/|∂E/∂w| ∝ I(w) × w2.MALDI mass spectra were collected by a spiral time-of-flight mass spectrometer (JEOL, JMSS3000) with a semiconductor laser (λ = 349 nm). DCTB was used as the MALDI matrix.63 To minimize the cluster dissociation that was induced by laser irradiation, the cluster-to-matrix ratio was fixed at 1:1000.
ESI mass spectrometry was performed by using a reflectron time-of flight mass spectrometer (Bruker, micrOTOF II or Waters, Micromass Q-TOF mass spectrometer). In the measurements, a cluster solution with a concentration of 10–200 μg mL−1 in dichloromethane was electrosprayed at a flow rate of 180–540 μL h−1.
X-ray photoelectron spectroscopy (XPS) data were collected by using an electron spectrometer (JEOL, JPS-9010MC) at a base pressure of ∼2 × 10⁻⁸ Torr. X-rays from the Mg-Kα line (1253.6 eV) were used for excitation. Cluster 1 or 2 was deposited on an Ag plate, and the spectra were calibrated with the peak energies of Ag 3d5/2 (367.9 eV).64
A chromatogram was obtained by using a Nexera HPLC system (DGU-20A online degasser, LC-30AD pump, CTO-20AC column oven, and SPD-M30A photodiode array (PDA) detector). A YMC Meteoric Core C18 column (150 mm × 4.6 mm; i.d. 2.7 μm) was used as a core–shell reversed-phase column.65,66 The column temperature was fixed at 25 °C to maintain reproducibility. The mobile phase with a flow rate of 1.0 mL min−1 was changed gradually by using a linear gradient program from acetonitrile to diethylether over 100 min. Chromatograms were monitored at 380 nm by using a PDA detector.
SCXRD data of cluster 2 were collected on a Rigaku XtaLAB Pro: XtaLAB P200 single crystal diffractometer equipped with a fine-focus sealed X-ray tube that produced multi-layer mirror-monochromated Cu Kα radiation (λ = 1.54184 Å). The crystal was kept at −173 °C during data collection. The structure was solved by a direct method using a SIR-92 structure solution program.67 Final refinements were performed with SHELXL-2018/368 by using the Olex2 platform.69
SWV was conducted with an electrochemical workstation (model 660B; CH Instruments) in dichloromethane with 0.1 M Bu4NPF6 as a supporting electrolyte that was degassed and blanketed with high-purity Ar gas. SWV was carried out with a Pt disk (0.4 mm diameter) working electrode at 100 mV s−1 with a pulse height and a width of 20 mV and 20 ms, respectively. Ferrocene was added as an internal reference.
Stability experiment
To investigate the stability of the clusters against decomposition in solution, an organic synthesizer (EYELA, PPS-2510) was used to control the reaction temperature precisely and reproducibly. Toluene or THF solution (10 mL, 1 × 10⁻⁵ M) of cluster 1 or cluster 2 was placed in the organic synthesizer and heated to 60 or 80 °C while stirring at 900 rpm. For the stability test in THF, we used THF with an antioxidant (dibutylhydroxytoluene).To investigate the stability of the clusters against laser dissociation, MALDI mass spectra were collected at a high laser fluence.
Conflicts of interest
There are no conflicts to declare.Acknowledgements
We thank Prof. Shohei Tashiro (The University of Tokyo), Mr Kosuke Wakamatsu, and Ms Sayaka Hashimoto (Tokyo University of Science) for technical assistance. This work was supported by the Japan Society for the Promotion of Science (JSPS) KAKENHI (grant numbers JP16H04099 and 16K21402), Scientific Research on Innovative Areas “Coordination Asymmetry” (grant number 17H05385), and Scientific Research on Innovative Areas “Innovations for Light-Energy Conversion” (grant number 18H05178). Funding from the Takahashi Industrial and Economic Research Foundation, Futaba Electronics Memorial Foundation, Iwatani Naoji Foundation, and Asahi Glass Foundation is also gratefully acknowledged. D. L. acknowledges support by the Korea CCS R&D Center (KCRC) grant (NRF-2014M1A8A1074219) and NRF grants NRF-2017R1A2B3006651 and NRF-2018M3D1A1089380.References
- T. Tsukuda and H. Häkkinen, Protected Metal Clusters: From Fundamentals to Applications, Elsevier B.V., Amsterdam, The Netherlands, 2015 Search PubMed.
- M. Brust, M. Walker, D. Bethell, D. J. Schiffrin and R. Whyman, J. Chem. Soc., Chem. Commun., 1994, 801–802 RSC.
- R. Jin, C. Zeng, M. Zhou and Y. Chen, Chem. Rev., 2016, 116, 10346–10413 CrossRef CAS.
- H. Qian, M. Zhu, Z. Wu and R. Jin, Acc. Chem. Res., 2012, 45, 1470–1479 CrossRef CAS.
- I. Chakraborty and T. Pradeep, Chem. Rev., 2017, 117, 8208–8271 CrossRef CAS.
- Q. Yao, T. Chen, X. Yuan and J. Xie, Acc. Chem. Res., 2018, 51, 1338–1348 CrossRef CAS.
- S. Hossain, Y. Niihori, L. V. Nair, B. Kumar, W. Kurashige and Y. Negishi, Acc. Chem. Res., 2018, 51, 3114–3124 CrossRef CAS PubMed.
- K. Kwak and D. Lee, Acc. Chem. Res., 2019, 52, 12–22 CrossRef CAS.
- N. A. Sakthivel and A. Dass, Acc. Chem. Res., 2018, 51, 1774–1783 CrossRef CAS.
- R. L. Whetten, H.-C. Weissker, J. J. Pelayo, S. M. Mullins, X. López-Lozano and I. L. Garzón, Acc. Chem. Res., 2019, 52, 34–43 CrossRef CAS PubMed.
- M. Agrachev, M. Ruzzi, A. Venzo and F. Maran, Acc. Chem. Res., 2019, 52, 44–52 CrossRef CAS PubMed.
- Y. Pei, P. Wang, Z. Ma and L. Xiong, Acc. Chem. Res., 2019, 52, 23–33 CrossRef CAS PubMed.
- B. Bhattarai, Y. Zaker, A. Atnagulov, B. Yoon, U. Landman and T. P. Bigioni, Acc. Chem. Res., 2018, 51, 3104–3113 CrossRef CAS.
- C. M. Aikens, Acc. Chem. Res., 2018, 51, 3065–3073 CrossRef CAS PubMed.
- J. Yan, B. K. Teo and N. Zheng, Acc. Chem. Res., 2018, 51, 3084–3093 CrossRef CAS PubMed.
- A. Ghosh, O. F. Mohammed and O. M. Bakr, Acc. Chem. Res., 2018, 51, 3094–3103 CrossRef CAS.
- B. Nieto-Ortega and T. Bürgi, Acc. Chem. Res., 2018, 51, 2811–2819 CrossRef CAS.
- Q. Tang, G. Hu, V. Fung and D.-e. Jiang, Acc. Chem. Res., 2018, 51, 2793–2802 CrossRef CAS.
- Z. Gan, N. Xia and Z. Wu, Acc. Chem. Res., 2018, 51, 2774–2783 CrossRef CAS PubMed.
- W. Kurashige, Y. Niihori, S. Sharma and Y. Negishi, J. Phys. Chem. Lett., 2014, 5, 4134–4142 CrossRef CAS PubMed.
- Y. Song, S. Wang, J. Zhang, X. Kang, S. Chen, P. Li, H. Sheng and M. Zhu, J. Am. Chem. Soc., 2014, 136, 2963–2965 CrossRef CAS.
- Z. Lei, X.-K. Wan, S.-F. Yuan, Z.-J. Guan and Q.-M. Wang, Acc. Chem. Res., 2018, 51, 2465–2474 CrossRef CAS.
- K. Konishi, M. Iwasaki and Y. Shichibu, Acc. Chem. Res., 2018, 51, 3125–3133 CrossRef CAS PubMed.
- Q.-F. Zhang, X. Chen and L.-S. Wang, Acc. Chem. Res., 2018, 51, 2159–2168 CrossRef CAS PubMed.
- I. Ciabatti, C. Femoni, M. C. Iapalucci, S. Ruggieri and S. Zacchini, Coord. Chem. Rev., 2018, 355, 27–38 CrossRef CAS.
- E. G. Mednikov, M. C. Jewell and L. F. Dahl, J. Am. Chem. Soc., 2007, 129, 11619–11630 CrossRef CAS.
- X. Kang, H. Chong and M. Zhu, Nanoscale, 2018, 10, 10758–10834 RSC.
- T. Higaki, Q. Li, M. Zhou, S. Zhao, Y. Li, S. Li and R. Jin, Acc. Chem. Res., 2018, 51, 2764–2773 CrossRef CAS PubMed.
- M. Rambukwella, N. A. Sakthivel, J. H. Delcamp, L. Sementa, A. Fortunelli and A. Dass, Front. Chem., 2018, 6, 330 CrossRef.
- C. Zeng, Y. Chen, C. Liu, K. Nobusada, N. L. Rosi and R. Jin, Sci. Adv., 2015, 1, e1500425 CrossRef PubMed.
- S. Zhuang, L. Liao, M.-B. Li, C. Yao, Y. Zhao, H. Dong, J. Li, H. Deng, L. Li and Z. Wu, Nanoscale, 2017, 9, 14809–14813 RSC.
- A. Tlahuice-Flores, R. L. Whetten and M. Jose-Yacaman, J. Phys. Chem. C, 2013, 117, 20867–20875 CrossRef CAS.
- A. Tlahuice-Flores, Phys. Chem. Chem. Phys., 2016, 18, 27738–27744 RSC.
- J. Jung, S. Kang and Y.-K. Han, Nanoscale, 2012, 4, 4206–4210 RSC.
- M. Rambukwella, S. Burrage, M. Neubrander, O. Baseggio, E. Aprà, M. Stener, A. Fortunelli and A. Dass, J. Phys. Chem. Lett., 2017, 8, 1530–1537 CrossRef CAS PubMed.
- R. R. Nasaruddin, T. Chen, J. Li, N. Goswami, J. Zhang, N. Yan and J. Xie, ChemCatChem, 2018, 10, 395–402 CrossRef CAS.
- R. R. Nasaruddin, T. Chen, N. Yan and J. Xie, Coord. Chem. Rev., 2018, 368, 60–79 CrossRef CAS.
- D. M. Chevrier, L. Raich, C. Rovira, A. Das, Z. Luo, Q. Yao, A. Chatt, J. Xie, R. Jin, J. Akola and P. Zhang, J. Am. Chem. Soc., 2018, 140, 15430–15436 CrossRef CAS.
- F. Bertorelle, I. Russier-Antoine, C. Comby-Zerbino, F. Chirot, P. Dugourd, P.-F. Brevet and R. Antoine, ACS Omega, 2018, 3, 15635–15642 CrossRef CAS.
- G. Li, H. Abroshan, C. Liu, S. Zhuo, Z. Li, Y. Xie, H. J. Kim, N. L. Rosi and R. Jin, ACS Nano, 2016, 10, 7998–8005 CrossRef CAS.
- T. Omoda, S. Takano and T. Tsukuda, Chem. Lett., 2019, 48, 885–887 CrossRef CAS.
- Z. Wu and R. Jin, Nano Lett., 2010, 10, 2568–2573 CrossRef CAS.
- C. Zeng, C. Liu, Y. Pei and R. Jin, ACS Nano, 2013, 7, 6138–6145 CrossRef CAS PubMed.
- C. Zeng, Y. Chen, A. Das and R. Jin, J. Phys. Chem. Lett., 2015, 6, 2976–2986 CrossRef CAS PubMed.
- S. K. Eswaramoorthy, N. A. Sakthivel and A. Dass, J. Phys. Chem. C, 2019, 123, 9634–9639 CrossRef CAS.
- C. Zeng, T. Li, A. Das, N. L. Rosi and R. Jin, J. Am. Chem. Soc., 2013, 135, 10011–10013 CrossRef CAS PubMed.
- Y. Negishi, W. Kurashige, Y. Niihori, T. Iwasa and K. Nobusada, Phys. Chem. Chem. Phys., 2010, 12, 6219–6225 RSC.
- H. Qian, D.-e. Jiang, G. Li, C. Gayathri, A. Das, R. R. Gil and R. Jin, J. Am. Chem. Soc., 2012, 134, 16159–16162 CrossRef CAS.
- K. Kwak, W. Choi, Q. Tang, M. Kim, Y. Lee, D.-e. Jiang and D. Lee, Nat. Commun., 2017, 8, 14723 CrossRef.
- S. Tian, L. Liao, J. Yuan, C. Yao, J. Chen, J. Yang and Z. Wu, Chem. Commun., 2016, 52, 9873–9876 RSC.
- F. Alkan, P. Pandeya and C. M. Aikens, J. Phys. Chem. C, 2019, 123, 9516–9527 CrossRef CAS.
- F. G. Bordwell, Acc. Chem. Res., 1988, 21, 456–463 CrossRef CAS.
- M. Zhu, H. Qian and R. Jin, J. Am. Chem. Soc., 2009, 131, 7220–7221 CrossRef CAS PubMed.
- C. Zeng, C. Liu, Y. Chen, N. L. Rosi and R. Jin, J. Am. Chem. Soc., 2014, 136, 11922–11925 CrossRef CAS PubMed.
- P. Wang, X. Sun, X. Liu, L. Xiong, Z. Ma, Y. Wang and Y. Pei, Nanoscale, 2018, 10, 10357–10364 RSC.
- K. Kwak, Q. Tang, M. Kim, D.-e. Jiang and D. Lee, J. Am. Chem. Soc., 2015, 137, 10833–10840 CrossRef CAS PubMed.
- R. Guo and R. W. Murray, J. Am. Chem. Soc., 2005, 127, 12140–12143 CrossRef CAS PubMed.
- M. Zhou, H. Qian, M. Y. Sfeir, K. Nobusada and R. Jin, Nanoscale, 2016, 8, 7163–7171 RSC.
- W. Kurashige, M. Yamaguchi, K. Nobusada and Y. Negishi, J. Phys. Chem. Lett., 2012, 3, 2649–2652 CrossRef CAS PubMed.
- W. Kurashige, R. Hayashi, K. Wakamatsu, Y. Kataoka, S. Hossain, A. Iwase, A. Kudo, S. Yamazoe and Y. Negishi, ACS Appl. Energy Mater., 2019, 2, 4175–4187 CrossRef CAS.
- G. Li and R. Jin, Acc. Chem. Res., 2013, 46, 1749–1758 CrossRef CAS PubMed.
- X. Kang and M. Zhu, Chem. Soc. Rev., 2019, 48, 2422–2457 RSC.
- A. Dass, A. Stevenson, G. R. Dubay, J. B. Tracy and R. W. Murray, J. Am. Chem. Soc., 2008, 130, 5940–5946 CrossRef CAS PubMed.
- J. C. Fuggle, E. Källne, L. M. Watson and D. J. Fabian, Phys. Rev. B: Solid State, 1977, 16, 750–761 CrossRef CAS.
- Y. Niihori, Y. Koyama, S. Watanabe, S. Hashimoto, S. Hossain, L. V. Nair, B. Kumar, W. Kurashige and Y. Negishi, J. Phys. Chem. Lett., 2018, 9, 4930–4934 CrossRef CAS.
- Y. Niihori, S. Hashimoto, Y. Koyama, S. Hossain, W. Kurashige and Y. Negishi, J. Phys. Chem. C, 2019, 123, 13324–13329 CrossRef CAS.
- A. Altomare, G. Cascarano, C. Giacovazzo, A. Guagliardi, M. C. Burla, G. Polidori and M. Camalli, J. Appl. Crystallogr., 1994, 27, 435–436 Search PubMed.
- G. M. Sheldrick, Acta Crystallogr., Sect. C: Struct. Chem., 2015, 71, 3–8 Search PubMed.
- O. V. Dolomanov, L. J. Bourhis, R. J. Gildea, J. A. K. Howard and H. Puschmann, J. Appl. Crystallogr., 2009, 42, 339–341 CrossRef CAS.
Footnote |
| † Electronic supplementary information (ESI) available: Bond lengths, peak positions in SWV curves, additional schemes, characterization of a precursor, photograph of TLC and crystal, ESI mass and XPS spectra, HPLC chromatogram, crystal data of the product. CCDC 1944945. For ESI and crystallographic data in CIF or other electronic format see DOI: 10.1039/c9nr07117b |
| This journal is © The Royal Society of Chemistry 2019 |