 Open Access Article
Assembly by solvent evaporation: equilibrium structures and relaxation times†
Tommy
Waltmannn
 and
Alex
Travesset
 *
*
Department of Physics & Astronomy and Ames Laboratory – USDOE, Iowa State University, Ames, IA 50011, USA. E-mail: trvsst@ameslab.gov
First published on 2nd October 2019
Abstract
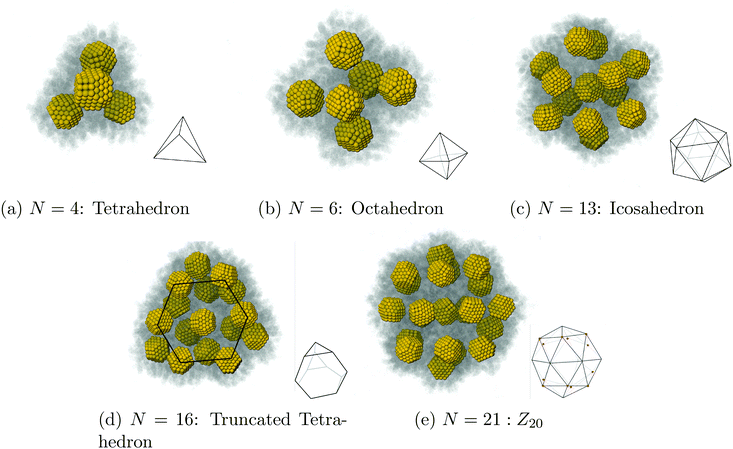
We present a study describing the dynamics and equilibrium of the assembly of nanostructures by solvent evaporation. We first consider N nanocrystals stabilized by capping ligands in a spherical droplet of liquid solvent coexisting with its gas and show that, as the liquid solvent evaporates slowly, NCs crystallize into clusters of high symmetry based on tetrahedral and octahedral units: tetrahedron (N = 4), octahedron (N = 6), icosahedron (N = 13), Archimedean truncated tetrahedron (N = 16) and Z20 (N = 21). We derive explicit formulas for the process and rigorously compute relaxation times, which drastically increase when the packing parameter reaches the hard-sphere liquid–solid transition ηfHS = 0.49. This result shows that contrary to what occurs in an evaporation of a single component system, the relaxation times are not determined by the diffusion constant of the vapor, but rather, are dominated by the residence time of solvent molecules trapped within the capping ligands. Our theory provides a number of predictions that enable the design of new structures while improving the control and quality of their assembly.
Introduction
Assembly of nanocrystals (NCs) into structures with long range order, i.e. superlattices (SLs), is a fundamental practical problem with far-reaching implications in many critical fields.1 Over the last decade, many strategies have been developed for synthesizing single component and binary SLs (BNSLs) such as DNA assembly,2–4 electrostatic regulation5 or interpolymer complexation.6 Another very successful strategy is solvent evaporation (SE),7 which has lead to a myriad of intricate BNSLs and quasicrystals with fascinating order.1,8,9A typical SE experiment consists of NCs stabilized by capping ligands of saturated or unsaturated hydrocarbons in an organic solvent, such as decane or toluene, that are gradually evaporated until the NCs crystallize.8 While almost all experimental methods have relied on SL crystallization on a substrate (i.e. heterogeneous nucleation),1 recently, Wang et al.10 and Yang et al.11 have devised new methods consisting of encapsulating NCs in oil droplets, thus synthesizing single component and BNSLs through homogeneous nucleation, obtaining the same structures as in heterogeneous nucleation, thus providing very strong evidence that BNSLs are indeed true equilibrium structures. Other experiments12,13 have investigated the structure of clusters that emerge when the quality of the solvent is tuned (ST) in stable NC suspensions. Still, despite the enormous success of SE, many fundamental questions are still unresolved, such as how much solvent (if any) remains in the final equilibrium structure, how the parameters controlling the evaporation process affect the quality of the final SLs, or the sequence of events and potential barriers that lead to crystallization. This includes identification of intermediate structures, such as an fcc to bcc (Bain)14,15 or hcp to bcc16 transition. Furthermore, it is well known1 that SE and ST do not generally result in the same structures for the same conditions, raising issues related to metastability. The goal of this paper is to provide a microscropic description of SE that will lead to a conclusive answer to all of these very fundamental questions.
There are very few theoretical studies of assembly by SE, though many authors have investigated models where the solvent is considered implicitly.17,18 Particularly relevant is the recent study by Fan and Grünwald,15 who have characterized the different types of orientational order during NC self-assembly. There are even less studies with explicit solvent, one by Cheng and Grest19,20 and another by Howard et al.,21 who have performed a large scale MD simulation consisting of Lennard-Jones particles at the liquid/gas coexistence with hard-sphere colloidal particles, reaching the interesting conclusion that the final crystal structure does not depend significantly on the evaporation rate, as the initial surface structure formed at the interface is subsequently deformed due to confinement effects. In all these studies, the Peclet (Pe) number has been shown to be a relevant parameter characterizing the quality of the assembly.22 The Pe number is defined as:
 | (1) |
In this paper, we present a microscopic description for assembly of NCs through SE. Some of the considerations discussed above still apply in a coarse-grained sense, that is, when NC are modeled as effective hard sphere (HS) or Lennard-Jones particlese.23,24 Yet, in previous papers we have shown the limitations of these coarse grained approaches, as NCs within nanostructures bond through certain ligand configurations (“vortices”) that cannot be accounted by these simpler models, and are determined by the “Orbifold Topological Model” (OTM)25,26 instead. It is also intuitive that the interaction of the capping ligands with the solvent does play a non-trivial role. Hence, it is necessary to consider models where the ligands and their interaction with solvent are included explicitly.
Results
Simulations used HOOMD-Blue27,28 with the OPLS/united force field29 as implemented in HOODLT.30 The parameters for toluene were obtained from ref. 31. We ran simulations within the NVT ensemble. Liquid and gas phases are identified according to the Voronoi construction as described in ref. 32 and 33. The experimental data for toluene was taken from ref. 34.We prepare a simulation by placing a number Nt of solvent (toluene) particles in a box of volume V. The average (or nominal) density is defined as:
 | (2) |
We place a number N of gold NCs functionalized with 80 dodecane molecules through a thiol bond (Au201(SC12)80). The core radius is Rcore = 10.15 Å and the grafting density σ = 0.595 chains per Å2. The hard sphere radius of the NC is given by the OPM formula:26,35
| RHS = RcoreτOPM = Rcore(1 + 3λξ)1/3 = 17.9 Å, | (3) |
 | (4) |
Further details of the NCs have been discussed in, for example, ref. 37.
Pure toluene
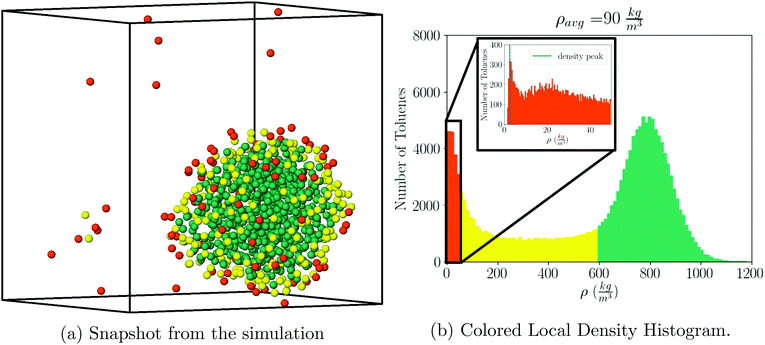
Following our previous simulations37–39 we kept the temperature at T = 387 K, where according to ref. 34, the toluene coexistence between liquid and gas occurs at a pressure Pc(387 K) = 1.097 atm, saturated densities ρl = 777.9 kg m−3 and ρg = 3.3 kg m−3, and isothermal compressibility κT = 1.866 × 10⁻⁴ atm−1.For visualization purposes, we define gas, liquid, and interface regions as follows: the gas cutoff is defined as 30ρg, the liquid cutoff is defined as 0.75ρl. Results do not change significantly with other values. Any toluene which has local density greater than 0.75ρl is defined as liquid, any toluene with local density less than 30ρg is defined as gas, and any toluene that is neither of those is defined as interface, see Fig. 1a and b.
The local solvent density is determined from the local solvent volume, which is computed by voronoi tessellation implemented in the Freud40 analysis package, where each input point is the center of mass of a toluene molecule.
Similar plots including many other ρavg values are shown in Fig. S3.† The saturated liquid density, as obtained from the simulation is given at ρls = 780(4) kg m−3, which compares very well with the experimental result ρl = 777.9 kg m−3, quoted above.
The histogram plots in Fig. 1b, provide an alternative way to determine the pressure when there is liquid–gas coexistence; with the gas density determined from the low density peak in Fig. 1b, a pressure is given by the ideal gas law:
 | (5) |
For example, from Fig. 1b one determines P = 1.05 atm, which compares well with the experimental result for liquid–gas coexistence at this temperature Pexp = 1.11 atm. A plot comparing the ideal gas pressure to that given by the simulation is shown in Fig. 2. We show in ESI, see Fig. S2,† that the pressure as it reads from the simulation becomes negative within the coexistence region, unlike eqn (5) that remains approximately constant, see Fig. S10.†
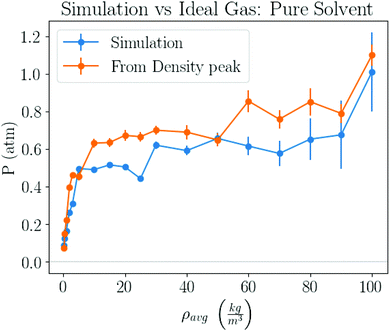 | ||
| Fig. 2 Pressure obtained by 2 different methods. One method takes pressure data logged by the simulation, and the other computes the pressure from the peak in the gas density distribution, similar to the inset of Fig. 1b, and the ideal gas law, eqn (5). | ||
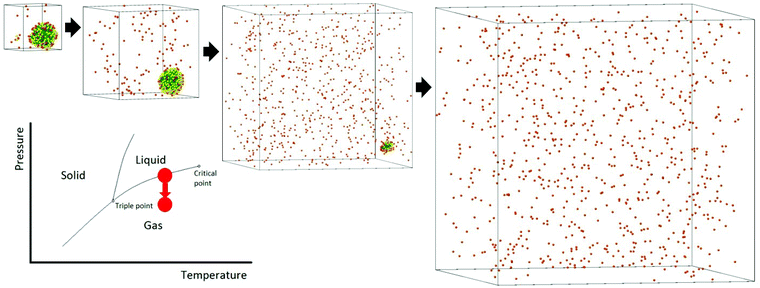
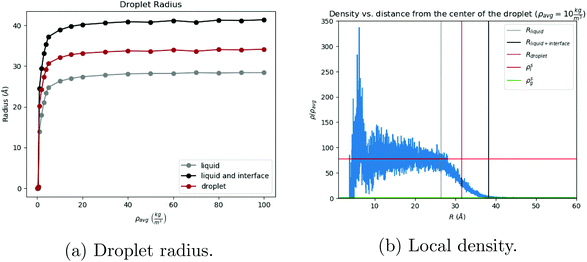
The process of solvent evaporation is illustrated in Fig. 3: the initial state consists of a liquid droplet in coexistence with the gas phase, which is slowly evaporated by expanding the simulation box until no liquid remains. Note that this is a different method than the one used in previous studies.20 The liquid phase, see Fig. 1a, organizes into a spherical droplet. In Fig. 4a, we show the radius of the droplet as the solvent evaporates. The toluene density profile is computed by identifying the molecule at the center of the droplet and then calculating the radial distribution function using this molecule as our reference point. We accumulate this function over 200 frames of our simulation (with all frames having the same box length and therefore the same ρavg). The plot for ρavg = 10 kg m−3 is shown in Fig. 4b. There are 3 clearly distinguished regions: R < Rliquid, Rliquid < R < Rliquid+interface, and Rliquid+interface < R. For R < Rliquid the curve follows a typical radial liquid distribution function (rdf). Then at the interface region (where Rliquid < R < Rliquid+interface), there is a distinct transition in density from the saturated liquid density to the density of the vapor. The 3rd region Rliquid+interface < R corresponds to the vapor. Hereon, the droplet radius is defined as Rdroplet = Rd = 0.825Rliquid+interface, shown in Fig. 4a and b, so that it has the value as defined by the Gibbs interface, see the discussion in eqn (S4).†
Self-assembly of NCs
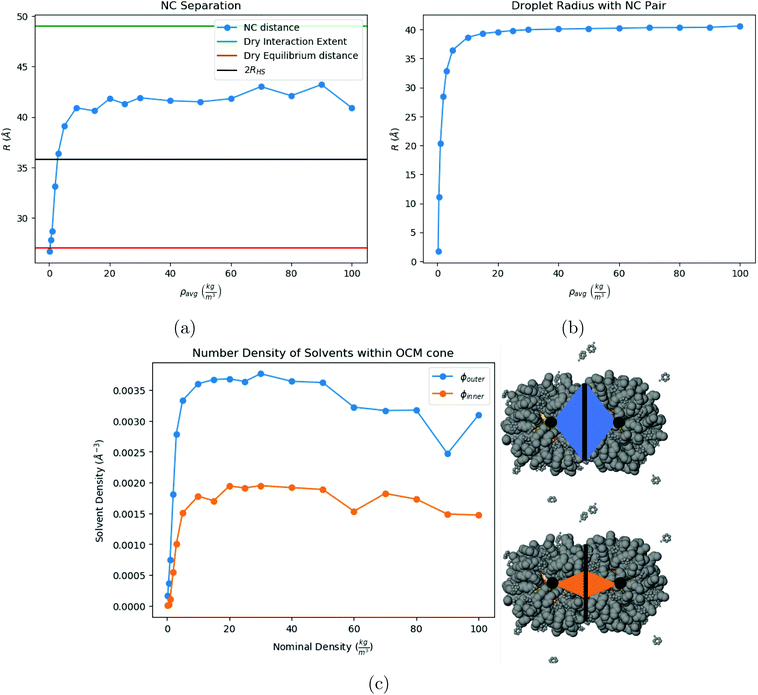
We now investigate assembly by SE for a toluene system in liquid/gas coexistence containing N = 2, 4, 6, 13, 16 and 21 NCs, so that the choices of N are basically random. Then the droplets are evaporated following the same protocol as in Fig. 3. Additional illustrations of the process are provided in ESI, see Fig. S5† and many others.Shown in Fig. 5c is the fraction of toluene molecules which are inside the interaction region between the 2 NCs. More precisely, the interaction region is divided into an ‘outer cone’, the OCM cone, defined by an angle ϕouter = ϕOCM (see ref. 37), and an ‘inner cone’, in a manner similar to the OCM cone, where ϕinner = ϕOCM/2. From Fig. 5c, the inner cone is less densely packed with solvent molecules throughout the process of evaporation than the outer cone, reflecting the nature of the hydrocarbons to pack more densely in the inner cone than in the outer cone, noted in ref. 37. In addition, Fig. 5c shows that the solvent molecules are not expelled from the interaction region until the latest stages of solvent evaporation.
Vortices appear when solvent is almost evaporated. For our 3 lowest densities, ρavg = 0.25, 0.5, 1.0, the vortex textures shown in Fig. 6 appear at trace solvent. Even for ρavg > 1.0 kg m−3 the NCs separation is large enough that they do not form, see the right of Fig. 6.
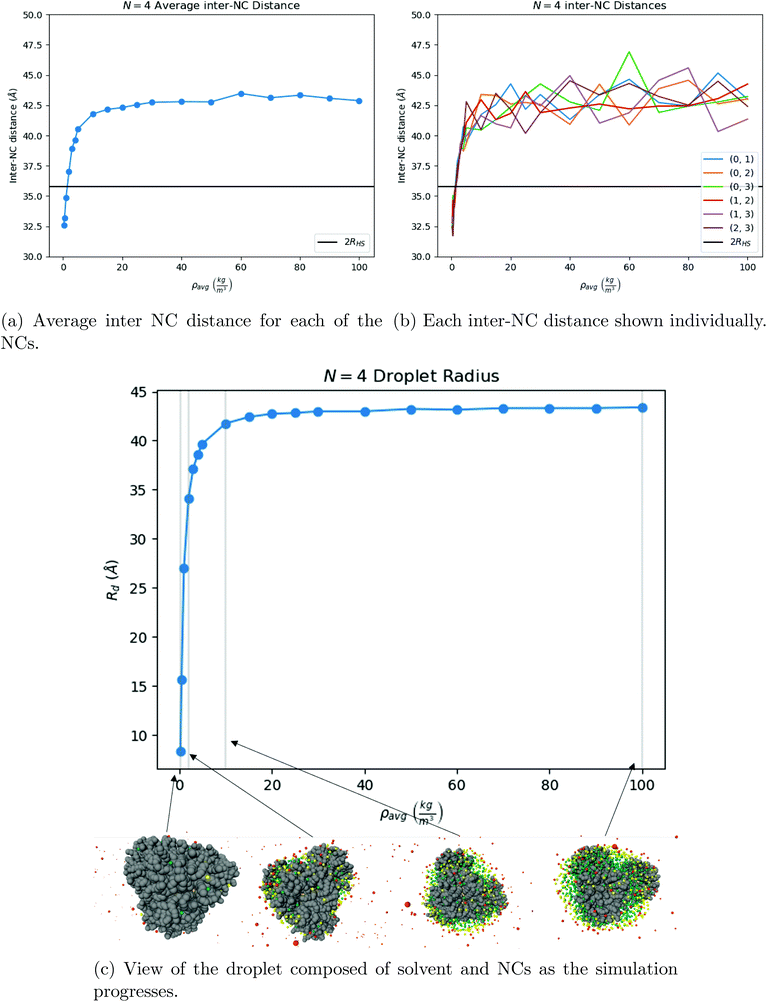 | ||
| Fig. 7 Our results for N = 4 NCs. One can see that the system first assembles into a tetrahedron around ρavg = 10 kg m−3, shown in (b), and that once the solvent is fully evaporated, the equilibrium structure is indeed a tetrahedron, see Fig. 9a. The OPM value for the distance between 2 NCs is marked as a black line in both (a) and in (b). | ||
 , showing that already in the liquid state, the NCs form a fluctuating icosahedron. As shown in Fig. 8c, the central NC in the icosahedron displays no vortices, in agreement with previous results39 and the OTM.
 | ||
| Fig. 8 Our results for N = 13. As the solvent evaporates, the system evolves into a symmetric configuration of 12 NCs in a cage and 1 NC trapped in the center, see (a) and (b). Once the solvent has completely evaporated, the equilibrium configuration is a perfect icosahedron (Fig. 9c), with the trapped NC completely void of vortices (c). | ||
Discussion
Droplet radii
For a pure solvent, the pressure inside the droplet Pl and the vapor pressure Pg satisfy42 | (6) |
 , which implies Pg ≈ Pc and Pl ≈ 90 atm. Thus, the very small droplets considered for this study have a high, but not completely unrealistic, pressure.
A formula for the droplet radius as a function of ρavg, derived in ESI,† is given as:
 | (7) |
 is the hard sphere volume of a NC. As shown in Fig. 10, the formula is in excellent agreement with the simulation results, except for a small discrepancy for increasing N, which is discussed in ESI.† The interpretation of the above formula is that, initially, the radius is reduced slowly, but proceeds more efficiently as the first layers are evaporated, as those contain the majority of the solvent molecules.
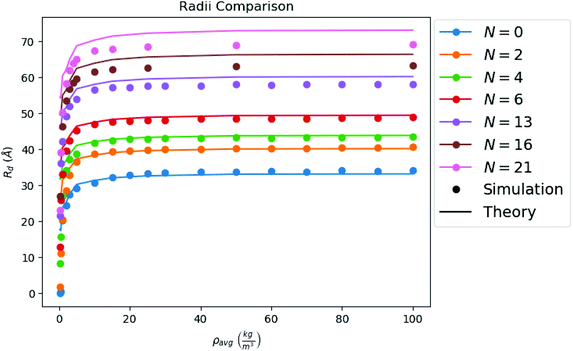 | ||
| Fig. 10 Comparison between the droplet radii of all of our configurations calculated from simulation, and the droplet radii as predicted by theory (i.e. from eqn (7)). | ||
Relaxation times
The general dependence of Rd on ρavg, see Fig. 10, is a geometrical relation and does not provide information about the temporal scales associated with the evaporation process. Those are now investigated by computing the relaxation times associated with the latest stages of evaporation (ρavg = 0.25 kg m−3). At a given time, the number of liquid and gas molecules defined from the Gibbs convention, see eqn (S2),† is Nliquid(t) = Nt − Ngas(t). If we assume that there is a single relaxation time τR, the evaporation rate follows as: | (8) |
| Ngas(t) = Nt − (Nt − Ngas(0))e−t/τR. | (9) |
According to the classical Maxwell calculation,44 evaporation is a diffusion limited process. Hence, the relaxation time involved with a liquid droplet of pure solvent is given by:
| τR ≈ L2/Dg | (10) |
 is the gas diffusion constant and L is the linear size of the box that encloses the gas. At the volume where the toluene liquid droplet evaporates, it is L ≈ 800 Å, hence:
| τR(N = 0) ≈ 1 ns, | (11) |
The form eqn (9) is in excellent agreement with Fig. 11, providing τR as a fitting parameter. We then investigate the dependence of the number N of NCs, where Fig. 12 shows a linear relation:
| τR = τ0N = 1.312(4)N ns. | (12) |
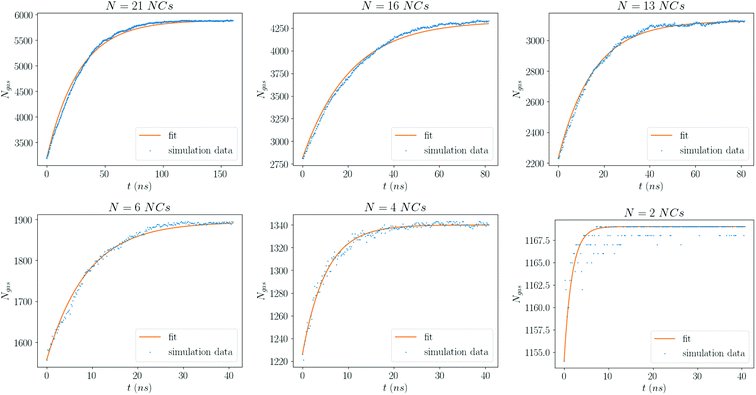 | ||
| Fig. 11 Number of solvent molecules in the gas phase for each value of N. The curve is a fit to eqn (9). Each plot is for the smallest average density considered, ρavg = 0.25 kg m−3. | ||
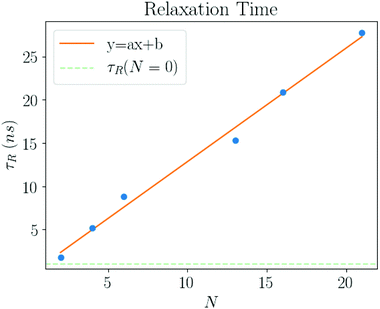 | ||
| Fig. 12 The relaxation times (τR) as a function of number of NCs in the system (N). The fit gives τ0 = 1.312(4) ns, see eqn (12). | ||
The intercept (N = 0) is consistent with zero, which is in agreement with the estimate eqn (11). The relaxation times growing linearly with N reflects the cooperative nature among the solvent molecules trapped into the ligands across the entire structure. It also shows the emergence of a new relaxation time related to the solvent molecules trapped within the NC chains, which is much larger than the Maxwell relaxation time eqn (10).
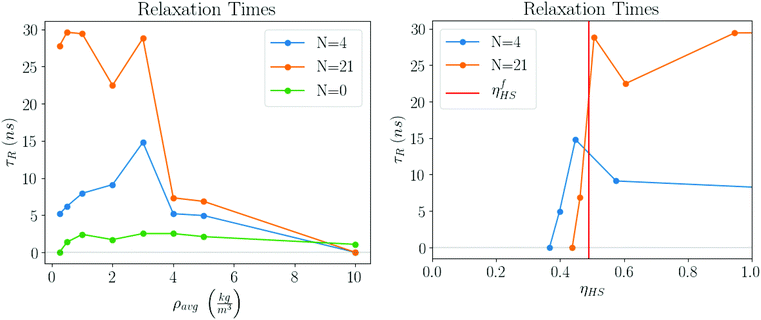
The plots in Fig. 13 clearly show that the relaxation times dramatically increase in the latest stages of the evaporation process. Initially, they are basically the same as the pure solvent liquid, raising very rapidly at around ηHS ≈ ηfHS = 0.49, the hard sphere freezing transition.45
Free energy
The free energy of the system is a function of F(T, ρavg, V; N). This value may be calculated by integrating the pressure over the volume, see eqn (S11).† In the appendix, we derive a relation once the liquid phase disappears:| F(T, ρavg, V; N) − F(T, ρavg, V; N = 0) = Fdry(T; N) | (13) |
 | (14) |
Conclusions
Solvent evaporation
In this paper, we have presented a description for NC assembly by solvent evaporation, illustrated in Fig. 14. We have considered N NCs contained within a solvent droplet of radius Rd, which is in coexistence with its gas. As evaporation proceeds the droplet shrinks. In the early stages, relaxation times are determined by the liquid/gas coexistence, that is a function of the vapor diffusion constant and independent of the NCs, which are in a liquid-like state themselves, and whose only effect is an increase in the droplet radius, as predicted by eqn (7). Once the hard sphere packing fraction ηHS, see eqn (4), reaches the hard sphere freezing point ηfHS = 0.49, relaxation times become much longer and adopt a linear dependence on the number of NCs according to:| τR = τ0N. | (15) |
The coefficient τ0 generally depends on the NC and the temperature Pc(T) (or pressure). We should note that even before relaxation times slow down, the liquid-like NCs already hint at what the final structure will be, as shown in Fig. 7b or Fig. 8a, where the distances satisfy the relations for a tetrahedron or icosahedron, even when significant amount of solvent still remains. This point has also been discussed in other contexts.46 These results clearly suggest that the slowest relaxation time in the process of assembly by solvent evaporation is not determined by the diffusion constant of the gas but rather, it is dominated by the process of removing the solvent molecules trapped within the ligands.
Certainly, our study has investigated a small number of NCs, but some of our conclusions apply to larger systems. Because the NCs are stable in the liquid droplet (i.e. they repel each other in the solvent), the description in terms of hard spheres is plausible and nucleation of fcc/hcp phases may be generally expected for ηHS > ηfHS, with a characteristic nucleation time τN(ηHS), which for sufficiently large ηHS is always smaller than τR. The trapped solvent molecules, however, will need to diffuse through the assembled structure and therefore, will undergo a random walk through all the N NCs within the system. Thus for large N, eqn (15) is expected to be replaced by:
| τR ≈ τ′0N1/2. | (16) |
Connection to experiments
Except for the newest experiments of Wang et al.10 and Yang et al.,11 all previous BNSLs have been obtained through heterogeneous nucleation, where crystallization occurs on a substrate. Recent experiments have began to characterize the dynamics of assembly14,16 in single component SLs, and establish that the final bcc SL proceeds through an intermediate fcc or hcp phase. In fact, the experiments in ref. 16 report a hcp to bcc transition at around ηHS ≈ 0.6, in agreement with the qualitative arguments provided above, even though there is evidence for the hcp phase at ηHS ≈ 0.4 < ηfHS = 0.49, in slight disagreement with our predictions. It would be of great interest if experiments in homogeneous nucleation could establish the presence of this intermediate phase.We note that both fcc and hcp are built from tetrahedral and octahedral units, the very same building blocks defining the equilibrium structures found in this study. SLs formed from tetrahedral and octahedral elements (Quasi Frank-Kasper phases) encompass all known experimental examples of BNSLs.41 Recent imaging techniques may be able to visualize the assembly of clusters and validate the predictions in this paper.13,47
Controlling the quality of the structures
Our study suggests that the evaporation rate does not play any role during the assembly process provided that ηHS < ηfHS. Thus, in order to accelerate synthesis, the first step of evaporating the “free” (not trapped within the ligands) liquid solvent may proceed arbitrarily fast. It is after this point that relaxation times dramatically increase, and the evaporation rate must keep pace with the system relaxation times, as predicted by eqn (12).The important parameter controlling the quality of the assembled structures is the Pe number, eqn (1). Rather unexpectedly, recent results21 for Lennard-Jones particles have shown that the quality of the crystal is insensitive to the Pe number over a significant region. With the diffusion constant given from:
 | (17) |
Outlook
In summary, our paper has provided a detailed microscopic description of assembly by solvent evaporation. There are many quantitative aspects that will need to be subject of further investigation, namely, the dependence of relaxation times on the temperature and NC type, and investigation of larger assemblies and other type of solvents. It is our expectation to fill these gaps in the near future.Materials and methods
We have run molecular dynamics simulations of the above numbers of nanocrystals using the HOODLT30 and HOOMD-blue software package48 using a Langevin integrator at a temperature T = 387 K with time step dt = 0.0267 and non-bonded cutoff of 24 Å. Simulations used the OPLS/united force field29 as implemented in HOODLT.30 The parameters for toluene were obtained from Ref. 31. Simulations were carried out in the following manner:N NCs were placed along with Nt toluene molecules (see Table 1) in a cubic box of length l0, such that the average density of the solvent in the box was ρavg = 100 kg m−3. Then the simulation began and the system was allowed to run for 106 time steps. Then, over the next 105 time steps, the simulation box was expanded to a new length l1 > l0 and we again ran the simulation while collecting data for 106 time steps. This process of running the simulation, lengthening the simulation box, and running the simulation at a new average density was repeated many times until the solvent was completely evaporated. We refer to each iteration of this process as a window. Typically, there were 12–23 windows in a completed simulation. After initial runs in each window, more statistics for each window were obtained from runs of 107 or more time steps individually on the XSEDE Comet GPU Cluster.
| N | N t |
|---|---|
| 0 | 800 |
| 2 | 1169 |
| 4 | 1343 |
| 6 | 1896 |
| 13 | 3145 |
| 16 | 4405 |
| 21 | 5924 |
Conflicts of interest
There are no conflicts to declare.Acknowledgements
A. T. acknowledges many discussions and clarification of their work with I. Coropceanu, B. Patra and D. Talapin. Interest and discussions are also acknowledged from L. Liz-Marzan, S. Mallapragada and D. Vaknin. The work is funded by NSF, DMR-CMMT 1606336 “CDS&E: Design Principles for Ordering Nanoparticles into Super-crystals”. This work used the Extreme Science and Engineering Discovery Environment (XSEDE), which is supported by National Science Foundation grant number ACI-1548562. Our project within XSEDE is supported by grant TG-MCB140071.References
- M. A. Boles, M. Engel and D. V. Talapin, Self-Assembly of Colloidal Nanocrystals: From Intricate Structures to Functional Materials, Chem. Rev., 2016, 116, 11220–11289 CrossRef CAS PubMed.
- D. Nykypanchuk, M. M. Maye, D. van der Lelie and O. Gang, DNA-guided crystallization of colloidal nanoparticles, Nature, 2008, 451, 549–552 CrossRef CAS PubMed.
- S. Y. Park, A. K. R. Lytton-Jean, B. Lee, S. Weigand, G. C. Schatz and C. A. Mirkin, DNA-programmable nanoparticle crystallization, Nature, 2008, 451, 553–556 CrossRef CAS PubMed.
- E. Auyeung, T. I. N. G. Li, A. J. Senesi, A. L. Schmucker, B. C. Pals, M. O. de la Cruz and C. A. Mirkin, DNA-mediated nanoparticle crystallization into Wulff polyhedra, Nature, 2014, 505, 73–77 CrossRef PubMed.
- H. Zhang, W. Wang, S. Mallapragada, A. Travesset and D. Vaknin, Macroscopic and tunable nanoparticle superlattices, Nanoscale, 2017, 9, 164–171 RSC.
- S. Nayak, N. Horst, H. Zhang, W. Wang, S. Mallapragada, A. Travesset and D. Vaknin, Interpolymer Complexation as a Strategy for Nanoparticle Assembly and Crystallization, J. Phys. Chem. C, 2019, 123, 836–840 CrossRef CAS.
- R. L. Whetten, M. N. Shafigullin, J. T. Khoury, T. G. Schaaff, I. Vezmar, M. M. Alvarez and A. Wilkinson, Crystal Structures of Molecular Gold Nanocrystal Arrays, Acc. Chem. Res., 1999, 32, 397–406 CrossRef CAS.
- E. V. Shevchenko, D. V. Talapin, N. A. Kotov, S. O'Brien and C. B. Murray, Structural diversity in binary nanoparticle superlattices, Nature, 2006, 439, 55–59 CrossRef CAS PubMed.
- M. A. Boles and D. V. Talapin, Many-Body Effects in Nanocrystal Superlattices: Departure from Sphere Packing Explains Stability of Binary Phases, J. Am. Chem. Soc., 2015, 137, 4494–4502 CrossRef CAS PubMed.
- P.-p. P. Wang, Q. Qiao, Y. Zhu and M. Ouyang, Colloidal Binary Supracrystals with Tunable Structural Lattices, J. Am. Chem. Soc., 2018, 140, 9095–9098 CrossRef CAS PubMed.
- Y. Yang, B. Wang, X. Shen, L. Yao, L. Wang, X. Chen, S. Xie, T. Li, J. Hu, D. Yang and A. Dong, Scalable Assembly of Crystalline Binary Nanocrystal Superparticles and Their Enhanced Magnetic and Electrochemical Properties, J. Am. Chem. Soc., 2018, 140, 15038–15047 CrossRef CAS PubMed.
- A. Sánchez-Iglesias, M. Grzelczak, T. Altantzis, B. Goris, J. Pérez-Juste, S. Bals, G. Van Tendeloo, S. H. Donaldson, B. F. Chmelka, J. N. Israelachvili and L. M. Liz-Marzán, Hydrophobic interactions modulate self-assembly of nanoparticles, ACS Nano, 2012, 6, 11059–11065 CrossRef PubMed.
- S. Merkens, M. Vakili, A. Sanchez-Iglesias, L. Litti, Y. Gao, P. V. Gwozdz, L. Sharpnack, R. H. Blick, L. M. Liz-Marzan, M. Grzelczak and M. Trebbin, Time-Resolved Analysis of the Structural Dynamics of Assembling Gold Nanoparticles, ACS Nano, 2019, 13, 6596–6604 CrossRef CAS PubMed.
- M. C. Weidman, D.-M. M. Smilgies and W. A. Tisdale, Kinetics of the self-assembly of nanocrystal superlattices measured by real-time in situ X-ray scattering, Nat. Mater., 2016, 15, 775–781 CrossRef CAS PubMed.
- Z. Fan and M. Grünwald, Orientational Order in Self-Assembled Nanocrystal Superlattices, 2019, https://pubs.acs.org/sharingguidelines Search PubMed.
- I. Lokteva, M. Koof, M. Walther, G. Grübel and F. Lehmkühler, Monitoring Nanocrystal Self-Assembly in Real Time Using In Situ Small-Angle X-Ray Scattering, Small, 2019, 15, 1900438 CrossRef PubMed.
- M. Wang and J. F. Brady, Microstructures and mechanics in the colloidal film drying process, Soft Matter, 2017, 13, 8156–8170 RSC.
- M. P. Howard, A. Nikoubashman and A. Z. Panagiotopoulos, Stratification Dynamics in Drying Colloidal Mixtures, Langmuir, 2017, 33, 3685–3693 CrossRef CAS PubMed.
- S. Cheng and G. S. Grest, Structure and diffusion of nanoparticle monolayers floating at liquid/vapor interfaces: A molecular dynamics study, J. Chem. Phys., 2012, 136, 214702 CrossRef PubMed.
- S. Cheng and G. S. Grest, Molecular dynamics simulations of evaporation-induced nanoparticle assembly, J. Chem. Phys., 2013, 138, 64701 CrossRef PubMed.
- M. P. Howard, W. F. Reinhart, T. Sanyal, M. S. Shell, A. Nikoubashman and A. Z. Panagiotopoulos, Evaporation-induced assembly of colloidal crystals, J. Chem. Phys., 2018, 149, 094901 CrossRef PubMed.
- A. F. Routh and W. B. Zimmerman, Distribution of particles during solvent evaporation from films, Chem. Eng. Sci., 2004, 59, 2961–2968 CrossRef CAS.
- A. Travesset, Binary nanoparticle superlattices of soft-particle systems, Proc. Natl. Acad. Sci. U. S. A., 2015, 112, 9563–9567 CrossRef CAS PubMed.
- N. Horst and A. Travesset, Prediction of binary nanoparticle superlattices from soft potentials, J. Chem. Phys., 2016, 144, 014502 CrossRef PubMed.
- A. Travesset, Nanoparticle Superlattices as Quasi-Frank-Kasper Phases, Phys. Rev. Lett., 2017, 119, 1–5 CrossRef PubMed.
- A. Travesset, Soft Skyrmions, Spontaneous Valence and Selection Rules in Nanoparticle Superlattices, ACS Nano, 2017, 11, 5375–5382 CrossRef CAS PubMed.
- J. A. Anderson, C. D. Lorenz and A. Travesset, Micellar crystals in solution from molecular dynamics simulations, J. Chem. Phys., 2008, 128, 184906 CrossRef CAS PubMed.
- T. D. Nguyen, C. L. Phillips, J. A. Anderson and S. C. Glotzer, Rigid body constraints realized in massively-parallel molecular dynamics on graphics processing units, Comput. Phys. Commun., 2011, 182, 2307–2313 CrossRef CAS.
- W. L. Jorgensen, J. D. Madura and C. J. Swenson, Optimized intermolecular potential functions for liquid hydrocarbons, J. Am. Chem. Soc., 1984, 106, 6638–6646 CrossRef CAS.
- A. Travesset, Phase diagram of power law and Lennard-Jones systems: Crystal phases, J. Chem. Phys., 2014, 141, 164501 CrossRef PubMed.
- C. D. Wick, M. G. Martin and J. I. Siepmann, Transferable Potentials for Phase Equilibria. 4. United-Atom Description of Linear and Branched Alkenes and Alkylbenzenes, J. Phys. Chem. B, 2000, 104, 8008–8016 CrossRef CAS.
- J. T. Fern, D. J. Keffer and W. V. Steele, Vapor?Liquid Equilibrium of Ethanol by Molecular Dynamics Simulation and Voronoi Tessellation, J. Phys. Chem. B, 2007, 111, 13278–13286 CrossRef CAS PubMed.
- J. T. Fern, D. J. Keffer and W. V. Steele, Measuring Coexisting Densities from a Two-Phase Molecular Dynamics Simulation by Voronoi Tessellations, J. Phys. Chem. B, 2007, 111, 3469–3475 CrossRef CAS PubMed.
- R. D. Goodwin, Toluene Thermophysical Properties from 178 to 800 K at Pressures to 1000 Bar, J. Phys. Chem. Ref. Data, 1989, 18, 1565–1636 CrossRef CAS.
- U. Landman and W. D. Luedtke, Small is different: energetic{,} structural{,} thermal{,} and mechanical properties of passivated nanocluster assemblies, Faraday Discuss., 2004, 125, 1–22 RSC.
- X. Zha and A. Travesset, Stability and Free Energy of Nanocrystal Chains and Superlattices, J. Phys. Chem. C, 2018, 122, 23153–23164 CrossRef CAS.
- C. Waltmann, N. Horst and A. Travesset, Capping Ligand Vortices as ätomic Orbitals” in Nanocrystal Self-Assembly, ACS Nano, 2017, 11, 11273–11282 CrossRef CAS PubMed.
- C. Waltmann, N. Horst and A. Travesset, Potential of mean force for two nanocrystals: Core geometry and size, hydrocarbon unsaturation, and universality with respect to the force field, J. Chem. Phys., 2018, 149, 034109 CrossRef PubMed.
- T. Waltmann, C. Waltmann, N. Horst and A. Travesset, Many Body Effects and Icosahedral Order in Superlattice Self-Assembly, J. Am. Chem. Soc., 2018, 140, 8236–8245 CrossRef CAS PubMed.
- A. Haji-Akbari and S. C. Glotzer, Strong orientational coordinates and orientational order parameters for symmetric objects, J. Phys. A: Math. Theor., 2015, 48, 485201 CrossRef.
- A. Travesset, Topological structure prediction in binary nanoparticle superlattices, Soft Matter, 2017, 13, 147–157 RSC.
- P. G. Debenedetti, Metastable Liquids Concepts and Principles, Princeton University, 1996 Search PubMed.
- C. Wohlfarth and C. Wohlfarth, Surface Tension of Pure Liquids and Binary Liquid Mixtures, Springer Berlin Heidelberg, Berlin, Heidelberg, 2019, pp. 144–144 Search PubMed.
- N. Fuchs, Evaporation and Droplet Growth In Gaseous Media, Pergamon Press, I edn., 1959, pp. 1–72 Search PubMed.
- D. Frenkel and B. Smit, Understanding Molecular Simulation, Academic Press, San Diego, 2nd edn., 2002, p. 638 Search PubMed.
- P. F. Damasceno, M. Engel and S. C. Glotzer, Predictive Self-Assembly of Polyhedra into Complex Structures, Science, 2012, 337, 453–457 CrossRef CAS PubMed.
- J. E. Galván-Moya, T. Altantzis, K. Nelissen, F. M. Peeters, M. Grzelczak, L. M. Liz-Marzán, S. Bals and G. Van Tendeloo, Self-organization of highly symmetric nanoassemblies: A matter of competition, ACS Nano, 2014, 8, 3869–3875 CrossRef PubMed.
- J. A. Anderson, C. D. Lorenz and A. Travesset, General purpose molecular dynamics simulations fully implemented on graphics processing units, J. Comput. Phys., 2008, 227, 5342–5359 CrossRef.
Footnote |
| † Electronic supplementary information (ESI) available: Definition of droplet radius (Rd); additional results for pure toluene; dependence of the droplet radius Rd on ρavg; additional results for solvent evaporation with N = 2, 4, 6, 13, 16, 21; dependence of the NN distance on the droplet packing fraction ηHS; complementary results for the free energy. See DOI: 10.1039/C9NR05908C |
| This journal is © The Royal Society of Chemistry 2019 |

