 Open Access Article
Nanodiamond uptake in colon cancer cells: the influence of direction and trypsin-EDTA treatment†
Alina
Sigaeva
 *a,
Aryan
Morita
 ab,
Simon R.
Hemelaar
a and
R.
Schirhagl
 *a
*a
aUniversity Medical Center Groningen, Antonius Deusinglaan 1, 9713 AV Gronigen, The Netherlands. E-mail: romana.schirhagl@gmail.com; aosigaeva@gmail.com
bDepartment of Dental Biomedical Sciences, Faculty of Dentistry, Universitas Gadjah, Mada, Jl Denta 1, 55281 Yogyakarta, Indonesia
First published on 13th September 2019
Abstract
Nanoparticles are routinely used in cell biology. They deliver drugs or function as labels or sensors. For many of these applications it is essential that the nanoparticles enter the cells. While some cell types readily ingest all kinds of particles, others just don't. We report that uptake can be enhanced for some cells if the particles are administered from the basolateral side of the cells (in this case from below). Compared to apical uptake (from above), we report an 8-fold increase in the number of fluorescent nanodiamonds internalized by the colon cancer cell line HT29. Up to 96% of the cells treated by a modified protocol contain at least one nanodiamond, whereas in the control group we could observe nanodiamonds in less than half of the cells. We were also able to show that simple treatment of cell clusters with trypsin-EDTA leads to the same enhancement of the nanodiamond uptake as seeding the cells on top of the nanoparticles. Although our study is focused on nanodiamonds in HT29 cells, we believe that this method could also be applicable for other nanoparticles and cells with a specific directionality.
Introduction
Nanoparticle uptake is essential for many different applications including drug delivery, labelling and intracellular sensing. Particle uptake also plays a key role in toxicity studies.We are particularly interested in fluorescent nanodiamonds (FNDs). They have a stable fluorescence and do not bleach.1 Furthermore, diamond nanoparticle sensors have been utilized already as sensitive probes for magnetic2 or electric fields,3 strain, temperature4 or chemicals in their surroundings.5 However, to exploit their full potential for cell biology, they have to enter the cell.
Nanodiamonds (and nanoparticles in general) enter cells in various different ways. Endocytosis, mediated endocytosis and membrane fusion have all been reported. However, uptake varies a lot depending on the cell type and biological function of the particle or the cell. While some cell lines ingest FNDs in all sizes and shapes6–9,10 others do not ingest FNDs at all. To circumvent this problem several strategies have been developed. The first set of strategies requires physical piercing of the cells. Electroporation,11 chemical perforation of the cell wall12 as well as microinjection with a needle or nanowire4 or gene gun bombardment13 have been used. The drawback of these techniques is that they are all more or less invasive.
The second set of techniques that has been used is chemical modification of the diamond. To this end, different polymer14–16 or peptides17 have been used as a coating. Chemical surface modification has also been utilized to facilitate uptake to achieve two goals. First, it is often necessary to prevent aggregation of diamond particles in conventional cell media. Some proteins and, most severely, salts that are present in cellular growth medium lead to aggregation.18 Secondly, one could direct diamond particles to a specific location. The most common molecules that have been (covalently or non-covalently) attached are antibodies,19 DNA molecules,20–22 biotin or streptavidin,23,24 specific receptors,25 or charged molecules.17 However, these methods all rely on more or less complex synthesis. Additionally, a thick coating can disturb the sensing process with diamond and in some cases might influence the cell biology.
Here we use a simple technique, which requires neither chemical functionalization of the diamond nor chemical perforation of the cell membrane. The only “surface coating” we perform is to add fetal bovine serum. This process coats diamonds as well but is unavoidable since they are a component of the medium (unless protein repellent coatings are used).26 Conventionally, cells are first grown and then nanoparticles are administered from the top. We reverse the process and add diamond particles first and then grow cells on top. This way the uptake occurs from the basolateral (bottom) side. A similar approach has been used for gene transfection, with cells growing on areas printed with cDNA.27 Most cells, and, particularly, cells of epithelial origin are anisotropic, with different ability for the uptake from the apical and from the basolateral membrane. Despite the fact that this polarized architecture has a dramatic effect on the efficiency of gene delivery28–30 and is exploited by natural pathogens31 it has been overlooked so far in nanodiamond uptake studies. For HT-29 cells, which are typically a difficult cell line for uptake17,32 we achieve a significant increase in uptake and for the first time report that direction matters when it comes to nanodiamonds uptake. In addition, we demonstrate a new method based on trypsin treatment of the cells. Here the strategy is to treat the cells rather than modify the particles to enhance uptake.
Experimental section
Materials and methods
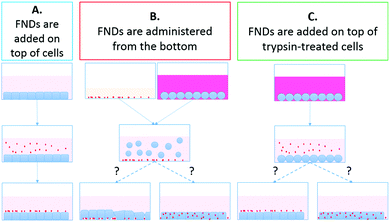
Protocol A (control): FNDs added on top of the cells: We implemented the simplest, commonly used approach to adding nanoparticles to cultured cells as control for all our experiments. The culture medium in each Petri dish was replaced with FND-containing medium. Cells were incubated for 2 hours at +37 °C, 5% CO2. Then the cells were rinsed with complete medium to remove the extracellular FNDs. To decrease the amount of FNDs that have not been internalized by the cells, but still remained adsorbed on the cell membrane, we treated cells with 0.05% trypsin-EDTA (Gibco) for 3 minutes, until the cells detached from each other and from the dish bottom. We then collected the cell suspension and centrifuged it for 5 minutes at ×1000 rpm. We discarded the supernatant, resuspended the resulting cell pellet in fresh complete medium and transferred the cells to fresh Petri dishes. Cells were then allowed to recover at +37 °C, 5% CO2 for 24 hours. Finally, they were fixed for confocal microscopy.
Protocol B: feeding cells with FNDs from the bottom: We coated the bottom of the Petri dishes with FND-containing serum. The dishes were then left in the incubator for 2 hours to allow the diamonds to settle on the bottom. HT-29 cells were treated with trypsin-EDTA for 3 minutes until detachment. Cell suspension was collected and centrifuged for 5 minutes at ×1000 rpm. We discarded the supernatant and resuspended the cell pellet in fresh serum-free DMEM-HG medium. Cell suspension was then transferred to the FND-serum-coated Petri dishes, and cells were incubated with the nanodiamonds at +37 °C, 5% CO2 for 2 hours. After the incubation, cells were again treated with trypsin-EDTA, centrifuged and transferred to fresh Petri dishes for 24-hour recovery, as described in protocol A.
Protocol C: FNDs added on top of trypsin-treated cells (control for the trypsin-EDTA effects without cell detachment): Trypsin and EDTA treatment (both individually and in combination) is known to affect composition and topography of the cell surface, causing release of cell-surface glycoproteins and glycosaminoglycans,33 as well as increase in the number of cell membrane folds and extensions,34 at least in certain cell lines. Moreover, trypsin treatment has been shown to affect the nanoparticle uptake in certain cell lines, in some cases inhibiting,35 while in others – enhancing36 nanoparticle internalization. Such changes might also influence the efficiency of the FND uptake in HT-29 cells. To account for the possible influence of trypsin-EDTA treatment on the FND internalization, we have implemented the third protocol. In this set of experiments, HT-29 cells at the desired confluency were first exposed to trypsin-EDTA. The cell morphology was observed with a bright-field microscope. When the cells appeared rounded and detached from the neighboring cells in the clusters, but were still adherent to the Petri dish bottom, we carefully removed trypsin-EDTA solution. Here it is important not to disturb the cells by touching. We then added the FND-containing medium to the dishes and incubated the cells with FNDs for 2 hours at +37 °C, 5% CO2. Afterwards, the culture was rinsed with fresh complete medium, treated with trypsin-EDTA, centrifuged, resuspended in fresh complete medium and transferred to new Petri dishes for 24-hour recovery, as described in protocol A.
Finally, we compared the average size of internalized FND aggregates. Nanodiamond aggregation naturally occurs when the particles are exposed to the cell culture medium,18 and might also happen during their uptake by the cells. Large aggregates are undesirable, as they prevent high spatial resolution of the detected signals. Besides, their transport to the intracellular compartment of interest might be impeded, and their accumulation in the cell might interfere with normal cellular functions. Due to high brightness of FNDs and their small size, which falls beyond the resolving capacity of a conventional confocal microscope, it is not possible to measure the real size of the particles directly. However, assuming that all particles have similar brightness, it is possible to use the virtual size of the object (i.e., the total volume of voxels occupied by it) recorded with the confocal microscope as a relative estimate of the real size of the aggregates.
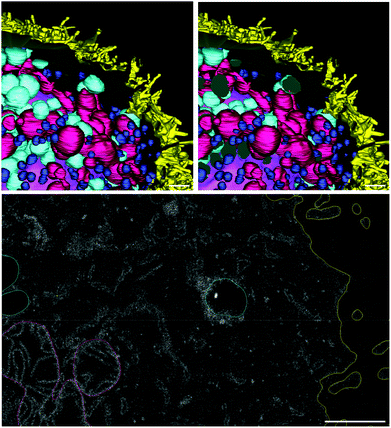
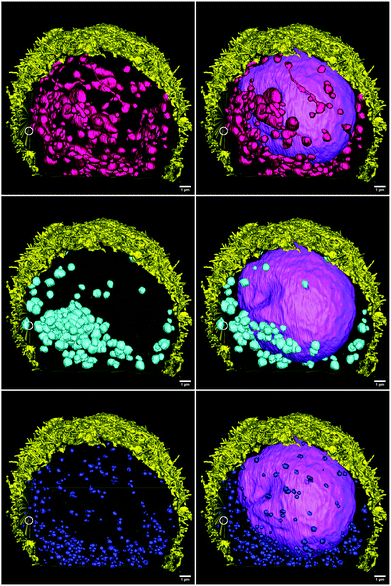
For this study, we have obtained a complete FIB-SEM z-stack of an HT-29 cell, treated according to protocol B (“FNDs from the bottom”). The sample was fixed with 1% glutaraldehyde and 4% paraformaldehyde in 0.1 M cacodylic acid, postfixed with 1% osmium tetroxide and 2.5% potassium ferrocyanide in 0.1 M cacodylic acid, and embedded in the Epon resin. The area containing one cell was imaged with FIB-SEM (Helios NanoLab 600i, Thermo Fisher Scientific). The images were used to create a 3D reconstruction of this cell, featuring the most important organelles and compartments (cell membrane, the nucleus, mitochondria, intracellular vesicles), as well as the FNDs associated with the cell. The reconstruction was made with IMOD, an open-source package of programs for reconstruction of electron microscopy serial sections.38
Results
Trypsin treatment yields higher proportion of cells with internalized FNDs
The proportion of HT-29 cells that have internalized at least one particle was relatively low in the control group (protocol A – FNDs added on top of the adherent cells). Higher concentrations of FNDs in the cell culture medium resulted in larger proportion of FND-containing cells, but only to a certain extent: we did not observe differences in this parameter between the cells treated with 1 μg mL−1 or with 5 μg mL−1 of FNDs (Table 1).| Concentration of FNDs | Protocol A (FNDs on top) | Protocol B (FNDs from the bottom) | Protocol C (trypsin + FNDs on top) |
|---|---|---|---|
| 0.5 μg mL−1 | 37.1% | 75.0% | 69.3% |
| 1 μg mL−1 | 58.3% | 80.0% | 73.8% |
| 5 μg mL−1 | 49.6% | 96.3% | 93.3% |
Both modified protocols, on the other hand, resulted in a substantial increase in the percentage of FND-containing cells. Moreover, we were able to enhance the uptake even further, reaching almost 100% internalization rates. It is also worth noting that the cells were allowed to recover for 24 hours before imaging. Therefore, some of them might have divided, potentially decreasing the proportion of FND-containing cells.
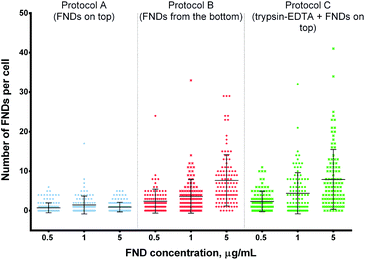 | ||
| Fig. 2 Number of FNDs internalized by cells at different concentrations of FNDs in the medium. Higher FND concentrations lead to enhanced uptake in protocols B and C, but not in protocol A. Both protocols B and C yield higher uptake than protocol A at a given FND concentration. Statistical significance of the results is summarized in ESI Table 1.† | ||
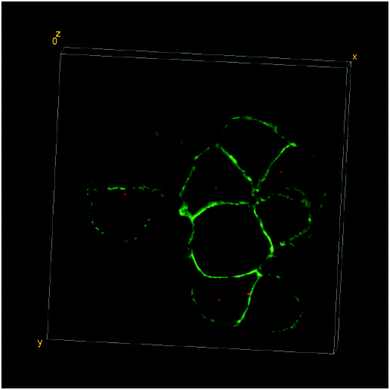 | ||
| Fig. 3 3D-reconstruction of the HT-29 GFP-EpCAM cell cluster, incubated with 5 μg mL−1 of FNDs, protocol A (“FNDs on top”). Green – GFP-EpCAM; red – FNDs. | ||
In contrast, there was a clear increase in the average number of FNDs per cell, when the cells were exposed to higher concentrations of the particles under the adapted experimental conditions (protocols B and C – “FNDs from the bottom” and “trypsin + FNDs on top”, respectively; Fig. 4 and 5).
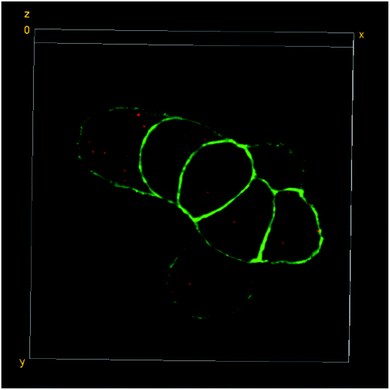 | ||
| Fig. 4 3D-reconstruction of the HT-29 GFP-EpCAM cell cluster, incubated with 5 μg mL−1 of FNDs, protocol B (“FNDs from the bottom”). Green – GFP-EpCAM; red – FNDs. | ||
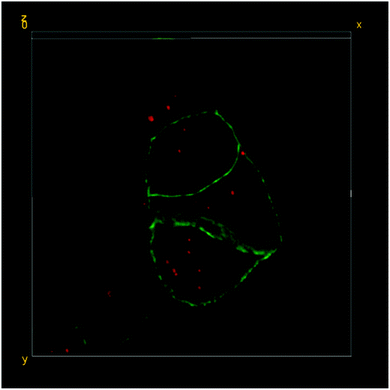 | ||
| Fig. 5 3D-reconstruction of the HT-29 GFP-EpCAM cell cluster, incubated with 5 μg mL−1 of FNDs, protocol C (“trypsin + FNDs on top”). Green – GFP-EpCAM; red – FNDs. | ||
Using the modified protocols and high FND concentrations, we were able to achieve the average counts of 4 or even 8 particles per cell, while the absolute maximum was 41 FNDs in one cell (protocol C, 5 μg mL−1 of FNDs).
At the same time, both experimental procedures resulted in higher counts of internalized FNDs even at the lowest concentration of particles in the medium (0.5 μg mL−1), as compared to the control protocol A (Fig. 2). The differences were even more pronounced, when we exposed the cells to higher concentrations of FNDs.
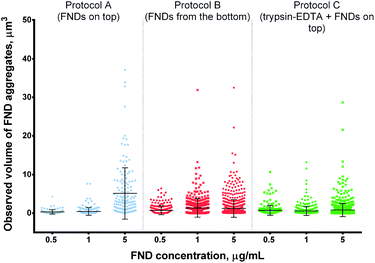 | ||
| Fig. 6 Observed volume of FND aggregates internalized by cells at different concentrations of FNDs. Higher concentrations of FNDs result in more pronounced aggregation in protocols A and B, but not protocol C. Statistical significance of the results is reported in ESI Table 2.† | ||
At low FND concentrations, all protocols yielded similar size of the FND aggregates, with larger objects observed in the “FNDs from the bottom” protocol at 1 μg mL−1. At the highest concentration, the size of FND aggregates was clearly lower under the modified protocols, as compared to the control protocol A (Fig. 6).
| Concentration of FNDs | Protocol A (FNDs on top) | Protocol B (FNDs from the bottom) | Protocol C (trypsin + FNDs on top) | |
|---|---|---|---|---|
| 0.5 μg mL−1 | 1.5 ± 1.2 (74%) | 2.1 ± 2.3 (66%) | 2.1 ± 2.1 (60%) | |
| 1 μg mL−1 | 2.0 ± 1.7 (76%) | 2.9 ± 3.4 (66%) | 4.2 ± 4.4 (69%) | |
| 5 μg mL−1 | 0.9 ± 0.8 (52%) | 5.3 ± 4.4 (66%) | 5.5 ± 5.5 (63%) | |
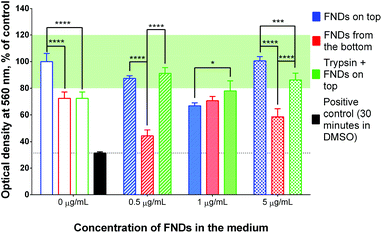
It is worth noting that trypsin-EDTA treatment on its own resulted in lower metabolic activity of the cells, even though the MTT assay was performed after a 24-hour recovery period (Fig. 7, 0 μg mL−1). At the same time, there were no significant differences in metabolic activity between the control cells and “trypsin + FNDs on top”-treated cells for any concentration of FNDs. In most cases, their metabolic activity was also within the normal range, defined as 80–120% of the activity of the non-treated cells.40 In contrast, the “FNDs from the bottom” protocol led to decreased metabolic activity at almost all concentrations of FNDs, compared to the non-treated controls, as well as to other experimental procedures.
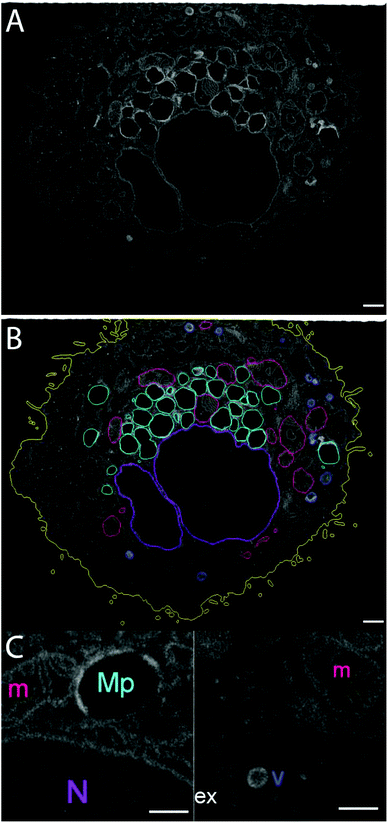
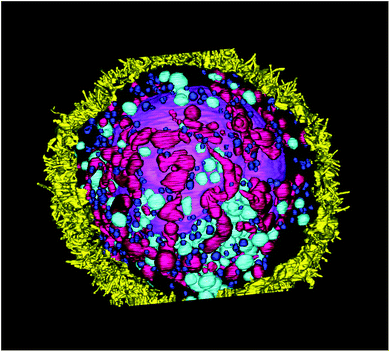
The size of individual organelles, as well as their ultramorphology, were used for the classification. The average volumes and linear dimensions of the reconstructed objects are summarized in Table 3. 3D-reconstruction of the entire volume of the sample allows us to visualize various intracellular components (Fig. 9).
| Volume, μm3 | Surface area, μm2 | Maximal linear size, μm | |
|---|---|---|---|
| Nucleus | 777.17 | 566.50 | 13.28 |
| Mitochondria (n = 153) | 0.72 ± 0.96 | 4.72 ± 5.11 | 1.74 ± 1.18 |
| Small intracellular vesicles (n = 327) | 0.05 ± 0.04 | 0.70 ± 0.41 | 0.55 ± 0.18 |
| Large intracellular vesicles (n = 114) | 0.52 ± 0.76 | 3.91 ± 5.32 | 1.17 ± 0.57 |
FND particles are also clearly visible with electron microscopy42 and can be identified by very high electron density, localized within a small volume, and high local contrast at the edge of the particle.43 These properties make them distinct from other intracellular components (ESI Fig. 6†). We were able to locate three particles associated with this cell: two on the cell surface (Fig. 10) and one in a large intracellular vesicle (Fig. 11). The size of the FNDs is shown in Table 4. It is in good agreement with the results of DLS measurements (ESI Fig. 5†). The average diameter of 135 ± 2 nm suggests that FND particles are not aggregated.
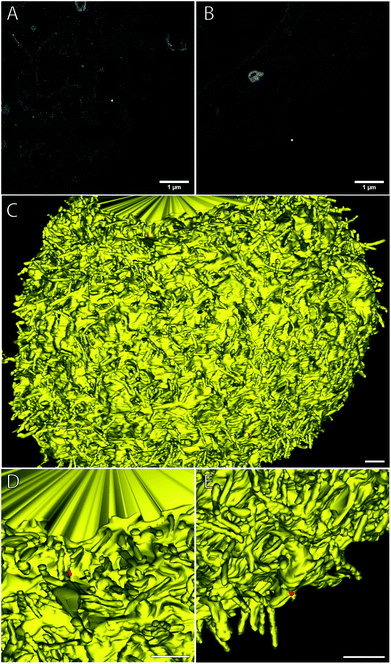 | ||
| Fig. 10 FNDs on the cell surface, as seen in raw FIB-SEM images (A, B) and after 3D reconstruction (C–E). Yellow – cell membrane; red – FNDs. Scale bar – 1 μm. | ||
| Volume, ×10−4 μm3 | Surface area, ×10−2 μm2 | Maximal linear size, nm | |
|---|---|---|---|
| FND 1 (on the cell surface, Fig. 10A and D) | 2.4 | 2.0 | 133 |
| FND 2 (on the cell surface, Fig. 10B and E) | 3.9 | 2.4 | 133 |
| FND 3 (in the vesicle, Fig. 11) | 2.8 | 2.1 | 138 |
| Average (n = 3) | 3.0 ± 0.6 | 2.2 ± 0.2 | 135 ± 2 |
3D-reconstruction also allows us to assess the distribution of different types of organelles within the cell volume (Fig. 12). The nucleus occupies the central location, while the mitochondria are rather uniformly distributed around it. On the contrary, the larger vesicles of low electron density, one of which contains the only FND particle that was truly internalized by the cell, are clustered in the basal part of the cell. The smaller, dense vesicles also tend to populate the basolateral part of the cell, although their distribution is more uniform. While this cell is not a part of a highly polarized epithelial layer, it nevertheless has certain anisotropy at the subcellular level.
Discussion
In agreement with previous studies,32 simple increase in the concentration of FNDs in the cell culture medium has not resulted in higher uptake by HT-29 cells. Moreover, we observed dramatic increase in the size of the particles, which most likely results from FND aggregation. Larger size of FNDs might also explain the bigger proportion of particles that are found at the cell membrane. It has been previously reported that large FND aggregates are not efficiently internalized by mammalian cells.39In contrast, both protocols that involve trypsin-EDTA treatment of the cells result in substantially higher uptake levels, both in terms of the number of particles per cell and the proportion of cells that have internalized FNDs. Both “FNDs from the bottom” and “trypsin-EDTA + FNDs on top” protocols also show dose-dependent increase in FND uptake, suggesting that even higher concentrations of FNDs could be used to further increase the amount of internalized particles.
In case of the modified protocols, the volume of FNDs was slightly higher than under the control conditions (although the differences were mostly non-significant). At the same time, there was no further aggregation of the particles even at the highest concentration tested. This lack of aggregation might also be among the factors that contribute to the improved FND uptake. While it is well-known that FNDs tend to aggregate in cell culture medium and similar salt-containing solutions,18 our results might point to a certain role that cells could play in this process.
The distribution of distances between the internalized FNDs and the cell membrane was not substantially affected by the modified protocols, although we saw slightly more particles colocalized with the cell membrane. It is worth noting that our approach takes into account the shortest distance between the particle and the cell membrane. Thus, an FND overlapping with the membrane and an FND that “touches” the membrane with its edge will be assigned the same distance, although these two cases might be fundamentally different from the biological point of view. Moreover, slightly larger FNDs observed in case of the modified protocols will generally have a higher probability of being found closer to the membrane than smaller particles. Lastly, the actual size of the FNDs falls beyond the resolving capacity of a conventional confocal microscope. This discrepancy can be illustrated by the volumes of FNDs estimated from the confocal images and the volumes measured from the FIB-SEM reconstruction. Therefore, the distribution of distances should be used as a guidance and should be complemented by other approaches. While yielding slightly higher proportion of FNDs colocalized with the cell membrane, the modified protocols still result in a higher absolute amount of FNDs per cell, which are truly internalized and not retained at the cell periphery.
Out of the three protocols tested, “trypsin + FNDs on top” appears to be the most beneficial one, since it results in both high FND internalization rates and high viability of the cells. Decreased cell viability in case of the “FNDs from the bottom” protocol can stem from the fact that cells are twice detached from the surface within a very short period of time (2 hours). Since the recovery time might not be sufficient and some cells might die or get lost in the process, the resulting metabolic activity, as measured by MTT assay, appears to be lower. This hypothesis is supported by the control experiments, in which the HT-29 cells were not exposed to FNDs, but went through the same repeated detachment. In this case, the metabolic activity of the cells after the 24-hour recovery period was still 28% lower than in the control group, which was detached only once (Fig. 7).
As we do not observe substantial differences in FND uptake between the “FNDs from the bottom” and “trypsin + FNDs on top” protocols, trypsin-EDTA treatment on its own seems to play the most important role in improving the uptake rates. Hence, for practical applications, we would suggest using this protocol and avoid additional passaging of the cells, since it appears to have adverse effects on the cell metabolism. Trypsin-EDTA solution has been widely used in cell culture for decades, however, its influence on the nanoparticle uptake has largely been overlooked. As trypsin cleaves receptors located at the cell surface, it can impede the receptor-mediated uptake of ligand molecules and nanoparticles that carry such ligands on their surface.35 However, the opposite effect of trypsin-EDTA treatment is counterintuitive and even less investigated. A recent study showed that the uptake of small, 5 nm carbon particles by 3 T3-L1 murine fibroblasts (but not HSC-2 human oral squamous cell carcinoma or S-G gingival epithelioid cells, which points out to a certain cell-type specificity of the response) is dramatically increased within 24 hours after the trypsinization step.36 The authors suggest that trypsin treatment affects the cell membrane composition, making it more permeable for the nanoparticles. One should note that such treatment also influences the actin cytoskeleton, possibly disrupting the cortical actin bundles and making the cell surface easier to penetrate. Another possible explanation is the exposure of larger surface area to the nanoparticles. Moreover, for the cells of epithelial origin, it might mean the exposure of a different part of the membrane – the basolateral surface, which can be more “competent” in terms of the uptake.
FIB-SEM imaging and reconstruction that was performed as part of this study offers certain insights into the process of FND internalization. Although the sample size is extremely small, and most of the particles were located at the cell surface, we did not see any free FNDs in the cytoplasm. The only truly internalized particle was contained in a large vesicle, morphologically similar to macropinosome.40 It is worth noting that this type of vesicles has a clear anisotropic distribution within the cell, unlike the smaller electron-dense vesicles, resembling endosomes, or mitochondria (Fig. 12). This anisotropy, if confirmed by further studies, might also contribute to the differential uptake of FNDs by HT-29 cells. Interestingly, the particle has not escaped the vesicle, despite 26 hours of the cell exposure to FNDs. In contrast, previous studies suggest very rapid escape (within 4 hours) of internalized FNDs from the endosomes of HepG2 cells.10 This discrepancy can be explained by the small sample size, but it can also indicate a fundamental difference in the dynamics of FND escape from different types of intracellular vesicles.
It should be pointed out that the actual mechanism of FND internalization has not been established for HT-29 cell line. Clathrin-mediated endocytosis has been reported as the dominant pathway for FND internalization in other cell lines.44 At the same time, there are studies suggesting that colon adenocarcinoma cells (HT-29 or Caco-2 cell lines) are able to internalize nanoparticles via macropinocytosis.45,46 Moreover, due to the flake-like shape and sharp edges of FNDs, they are also able to pierce biological membranes.10 While this mechanism has only been demonstrated for intracellular membranes (such as endosomal membranes), one cannot completely rule out the FND internalization via mechanical penetration of the cell membrane.
Conclusions
Low internalization rates can be one of the things preventing the use of nanoparticles and, more specifically, FNDs for biomedical applications. In our study, we address the problem of low FND uptake in HT-29 cells, which generally do not readily internalize nanoparticles. We have shown that a simple treatment of cell clusters with trypsin-EDTA solution, routinely used for cell culture, drastically enhances FND uptake. Proposed procedure does not require any specific modification of FNDs and can be applicable for commercially available nanoparticles. Moreover, it has little effect on the general distribution of internalized FNDs within the cells and the particle aggregation. Apart from the known effect on cells, the trypsin treatment might alter the protein corona that is formed on diamond particles. We also did not observe significant adverse effects of the investigated procedure on the metabolic activity of the cells.Notably, our results indicate the presence of a certain anisotropy at the subcellular level in nonconfluent HT-29 cells. While the polarized state of epithelial cells in monolayers is well known, the anisotropy of nonconfluent cells usually attracts less attention. We suggest that this aspect can play a substantial role in the nanoparticle uptake and needs to be investigated in more detail. Further studies are necessary to unravel the mechanism of FND internalization by HT-29 cells, and, even more importantly, of increased FND uptake rates after trypsin-EDTA treatment.
Conflicts of interest
There are no conflicts of interest to declare.Acknowledgements
We would like to acknowledge Anne Greet Bittermann and the Scopem facility at ETH Zurich for performing FIB-SEM imaging. We would like to thank Prof. Giepmans and his group for access to confocal microscopy which has been performed at the UMCG Imaging and Microscopy Center (UMIC) and for providing cells. Furthermore, we are grateful for financial support by the European commission in the form of an ERC starting grant 714289 - Stress Imaging.Notes and references
- S. J. Yu, M. W. Kang, H. C. Chang, K.-M. Chen and J.-C. Yu, J. Am. Chem. Soc., 2005, 127, 17604–17605 CrossRef CAS.
- G. Waldherr, J. Beck, P. Neumann, R. S. Said, M. Nitsche, M. L. Markham, D. J. Twitchen, J. Twamley, F. Jelezko and J. Wrachtrup, Nat. Nanotechnol., 2012, 7, 105–108 CrossRef CAS.
- E. Van Oort and M. Glasbeek, Chem. Phys. Lett., 1990, 168, 529–532 CrossRef CAS.
- G. Kucsko, P. C. Maurer, N. Y. Yao, M. Kubo, H. J. Noh, P. K. Lo and H. Park, Nature, 2013, 500(7460), 54–58 CrossRef CAS.
- S. Steinert, F. Ziem, L. T. Hall, A. Zappe, M. Schweikert, N. Gotz, A. Aird, G. Balasubramanian, L. Hollenberg and J. Wrachtrup, Nat. Commun., 2013, 4, 1607 CrossRef CAS.
- O. Faklaris, D. Garrot, V. Joshi, F. Druon, J.-P. Boudou, T. Sauvage, P. Georges, P. A. Curmi and F. Treussart, Small, 2008, 4(12), 2236–2239 CrossRef CAS.
- I. Pope, L. Payne, G. Zoriniants, E. Thomas, O. Williams, P. Watson, W. Langbein and P. Borri, Nanotechnology, 2014, 9, 940–946 CAS.
- L. P. McGuinness, Y. Yan, A. Stacey, D. A. Simpson, L. T. Hall, D. Maclaurin, S. Prawer, P. Mulvaney, J. Wrachtrup, F. Caruso, R. E. Scholten and L. C. L. Hollenberg, Nat. Nanotechnol., 2011, 6, 358–363 CrossRef CAS.
- J.-Y. Fang, V. Vaijayanthimala, C.-A. Cheng, S.-H. Yeh, C.-F. Chang, C.-L. Li and H.-C. Chang, Small, 2011, 7(23), 3363–3370 CrossRef.
- Z. Chu, S. Zhang, B. Zhang, C. Zhang, C.-Y. Fang, I. Rehor, P. Cigler, H.-C. Chang, G. Lin, R. Liu and Q. Li, Sci. Rep., 2014, 4, 4495 CrossRef PubMed.
- Y. K. Tzeng, O. Faklaris, B.-M. Chang, Y. Kuo, J.-H. Hsu and H.-C. Chang, Angew. Chem., Int. Ed., 2011, 50, 2262–2265 CrossRef CAS.
- S. R. Hemelaar, K. J. van der Laan, S. R. Hinterding, M. V. Koot, E. Ellermann, F. P. Perona-Martinez, D. Roig, S. Hommelet, D. Novarina, H. Takahashi, M. Chang and R. Schirhagl, Sci. Rep., 2017, 7(1), 5862 CrossRef.
- A. Webster, P. Coupland, F. D. Houghton, P. Coupland, F. D. Houghton, H. J. Leese and J. W. Aylott, Biochem. Soc. Trans., 2007, 35, 538–543 CrossRef CAS.
- J. Neburkova, J. Vavra and P. Cigler, Curr. Opin. Solid State Mater. Sci., 2017, 21(1), 43–53 CrossRef CAS.
- I. Rehor, H. Mackova, S. K. Filippov, J. Kucka, V. Proks, J. Slegerova, S. Turner, G. Van Tendeloo, M. Ledvina, M. Hruby and P. Cigler, ChemPlusChem, 2014, 79(1), 21–24 CrossRef CAS.
- I. Rehor, J. Slegerova, J. Kucka, V. Proks, V. Petrakova, M. P. Adam, F. Treussart, S. Turner, S. Bals, P. Sacha and M. Ledvina, Small, 2014, 10(6), 1106–1115 CrossRef CAS.
- T. Zheng, F. Perona Martínez, I. M. Storm, W. Rombouts, J. Sprakel, R. Schirhagl and R. De Vries, Anal. Chem., 2017, 89(23), 12812–12820 CrossRef CAS.
- S. R. Hemelaar, A. Nagl, F. Bigot, M. M. Rodríguez-García, M. P. de Vries, M. Chipaux and R. Schirhagl, Microchim. Acta, 2017, 184(4), 1001–1009 CrossRef CAS.
- V. Vermeeren, L. Grieten, N. Vanden Bon, N. Bijnens, S. Wenmackers, S. D. Janssens, K. Haenen, P. Wagner and L. Michiels, Sens. Actuators, B, 2011, 157, 130–138 CrossRef CAS.
- D. T. Tran, V. Vermeeren, L. Grieten, S. Wenmackers, P. Wagner, J. Pollet, K. P. Janssen, L. Michiels and J. Lammertyn, Biosens. Bioelectron., 2011, 26(6), 2987–2993 CrossRef CAS PubMed.
- W. Yang, J. E. Butler, J. N. Russell and R. J. Hamers, Langmuir, 2004, 20, 6778–6787 CrossRef CAS.
- T. Zhang, A. Neumann, J. Lindlau, Y. Wu, G. Pramanik, B. Naydenov, F. Jelezko, F. Schüder, S. Huber, M. Huber and F. Stehr, J. Am. Chem. Soc., 2015, 137(31), 9776–9779 CrossRef CAS.
- A. Krüger, J. Stegk, Y. Liang, L. Lu and G. Jarre, Langmuir, 2008, 24(8), 4200–4204 CrossRef.
- A. Krüger, Y. Liang, G. Jarre and J. Stegk, J. Mater. Chem., 2006, 16(24), 2322–2328 RSC.
- B. Zhang, Y. Li, C.-Y. Fang, C.-C. Chang, C.-S. Chen, J.-J. Chen and H.-C. Chang, Small, 2009, 5(23), 2716 CrossRef CAS.
- V. Merz, J. Lenhart, Y. Vonhausen, M. E. Ortiz-Soto, J. Seibel and A. Krüger, Small, 2019, e1901551 CrossRef.
- J. Ziauddin and D. M. Sabatini, Nature, 2001, 411, 107–110 CrossRef CAS.
- I. Zuhorn, D. Kalicharan, G. T. Robillard and D. Hoekstra, Mol. Ther., 2007, 15(5), 946–953 CrossRef CAS.
- X. Q. Zhang, M. Chen, R. Lam, X. Xu, E. Osawa and D. Ho, ACS Nano, 2009, 3(9), 2609–2616 CrossRef CAS PubMed.
- C. Cui, Y. Wang, K. Yang, Y. Wang, J. Yang, J. Xi, M. Zhao, J. Wu and S. Peng, J. Biomed. Nanotechnol., 2015, 11(1), 70–80 CrossRef CAS.
- C. Wang, E. de Jong, K. A. Sjollema and I. Zuhorn, Sci. Rep., 2016, 6, 21436 CrossRef CAS.
- V. Paget, J. A. Sergent, R. Grall, S. Altmeyer-Morel, H. A. Girard, T. Petit, C. Gesset, M. Mermoux, P. Bergonzo, J. C. Arnault and S. Chevillard, Nanotoxicology, 2014, 8, 46–56 CrossRef CAS.
- K. G. Vogel, Exp. Cell Res., 1978, 113(2), 345–357 CrossRef CAS.
- S. Moskalewski and J. Thyberg, Cell Tissue Res., 1981, 220(1), 51–60 CrossRef CAS.
- Z. Li, C. Shuai, X. Li, X. Li, J. Xiang and G. Li, J. Biomed. Mater. Res., Part A, 2013, 101, 2846–2850 CrossRef.
- T. Serdiuk, S. Alekseev, V. Lysenko, V. Skryshevsky and A. Géloën, Nanoscale Res. Lett., 2014, 9, 568 CrossRef PubMed.
- R. Dougherty, 11th AIAA/CEAS Aeroacoustics Conference, 2005 Search PubMed.
- J. R. Kremer, D. N. Mastronarde and J. R. McIntosh, J. Struct. Biol., 1996, 116(1), 71–76 CrossRef CAS PubMed.
- S. R. Hemelaar, B. Saspaanithy, S. R. M. L'Hommelet, F. P. Perona Martinez, K. J. van der Laan and R. Schirhagl, Sensors, 2018, 18, 355 CrossRef.
- M. C. Kerr and R. D. Teasdale, Traffic, 2009, 10(4), 364–371 CrossRef CAS.
- B. R. Liu, S.-Y. Lo, C.-C. Liu, C.-L. Chyan, Y.-W. Huang, R. S. Aronstam and H.-J. Lee, PLoS One, 2013, 8(6), e67100 CrossRef CAS.
- S. R. Hemelaar, P. de Boer, M. Chipaux, W. Zuidema, T. Hamoh, F. Perona Martinez, A. Nagl, J. P. Hoogenboom, B. N. G. Giepmans and R. Schirhagl, Sci. Rep., 2017, 7(1), 720 CrossRef CAS.
- M. P. Lake and L. S. Bouchard, PLoS One, 2017, 12(6), e0179295 CrossRef.
- E. Perevedentseva, S.-F. Hong, K.-J. Huang, I.-T. Chiang, C.-Y. Lee, Y.-T. Tseng and C.-L. Cheng, J. Nanopart. Res., 2013, 15, 1834 CrossRef.
- N. K. Y. Wong, R. A. Shenoi, S. Abbina, I. Chafeeva, J. N. Kizhakkedathu and M. K. Khan, Biomacromolecules, 2017, 18(8), 2427–2438 CrossRef CAS.
- I. C. Trindade, G. Pound-Lana, D. G. S. Pereira, L. A. M. de Oliveira, M. S. Andrade, J. M. C. Vilela, B. B. Postacchini and V. C. F. Mosqueira, Eur. J. Pharm. Sci., 2018, 124, 89–104 CrossRef CAS.
Footnote |
| † Electronic supplementary information (ESI) available. See DOI: 10.1039/c9nr04228h |
| This journal is © The Royal Society of Chemistry 2019 |

