 Open Access Article
High strength nanostructured films based on well-preserved β-chitin nanofibrils†
Qiong
Wu
 a,
Erik
Jungstedt
a,
Mária
Šoltésová
a,
Erik
Jungstedt
a,
Mária
Šoltésová
 a,
Ngesa E.
Mushi
*bc and
Lars A.
Berglund
ac
aKTH Royal Institute of Technology, School of Engineering Sciences in Chemistry, Biotechnology and Health, SE-100 44 Stockholm, Sweden
bDepartment of Mechanical and Industrial Engineering, College of Engineering and Technology, University of Dar es Salaam, Dar es Salaam, Tanzania. E-mail: ngeza@kth.se
cWWSC Wallenberg Wood Science Center, Stockholm, SE-100 44, Sweden
First published on 9th May 2019
Abstract
Chitin nanofibrils (ChNF) are interesting high-value constituents for nanomaterials due to the enormous amount of waste from the seafood industry. So far, the reported ChNFs are substantially modified and chemically degraded (shortened) during extraction from the organisms. Here, highly individualized and long native-state β-chitin nanofibrils from Illex argentinus squid pens are prepared. A mild treatment was developed to preserve the molar mass, aspect ratio, degree of acetylation and crystallite structure. The fibrils show a uniform diameter of 2–7 nm, very high aspect ratio (up to 750), high degree of acetylation (DA = 99%), and high molar mass (843![[thin space (1/6-em)]](https://www.rsc.org/images/entities/char_2009.gif) 500 dalton). The powder X-ray diffraction analysis showed the preserved crystallite structure after protein removal. These “high quality” ChNFs were used to prepare nanostructured films via vacuum filtration from stable hydrocolloids. The effects of well-preserved “native” fibrils on morphology, and film properties (mechanical and optical), were studied and compared with earlier results based on coarser and shorter, chemically degraded chitin fibrils.
500 dalton). The powder X-ray diffraction analysis showed the preserved crystallite structure after protein removal. These “high quality” ChNFs were used to prepare nanostructured films via vacuum filtration from stable hydrocolloids. The effects of well-preserved “native” fibrils on morphology, and film properties (mechanical and optical), were studied and compared with earlier results based on coarser and shorter, chemically degraded chitin fibrils.
1. Introduction
Nanoscale fibrils, such as cellulose, from biological organisms are of interest as eco-friendly components of comparably low cost for nanotechnological applications. Chitin fibrils offer an alternative, and due to an axial fibril modulus of around 60 GPa,1 chitin is the main load-bearing component in the internal skeleton of molluscs (e.g., squid pens) and are of great importance in the external skeleton of arthropods (insects and crustaceans). Squid pens are interesting nanocomposites in the form of hydrated chitin–protein composites. It was recently demonstrated that proteins exhibit important structural functions by controlling the extent of hydration in biological chitin–protein composites.2,3 Chitin has analogous structural functions to the cellulose nanofibrils in plant cell walls. Chitin has structural similarities to the cellulose molecule, but with a bulkier acetamide group in the C-2 position. During biosynthesis, chitin molecules self-assemble into nanoscale chitin microfibrils with a high modulus, strength and high specific surface area. The fibrils are embedded in a protein matrix to form biological nanocomposites with mechanical functions.4,5 The fibrils are semicrystalline, and there are two main forms of crystallographic structures: α- and β-chitin. α-Chitin is the most common. The main molecules are arranged in an anti-parallel manner with strong intermolecular hydrogen bonding.6 The polymer molecules in β-chitin are packed in a parallel manner with relatively weak intermolecular forces.7Isogai et al. studied deacetylated β-chitin nanofibrils from squid pens and tubeworms, as well as α-chitin nanofibrils from crabs. The focus of the studies is on extraction and structural characterization.8–11 Ifuku et al. primarily studied α-chitin nanofibrils from crabs, especially their extraction and chemical modification, and also their mechanical properties.12–15 In previous studies, the present group developed a mild extraction protocol for α-chitin fibril disintegration with the purpose of preserving the native characteristics and length of the nanofibrils.16,17
Pure chitin nanofibrils are expected to have high mechanical properties, e.g. tensile strength, compared to regenerated chitin. The main reason is that the molar mass of regenerated chitin is substantially reduced. Saito and co-workers estimated the tensile strength of α-chitin to be 1.6 GPa and of β-chitin to be 3 GPa,18 using an indirect approach based on the saturation lengths of chitin fibrils after ultrasonication. The theoretical modulus of chitin is reported to be 60 GPa,1 and the density is only 1.425 g cm−3.19 Partially deacetylated chitin dominates the literature, and demonstrates both good mechanical performance and biological activity in the form of antimicrobial properties.20
Previous studies on squid pen β-chitin fibrils reported a cross-sectional width of 3–4 nm, a length of a few microns, a crystallinity index of 0.37 and a degree of acetylation (DA) of 90%,8 and it is of interest to better preserve the native structure. Pure β-chitin with a high DA (100%) was also obtained from tubeworms.21 In general, α-chitin has a lower aspect ratio (length/diameter) compared to β-chitin. Ifuku and co-workers prepared α-chitin with a diameter of 10–20 nm and from prawn or crab shells fibrillated by a simple grinding treatment after the removal of proteins and minerals.13,22 Regenerated chitin nanofibrils could be an alternative to native chitin nanofibrils, but molar mass degradation impedes their strength properties, and the use of toxic chemicals during processing can be a problem,23–25 as well as the preparation procedure for man-made nanofibrils. For biomedical and pharmaceutical applications,24 the properties of regenerated chitin are sufficient. Previously, long α-chitin fibrils (∼1 μm) with a small diameter (3–5 nm) were obtained by mild treatment of lobsters.17 These studies show that mild treatment results in extracted chitin fibrils of increased length since chemical degradation (reduced chitin molar mass) is limited. The corresponding nanostructured films and hydrogels showed high mechanical performance (film: strength 153 MPa, modulus 7.3 GPa; hydrogel: storage modulus of 13 kPa at 3% solid content). These observations are of fundamental interest, and also suggest potential for chitin fibrils in new nanotechnology applications.
A challenge in chitin extraction from organisms is polymer degradation, in the form of deacetylation and decreased chitin molar mass and fibril length. Additional problems include high protein content, and inhomogeneous distribution of large diameter fibrils. One difficulty, from the extraction or disintegration point of view, is the high content of mineral in many crustaceans. The acid treatment to remove minerals reduces chitin molar mass. Also, harsh deproteinization treatment results in a lowered degree of acetylation. Another practical challenge is that mild deproteinization of α-chitin from lobsters can take as much as 2 weeks. Studies of individualized α-chitin fibrils (with low or no protein content) show a low degree of chitin acetylation (∼73%),9,15 since sodium hydroxide removes acetyl groups.
Previous work on squid pen chitin has not focused on mechanical properties, and it is possible that even milder extraction protocols can be used in order to better preserve native properties. Isogai et al. (2017) extracted squid pen chitin fibrils from Loligo bleekeri. Fibrils were 0.6–1.2 μm long, with a diameter of 4.1 nm and a DA of 90%.18 In another study, simple mechanical treatment (ultrasonication) under acidic conditions was used to prepare squid pen chitin nanofibrils (from Todalodes pacificus).21 A diameter of 3–4 nm was reported, with fibril lengths at the microscale. Chemical pre-treatment conditions included deproteinization and demineralization, although experimental details are unclear. A lower NaOH concentration (10%) was used compared to 20% for the preparation of α-chitin nanofibrils from lobsters, or 33% for the preparation of deacetylated chitin nanofibrils from crabs. Pérez-Martín et al. (2017) studied squid pen chitin from Illex argentinus (the same as here) for chitosan preparation.26 Trung et al. extracted squid pen chitin (Loligo chenisis), but the DA was lower than 90%.27 Native chitin nanofibrils were extracted from crab shells by mild treatment with calcium chloride dihydrate–saturated methanol solution without a base or acid, although physical morphologies and mechanical properties were not in focus.24,25 It is possible that the initial degree of acetylation (not necessarily the native DA) may have been preserved for this procedure.24 Chemical individualization by the Ca2+–methanol saturated system has advantages compared to mechanical homogenization in terms of lower energy consumption.
Squid pens have several advantages as a source of chitin. It is abundant in the form of waste from seafood production. The production in world squid fisheries was 2–3 million tonnes per year from 2001 to 2010.28 The mineral content is negligible in the squid pens, and this facilitates mild extraction. Intermolecular forces in β-chitin crystallites are weaker than those in α-chitin, which provides higher chemical accessability and reactivity.29–31 β-Chitin has higher affinity to water, which may facilitate disintegration from biological tissue.
For α-chitin extraction, classical chemical treatments involve HCl treatment at room temperature and NaOH treatment at elevated temperature. This often results in length degradation and low mechanical properties of the isolated chitin nanofibrils.14 In a previous study, mild deproteinization at room temperature was used in order to remove the strongly “bound” protein from the lobster exoskeleton and preserve the degree of acetylation, molar mass and chitin crystallinity.17
In the present β-chitin study, modified mild conditions (10% NaOH for 12 h and room temperature) were used for deproteinization. The objective is to preserve the native structure of chitin, which may improve the mechanical properties of chitin films. Improved chitin fibrils would be of great interest in biochemically active materials such as films,32 polymer matrix nanocomposites,33 foams34 and hydrogels,35 and also for other nanotechnology applications.
2. Experimental
2.1 Materials
Fresh frozen squid pens of the species namely Illex argentinus were supplied by TIGMAK from the fish processing industry in Spain. The pens were stored in a freezer at −25 °C until utilization. All chemicals were purchased from Sigma Aldrich and used as received.2.2 Disintegration of β-chitin nanofibrils from squid pens
The squid pens (24 g dry weight) were cut into small pieces of roughly 20 mm using scissors and washed with excess water to remove dirt. The washed pens were chemically treated to remove minerals, lipids and protein, respectively, at room temperature. The treatment protocol was adopted from the previous work21,36 with some modifications to preserve the chitin physical properties such as the molar mass and degree of acetylation. Acid treatment was performed in 1 M HCl aqueous solution (30 ml g−1) for 1 h to remove small amounts of mineral residues, such as calcium carbonate particles. The product was washed before being immersed in 20% ethanol solution and stirred overnight to extract lipids. The sample was transferred to 2.5 M NaOH (20 ml g−1) and stirred overnight to remove proteins. Washing was performed to neutrality between each step. The product was protonated by dispersing in 4% acetic acid solution and mechanically treated with a motor-driven refiner overnight until chitin fibrils were partially individualized. The partially individualized nanofibril gel was passed one time in a Microfluidizer (M-110EH, Microfluidics Ind., Newton, MA, USA) first through a small chamber of 200 μm and then 100 μm microfluidic channels arranged in series to completely individualize the chitin nanofibrils. The final yield was about 20%.2.3 Transmission electron microscopy (TEM)
TEM imaging was performed using a Hitachi HT7700 TEM at 100 kV accelerating voltage. A drop of 0.02 wt% chitin dispersion was deposited onto ultrathin carbon-coated 400 mesh copper grids (Ted Pella, USA). The excess liquid was absorbed with filter paper after 1 min. Likewise, a drop of 2 wt% uranyl acetate negative stain was added on the grid and the excess solution was removed after 1 min. The sample was then dried in open air overnight. All micrographs were obtained with a charge coupled device (CCD) camera.2.4 Cryo-scanning electron microscopy (Cryo-SEM)
The sample was analyzed by using a Philips XL-30 FEG Environmental SEM operating at 5 kV. A small piece of the squid pen was fixed on the sample holder and transferred to the cryostage for rapid cooling. In order to avoid the destruction of the microstructure by the formation of ice crystals, the sample was cooled down rapidly to −196 °C by liquid nitrogen. Then, the sample was fractured to obtain a fresh surface and the stage was heated to around −90 °C to sublimate the non-crystalline ice on the surface. The sample was then transferred to the observation chamber in the SEM. Secondary electron images were captured from the fresh surfaces.2.5 X-ray diffraction (XRD)
The XRD patterns were collected in the 2θ range of 5°–35° using an X-ray diffractometer (RINT 2500HF/PC, Rigaku Co., Ltd) with Cu Kα radiation (λ = 1.5418 Å) at 40 kV and 40 mA.2.6 Degree of acetylation (DA)
The 13C NMR spectra were recorded on a Bruker Avance HD 500 MHz spectrometer operating at a resonance frequency of 125.8 MHz, equipped with a 4 mm MAS probe. 133 mg of freeze-dried chitin nanofibrils were filled in a conventional MAS rotor. The sample was spanned at 15 kHz, and the 13C MAS spectra were recorded using a single-pulse experiment with high-power decoupling at 25 °C, a 13C pulse length of 2.75 μs, and the number of scans of 256. Carbon-13 relaxation times were estimated prior to the experiments by CP T1 MAS experiment37 and relaxation delay was set approx. 7-times the longest T1 to 300 s, resulting in the total experimental time of 21 h. A background spectrum of an empty rotor, recorded with the same setup, was subtracted from the chitin spectrum. The resulting spectrum was phase corrected, baseline corrected using polynomial, and chemical shifts were referenced according to the external adamantane reference.2.7 Intrinsic viscosity
The intrinsic viscosity [η] was measured by capillary solution viscometry. Freeze-dried chitin nanofibrils were dissolved in N,N-dimethyl acetamide/8% lithium chloride (DMAc/8% LiCl) at five different concentrations (0.023–0.038 g dL−1). A LAUDA iVisc Capillary Viscometer equipped with an Ubbelhode viscometer was used to record the flow-through time at 23 ± 0.1 °C in a water tank. The viscosity average molecular weight Mη was estimated using the Mark–Houwink equation (eqn (1)):38| [η] = 2.1 × 10⁻⁴M0.88η | (1) |
2.8 Preparation of β-chitin films
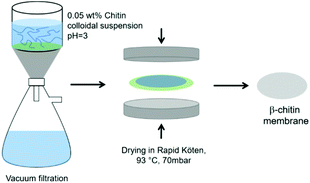
A suspension of ca. 0.05 wt% β-chitin nanofibrils was mixed using an Ultra Turrax mixer (IKA, D125 Basic) at 12![[thin space (1/6-em)]](https://www.rsc.org/images/entities/char_2009.gif) 000 rpm for 10 min to allow homogeneous dispersion. The preparation setup cartoon is illustrated in Fig. 1. The solid weight of dry content was ca. 0.4 g. Vacuum filtration was performed using a filter funnel of ca. 7.2 cm in diameter and a 0.65 μm pore size filter membrane (DVPP, Millipore) to obtain a nanopaper hydrogel (wet cake) with about ca. 90% water content. The wet cake was dried in the drying stage of a Rapid Köthen sheet former (Germany) at 70 mbar and 93 °C to form chitin nanostructured films.
000 rpm for 10 min to allow homogeneous dispersion. The preparation setup cartoon is illustrated in Fig. 1. The solid weight of dry content was ca. 0.4 g. Vacuum filtration was performed using a filter funnel of ca. 7.2 cm in diameter and a 0.65 μm pore size filter membrane (DVPP, Millipore) to obtain a nanopaper hydrogel (wet cake) with about ca. 90% water content. The wet cake was dried in the drying stage of a Rapid Köthen sheet former (Germany) at 70 mbar and 93 °C to form chitin nanostructured films.
2.9 Transmittance
A high brightness light source with wavelengths ranging from 170 to 2100 nm (EQ-99, Energetiq Technology Inc.) was used to measure the regular-light transmittance of the β-chitin nanostructured films. The incident beam was first directed into an integrating sphere through one port. Light was directed out of another port of the sphere through an optical fiber, which was recorded by a spectrometer as the WHITE (W) spectrum of the incidence. The DARK (D) spectrum was then recorded by turning off the light source. A sample with a size of 20 mm × 20 mm was then put just in front of the sphere's input port, and the SIGNAL (S) spectrum was then recorded. The total transmittance spectrum (including both specular and diffuse transmittance) was then calculated by (S − D)/(W − D). Three replicates were used.2.10 Scanning electron microscopy (SEM)
SEM images were obtained using a Field-Emission Scanning Electron Microscope (FE-SEM, Hitachi S4800, Japan) at an accelerating voltage of 5 kV. For the cross-sectional and internal microstructure observation, the films were fractured in liquid nitrogen. The samples were sputter-coated with platinum/palladium (60/40) for 30 s using a Cressington high resolution sputter coater (model 208HR).2.11 Tensile test
Tensile tests were performed using an Instron Universal Tensile Testing Machine Model 5944 (UK) equipped with a 500 N load cell and a video extensometer. Seven (7) specimens were prepared with a width of 5 mm and a length of 60 mm. Sample thicknesses were typically 40–80 μm. The specimens were conditioned at 50% relative humidity and a temperature of 23 °C for 12 h and the tests were performed under the same conditions. A strain rate of 3% per min was used. Mechanical properties such as Young's modulus (E), tensile strength (σ*), and tensile strain to failure were estimated based on the analysis of nominal stress–strain curves.2.12 Digital image correlation (DIC)
A displacement field measurement technique, digital image correlation (DIC), was utilized to evaluate the strain field distribution on the surface of chitin films during deformation. The technique is advantageous during progressing development of the strain field distribution in thin specimens.39 The equipment used was a 2/3′′ 8-bit camera sensor with 5 M pixel attached to a telecentric lens with a field of view of 61.4 × 51.5 mm × mm and a working distance of 181.8 mm, which gave a mm to pixel ratio of 0.0025 mm per pixel. The subset, step and strain filter size were chosen as 41 pixels, 7 pixels and 5 pixels, respectively, which resulted in a virtual strain gauge length of 73 pixels corresponding 0.18 mm.2.13 Fourier transform infrared spectroscopy (FTIR)
Chitin films of ca. 10 μm thickness were prepared by solvent casting and drying at ambient atmosphere. Prior to FTIR analyses, the film was further dried in a vacuum oven at 50 °C for 5 hours. The FTIR spectrum was recorded in transmission mode on a FTIR spectrometer Spectrum 2000 (PerkinElmer). Scanning was performed 16 times over the wavelength range from 600 to 4000 cm−1.3. Results and discussion
3.1 From squid pens to β-chitin nanofibrils
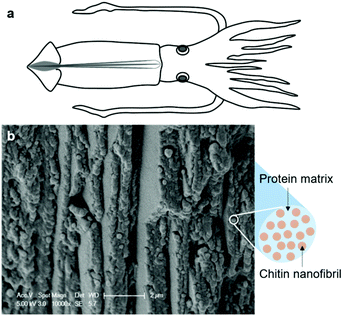
A raw squid pen (a cartoon illustrated in Fig. 2a) is a semi-flexible structure, which serves as a “backbone” in the squid.40 The freeze-fractured raw squid pen shows a layered structure in the cross-sectional morphology. The layers are packed parallel to the long axis of the squid pen, as shown in Fig. 2b. A cartoon image to the right of Fig. 2(b) shows that the chitin fibril structure is embedded in the protein-rich matrix of the squid pen.41 These chitin/protein microfibrils are aligned along the long axis of the squid pen with a diameter of 220 ± 23 nm in the hydrated state. After freeze-drying of the squid pens, local areas showed a fiber-like structure, as shown in Fig. S1.† This could be due to the isolation of the chitin/protein microfibrils after ice sublimation. The average diameter of the chitin/protein microfibrils was 14 ± 7 nm in the dry state.The mineral content in Illex argentinus squid pens was negligible (0.9 wt%, measured based on the ash content), therefore the main process for the isolation of β-chitin from squid pens is based on the removal of proteins. The current protocol uses mild treatment (10% NaOH) at room temperature and a short treatment time (12 h), as compared to previous “mild” treatment for lobster α-chitin nanofibrils (2 weeks in 20% NaOH).17 In a previous squid β-chitin study, the acid treatment was carried out for 2 h (1 h in this study) and deproteinization was done four times36 compared to only once in the present study. A degree of acetylation of 90% was reported in the previous study, substantially lower than this study. In this protocol, acetic acid increases electrostatic repulsion by protonating the amino groups, which facilitates chitin individualization.13,21
3.2 Nanostructure of β-chitin nanofibrils
The transmission electron micrographs of the individualized β-chitin nanofibrils are shown in Fig. 3a and b. The diameters of chitin nanofibrils ranged from 2 to 7 nm, based on TEM images. The images show no sign of agglomerates or bundles of nanofibrils (chitin/protein microfibril aggregates). This suggests individualized fibrils are obtained by the present disintegration method. The presence of fine, slender and uniform chitin nanofibrils (average diameter of 4.1 nm) as compared to the chitin/protein microfibrils in Fig. S1† (average diameter of 14 nm) suggests that most proteins are removed. Isogai et al. (2017) reported squid chitin nanofibrils (Loligo bleekeri) of similar size with lengths of 0.6–1.2 μm and diameters of 4.1 nm,18 although the final fibrils were deacetylated. The residual protein content of the present fibrils was 4 wt%, whereas the original squid pens contain 64 wt% of protein.42 The majority of the present nanofibrils have lengths in the range 1–3 μm. This leads to aspect ratios of up to 750. The previous α-chitin nanofibrils from lobsters showed aspect ratios of around 250.17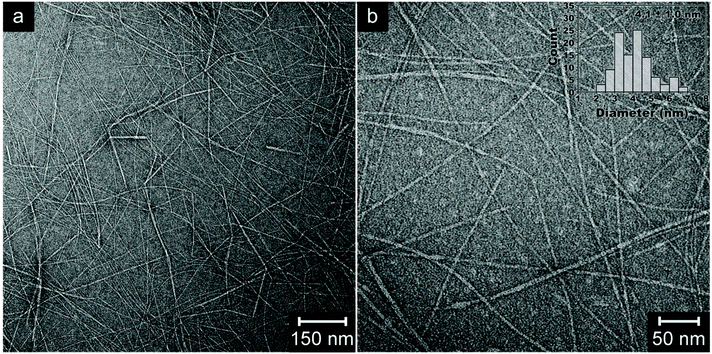 | ||
| Fig. 3 Transmission electron micrographs (a and b) and size distribution (inset) of β-chitin nanofibrils isolated from squid pens by mild treatments. | ||
Fig. 4 shows the XRD patterns of the original squid pen and the deproteinized β-chitin nanofibrils. Peaks at 8.6° indicate the crystal plane (010), and peaks located at 19.6° specify the crystal planes (100) + (1–10) + (110). The same locations of the peaks revealed that the original β-chitin structure was preserved during nanofibril isolation, possibly due to the mild processing conditions. Crystallinity indices were calculated according to eqn (2):
 | (2) |
 | (3) |
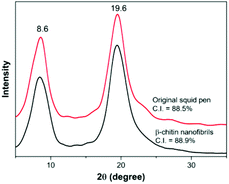 | ||
| Fig. 4 X-ray diffraction patterns and crystallinity indices (C.I.) of the original squid pens and β-chitin nanofibrils. | ||
3.3 Degree of acetylation of β-chitin nanofibrils
The present fibrils show a very high degree of acetylation (DA), so the accuracy of the data is critical. Several techniques are available to assess the DA for chitin and chitosan. The most common are Fourier-Transform Infrared spectroscopy (FTIR) and nuclear magnetic resonance (NMR) spectroscopy. Solid state cross polarization (CP)/magic angle spinning (MAS) 13C NMR is commonly used to measure the DA of chitin.45 In this technique, polarization from carbon is transferred to a proton, and the proton signal is detected. This leads to intensity enhancement. The delay between scans is determined by the proton relaxation time, which is usually much shorter than for the carbons. CP-MAS 13C NMR is, however, not suitable for quantitative analysis. The polarization transfer does not have the same efficiency for all signals. For this reason, some signals may lose intensity during transfer and the resulting DA is inaccurate. For example, the carbon signal sterically hinders the signal from hydrogen in the cyclic ring. We found that by using different contact times, very different DA values were obtained, regardless of whether C![[double bond, length as m-dash]](https://www.rsc.org/images/entities/char_e001.gif) O or CH3 was used (data not shown). In the present work, single-pulse 13C MAS NMR was used, since it is directly detected based on the carbon signals. At a cost of a much longer experimental time, the DA determined from direct-detected experiments is more accurate.
O or CH3 was used (data not shown). In the present work, single-pulse 13C MAS NMR was used, since it is directly detected based on the carbon signals. At a cost of a much longer experimental time, the DA determined from direct-detected experiments is more accurate.
In chitin or chitosan, the DA is defined as the mole fraction of N-acetyl-glucosamine units (Fig. 5, inset) in the polymer chains, which was determined from the relative integral intensities of the resonances of the ring carbons (IC1, IC2, IC3, IC4, IC5, IC6) and the methyl-carbon (ICH3) using the following equation:46
 | (4) |
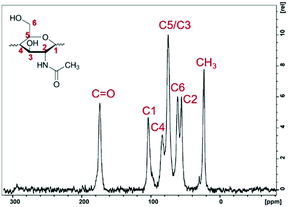 | ||
| Fig. 5 Single-pulse MAS 13C NMR spectrum of the extracted chitin nanofibrils and schematic representation of the N-acetylglucosamine structure (inset). | ||
Fig. 5 shows the single-pulse MAS 13C NMR spectrum of the extracted chitin nanofibrils. Two strong peaks located at 173.8 and 23.1 ppm were assigned to the carbonyl and methyl carbons, respectively. The main chemical shifts are listed in Table S1 (see the ESI†). The peaks of C3 and C5 merged into a single resonance at 75.1 ppm, which is typical of β-chitin structures. In the spectrum of α-chitin, however, the chemical shifts of C3 and C5 appeared as a doublet due to the different configurations.42,47,48 The results calculated from eqn (4) showed that the isolated chitin nanofibrils have a DA equal to 99.3%, which is in good agreement with the value of 99.9% determined when the C![[double bond, length as m-dash]](https://www.rsc.org/images/entities/char_e001.gif) O signal intensity is used instead of ICH3. The error of the DA determination was estimated to be 3.0%, mostly originating from the signal-to-noise ratio of the spectra. The DA was confirmed by using FTIR as a complementary method, and was found to be 97% according to the FTIR method developed by Shigemasa et al.,49 which closely matches data from the NMR. The FTIR data are presented in Fig. S2, ESI.†
O signal intensity is used instead of ICH3. The error of the DA determination was estimated to be 3.0%, mostly originating from the signal-to-noise ratio of the spectra. The DA was confirmed by using FTIR as a complementary method, and was found to be 97% according to the FTIR method developed by Shigemasa et al.,49 which closely matches data from the NMR. The FTIR data are presented in Fig. S2, ESI.†
A DA >99% is very high compared to a similar work in the literature. Cortizo et al. reported a DA of 96% based on CP-MAS 13C NMR spectroscopy for the β-chitin isolated from the same squid Illex argentines pens using a mild deproteinization method (1 M NaOH, 24 h, room temperature).50 In fact, the DA is not expected to be 100% after alkaline treatment. The α-chitin nanofibrils from lobsters prepared from mild treatment showed a DA of 87% and high purity (residual protein content 4%).17 The current work shows a higher degree of acetylation at the same residual protein content. Interestingly, there are no protein peaks (C–O: 180 ppm; C–N: 55 ppm; CH2: 27–39 ppm) in the current solid-state 13C NMR spectra.51 It is possible that the residual protein content (4%) based on the colorimetric method is overestimated. This is an important question to resolve since a low or non-existing protein content is required for the use of chitin in medical application i.e. tissue engineering. The accuracy of the high DA reported here is supported by the high degree of crystallinity from XRD. Deacetylation is expected to lead to decreased crystallinity as deacetylated surface molecules lose long-range order.
3.4 Molar mass of β-chitin based on highly individualized chitin nanofibrils
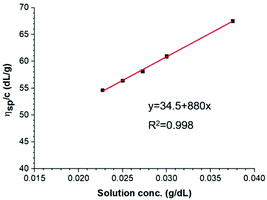
A previously developed measurement procedure for chitin was used,52 based on the correlation between the solution viscosity and molar mass. This technique uses a capillary-based method for measuring the viscosity, which is recommended for cellulosic polymer solutions with higher viscosity. DMAc/8% LiCl is one of the few non-degrading solvents for chitin.52 The Li+ ion becomes associated with the carbonyl oxygen, disrupting the hydrogen bond web of the crystalline sheet structure of chitin.53Fig. 6 shows the reduced viscosity as a function of chitin solution concentration, and an intrinsic viscosity [η] of 34.5 dL g−1 could then be obtained. By applying eqn (1), the molar mass of the isolated β-chitin is estimated to be 843![[thin space (1/6-em)]](https://www.rsc.org/images/entities/char_2009.gif) 500 Da. This is higher than the data for α-chitin reported by Mushi et al. (543.500 Da) where mild conditions were applied for extraction.17
500 Da. This is higher than the data for α-chitin reported by Mushi et al. (543.500 Da) where mild conditions were applied for extraction.17
3.5 Morphology of the nanostructured β-chitin films
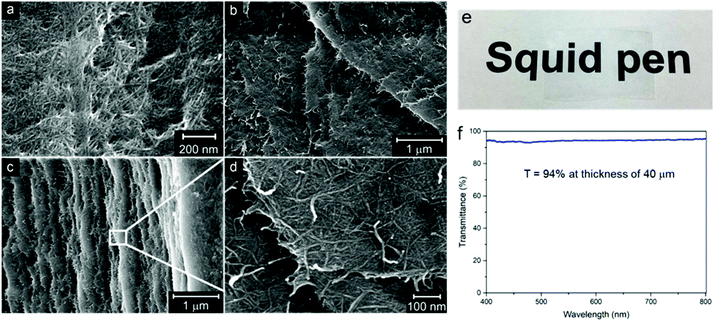
Chitin fibril films prepared by vacuum filtration of hydrocolloidal suspensions of β-chitin fibrils were dried in a sheet-forming machine. Fig. 7 presents the microstructural images of β-chitin films. The surface consisted of swirled and entangled nanofibrils of small diameter, oriented random-in-the-plane. No visible chitin fibril aggregates or macro-pores could be observed (Fig. 7a). The cross sectional micrograph showed a layered structure of the film (Fig. 7c), and the magnified image (Fig. 7d) presented an in-plane network of randomly entangled chitin nanofibrils with uniform diameter.Preparation of chitin fibril films was facilitated by the apparent stability of the chitin fibril suspension. The Z-potential of the chitin suspension was 35 mV based on dynamic light scattering analysis. The criterion for hydrocolloidal stability is expressed as >±30 mV.54,55 Although amino groups are very few, they are concentrated at fibril surfaces. The interior is still fully acetylated, and the fibril is insoluble. The stable suspension is possibly due to complete cationization of the C2 amino groups in β-chitins at pH 3. It was reported that the pKa of the C2 ammonium of the anhydroglucosamine unit in chitin is 6.3.56 Therefore, pH lower than 6.3 is necessary to obtain a stable hydrocolloidal suspension. The film is transparent and flexible. The average density of the film obtained from the ratio of weight to bulk volume is 1.27 ± 0.01 g cm−3. The porosity was calculated according to eqn (5):
 | (5) |
3.6 Mechanical properties of β-chitin nanostructured films
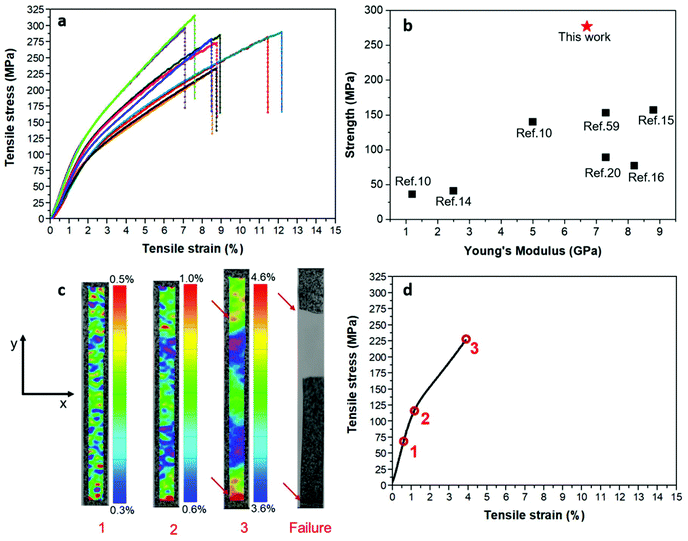
It is assumed that the chitin fibril film strength is related to the intrinsic fibril properties, as has been confirmed for cellulose fibrils.60 The tensile stress–strain curves of β-chitin films (four replicates) are shown in Fig. 8a. The Young's modulus is 6.7 ± 1.2 GPa. The average tensile strength is 277 ± 27 MPa, with the highest value reaching 320 MPa. Tensile strain to failure is 7.1 ± 1.8%. The mechanical performance of the β-chitin film is compared with other chitin films in Fig. 8b. The Young's modulus (6.7 GPa) of our β-chitin nanostructured film is comparable to that of other chitin films, such as films from shrimps (7.3 GPa)20 and lobsters (7.3 GPa),59 and surface-deacetylated chitin films from crabs (8.8 GPa).15 The modulus of chitin was reported to be 60 GPa,1 which is substantially lower than for cellulose (134 GPa).60 The present strength (277 ± 27 MPa) is much higher than for other chitin films, see Fig. 8b. For example, the surface-deacetylated chitin film from crabs showed a strength of 157 MPa, with a Young's modulus of 8.8 GPa.15 The highest strength of nanostructured chitin films reached based on α-chitin was 187 MPa, following chitosan addition during mechanical homogenization (elastic modulus = 6 GPa).61 To the best of our knowledge, the present films exhibit the highest strength of chitin films reported in the literature. Data can be compared to nanostructured cellulose films. The strength of pure and unmodified i.e. enzymatically treated cellulose films = 214 MPa, modulus = 13 GPa,62 and for modified cellulose films based on, for example, TEMPO-mediated oxidized cellulose nanofibers, the strength = 239 MPa, modulus = 9.3 GPa,63 or surface quaternized cellulose films, strength = 200 MPa, modulus = 10 GPa.64 In order to further investigate the effect of extraction conditions on the chitin fibril structure and mechanical film properties, a more aggressive treatment was used to prepare chitin nanofibrils, termed D-ChNF. In this case, deproteinization was repeated 5 times with fresh NaOH solution (each time: 10% NaOH for 12 h at room temperature). The modulus of the D-ChNF film decreased to 5.7 ± 0.5 GPa, and the tensile strength is 178 ± 9 MPa, which is much lower than that of the ChNF film (277 ± 27 MPa). This suggests that the strength of the chitin nanofibril film is strongly dependent on the intrinsic fibril properties. The tensile stress–strain curves and mechanical properties are reported in Fig. S3 and Table S2, respectively (ESI†).It is apparent that the high mechanical performance of β-chitin films is related to their well-preserved native fibril structure. The high film strength is due to: (1) high purity with a low residual protein content; (2) well-preserved intrinsic strength of the isolated chitin nanofibrils in the films because of their high aspect ratio, high molar mass, high crystallinity, and high degree of acetylation; (3) stable hydrocolloidal suspension at pH 3 was used to fabricate the film, and fibril aggregation is limited; (4) low porosity (11%) of the film.
The large variation in Young's modulus and yield strength apparent in Fig. 8a is not usually observed in cellulose films.62,65–67 It is likely that the interfibril bonding is weaker and more variable in chitin films compared with nanocellulose films. The acetyl substitution at chitin surfaces may be responsible for this.
The mechanisms of failure for the films are of interest. The strain field distribution along the loading axis (y-axis) is shown in Fig. 8c. The strain to failure from the DIC-method is lower than for video extensometry, but the modulus differences are small for the two strain measurement methods and strength data are not affected. At low strain (position 1, Fig. 8c), within the elastic region, the strain field is homogeneous with even and low scatter. As the test approaches the yield stress of the film (position 2, Fig. 8c), an inhomogeneous strain field is observed, with strain concentration regions. Just prior to ultimate failure (position 3, Fig. 8c), large local strain gradients are formed. Based on the data (not presented here) of chitin films prepared from different filtrate concentrations (0.03, 0.06 or 0.1 wt%), ultimate strength strongly depends on chitin fibril agglomerates at the microscale size (microdefects) which is the case for the 0.1 wt% filtrate. Failure initiation is likely to occur at lower strain if fibril aggregate defects are present. Final fracture occurs in two regions in the particular specimen in Fig. 8c, see the third (3) strain field plot. The upper failure region is the major site of ultimate failure. The present chitin film shows strain localization after plastic yielding, so strength will rely both on homogeneous chitin fibril distribution and high intrinsic fibril length and strength.
4. Conclusions
Uniquely well-preserved chitin fibrils were isolated and used for chitin films of exceptional properties. For the first time, the mechanical properties of β-chitin fibril films were investigated in detail, and found to be superior to previous chitin fibril film reports. A very mild extraction method was developed, which results in novel β-chitin nanofibrils of well-preserved native structures with low protein contents. The nanofibrils are highly individualized with average diameters of 4.1 nm and lengths up to a few micrometers. The NMR data obtained by a direct method confirm a high degree of acetylation of β-chitin nanofibrils (>99%), correspondingly high XRD crystallinity (89%), and with a very high molar mass (843![[thin space (1/6-em)]](https://www.rsc.org/images/entities/char_2009.gif) 500 Da). The nanostructured β-chitin films showed exceptionally high mechanical performance, especially in terms of ultimate tensile strength, which was much higher than in any previous study (277 MPa). The reason is high intrinsic strength of the chitin fibrils and the lack of large defects in the form of chitin fibril aggregates. Limited aggregation is supported by exceptionally high optical transmittance, with little scattering from voids or aggregates. The reasons for the lack of aggregation problems include well disintegrated fibrils from the squid pen, and stable behaviour of the colloidal suspension due to the favourable surface charge. High intrinsic fibril strength is due to the well-preserved native structure of the fibrils. One may note that the modulus of chitin films is about 50% of the modulus for cellulose nanofibril films. An important reason is that the intrinsic fibril modulus is much lower for chitin than for cellulose. With respect to the lower yield strength and its variability compared with nanocellulose films, one may speculate that the acetyl substitution at the chitin surface may reduce interfibril bonding.
500 Da). The nanostructured β-chitin films showed exceptionally high mechanical performance, especially in terms of ultimate tensile strength, which was much higher than in any previous study (277 MPa). The reason is high intrinsic strength of the chitin fibrils and the lack of large defects in the form of chitin fibril aggregates. Limited aggregation is supported by exceptionally high optical transmittance, with little scattering from voids or aggregates. The reasons for the lack of aggregation problems include well disintegrated fibrils from the squid pen, and stable behaviour of the colloidal suspension due to the favourable surface charge. High intrinsic fibril strength is due to the well-preserved native structure of the fibrils. One may note that the modulus of chitin films is about 50% of the modulus for cellulose nanofibril films. An important reason is that the intrinsic fibril modulus is much lower for chitin than for cellulose. With respect to the lower yield strength and its variability compared with nanocellulose films, one may speculate that the acetyl substitution at the chitin surface may reduce interfibril bonding.
The present fibrils are exceptionally well-preserved and of great interest in material concepts and film/coating applications, including biomedical, where high fibril and film strength in combination with optical transmittance and antimicrobial properties are desirable. Since cellulose fibrils require chemical functionalization to become antimicrobial, future work on chitin fibrils can aim for a tailored degree of antimicrobial surface deacetylation, with preserved mechanical properties. Such fibrils could be used in hydrogels, foams, porous films and polymer matrix nanocomposites for biomedical applications or detoxification or general nanotechnology applications.
Conflicts of interest
There are no conflicts to declare.Acknowledgements
Dr Leifeng Liu from the University of Birmingham is acknowledged for cryo-SEM imaging. Hui Chen from the Wallenberg Wood Science Center is acknowledged for the total transmittance measurement. This work was supported by the Knut and Alice Wallenberg foundation.Notes and references
- Y. Ogawa, R. Hori, U.-J. Kim and M. Wada, Carbohydr. Polym., 2011, 83, 1213–1217 CrossRef CAS.
- A. Miserez, T. Schneberk, C. Sun, F. W. Zok and J. H. Waite, Science, 2008, 319, 1816–1819 CrossRef CAS PubMed.
- Y. Tan, S. Hoon, P. A. Guerette, W. Wei, A. Ghadban, C. Hao, A. Miserez and J. H. Waite, Nat. Chem. Biol., 2015, 11, 488–495 CrossRef CAS PubMed.
- R. L. Lavall, O. B. G. Assis and S. P. Campana-Filho, Bioresour. Technol., 2007, 98, 2465–2472 CrossRef CAS PubMed.
- A. C. Neville, Biology of fibrous composites. Development beyond the cell membrane, Cambridge University Press, 1993 Search PubMed.
- R. Minke and J. Blackwell, J. Mol. Biol., 1978, 120, 167–181 CrossRef CAS PubMed.
- K. H. Gardner and J. Blackwell, Biopolymers, 1975, 14, 1581–1595 CrossRef CAS.
- Y. M. Fan, T. Saito and A. Isogai, Biomacromolecules, 2008, 9, 1919–1923 CrossRef CAS PubMed.
- Y. Fan, T. Saito and A. Isogai, Carbohydr. Polym., 2010, 79, 1046–1051 CrossRef CAS.
- Y. Fan, H. Fukuzumi, T. Saito and A. Isogai, Int. J. Biol. Macromol., 2012, 50, 69–76 CrossRef CAS PubMed.
- Y. Fan, T. Saito and A. Isogai, Biomacromolecules, 2008, 9, 192–198 CrossRef CAS PubMed.
- S. Ifuku, M. Nogi, M. Yoshioka, M. Morimoto, H. Yano and H. Saimoto, Carbohydr. Polym., 2010, 81, 134–139 CrossRef CAS.
- S. Ifuku, M. Nogi, K. Abe, M. Yoshioka, M. Morimoto, H. Saimoto and H. Yano, Biomacromolecules, 2009, 10, 1584–1588 CrossRef CAS PubMed.
- S. Ifuku and H. Saimoto, Nanoscale, 2012, 4, 3308–3318 RSC.
- S. Ifuku, A. Ikuta, M. Egusa, H. Kaminaka, H. Izawa, M. Morimoto and H. Saimoto, Carbohydr. Polym., 2013, 98, 1198–1202 CrossRef CAS.
- N. Ezekiel Mushi, N. Butchosa, Q. Zhou and L. A. Berglund, J. Appl. Polym. Sci., 2014, 131, 40121 CrossRef.
- N. E. Mushi, N. Butchosa, M. Salajkova, Q. Zhou and L. A. Berglund, Carbohydr. Polym., 2014, 112, 255–263 CrossRef CAS PubMed.
- Y. Bamba, Y. Ogawa, T. Saito, L. A. Berglund and A. Isogai, Biomacromolecules, 2017, 18, 4405–4410 CrossRef CAS PubMed.
- D. Carlström, J. Biophys. Biochem. Cytol., 1957, 3, 669–683 CrossRef PubMed.
- N. Butchosa, C. Brown, P. T. Larsson, L. A. Berglund, V. Bulone and Q. Zhou, Green Chem., 2013, 15, 3404–3413 RSC.
- Y. Fan, T. Saito and A. Isogai, Biomacromolecules, 2008, 9, 1919–1923 CrossRef CAS PubMed.
- S. Ifuku, M. Nogi, K. Abe, M. Yoshioka, M. Morimoto, H. Saimoto and H. Yano, Carbohydr. Polym., 2011, 84, 762–764 CrossRef CAS.
- H. Tamura, H. Nagahama and S. Tokura, Cellulose, 2006, 13, 357–364 CrossRef CAS.
- D. X. Oh, Y. J. Cha, H.-L. Nguyen, H. H. Je, Y. S. Jho, D. S. Hwang and D. K. Yoon, Sci. Rep., 2016, 6, 23245 CrossRef PubMed.
- C. Chen, H. Yano, D. Li and K. Abe, Cellulose, 2015, 22, 2543–2550 CrossRef CAS.
- J. A. Vázquez, D. Noriega, P. Ramos, J. Valcarcel, R. Novoa-Carballal, L. Pastrana, R. L. Reis and R. I. Pérez-Martín, Carbohydr. Polym., 2017, 174, 262–272 CrossRef PubMed.
- H. N. Cuong, N. C. Minh, N. Van Hoa and T. S. Trung, Int. J. Biol. Macromol., 2016, 93, 442–447 CrossRef CAS PubMed.
- A. I. Arkhipkin, P. G. K. Rodhouse, G. J. Pierce, W. Sauer, M. Sakai, L. Allcock, J. Arguelles, J. R. Bower, G. Castillo, L. Ceriola, C.-S. Chen, X. Chen, M. Diaz-Santana, N. Downey, A. F. González, J. Granados Amores, C. P. Green, A. Guerra, L. C. Hendrickson, C. Ibáñez, K. Ito, P. Jereb, Y. Kato, O. N. Katugin, M. Kawano, H. Kidokoro, V. V. Kulik, V. V. Laptikhovsky, M. R. Lipinski, B. Liu, L. Mariátegui, W. Marin, A. Medina, K. Miki, K. Miyahara, N. Moltschaniwskyj, H. Moustahfid, J. Nabhitabhata, N. Nanjo, C. M. Nigmatullin, T. Ohtani, G. Pecl, J. A. A. Perez, U. Piatkowski, P. Saikliang, C. A. Salinas-Zavala, M. Steer, Y. Tian, Y. Ueta, D. Vijai, T. Wakabayashi, T. Yamaguchi, C. Yamashiro, N. Yamashita and L. D. Zeidberg, Rev. Fish. Sci., 2015, 23, 92–252 CrossRef.
- K. Keisuke, T. Koji, T. Tomoyoshi, I. Shigeru, N. Shin-Ichiro and S. Kayo, J. Polym. Sci., Part A: Polym. Chem., 1993, 31, 485–491 CrossRef.
- K. Kurita, Prog. Polym. Sci., 2001, 26, 1921–1971 CrossRef CAS.
- K. Kurita, Y. Kaji, T. Mori and Y. Nishiyama, Carbohydr. Polym., 2000, 42, 19–21 CrossRef CAS.
- Y. Ogawa, K. Azuma, H. Izawa, M. Morimoto, K. Ochi, T. Osaki, N. Ito, Y. Okamoto, H. Saimoto and S. Ifuku, Int. J. Biol. Macromol., 2017, 104, 1882–1889 CrossRef CAS PubMed.
- M. N. Sundaram, V. Krishnamoorthi Kaliannagounder, V. Selvaprithiviraj, M. K. Suresh, R. Biswas, A. K. Vasudevan, P. K. Varma and R. Jayakumar, ACS Sustainable Chem. Eng., 2018, 6, 7826–7840 CrossRef CAS.
- W. Li, H. Wang, Y. Ding, E. C. Scheithauer, O.-M. Goudouri, A. Grunewald, R. Detsch, S. Agarwal and A. R. Boccaccini, J. Mater. Chem. B, 2015, 3, 3367–3378 RSC.
- B. Ding, J. Cai, J. Huang, L. Zhang, Y. Chen, X. Shi, Y. Du and S. Kuga, J. Mater. Chem., 2012, 22, 5801–5809 RSC.
- M. Yokoi, R. Tanaka, T. Saito and A. Isogai, Biomacromolecules, 2017, 18, 2564–2570 CrossRef CAS PubMed.
- D. A. Torchia, J. Magn. Reson., 1978, 30, 613–616 CAS.
- M. Terbojevich, A. Cosani, E. Bianchi and E. Marsano, Solution behavior of chitin in dimethylacetamide/LiCl, 1996 Search PubMed.
- T. B. Mbarek, L. Robert, F. Hugot and J.-J. Orteu, J. Compos. Mater., 2011, 45, 2751–2764 CrossRef.
- A. I. Arkhipkin, V. A. Bizikov and D. Fuchs, Deep Sea Res., Part I, 2012, 61, 109–122 CrossRef.
- S. Hunt and M. Nixon, Comp. Biochem. Physiol., Part B: Biochem. Mol. Biol., 1981, 68, 535–546 CrossRef.
- M. Susana Cortizo, C. F. Berghoff and J. L. Alessandrini, Carbohydr. Polym., 2008, 74, 10–15 CrossRef CAS.
- W. Sajomsang and P. Gonil, Mater. Sci. Eng., C, 2010, 30, 357–363 CrossRef CAS.
- H. P. Klug and L. E. Alexander, X-Ray Diffraction Procedures: For Polycrystalline and Amorphous Materials, ed. H. P. Klug and L. E. Alexander, Wiley-VCH–––, 2nd edn, 1974, p. 992, ISBN 0–471–49369–4 Search PubMed.
- M. R. Kasaai, J. Agric. Food Chem., 2009, 57, 1667–1676 CrossRef CAS PubMed.
- M. H. Ottey, K. M. Vårum and O. Smidsrød, Carbohydr. Polym., 1996, 29, 17–24 CrossRef.
- M. Zhang, A. Haga, H. Sekiguchi and S. Hirano, Int. J. Biol. Macromol., 2000, 27, 99–105 CrossRef CAS PubMed.
- T. Garrido, A. Etxabide, K. de la Caba and P. Guerrero, Green Chem., 2017, 19, 5923–5931 RSC.
- Y. Shigemasa, H. Matsuura, H. Sashiwa and H. Saimoto, Int. J. Biol. Macromol., 1996, 18, 237–242 CrossRef CAS PubMed.
- M. S. Cortizo, C. F. Berghoff and J. L. Alessandrini, Carbohydr. Polym., 2008, 74, 10–15 CrossRef.
- A. Wong, A. P. Howes, J. R. Yates, A. Watts, T. Anupõld, J. Past, A. Samoson, R. Dupree and M. E. Smith, Phys. Chem. Chem. Phys., 2011, 13, 12213–12224 RSC.
- M. Terbojevich, C. Carraro, A. Cosani and E. Marsano, Solution studies of the chitin-lithium chloride-N,N-di-methylacetamide system, 1988 Search PubMed.
- C. L. de Vasconcelos, P. M. Bezerril, M. R. Pereira, M. F. Ginani and J. L. Fonseca, Carbohydr. Res., 2011, 346, 614–618 CrossRef CAS PubMed.
- D. Hanaor, M. Michelazzi, C. Leonelli and C. C. Sorrell, J. Eur. Ceram. Soc., 2012, 32, 235–244 CrossRef CAS.
- R. Greenwood and K. Kendall, J. Eur. Ceram. Soc., 1999, 19, 479–488 CrossRef CAS.
- J. Li, J. F. Revol and R. H. Marchessault, J. Colloid Interface Sci., 1996, 183, 365–373 CrossRef CAS PubMed.
- B. Duan, C. Chang, B. Ding, J. Cai, M. Xu, S. Feng, J. Ren, X. Shi, Y. Du and L. Zhang, J. Mater. Chem. A, 2013, 1, 1867–1874 RSC.
- S. Ifuku, A. Ikuta, H. Izawa, M. Morimoto and H. Saimoto, Carbohydr. Polym., 2014, 101, 714–717 CrossRef CAS PubMed.
- N. E. Mushi, S. Utsel and L. A. Berglund, Front. Chem., 2014, 2, 99 Search PubMed.
- I. Sakurada, Y. Nukushina and T. Ito, J. Polym. Sci., 1962, 57, 651–660 CrossRef CAS.
- N. E. Mushi, T. Nishino, L. A. Berglund and Q. Zhou, ACS Sustainable Chem. Eng., 2019, 7, 1692–1697 CrossRef CAS.
- M. Henriksson, L. A. Berglund, P. Isaksson, T. Lindström and T. Nishino, Biomacromolecules, 2008, 9, 1579–1585 CrossRef CAS PubMed.
- M. Salajkova, L. Valentini, Q. Zhou and L. Berglund, Tough nanopaper structures based on cellulose nanofibers and carbon nanotubes, 2013, vol. 87, pp. 103–110 Search PubMed.
- A. Pei, N. Butchosa, L. A. Berglund and Q. Zhou, Soft Matter, 2013, 9, 2047–2055 RSC.
- Y. Li, Q. Fu, S. Yu, M. Yan and L. Berglund, Biomacromolecules, 2016, 17, 1358–1364 CrossRef CAS PubMed.
- F. Ansari and L. A. Berglund, Biomacromolecules, 2018, 19, 2341–2350 CrossRef CAS PubMed.
- S. Morimune-Moriya, M. Salajkova, Q. Zhou, T. Nishino and L. A. Berglund, Biomacromolecules, 2018, 19, 2423–2431 CrossRef CAS PubMed.
Footnote |
| † Electronic supplementary information (ESI) available. See DOI: 10.1039/c9nr02870f |
| This journal is © The Royal Society of Chemistry 2019 |

