 Open Access Article
Interplay between ligand mobility and nanoparticle geometry during cellular uptake of PEGylated liposomes and bicelles†
Zhiqiang
Shen
 a,
Huilin
Ye
 a,
Martin
Kröger
 b,
Shan
Tang
*c and
Ying
Li
 *a
*a
aDepartment of Mechanical Engineering and Institute of Materials Science, University of Connecticut, Storrs, CT 06269, USA. E-mail: yingli@engr.uconn.edu; Fax: +1 860 4865088; Tel: +1 860 4867110
bDepartment of Materials, Polymer Physics, ETH Zürich, CH-8093 Zurich, Switzerland
cState Key Laboratory of Structural Analysis for Industrial Equipment, Department of Engineering Mechanics, and International Research Center for Computational Mechanics, Dalian University of Technology, Dalian, 116023, PR China. E-mail: shantang@dlut.edu.cn
First published on 19th August 2019
Abstract
We explore the cellular uptake process of PEGylated liposomes and bicelles by investigating their membrane wrapping process using large-scale molecular dynamics simulations. We find that due to the mobility of ligands on the liposome/bicelle, the membrane wrapping process of a PEGylated liposome/bicelle can be divided into two stages, whose transition is determined by a critical wrapping fraction fc; it is reached when all the ligands are exhausted and bound to receptors within the cell membrane. Before this critical scenario is approached, the grafted polyethylene glycol (PEG) polymers aggregate together within the membrane–wrapped region of the liposome/bicelle, driven by ligand–receptor binding. For wrapping fractions f > fc, membrane wrapping cannot proceed unless a compressive membrane tension is provided. By systematically varying the membrane tension and PEG molar ratio, we establish phase diagrams about wrapping states for both PEGylated liposomes and bicelles. According to these diagrams, we find that the absolute value of the compressive membrane tension required by a fully wrapped PEGylated bicelle is smaller than that of the PEGylated liposome, indicating that the PEGylated bicelle is easily internalized by cells. Further theoretical analysis reveals that compared to a liposome, the flatter surface at the top of a bicelle makes it energetically more favored beyond the critical wrapping fraction fc. Our simulations confirm that the interplay between ligand mobility and NP geometry can significantly change the understanding about the influence of NP geometry on the membrane wrapping process. It can help us to better understand the cellular uptake process of the PEGylated liposome/bicelle and to improve the design of lipid-like NPs for drug delivery.
1. Introduction
Nanoparticle (NP) based cancer nanomedicine aims to improve the diagnosis and treatment of diseases by engineering NPs to specifically identify or deliver drugs to tumor sites.1–3 After being injected into the human body, NPs need to circulate in blood flow,4 penetrate leaky vessel walls under the enhanced permeability and retention (EPR) effect,5 diffuse through the extracellular matrix of tumor stroma,6,7 and finally enter into tumor cells. During this process, there are many biological barriers confronted by NPs. For instance, serum proteins in the blood flow can detect and absorb NPs on their surfaces, and thus act as an indicator for macrophage cells to clear these NPs.8 The cell membrane is an additional physical barrier to inhibit the NPs from entering the cytoplasm of tumor cells.9 Therefore, compositions and surface modifications of NPs are of great importance to NP delivery efficiency.10–14Lipid-like NPs stand themselves out among various NP candidates.11,15–17 For instance, a liposome that consists of a fluid or gel state lipid bilayer shell and an aqueous core is one of the first studied NPs as a drug carrier.18–20 The phospholipid surface of a liposome makes it biologically inert, weakly immunogenic, and less toxic compared to other NP formulations.15,21 Specifically, Doxil (PEGylated liposome-encapsulated doxorubicin) is the first US Food and Drug Administration approved NP-based delivery formulation for clinical applications.15 By grafting polyethylene glycol (PEG) polymers on their surface, liposomes demonstrate a prolonged blood circulation time, which significantly improves the drug accumulation within tumor sites through the EPR effect.22 By loading doxorubicin into the PEGylated liposomes, Doxil demonstrates a higher efficacy for cancer therapy than freely administered doxorubicin molecules.15 Nevertheless, liposomes still have some limitations, such as morphology instability,18,23 low delivery efficiency24 and difficulty in size control.18,25
A bicelle that is composed of a single disc-like lipid bilayer has attracted a lot of attention due to its unique properties and its biocompatibility which it shares with the liposome.26–28 For instance, bicelles are found to be able to penetrate through the narrow intercellular spaces of the stratum corneum and show a promising platform for dermal applications.26 Furthermore, compared with liposomes, bicelles are found to have a better chance to be internalized by tumor cells. For example, Wang et al.29 compared the cellular uptake of bicelles and liposomes with the modification of the octa-arginine (R8) sequence in four different cell lines, including MM-231, human breast cancer cell MCF-7, human umbilical vein endothelial cell HUVEC and murine macrophage cell RAW264.7. They found that bicelles are more efficiently internalized by all these cells. In particular, the number of bicelles internalized by MCF-7 cells is 2.5 times larger than that of liposomes. Additionally, Aresh et al.30,31 also found that the cellular uptake efficiency of bicelles is significantly higher compared with that of liposomes, based on three different human cancer cell lines of CCRF-CEM, KB and OVCAR-8.
Despite these important and promising applications in nanomedicine, knowledge about the interactions between cells and a liposome/bicelle is still quite limited. One of the key reasons is the possible interplay between NP elasticity, NP geometry, and the ligand mobility during the cellular uptake process. First, a fluid or gel state liposome/bicelle is soft and has the ability to deform itself.32–36 Second, a liposome is spherical, while a bicelle is disc-like. These two shapes have dramatically different curvature distributions on their surfaces, leading to different internalization kinetics.37 Third, ligands tethered on PEGylated lipids can freely diffuse on the liposome/bicelle surface.38,39 Each of these factors can influence the cellular uptake process of a PEGylated liposome/bicelle. For instance, due to the deformation of elastic NPs, a soft NP is less energetically favorably wrapped by the membrane than its rigid counterpart.40,41 Compared with a spherical NP, a disc-like NP is more difficult to be fully wrapped by the cell membrane due to its highly curved surface edge.42–44 Moreover, the mobility of ligands would induce the aggregation of PEG polymers and ligands, which suppresses the membrane wrapping.38,39 However, it is still not clear how the NP elasticity, geometry and ligand mobility can play together to influence the whole membrane wrapping process. In particular, the question on why a bicelle is more efficiently internalized by cancer cells remains to be answered.
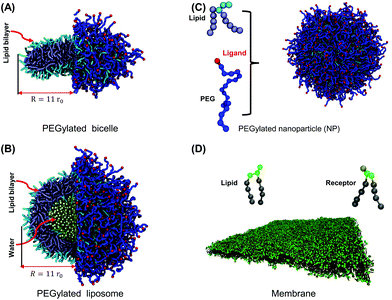
To fill the knowledge gap between experimental results and our current understanding, we explore the cellular uptake of a PEGylated liposome and bicelle through large-scale molecular dynamics simulations. In our simulations, the cellular uptake process is mimicked by a membrane wrapping process initiated by ligands on grafted PEG terminals and receptors in the cell membrane (cf.Fig. 1). To obtain a full picture for the membrane wrapping process of the PEGylated liposome/bicelle, the membrane tension and PEG molar ratio are systematically varied. In this work, we define the wrapping fraction f as the ratio between the membrane's wrapped surface area and the total surface area of the liposome/bicelle. As the ligands are mobile on the surface, the ligand–receptor binding fraction is defined separately. We find that due to the mobility of ligands on the liposome/bicelle, the membrane wrapping process can be divided into two stages, separated by a critical wrapping fraction fc. This fc is defined as the wrapping fraction f when all the ligands are exhausted and bound to receptors. As long as f < fc PEG polymers aggregate within the membrane–wrapped region of the liposome/bicelle, driven by ligand–receptor binding, while for f > fc the membrane wrapping cannot proceed unless a compressive membrane tension is provided. From the phase diagrams about different wrapping states, we find that the absolute value of the compressive membrane tension boundary for the PEGylated bicelle is smaller than that of the PEGylated liposome, indicating that the PEGylated bicelle is easily internalized. We further proceed to analyze the free energy changes due to PEG polymers, NP elastic deformations, and membrane bending. The free energy analysis reveals that the energy barrier induced by PEG polymers is much larger than that of the NP elastic deformation. These energy barriers can be overcome by ligand–receptor binding when f < fc. Otherwise, the membrane wrapping is driven by a compressive membrane tension. Our theory confirms that due to its flatter surface at the top, a bicelle is easily wrapped compared to a liposome when f > fc. Our simulations reveal the interplay between the mobility of PEG polymers and NP geometry and demonstrate that under certain situations a disc-like NP is energetically more favored than a spherical NP. These findings help us better understand the cellular uptake process of the PEGylated liposome/bicelle, and can thus become useful in the design of lipid-like NPs for drug delivery.
2. Computational model and methods
All coarse-grained molecular simulations performed in this work are based on the dissipative particle dynamics (DPD) method.45,46 The basic interacting sites in DPD simulations are represented by soft beads. Between each pair of DPD beads, effective two-body interactions consist of three major forces:45,46 a conservative force FC, a random force FR and a dissipative force FD. Specifically, the conservative force between beads i and j is FCij = aijω(rij)eij, where rij denotes the spatial distance between the two beads i and j, and eij is the unit vector pointing from i to j; aij represents the maximum repulsion force strength. The weighting factor ω(rij) is a normalized distribution function as ω(rij) = 1 − rij/r0 for rij ≤ r0, while ω(rij) = 0 for rij > r0. Here r0 is the cutoff distance for pairwise interactions. The random forces are specified by , where α represents a normal distributed Gaussian random number with zero mean and unit variance, Δt = 0.01τ (
 ) denotes the integration time step, and βij is a bead friction coefficient. The dissipative force is given by FDij = −βijω2(rij)(eij·vij)eij, where vij is the relative velocity vector between beads i and j. All pair-wise interactions aij between different types of beads are listed in Table S1 of the ESI.†
Two different lipid models are adopted in our simulations to represent the lipid molecules in a liposome/bicelle and the membrane, respectively. A DPD lipid model that mimics 1,2-dipalmitoyl-sn-glycero-3-phosphocholine (DPPC) is utilized to assemble the liposome and bicelle. In this model, the head group of each lipid molecule is represented by three linearly connected hydrophilic beads, while each of the two tails is represented by 5 hydrophobic beads,47,48cf. Fig. 1(C). Adjacent two beads are connected by a harmonic spring potential Us1 = Ks1(rij − rs1)2. The stiffness of the head and tail groups is controlled by a harmonic bending potential applied on the adjacent three beads Uθ1 = Kθ1(ϑ − ϑ01)2, where ϑ denotes a bending angle. Due to the flexible head group in this DPPC lipid model, the energy penalty to form the bilayer edge in the bicelle is relatively small, facilitating the formation of a larger sized bicelle. The line tension of the edge in this model is around λ = 1.4kBT/r0. Because of the favorable energy state, a bicelle will transform into a liposome only above a critical size. It is impossible in the simulation to create a liposome and bicelle with an identical lipid number. Following the idea in experiments,29,31 the liposome and bicelle are assumed to have the same size, around R = 11r0 (as denoted in Fig. 1), in our simulations. Our liposome and bicelle have 800 and 392 lipid molecules, respectively. A DPD lipid model that mimics 1,2-dimyristoyl-sn-glycero-3-phosphocholine (DMPC) is utilized to form the planar membrane. In this lipid model, two lipid tails (carrying four tail beads each) are connected with two head beads, respectively, cf. Fig. 1(D). The head group contains three head beads. Adjacent beads in each lipid molecule are connected by a harmonic spring potential Us2 = Ks2(rij − rs2)2. The stiffness of the lipid tails is guaranteed by the bending potential Uϑ2 = Kϑ2(1 − cos![[thin space (1/6-em)]](https://www.rsc.org/images/entities/char_2009.gif) ϑ). Using this DMPC lipid model, the tension of a planar bilayer is linearly related to the lipid molecular area.49,50 The stretch modulus of the membrane can be obtained from the related slope (cf. ESI Fig. S1†) as KA = 17.42kBT/r20. The bending rigidity of the membrane is given by51,52κm = KAd2hh/48 with κm ≈ 6kBT, which is within the range of 5–50kBT obtained in the experiments.53,54 The size of the planar membrane bilayer used to investigate the membrane wrapping is (70 × 70)r20. Please refer to the ESI† for details about the interaction potential parameters and the calibration of mechanical properties.
ϑ). Using this DMPC lipid model, the tension of a planar bilayer is linearly related to the lipid molecular area.49,50 The stretch modulus of the membrane can be obtained from the related slope (cf. ESI Fig. S1†) as KA = 17.42kBT/r20. The bending rigidity of the membrane is given by51,52κm = KAd2hh/48 with κm ≈ 6kBT, which is within the range of 5–50kBT obtained in the experiments.53,54 The size of the planar membrane bilayer used to investigate the membrane wrapping is (70 × 70)r20. Please refer to the ESI† for details about the interaction potential parameters and the calibration of mechanical properties.
A hydrophilic PEG polymer in our DPD simulations is modeled by a linear chain consisting of coarse-grained monomers. The PEG monomers are linearly connected by the harmonic bond potential Us3 = Ks3(rij − rs3)2, with spring stiffness Ks3 = 2111.3kBT/r20 and equilibrium distance rs3 = 0.4125r0. The semi-flexibility of the PEG polymer is taken into account by adding the bending potential Uϑ3 = Kϑ3(cos![[thin space (1/6-em)]](https://www.rsc.org/images/entities/char_2009.gif) ϑ − cos
ϑ − cos![[thin space (1/6-em)]](https://www.rsc.org/images/entities/char_2009.gif) ϑ03)2, with bending stiffness Kθ3 = 16.4946kBT, and equilibrium bending angle θ03 = 130° between each three consecutive monomers. Such a DPD PEG model could correctly reproduce the conformation of a PEG polymer in water, including the radius of gyration and end-to-end distance, as shown in our previous studies.37,47 To describe the PEGylated lipid, one end of the PEG polymer is bonded to the lipid head bead through a harmonic bond potential. In addition, the monomers at the free end of PEG polymers are defined to act as targeting moieties (ligands) (Fig. 1). The polymerization degree of PEG polymers in our simulation is set as N = 20 (representing a molecular weight of around 660 Da), falling within the typical range of 500–3000 Da in experiments.8,55,56 Four different sets of PEG polymer molar ratios of 40, 50, 60, and 70 mol% will be investigated. The corresponding numbers of PEG polymers nc on liposomes are 320, 400, 480 and 560, respectively. Those nc on bicelles are 156, 196, 235 and 274, respectively.
ϑ03)2, with bending stiffness Kθ3 = 16.4946kBT, and equilibrium bending angle θ03 = 130° between each three consecutive monomers. Such a DPD PEG model could correctly reproduce the conformation of a PEG polymer in water, including the radius of gyration and end-to-end distance, as shown in our previous studies.37,47 To describe the PEGylated lipid, one end of the PEG polymer is bonded to the lipid head bead through a harmonic bond potential. In addition, the monomers at the free end of PEG polymers are defined to act as targeting moieties (ligands) (Fig. 1). The polymerization degree of PEG polymers in our simulation is set as N = 20 (representing a molecular weight of around 660 Da), falling within the typical range of 500–3000 Da in experiments.8,55,56 Four different sets of PEG polymer molar ratios of 40, 50, 60, and 70 mol% will be investigated. The corresponding numbers of PEG polymers nc on liposomes are 320, 400, 480 and 560, respectively. Those nc on bicelles are 156, 196, 235 and 274, respectively.
To mimic the ligand–receptor interaction, we assume that 50% of lipid molecules in the planar bilayer act as receptors. In this way, the receptor diffusion will not be a factor that limits the efficiency of membrane wrapping in our simulations.57,58 Receptors in the planar membrane follow the same configuration as a lipid, cf. Fig. 1(D), with the head bead acting as an active site to interact with the ligand. The ligand–receptor interaction follows a modified Lennard–Jones potential37,47 as Uij = 4εligand[(σb/rij)12 − (σb/rij)6] − Ucut, when rij ≤ rcut and Uij = 0 otherwise. Here, rcut = r0 for a short-range attractive interaction and Ucut = 4εligand[(σb/r0)12 − (σb/r0)6]. Due to the difference between this ligand–receptor cutoff distance and bilayer thickness, ligands on the NPs can only interact with the receptors on the outer leaflet. The equilibrium distance is fixed by using σb = 0.624r0. Additionally, the repulsive force is limited to 25kBT/r0. We use εligand = 12kBT. The single ligand–receptor binding energy is then around 6.8kBT.47 This pair-wise interaction setting between ligands and receptors is a commonly used strategy in simulations to speed up the membrane wrapping process.14,32,33,36 Different from the valence-limited interactions,59 the pair-wise potential can lead to multivalent ligand–receptor interactions. The maximum bound receptors for a ligand is 6 in our simulations. Such a multivalent interaction is also experimentally possible by engineering antibodies.60
Due to the elasticity of the lipid membrane, the tension of membranes in cells can be adjusted, changing from 0.01 to 10 mN m−1.61 The N-varied DPD method is applied during the membrane wrapping process to ensure a constant tension of the planar membrane.37,47,62–64 In practice, boundaries of the lipid bilayer are treated as a lipid reservoir for addition and removal of lipids. If the lipid number per unit area is larger (or smaller) than a target density ρ, lipid molecules will be deleted (or inserted) into this boundary region to maintain a constant lipid number density. Meanwhile, the corresponding number of water molecules will be randomly inserted into (or deleted from) the simulation box to ensure a constant bead density of 3.0/r30 in the simulation box. The target density ρ is taken based on the relationship between the membrane tension and lipid area given in ESI Fig. S1.† By using the N-varied DPD protocol, the lipid density in the membrane can easily be controlled to maintain the membrane's lateral tension during the membrane wrapping process.
The physical length corresponding to our simulation unit is obtained by comparing the membrane thickness in simulations dHH = 4r0 to the thickness of a real membrane, dHH ≈ 3.53 nm,65 indicating r0 = 0.9 nm. The experimental lipid lateral diffusion coefficient of DMPC is D ≃ 5 μm2 s−1.66 In our simulations, the lipid lateral diffusion coefficient Dlipid ≃ 7.3 × 10⁻²r20/τ is calculated by averaging the values under different membrane tensions. Hereafter, we deduce the physical time scale τ = 11.8 ns. Note that these spatial and temporal mappings are only used to approximate the length and time scales of all DPD simulations, which are different from the real length and time scales in all-atom molecular dynamics simulations.
3. Results and discussion
3.1. Membrane wrapping of the PEGylated liposome and bicelle
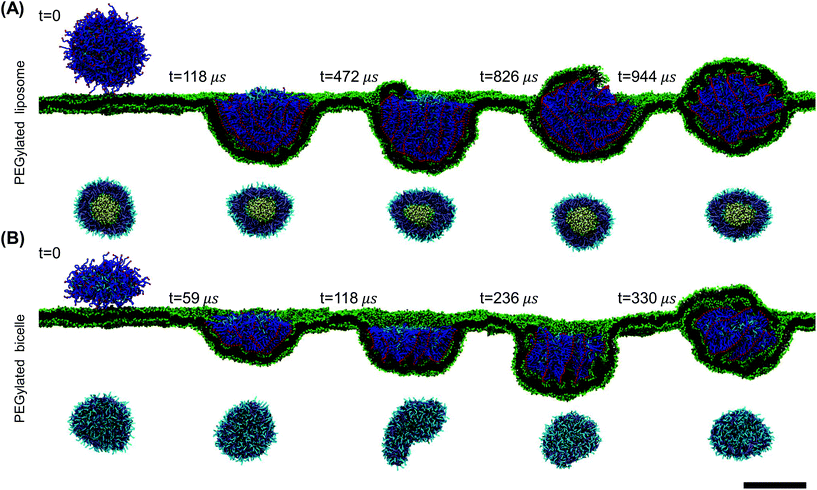
The wrapping process of the PEGylated bicelle shows a similar configurational pathway in terms of the PEG polymers’ aggregation and rearrangement in Fig. 2(B). Half of the bicelle is quickly wrapped by the membrane at t = 59 μs. PEG polymers start to aggregate within the wrapped region. At t = 118 μs, with more PEG polymers aggregated, the bicelle elongates into a strip-like shape. Compared to a disc-like geometry, this strip-like shape has a longer edge, in which it produces a large curvature. This large curvature at the edge can release the increased interactive energy between aggregated PEG polymers.67 At t = 236 μs, the bicelle slightly rotates to release the membrane energy. At the same time, lipids in the membrane start to protrude. Following the membrane protruding and PEG polymer rearrangement, the bicelle recovers its initially disc-like shape when fully wrapped at t = 336 μs. It is also interesting to note that during the wrapping processes for both the liposome and bicelle, the ligands arrange in an ordered strip-like pattern. This specific arrangement of ligands should be caused by the competition between the PEG free energy and ligand–receptor binding energy.
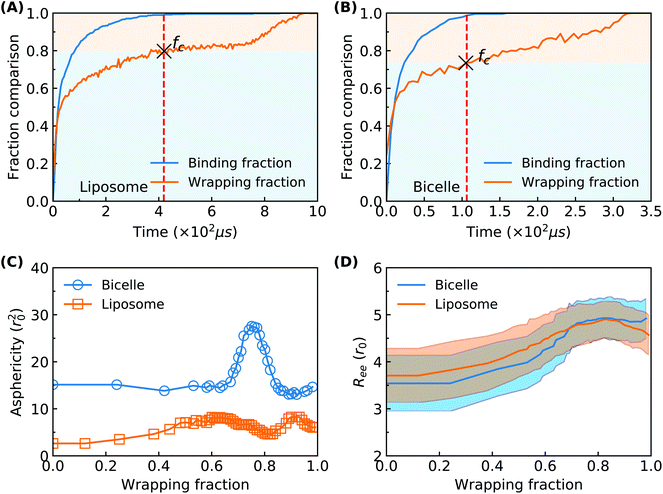
To explore more details behind the membrane wrapping process, we proceed to calculate both the ligand–receptor binding fraction and wrapping fraction f. The binding fraction is defined as the ratio of the bonded ligand number to total ligand number in the liposome/bicelle. As given in Fig. 3(A) and (B), due to the mobility of ligands on PEG polymers, the increment of the binding fraction is much faster than that of f in both the PEGylated liposome and the bicelle. As highlighted by the dashed lines, it is worth noticing that all the ligands in the liposome and bicelle are bound to receptors in the membrane and exhausted at the critical wrapping ratio fc ≈ 0.7. It means that no driving force can be provided by ligands at the later wrapping state (f > fc). To fully wrap the liposome/bicelle, the key question is what will drive the membrane wrapping after ligands have been exhausted.
We further calculate the asphericity of the liposome/bicelle, and the end-to-end distance of grafted PEG polymers. The asphericity of the liposome/bicelle, defined by r2gz − 0.5(r2gx + r2gy), is plotted against f in Fig. 3(C). Here, r2gx, r2gy and r2gz are the ordered principal moments of the NP gyration tensor (r2gx ≤ r2gy ≤ r2gz). A large asphericity value indicates a pronounced anisotropic shape.68 As we can see in Fig. 3(C), the variation of asphericity is more pronounced for the bicelle. In particular, near the wrapping fraction of f ≈ 0.75, the asphericity of the bicelle has increased by a factor 2 compared with its initial value. This large variation corresponds to the strip-like shape of the bicelle at t = 118 μs, cf. Fig. 2(B), when all the PEG polymers are aggregated within the wrapped region. The average end-to-end distance Ree = 〈R2ee〉1/2 as given in Fig. 3(D) is another indicator of PEG polymer configurations. The Ree for both the liposome and bicelle increases with increasing wrapping fraction below f ≈ 0.7, since PEG polymers still tend to aggregate within the wrapping region. Afterwards, their Ree values change slightly with the redistribution of PEG polymers.
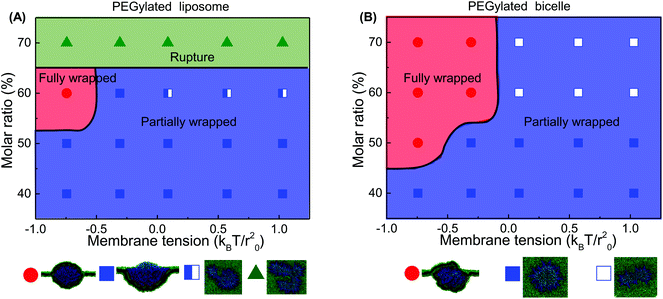
Concerning the PEGylated bicelle, its configuration within the trapped state is also dependent on the PEG molar ratio. At 40% mol and 50% mol, the trapped bicelle maintains its disc-like shape, while it finally deforms into the above-mentioned strip-like shape at 60% mol and 70% mol. The membrane wrapping processes for bicelles with 50% mol and 70% mol PEG polymers are given in ESI Fig. S4.†
Comparing these two phase diagrams, we find that the PEGylated bicelle has a larger chance to be fully wrapped. First, the possibility for the PEGylated liposome to rupture sets an upper limit boundary to the PEG polymer molar ratio, which does not exist for the PEGylated bicelle. Additionally, the minimum required PEG molar ratio for the PEGylated liposome is larger than that of the PEGylated bicelle. More importantly, it is interesting to find that the full wrapping (f = 1) of the PEGylated liposome and bicelle can only occur when the effective membrane tension is compressive. Due to the mobility of PEG polymers, the ligands on the liposome/bicelle are exhausted before its fully wrapped state is reached. It is the compressive tension that makes it energetically favorable and drives the membrane wrapping after the ligands are exhausted. Furthermore, the PEGylated bicelle has a larger membrane tension boundary compared to that of the PEGylated liposome, i.e., the absolute value of the compressive membrane tension boundary for the PEGylated bicelle is smaller than that of the PEGylated liposome. This suggests that a PEGylated bicelle is more easily fully wrapped by the membrane than its liposomic counterpart. The key question about the membrane tension boundary is why the PEGylated bicelle is more favorable. In living cells, the required compressive membrane tension can be produced through active mechanisms.69 For instance, the contraction of actomyosin can produce a compressive stress on the cytoskeletal network, resulting in a locally compressive membrane tension.70,71 It might also suggest that for the cellular uptake of the PEGylated liposome/bicelle, other biological mechanisms should be involved apart from the receptor-mediated membrane wrapping.
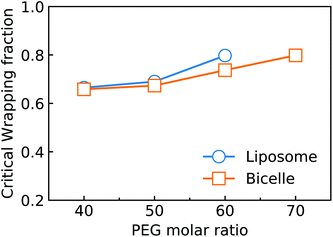
Considering the importance of ligand exhausting, we calculate and compare the critical wrapping fraction fc for a PEGylated liposome and bicelle. When f > fc, any further membrane wrapping is driven by the compressive membrane tension alone. As shown in Fig. 6, the fc is increasing with the increment of the PEG molar ratio. At the same PEG molar ratio, the PEGylated liposome and bicelle share a similar fc value. Moreover, within the studied range of the PEG molar ratio, all the fc values are larger than 0.68.
3.2. Free energy analysis of the membrane wrapping process
To gain deep insights into why a PEGylated bicelle is easier to be wrapped than a PEGylated liposome under otherwise similar conditions, we perform a free energy analysis for the membrane wrapping process. During this process, free energy changes are composed of four major parts: (1) the ligand–receptor binding energy ΔFLR that provides the driving force for membrane wrapping. (2) The energy change caused by PEG polymer aggregation and configurational changes, ΔFPEG. (3) The energy change induced by the deformation of a soft liposome or bicelle, ΔFNP. (4) The energy change associated with the membrane bending, ΔFm. In our simulations, the individual binding strength between the ligand and receptor is about 6.8kBT. Therefore, ΔFLR has a linear relationship with the ligand–receptor binding fraction. In the following parts, we will analyze these free energy changes. Note that the possible free energy changes induced by the membrane fluctuation and translational entropy loss of receptors (and solvent molecules) are small compared with the above free energy changes.72,73 We ignore their contributions to simplify the free energy analysis.| ΔFPEG = ΔFel + ΔFint + ΔFtrans. | (1) |
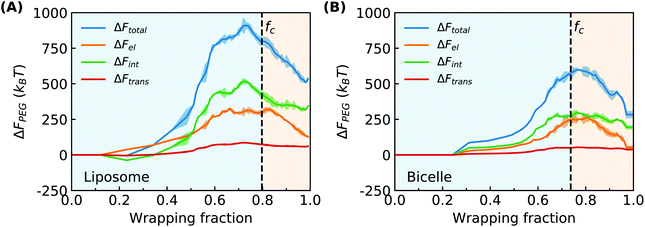
Following the approaches in our previous studies, each part of ΔFPEG can be estimated by feeding self-consistent mean field (SCF) theory with the information about PEG polymer configurations and local volume fractions from DPD simulations.37,38,47,75,76 Based on the SCF theory, the mean elastic energy Fel per chain is linearly proportional to the mean squared end-to-end distance 〈R2ee〉, Fel/nckBT = 3〈R2ee〉/2R20, where R0 represents the equilibrium span of an unconstrained PEG polymer with polymerization degree N, and nc denotes the number of PEG chains. We employ R20 ∝ 〈R2ee〉w using the available N-dependent 〈R2ee〉w values for a single PEGchain in water.47 The mean interaction free energy of each chain Fint is quantified through the spatially inhomogeneous volume fraction φ(r) of PEG monomers.  , where fmix(φ) = (φ2 + φ3)/v is a mixing free energy density, and v = 0.0633 nm2 is the excluded volume for a PEG monomer. The integral extends over the whole PEG–populated volume. The translational free energy ΔFtrans is directly related to the variable distribution of mobile PEG tethering points on the NP surface. It is estimated by the volume fraction profile as
  . Note that the intrinsic relaxation time of a PEG polymer with polymerization degree N = 20 is smaller than 100 ps,77 while a time step Δt in our DPD simulations corresponds to 118 ps. It indicates that PEG polymers are able to relax themselves on a time scale that is short compared with the total simulation time, the equilibrium SCF approach can be considered applicable, and we can extract ΔFPEG in the course of simulation time.
Taking the membrane wrapping processes in Fig. 2 for example, the local volume fraction distributions φ(r) of PEG polymers change dramatically during their aggregation and redistribution, as quantified in Fig. 7. Under the conditions of 60% mol PEG polymers and −0.74kBT/r20 membrane tension, the evolution of φ(r) can be divided into two different stages. Before the exhausting of ligands (t = 472 μs and t = 118 μs for the PEGylated liposome and bicelle, respectively), the PEG volume fraction in the wrapped part of the liposome/bicelle significantly increases due to the aggregation of PEG polymers and at the expense of a dramatically reduced φ(r) value, associated with the depletion of PEG polymers, in the unwrapped part. This highly inhomogeneous PEG volume distribution manifests itself in coexisting highly compacted and reduced occupied regions for PEG polymers, disfavored by Fmix. Along with the spreading of the membrane over the top part of the liposome/bicelle, the PEG volume fraction starts to recover its initial homogeneous distributed state. Note that if the liposome/bicelle remains at the trapped state as for the positive membrane tension cases, the PEG volume fraction distribution is maintained at the highly inhomogeneous state as shown in ESI Fig. S5.†
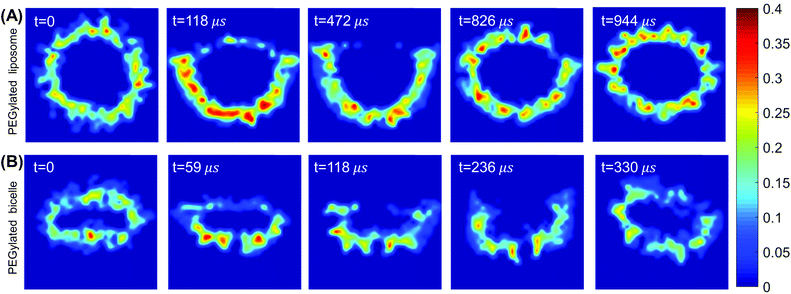 | ||
| Fig. 7 (A and B) Cross-sectional views of PEG polymer volume fraction distribution during the membrane wrapping process: (A) PEGylated liposome and (B) PEGylated bicelle. | ||
Combining the above PEG volume fraction distribution and end-to-end distance of PEG polymers in Fig. 3, we can estimate the free energy change of each of the three contributions to ΔFPEG as shown in Fig. 8. The dashed lines denote the location of the fc values. For the PEGylated liposome, ΔFPEG dramatically increases along with the ligand–receptor binding and PEG aggregation as long as f < fc. The maximum value of ΔFPEG is around 1000kBT for the liposome. The changes of elastic energy ΔFel and interaction energy ΔFint are seen to dominate the PEG energy increment. Compared with ΔFel and ΔFint, the translational entropy change of PEG polymers ΔFtrans is near zero and can be neglected. With recovering to a homogeneous PEG distribution, the ΔFPEG decreases. The PEG free energy changes of the PEGylated bicelle follow a similar trend, while they are overall smaller due to the smaller number of PEG polymers in our bicelle; the maximum energy barrier is at ΔFPEG ≈ 600kBT for the bicelle. Note that for the trapped state of the liposome/bicelle, the ΔFPEG will maintain at its maximum value due to the end-to-end distance increment and highly inhomogeneous PEG volume fraction distribution as given in ESI Fig. S5.† In short, the PEG polymers produce a large energy barrier during the membrane wrapping process for both the PEGylated liposome and bicelle.
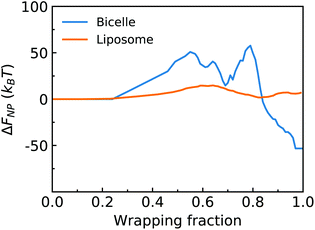
 , where κlip is the assumed spatially homogeneous bending rigidity of the liposome, and c1lip and c2lip are the principal curvatures of the fitted ellipsoidal surface. For a bicelle, its total deformation energy consists of bending energy and edge energy.78,79 The bending energy change of the bicelle is negligible, due to the small variation of curvature during the entire membrane wrapping process, cf. ESI Fig. S6.† To estimate the energy change from edge length variation, we fit the bicelle by an ellipse. The energy change of the bicelle can then be obtained as Ebic = Lλ, where L is the perimeter of the fitted ellipse, and λ is the line tension of the bicelle. The estimated free energy changes ΔFNP for both the liposome and bicelle are given as a function of f in Fig. 9. The energy variation of the liposome is smaller than 25kBT during the whole wrapping process, consistent with the observed small asphericity (Fig. 3). For the bicelle, its energy increases more significantly with its elongation. Its maximum value is around 70kBT. However, compared with the energy change ΔFPEG due to PEG polymers, FNP is much smaller for both the liposome and bicelle.
The membrane energy Em consists of two parts: (1) membrane bending energy Embend and (2) membrane tension energy Emtens,
| Em = Embend + Emtens. | (2) |
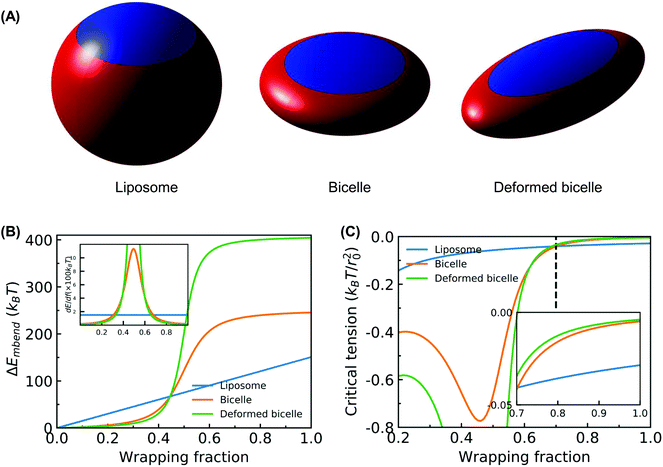
To estimate Em, we assume that an uncorrugated membrane wraps around a solid NP. The geometry of the solid NP is taken based on the shape of the liposome and bicelle in Fig. 2. As illustrated in Fig. 10(A), three different shapes are considered. The first one is a spherical NP to represent the liposome. The radius of the spherical NP is taken as 14.5r0, based on the radius of the liposome 11r0 and the thickness 3.5r0 of the PEG polymer shell. The second one is an oblate NP to mimic the undeformed bicelle. Its principle radii are R1 = R2 = 14.5r0 and R3 = 6r0, obtained from the principle radius of the bicelle and thickness of the PEG polymer shell. The third one is a biaxial ellipsoidal shape to represent the elongated bicelle, with the principle radii R1 = 19r0, R2 = 10r0 and R3 = 4r0. These values are taken from the fitted ellipsoidal shapes of the entire PEGylated bicelle during the wrapping process (cf. ESI Fig. S7†). To simplify the analysis, we only consider the wrapped (red) part of NPs, which can effectively catch the main membrane energy penalty during the wrapping process.36,80,81 With these parameters at hand, the contributions to the membrane energy (Eq. 2) at a certain wrapping fraction f can be expressed as
 | (3) |
| Emtens(f) = σΔS, | (4) |
 | (5) |
The corresponding numerically evaluated σcritical for all three shapes is given in Fig. 10(B). Comparing the critical membrane tension for the liposome and bicelle, it is interesting to find that there are two regions. For wrapping fractions f < 0.7, the σcritical for the bicelle is smaller than that of the liposome because of its highly curved edges. However, for f > 0.7, the σcritical for the bicelle is larger than that of the liposome, which indicates that it is easier to wrap the bicelle after f = 0.7. After f = 0.7, both the σcritical values for the liposome/bicelle are around σcritical = −0.1kBT/r20. Interestingly, this value is consistent with the membrane tension boundary we found in the phase diagrams (Fig. 5). Moreover, the transition wrapping fraction of f = 0.7 is in good agreement with the critical wrapping fraction fc in Fig. 6. These agreements further prove that our membrane energy analysis can estimate the key energy barrier for the bilayer wrapping on a NP. In short, our theoretical analysis explains why the bicelle is energetically more favorable than the liposome after the exhausting of ligands.
The free energy analysis above reveals that the membrane tension required by the disc-like bicelle is larger than that of the liposome. It suggests that under the driving of compressive membrane tension beyond the fc, the disc-like bicelle is energetically more favorable than the spherical liposome. Our result is different from the previous conclusion that driven by the ligand–receptor binding, a disc-like NP is energetically difficult to be fully wrapped compared to a spherical NP.42–44 Our results indicate that the interplay between ligand/PEG mobility and NP geometry can significantly change the existing picture about the influence of NP geometry on the membrane wrapping process. To confirm the interplay between ligand/PEG mobility and NP geometry, we further analyze the critical membrane tension for spherical and oblate NPs with different aspect ratios at f > 0.5. The surface areas of spherical and oblate NPs are considered identical. As given in ESI Fig. S8,† all the oblate NPs with aspect ratio >1 require larger membrane tensions than spherical NPs. Furthermore, the wrapping fraction, beyond which an oblate NP is energetically favorable, is decreasing with increasing aspect ratio. This fact indicates that driven by the compressive membrane tension, an oblate NP with a larger aspect ratio is more easily fully wrapped in the later membrane wrapping stage (at f > fc) due to its flat surface on top.
4. Conclusions
In this work, we performed large scale DPD simulations to understand the membrane wrapping processes of the PEGylated liposome and bicelle. We find that during the wrapping process, characterized by the wrapping fraction f, PEG polymers on the liposome and bicelle aggregate within their wrapped region due to the mobility of polymers and ligand–receptor binding. This aggregation promotes the ligand–receptor binding in the early membrane wrapping state. But the quick ligand and receptor binding results in a critical wrapping fraction fc, after which the ligands are exhausted. According to the fc, the entire membrane wrapping process for the PEGylated liposome/bicelle can be divided into two different stages: (1) as long as f < fc, the membrane wrapping is driven by ligand–receptor binding. (2) For f > fc, no driving force can be provided by ligand–receptor binding. Membrane wrapping cannot proceed unless a compressive membrane tension is provided. Furthermore, by systematically varying the molar ratio of PEGpolymers and membrane tension, we find that the PEGylated liposome is overall more difficult to be fully wrapped than the PEGylated bicelle because of two major reasons: (1) the possibility of rupture of the liposome at a high PEG molar ratio sets the upper limit of the ligand number. Such rupture did not occur for the bicelle under all PEG molar ratios studied in our simulations. (2) The absolute value of the compressive membrane tension boundary of the PEGylated bicelle is smaller than that of the PEGylated liposome, which indicates that the bicelle is the one that is easier to be fully wrapped.Our free energy analysis revealed that PEG polymer aggregation leads to a large free energy barrier, while the energy barrier caused by NP deformation is relatively small and negligible. By analyzing the membrane energy, we find that the absolute value of the compressive membrane tension required by a disc-like bicelle is smaller than that of a spherical liposome, which suggests that the disc-like bicelle is energetically more favorable than the spherical liposome at f > fc, where a compressive membrane tension is required to provide the driving force. The compressive membrane tension in living cells can be produced through active mechanisms.70,71,82 Our results confirm that the interplay between ligand mobility and NP geometry can significantly change our understanding about the influence of NP geometry on the membrane wrapping process. This work can also help understand the cellular uptake process of the PEGylated liposome and bicelle, which might improve the design of new lipid-like drug delivery platforms.
Conflicts of interest
There are no conflicts to declare.Acknowledgements
Z. S., H. Y. and Y. L. are grateful to support from the Department of Mechanical Engineering at the University of Connecticut. This research benefited in part from the computational resources and staff contributions provided for Booth Engineering Center for Advanced Technology (BECAT) at the University of Connecticut. Part of this work used the Extreme Science and Engineering Discovery Environment (XSEDE), which was supported by National Science Foundation grant number ACI-1053575. The contribution by M. K. was promoted by the Swiss National Science Foundation through grants 200021_156106 and 200021L_185052. This work was partially supported by a fellowship grant from GE's Industrial Solutions Business Unit under a GE-UConn partnership agreement. The views and conclusions contained in this document are those of the authors and should not be interpreted as necessarily representing the official policies, either expressed or implied, of Industrial Solutions or UConn.References
- B. Y. Kim, J. T. Rutka and W. C. Chan, N. Engl. J. Med., 2010, 363, 2434–2443 CrossRef CAS PubMed.
- M. E. Davis, J. E. Zuckerman, C. H. J. Choi, D. Seligson, A. Tolcher, C. A. Alabi, Y. Yen, J. D. Heidel and A. Ribas, Nature, 2010, 464, 1067 CrossRef CAS PubMed.
- S. Nie, Nanomed., 2010, 5, 523–528 CrossRef PubMed.
- H. Ye, Z. Shen, L. Yu, M. Wei and Y. Li, Proc. R. Soc. London, Ser. A, 2018, 474, 20170845 CrossRef PubMed.
- R. A. Petros and J. M. DeSimone, Nat. Rev. Drug Discovery, 2010, 9, 615 CrossRef CAS PubMed.
- E. A. Sykes, Q. Dai, C. D. Sarsons, J. Chen, J. V. Rocheleau, D. M. Hwang, G. Zheng, D. T. Cramb, K. D. Rinker and W. C. Chan, Proc. Natl. Acad. Sci. U. S. A., 2016, 113, E1142–E1151 CrossRef CAS PubMed.
- Q. Dai, S. Wilhelm, D. Ding, A. M. Syed, S. Sindhwani, Y. Zhang, Y. Y. Chen, P. MacMillan and W. C. Chan, ACS Nano, 2018, 12, 8423–8435 CrossRef CAS PubMed.
- C. D. Walkey, J. B. Olsen, H. Guo, A. Emili and W. C. W. Chan, J. Am. Chem. Soc., 2012, 134, 2139–2147 CrossRef CAS PubMed.
- S. Zhang, H. Gao and G. Bao, ACS Nano, 2015, 9, 8655–8671 CrossRef CAS PubMed.
- Z. Shen, M.-P. Nieh and Y. Li, Polymers, 2016, 8, 83 CrossRef PubMed.
- A. Albanese, P. S. Tang and W. C. Chan, Annu. Rev. Biomed. Eng., 2012, 14, 1–16 CrossRef CAS PubMed.
- L. Y. Chou, K. Ming and W. C. Chan, Chem. Soc. Rev., 2011, 40, 233–245 RSC.
- Y. Li, Y. Lian, L. T. Zhang, S. M. Aldousari, H. S. Hedia, S. A. Asiri and W. K. Liu, Interface Focus, 2016, 6, 20150086 CrossRef PubMed.
- H.-M. Ding and Y.-Q. Ma, Biomaterials, 2012, 33, 5798–5802 CrossRef CAS PubMed.
- Y. C. Barenholz, J. Controlled Release, 2012, 160, 117–134 CrossRef CAS PubMed.
- A. C. Eifler and C. S. Thaxton, Biomed. Nanotechn., Springer, 2011, pp. 325–338 Search PubMed.
- M. Wang, K. Alberti, S. Sun, C. L. Arellano and Q. Xu, Angew. Chem., Int. Ed., 2014, 53, 2893–2898 CrossRef CAS PubMed.
- A. Sharma and U. S. Sharma, Int. J. Pharm., 1997, 154, 123–140 CrossRef CAS.
- T. Lian and R. J. Ho, J. Pharm. Sci., 2001, 90, 667–680 CrossRef CAS PubMed.
- Z. Shen, A. Fisher, W. K. Liu and Y. Li, Engineering of Biomaterials for Drug Delivery Systems, Elsevier, 2018, pp. 1–26 Search PubMed.
- M. L. Immordino, F. Dosio and L. Cattel, Int. J. Nanomed., 2006, 1, 297 CrossRef CAS PubMed.
- S. M. Moghimi and J. Szebeni, Prog. Lipid Res., 2003, 42, 463–478 CrossRef CAS PubMed.
- P. Marmottant, T. Biben and S. Hilgenfeldt, Proc. R. Soc. London, Ser. A, 2008, 1781–1800 CrossRef CAS.
- G. H. Petersen, S. K. Alzghari, W. Chee, S. S. Sankari and N. M. La-Beck, J. Controlled Release, 2016, 232, 255–264 CrossRef CAS PubMed.
- F. Olson, C. Hunt, F. Szoka, W. Vail and D. Papahadjopoulos, Biochim. Biophys. Acta, Biomembr., 1979, 557, 9–23 CrossRef CAS.
- L. Barbosa-Barros, G. Rodríguez, C. Barba, M. Cócera, L. Rubio, J. Estelrich, C. López-Iglesias, A. de la Maza and O. López, Small, 2012, 8, 807–818 CrossRef CAS PubMed.
- Z. Dai, S. Hameed and P. Bhattarai, Front. Chem., 2018, 6, 127 CrossRef PubMed.
- U. H. Dürr, R. Soong and A. Ramamoorthy, Prog. Nucl. Magn. Reson. Spectrosc., 2013, 69, 1 CrossRef PubMed.
- X. Wang, L. Lin, R. Liu, M. Chen, B. Chen, B. He, B. He, X. Liang, W. Dai and H. Zhang, et al. , Adv. Funct. Mater., 2017, 27, 1700406 CrossRef.
- W. Aresh, Ph.D. thesis, University of Connecticut, U.S.A., 2016.
- W. Aresh, Y. Liu, J. Sine, D. Thayer, A. Puri, Y. Huang, Y. Wang and M.-P. Nieh, J. Biomed. Nanotechnol., 2016, 12, 1852–1863 CrossRef CAS PubMed.
- T. Yue and X. Zhang, Soft Matter, 2013, 9, 559–569 RSC.
- V. Schubertová, F. J. Martinez-Veracoechea and R. Vácha, Soft Matter, 2015, 11, 2726–2730 RSC.
- T. Yue, Y. Xu, M. Sun, X. Zhang and F. Huang, Phys. Chem. Chem. Phys., 2016, 18, 1082–1091 RSC.
- S. Li, Z. Luo, Y. Xu, H. Ren, L. Deng, X. Zhang, F. Huang and T. Yue, Biochim. Biophys. Acta, Biomembr., 2017, 1859, 2096–2105 CrossRef CAS PubMed.
- R. Guo, J. Mao and L.-T. Yan, ACS Nano, 2013, 7, 10646–10653 CrossRef CAS PubMed.
- Y. Li, M. Kröger and W. K. Liu, Nanoscale, 2015, 7, 16631–16646 RSC.
- Z. Shen, H. Ye, M. Kröger and Y. Li, Nanoscale, 2018, 10, 4545–4560 RSC.
- L. Di Michele, P. K. Jana and B. M. Mognetti, Phys. Rev. E, 2018, 98, 032406 CrossRef CAS.
- Z. Shen, H. Ye and Y. Li, Phys. Chem. Chem. Phys., 2018, 20, 16372–16385 RSC.
- X. Yi, X. Shi and H. Gao, Phys. Rev. Lett., 2011, 107, 098101 CrossRef PubMed.
- L. Chen, S. Xiao, H. Zhu, L. Wang and H. Liang, Soft Matter, 2016, 12, 2632–2641 RSC.
- A. H. Bahrami, Soft Matter, 2013, 9, 8642–8646 RSC.
- S. Dasgupta, T. Auth and G. Gompper, Soft Matter, 2013, 9, 5473–5482 RSC.
- P. J. Hoogerbrugge and J. M. V. A. Koelman, Europhys. Lett., 1992, 19, 155 CrossRef.
- R. D. Groot and P. B. Warren, J. Chem. Phys., 1997, 107, 4423 CrossRef CAS.
- Y. Li, M. Kröger and W. K. Liu, Biomaterials, 2014, 35, 8467–8478 CrossRef CAS PubMed.
- R. D. Groot and K. Rabone, Biophys. J., 2001, 81, 725–736 CrossRef CAS PubMed.
- A. Grafmüller, J. Shillcock and R. Lipowsky, Biophys. J., 2009, 96, 2658–2675 CrossRef PubMed.
- A. Grafmüller, J. Shillcock and R. Lipowsky, Phys. Rev. Lett., 2007, 98, 218101 CrossRef PubMed.
- M. Mutz and W. Helfrich, J. Phys., 1990, 51, 991–1001 CrossRef CAS.
- R. Goetz, G. Gompper and R. Lipowsky, Phys. Rev. Lett., 1999, 82, 221 CrossRef CAS.
- R. S. Gracià, N. Bezlyepkina, R. L. Knorr, R. Lipowsky and R. Dimova, Soft Matter, 2010, 6, 1472–1482 RSC.
- G. Niggemann, M. Kummrow and W. Helfrich, J. Phys. II, 1995, 5, 413–425 CrossRef CAS.
- E. C. Cho, L. Au, Q. Zhang and Y. Xia, Small, 2010, 6, 517–522 CrossRef CAS PubMed.
- A. de la Zerda, S. Bodapati, R. Teed, S. Y. May, S. M. Tabakman, Z. Liu, B. T. Khuri-Yakub, X. Chen, H. Dai and S. S. Gambhir, ACS Nano, 2012, 6, 4694–4701 CrossRef CAS PubMed.
- H. Gao, W. Shi and L. B. Freund, Proc. Natl. Acad. Sci. U. S. A., 2005, 102, 9469–9474 CrossRef CAS PubMed.
- R. Vácha, F. J. Martinez-Veracoechea and D. Frenkel, Nano Lett., 2011, 11, 5391–5395 CrossRef PubMed.
- C. Knorowski and A. Travesset, Soft Matter, 2012, 8, 12053–12059 RSC.
- Á. M. Cuesta, N. Sainz-Pastor, J. Bonet, B. Oliva and L. Álvarez-Vallina, Trends Biotechnol., 2010, 28, 355–362 CrossRef PubMed.
- N. C. Gauthier, T. A. Masters and M. P. Sheetz, Trends Cell Biol., 2012, 22, 527–535 CrossRef CAS PubMed.
- B. Hong, F. Qiu, H. Zhang and Y. Yang, J. Phys. Chem. B, 2007, 111, 5837–5849 CrossRef CAS PubMed.
- H.-M. Ding and Y.-Q. Ma, Biomaterials, 2014, 35, 8703–8710 CrossRef CAS PubMed.
- Y. Li, X. Zhang and D. Cao, Nanoscale, 2015, 7, 2758–2769 RSC.
- N. Kučerka, Y. Liu, N. Chu, H. I. Petrache, S. Tristram-Nagle and J. F. Nagle, Biophys. J., 2005, 88, 2626–2637 CrossRef PubMed.
- G. Orädd, G. Lindblom and P. W. Westerman, Biophys. J., 2002, 83, 2702–2704 CrossRef.
- U. Dahal, Z. Wang and E. E. Dormidontova, Macromolecules, 2018, 51, 5950–5961 CrossRef CAS.
- J. Liang, P. Chen, B. Dong, Z. Huang, K. Zhao and L.-T. Yan, Biomacromolecules, 2016, 17, 1834–1844 CrossRef CAS PubMed.
- M. Dogterom and G. Koenderink, Nat. Mater., 2011, 10, 561 CrossRef CAS PubMed.
- G. T. Charras, J. C. Yarrow, M. A. Horton, L. Mahadevan and T. Mitchison, Nature, 2005, 435, 365 CrossRef CAS PubMed.
- G. Charras and E. Paluch, Nat. Rev. Mol. Cell Biol., 2008, 9, 730 CrossRef CAS PubMed.
- J. Liu, G. E. Weller, B. Zern, P. S. Ayyaswamy, D. M. Eckmann, V. R. Muzykantov and R. Radhakrishnan, Proc. Natl. Acad. Sci. U. S. A., 2010, 107, 16530–16535 CrossRef CAS PubMed.
- R. Bradley and R. Radhakrishnan, Polymers, 2013, 5, 890–936 CrossRef PubMed.
- R. Nap, Y.-Y. Won and I. Szleifer, Soft Matter, 2012, 8, 1688–1700 RSC.
- Z. Shen, H. Ye, M. Kröger and Y. Li, Phys. Chem. Chem. Phys., 2017, 19, 13294–13306 RSC.
- Z. Shen, D. T. Loe, J. K. Awino, M. Kröger, J. L. Rouge and Y. Li, Nanoscale, 2016, 8, 14821–14835 RSC.
- J. Y. Wong, T. L. Kuhl, J. N. Israelachvili, N. Mullah and S. Zalipsky, Science, 1997, 275, 820–822 CrossRef CAS PubMed.
- W. Shinoda, T. Nakamura and S. O. Nielsen, Soft Matter, 2011, 7, 9012–9020 RSC.
- C. Huang, D. Quinn, Y. Sadovsky, S. Suresh and K. J. Hsia, Proc. Natl. Acad. Sci. U. S. A., 2017, 114, 1910–2915 CrossRef PubMed.
- J. Mao, P. Chen, J. Liang, R. Guo and L.-T. Yan, ACS Nano, 2016, 10, 1493–1502 CrossRef CAS PubMed.
- F. Frey, F. Ziebert and U. S. Schwarz, Phys. Rev. Lett., 2019, 122, 088102 CrossRef CAS PubMed.
- J. Solon, J. Pécréaux, P. Girard, M. C. Fauré, J. Prost and P. Bassereau, Phys. Rev. Lett., 2006, 97, 098103 CrossRef PubMed.
Footnote |
| † Electronic supplementary information (ESI) available: Details of the computational models for PEGylated liposomes and lipid membrane, computational methods and additional simulation results. See DOI: 10.1039/C9NR02408E |
| This journal is © The Royal Society of Chemistry 2019 |

