
Recent insights into upconverting nanoparticles: spectroscopy, modeling, and routes to improved luminescence
Gabriella
Tessitore
 a,
Gabrielle A.
Mandl
a,
Mikhail G.
Brik
bcd,
Wounjhang
Park
e and
John A.
Capobianco
*a
a,
Gabrielle A.
Mandl
a,
Mikhail G.
Brik
bcd,
Wounjhang
Park
e and
John A.
Capobianco
*a
aDepartment of Chemistry and Biochemistry and Centre for NanoScience Research, Concordia University, 7141 Sherbrooke St. W. Montreal, Quebec, Canada H4B 1R6. E-mail: John.Capobianco@Concordia.ca
bCollege of Sciences, Chongqing University of Posts and Telecommunications, Chongqing 400065, People's Republic of China
cInstitute of Physics, University of Tartu, W. Ostwald Str. 1, Tartu 50411, Estonia
dInstitute of Physics, Jan Długosz University, Armii Krajowej 13/15, PL-42200 Częstochowa, Poland
eDepartment of Electrical, Computer & Energy Engineering, University of Colorado, Boulder, CO 80309-0425, USA
First published on 15th May 2019
Abstract
The development of reliable and reproducible synthetic routes that produce monodisperse lanthanide-doped upconverting nanoparticles has resulted in an appreciable need to determine the mechanisms which govern upconversion luminescence at the nanoscale. New experimental and theoretical evidence explicates the quenching phenomena involved in the low luminescence efficiencies. A deeper understanding of the role of surfaces and defects in the quenching mechanisms and the properties of upconverting nanoparticles are of fundamental importance to develop nanomaterials with enhanced luminescence properties. Herein, we summarize the most recent spectroscopic investigations, which have enabled the scientific community to ascertain that the predominant source of quenching involved in the luminescence of lanthanide-doped upconverting nanoparticles can be attributed to surface-defects. Modeling of these mechanisms in nanomaterials supports the experimental findings and yields further insights into the surface phenomena, providing a predictive tool to improve the luminescent efficiencies in nanomaterials.
1. Introduction
Far from being mere miniaturizations of their bulk counterparts, nanoparticles (NPs) are heterogeneous systems, whose characterization and modeling represents a compelling challenge. In luminescent bulk materials, an impurity ion can occupy one or more sites with a random distribution in the host lattice, resulting in a homogeneous crystalline material. In contrast, impurities in crystalline nanoparticles are not statistically distributed.1–4 During the synthesis in solution of lanthanide-doped luminescent NPs, the ionic radii and concentration of the reacting species, and the growing particle size influence the equilibrium between the ions on the particle surface and in solution.5–8 The surface of NPs undergoes continuous ionic substitution during the growth of the NPs, owing to their high surface reactivity. This results in a non-statistical of dopant ions and defects, and a varying density of the NPs along their radial coordinate. Differences in the ionic radii between the host and dopant ions at the substitution site can also generate distortions and defects within the particle, but these distortions occur predominantly at the surface.9–11 Furthermore, lowering of the symmetry of the occupancy site can be observed for substitution between ions with different dimensions.12 Due to the known influence of the local field on the emission probability in lanthanides,13,14 the inherent inhomogeneity of lanthanide-doped NPs determines their unique luminescence mechanism.Upconversion luminescence (UCL) occurs by excitation of the material with low energy photons in the near-infrared (NIR) region, promoting multi-step absorption from resonant states in lanthanide ions.13,14 The population of higher energy levels can result in the conversion of NIR light, which is advantageous for a variety of biological applications requiring emissions in the ultraviolet (UV) and visible regions.9–11 Commonly, a sensitizer ion is required to achieve a stronger absorption in the NIR. Resonance between the energy levels of the emitting ion and the sensitizing ions is required, as well as the presence of metastable intermediate states.13,14 Consequently, Yb3+ or Nd3+ are used as sensitizers, and Er3+, Tm3+, and Ho3+ are the most efficient activators. Among the different mechanisms determining the population of the emitting levels, non-radiative energy transfer (ET), or Förster resonance energy transfer (FRET), from the sensitizer to the activator ions, is mainly responsible for the UCL in co-doped materials, i.e., energy transfer upconversion (ETU).13,14 A host with low maximum phonon energy further guarantees a lower quenching of emissions via multi-phonon relaxations, with the hexagonal β-NaREF4 (RE = rare earth) being one of the most efficient hosts for UCL.15–17 It has also been proven that the microscopic disorder of the hexagonal lattice leads to line broadening, which is fundamental for the occurrence of FRET between sensitizer and activator.16
Several synthetic protocols have been developed to achieve monodisperse upconverting NPs (UCNPs) with defined shapes and sizes.9–11,18 Current studies underline the necessity of understanding the fundamental mechanisms involved in the quenching phenomena at the nanoscale. New insights into the origin of the lower luminescence efficiencies of the UCNPs in comparison to the bulk materials have been provided by spectroscopic investigations, whose results are summarized in the next section. Furthermore, the latest achievements in enhancing the UCL in NPs are provided in the second section, underlining the luminescence mechanisms involved in such improvements. Finally, the role of modelling in the understanding and prediction of the optical properties of nanomaterials is the topic of the last section of this review. Density functional theory (DFT) and the resolution of rate equations describing the population dynamics of the states yield further proof of the quenching mechanisms at the UCNPs surface.
2. Quenching mechanisms in upconverting nanoparticles
It is of paramount importance to determine the specific mechanisms which affect the luminescence of lanthanide-doped UCNPs, in order produce brighter luminescent materials. Quenching of luminescence from a particular energy level of an emitting ion can occur via several non-radiative mechanisms, e.g., cross-relaxation, energy migration to a trap, and FRET to ligand or solvent molecules.19,20 These mechanisms result in a faster decay of the emission from the excited state involved in the transition. The susceptibility of a lanthanide state to a particular quenching mechanism depends on its stability, resonance with other transitions within the involved ions and solvents or ligands vibrational modes.UCL in lanthanide-doped nanomaterials is affected by particle size, power density of the exciting source, environment, dopant concentrations, and synthesis protocol. As the size of the nanoparticles decreases, the increase of their surface-to-volume ratio with decreasing size gives rise to a greater number of ions which lie on the surface.21 It is generally accepted that ions at the surface usually possess reactive dangling bonds.21,22 These bonds are unsaturated and usually carry a partial charge that increases the energy of the surface.21 Simply stated, systems like to reduce their free energy, thus the dangling bonds react with the environment. Therefore, depending on the nature of the solvent, high energy vibrations play an important role in the quenching mechanism. It is well established that most defects in the crystal structure of nanoparticles are located near the surface. Thus, as the surface to volume ratio increases, the defects created during the synthesis play a key role in decreasing the upconversion luminescence. Therefore, core shell architecture has been employed to decrease the effect of surface defects and support for this has been obtained from quantum yield measurements.23–25
Because of their reduced efficiency, higher powers are required to achieve UCL in small size particles. Consequently, the saturation power density at which the maximum emission from a state is achieved increases with decreasing particle size. Moreover, the population of energy states requiring a greater number of photons is favored at high powers. Recently, it was discovered that the ratio between the Er3+ green emissions from the 4S3/2, 2H11/2 states, and the red emission from the 4F9/2 level is a function of the particle size and power density in the most widely investigated β-NaYF4:Yb3+/Er3+ UCNPs, as shown in Fig. 1b.26 At a power density of 50 W cm−2 or less, the green-to-red ratio diminishes with decreasing particle size.26,27 This effect is derived from a more probable multi-phonon relaxation for smaller particles, favoring the population of the 4F9/2 state over the green emitting states, which has been well-proven in other hosts,28 and is an effect which is highly dependent on the power density used to study the nanoparticle system. Size-dependent differences in the green-to-red ratio have been shown, when varying the power density between 50 and 430 W cm−2.26 In contrast to what has been observed at low power density, in this high power density region, the highest green-to-red ratios were reported for the smallest particles, as shown in Fig. 1b.26 The population pathway of the 4F9/2 state has been reported as both a two- and three-photon process in the literature.26,29,30 In this study, the authors proved that the contribution of the tri-photonic population pathway of the 4F9/2 level decreases as the size decreases, owing to increased quenching effects of the involved higher energy levels.26 This conclusion was also evidenced by a study on the photonic order of the red emission, which was bi-photonic for all sub-20 nm particles regardless of power density, and a mixture of bi- and tri-photonic orders for particles greater than 20 nm. Fig. 1a illustrates the change in relative photon flux of the green and red emissions as a function of excitation power density, solvent, and particle size.26 This study clearly demonstrated that power density had a major effect on the relative red and green emissions in Er3+, where lower power densities favor green emission until saturation of the level occurs, after which the excess energy works to populate the 4F9/2 state, resulting in an increase in the relative contribution of the red emission. It has also been observed an increase in the contribution of the 810 nm emission for sub-20 nm UCNPs, indicating an increase of the population of the 4I9/2 level from the 4F9/2 and 4S3/2 states with decreasing particle size.26 Because the NIR intermediate states of activator ions are metastable, depopulation of higher energy levels generally results in NIR emission. These results underline the importance of reporting the NIR emissions in UCNPs.
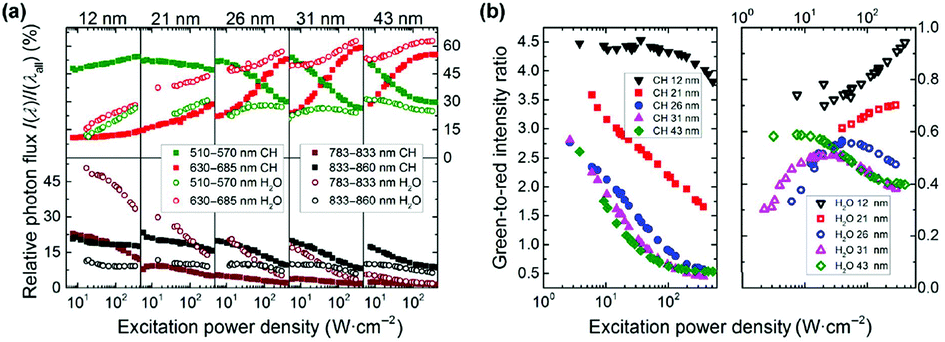 | ||
| Fig. 1 (a) Relative photon flux of the different UC emission bands (I(λ)) of Er3+versus overall UCL (I(λall)), derived by integrating the Er3+ emission bands from 510–570 nm (green), 630–685 nm (red), 783–833 nm (brown), and 833–860 nm (black), and dividing them by the intensity of the integral overall UCL (integration from 400–860 nm) in cyclohexane (full symbols) and H2O (open symbols) for 12, 21, 26, 31, and 43 nm UCNPs.(b) P-dependence of the integrated intensity ratio of the green emission between 510–570 nm and red emission between 630–685 nm in cyclohexane (left) and water (right) for 12, 21, 26, 31, and 43 nm UCNPs. This figure has been reproduced from ref. 26 with permission from Springer. | ||
Concerning the effect of particle shape, the aspect ratio of UCNPs has been demonstrated to affect the overall red and green luminescence intensities and lifetimes in β-NaYF4:Yb3+/Er3+, which has been attributed to anisotropic multi-phonon relaxation processes due to different ion-ion distances and lattice energies along different crystal planes within a single NP.31
In addition to the effects of size and shape, the solvent plays a significant role in the luminescence dynamics of β-NaYF4:Yb3+/Er3+.32,33 The effectiveness of solvent-mediated quenching depends on the refractive index and nature of the solvent (aliphatic, aromatic, etc.), and the energy overlap between the vibrational states of the solvent molecules and the energy gap between emitting levels in UCNPs.20 Moreover, according to the local-field cavity model,34–36 an inverse relationship between the radiative decay rate and the refractive index has been observed, which indicates that an increased refractive index results in enhanced emission.
Generally, a clear distinction can be made between the effects of solvents containing –OH and –CH groups, because of their different vibrational energies (approximately 3300 and 3000 cm−1, respectively). Due to their higher effective phonon energy, –OH groups can cause a significant depletion in the UCL. In particular, –OH vibrations are known to influence the value of the green-to-red ratio in Yb3+/Er3+ co-doped UCNPs, due to the resonance of the –OH vibration with the 4S3/2,2H11/2 → 4F9/2 and the 4I11/2 → 4I13/2 transitions for Er3+, as shown in Fig. 2.26,30,33,37 It has been further established that the luminescence population pathways of the red and green emitting states in β-NaYF4:Yb3+/Er3+ in aqueous environments differ depending on the excitation power density.33 As shown in Fig. 2a, for higher power densities, it was demonstrated that the population of the levels was similar to the population pathways in organic media, whereas at low powers the effect of –OH vibrations on the population mechanism was far more pronounced.33 For the 4I13/2 level, a linear relationship has been observed between increasing –OH concentration and the decreasing lifetime of the state.37 Thus, there is an enhancement of the red emission at the expense of the green one. This –OH induced relaxation has also been found to occur for the 2F5/2 → 2F7/2 transition of Yb3+.32 The multi-phonon relaxation of Yb3+ is especially deleterious to the overall luminescence of UCNPs in water since an efficient population of Yb3+ is crucial to ETU. This effect was studied in both Yb3+/Er3+ and Yb3+/Tm3+ systems, and quenching of Yb3+ was found to be responsible for up to 99.9% of the decrease in UCL intensity of bare UCNPs in water.32 Organic solvents, which contain –CH groups, are often treated as having similar effects on the luminescence of UCNPs. However, the C–H stretching vibrations of aliphatic solvents have a significantly higher quenching effect on red emission of Er3+ than aromatic solvents, due to the greater overlap of the aliphatic –CH vibrational energy with the Er3+ 4F9/2 → 4I9/2 transition, which is responsible for non-radiative decay of the red-emitting level.20
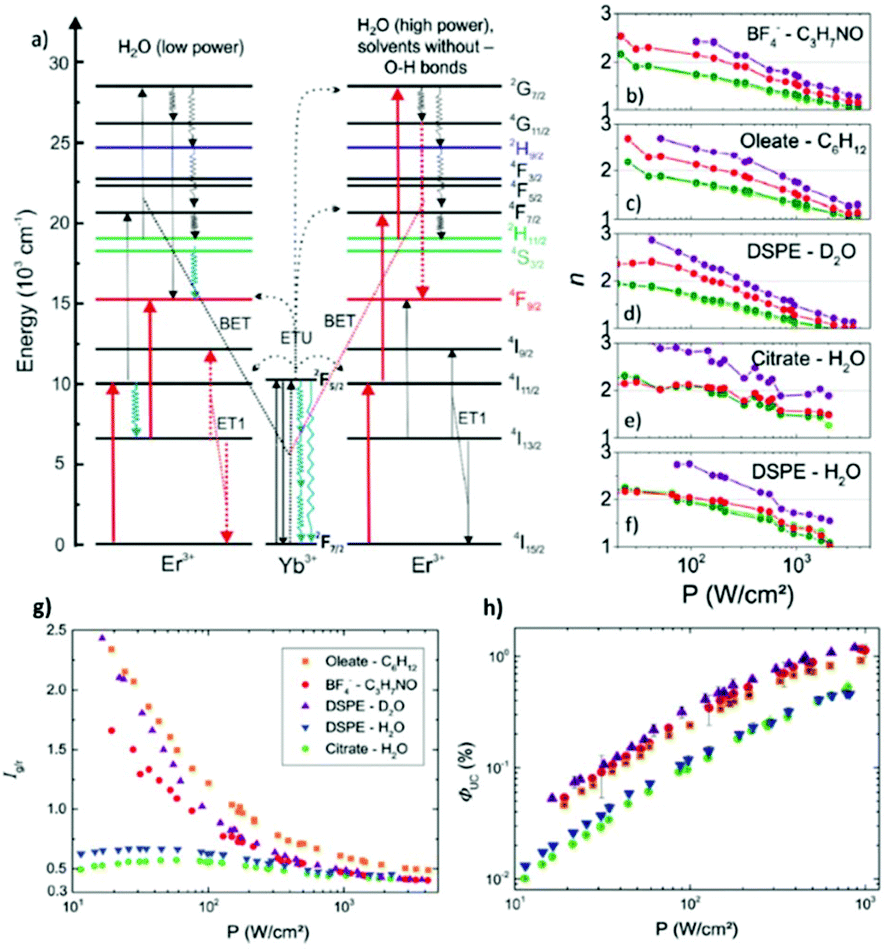 | ||
| Fig. 2 (a) Energy scheme of Yb3+–Er3+ interactions, with red arrows indicating the dominant population pathways for UCNPs in water at low (left)and high (right) P; the latter population pathways closely match with the photo-physics of UCNPs in organic solvents and D2O. Blue arrows indicate a major influence of O–H vibrations. The arrow length represents the energy of the vibrational mode. ET: Energy transfer, ETU: energy transfer UC, and BET: back energy transfer. Panels (b)–(f) P-dependence of the slope factors n of the green (520 nm: light green; 545 nm: dark green; Ig), red (655 nm; Ir) and blue (410 nm; Ib) emission bands of the differently surface-functionalized UCNPs dispersed in different solvents. (b) BF4−-capped UCNPs in DMF, (c) OA-capped UCNPs in cyclohexane, (d) DSPE-stabilized UCNPs in D2O, (e) citrate-stabilized UCNPs in water, and (f) DSPE-stabilized UCNPs in water. P-Dependence of Ig/r (g) and ΦUC (h) for OA-capped UCNPs in cyclohexane, citrate-stabilized UCNPs in water, and DSPE-stabilized UCNPs in water and D2O, respectively, for P varied between 10 and 1000 W cm−2. This figure has been reproduced from ref. 33 with permission from RSC. | ||
Concentration quenching is a major limiting factor in developing UCNPs with optimal luminescent properties. Typically, sensitizer ions like Yb3+ and Nd3+ are employed at high concentrations to increase the NIR excitation, while activator (emitting) ions are used at sub-5 mol% concentrations to prevent the effects of concentration quenching. The latter can occur via cross-relaxation between dopant ions or energy migration, which can lead to luminescence quenching at defect sites within the crystal or at the crystal surface. It has been determined theoretically that energy migration can occur over an average distance of 28 nm, which in many practical cases may be larger than the diameter of the UCNPs.19 Passivation of the surface by an inert shell of sufficient thickness significantly reduces, and in some cases eliminates, the effects of concentration quenching by preventing energy migration to the surface.38,39 Studies of core–shell UCNPs have been instrumental in determining the origins of concentration quenching for different emissive states in Yb3+/Er3+ systems. The red-emitting 4F9/2 state and 4I13/2 state undergo concentration quenching exclusively through energy migration, which can be fully suppressed by the addition of a thick inert shell, as evidenced in Fig. 3, where the red luminescence of NaErF4 was found to recover with increasing shell thickness.38,39 Further research has determined the green-emitting 4S3/2 level experiences concentration quenching due to cross-relaxation in addition to energy migration to defects, as evidenced by increased decay rates at increased Er3+ concentrations, which could not be entirely suppressed by surface passivation.38 Recent studies elucidate the role of –OH defects in the nanocrystals as the primary cause of UCL quenching, with the majority of the loss in UCL due to Yb3+–Yb3+ energy migration to photon traps.20,32,38
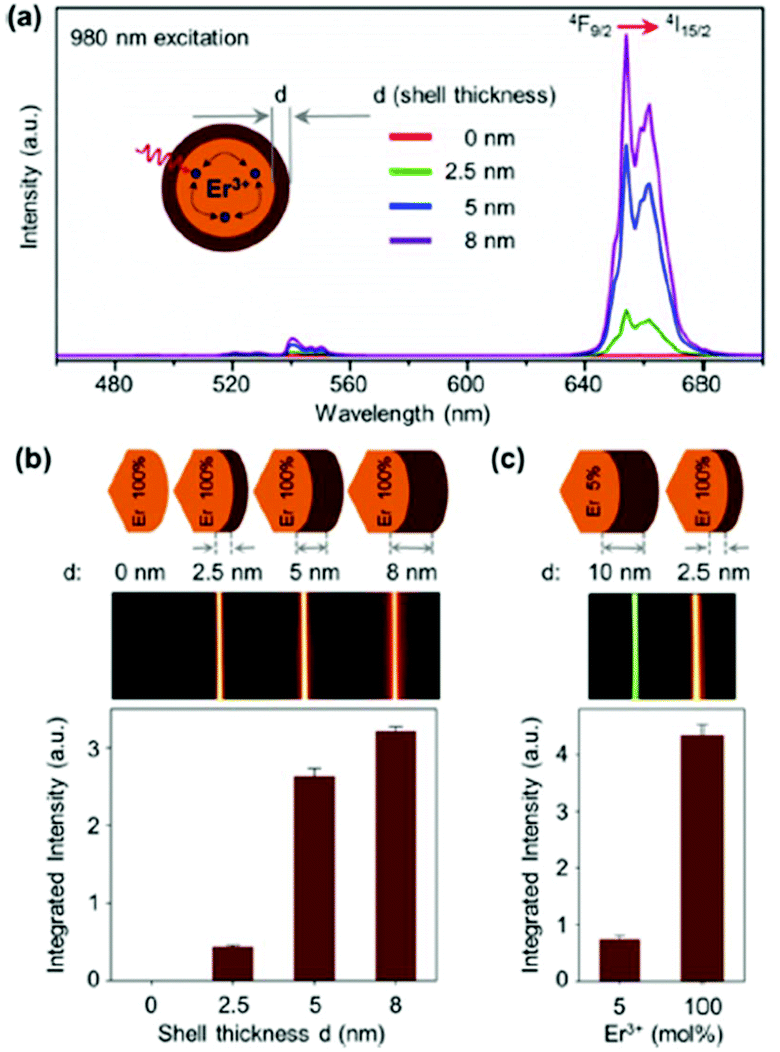 | ||
| Fig. 3 (a) UC emission spectra of NaErF4 core (d = 0 nm), and NaErF4–NaLuF4 core–shell nanocrystals with increasing shell thickness, λexc = 980 nm. (b) Integrated emission intensity as a function of shell thickness, and UC emission photos of colloidal dispersion of core–shell nanocrystals as a function of shell thickness. (c) Normalized integrated emission intensity of NaYF4:Er3+ (5 mol%) – NaLuF4 core–shell nanocrystal with a shell thickness of d = 10 nm and NaErF4–NaLuF4 core–shell nanocrystal with a shell thickness of d = 2.5 nm, and the respective UC emission photos of the colloidal dispersion. This figure has been reproduced from ref. 39 with permission from ACS Publications. | ||
Though various mechanisms have been found to contribute to the decrease in luminescence in UCNPs, there is a consensus that defects at the surface and within the nanocrystal volume are the underlying cause of many size-related luminescence losses. Considering defects as an inherent result of bottom-up syntheses of nanomaterials, routes to minimize the presence of these defects in UCNPs will significantly improve the luminescence efficiency of these materials, as discussed in the next section. It is further worth mentioning that, since the surface-quenching mechanisms are dependent on the ionic distribution of lanthanide ions within the NPs, which can vary with dopant ionic radius and concentration,1–4 evaluation of the luminescence dynamics should be conducted carefully. Studies of UC mechanisms in homogeneous films of powder samples or passivated UCNPs in solution can help to avoid any misleading interpretations of the several synchronized phenomena occurring at the particle interface. Furthermore, though it is expected in the synthesis of a core–shell structure that an intermixing of ions will occur at the interface between the core and growing inert shell, its effect on the luminescence outcome should be further investigated.3,40–43 It should be noted that the addition of a thick shell cannot compensate for cross-relaxation quenching mechanisms,44 which still limits the dopant levels of activators in the crystals. For a thorough review of the effects of high dopant concentrations on UCL, the reader is referred to the literature.45
3. Routes to enhance upconversion luminescence in nanoparticles
The fundamental understanding of light–matter interaction governing the UCL offers an insight on how manipulating photon states may impact the UC process and ultimately lead to higher efficiencies. For ETU, absorption is generally the limiting step. For a two-photon process, the second photon absorption event must take place within the lifetime of the intermediate level populated by the first absorption event. Consider a photon beam of cross-section dA impingent on a sample with an absorption cross-section, σ. The fraction of photons absorbed is σ/dA and the probability that any individual photon is absorbed is given by P = σ/dA. For simplicity, we assume a three-level system with equally spaced energy levels and identical absorption cross sections for all transitions. The probability of first photon absorption event is simply given by the ratio of absorption cross section, σ, and laser spot size, A, P1 = σ/A. For the second absorption event, we assume a perfectly coherent and monochromatic incident light. In this case, photon absorption event occurs with a probability given by the Poisson distribution.46 It is then straightforward to show the probability of at least one photon absorption event to occur within the excited state lifetime, τ, is given by eqn (1):P2 = 1 − exp(−![[N with combining macron]](https://www.rsc.org/images/entities/i_char_004e_0304.gif) ) ) | (1) |
Here = ηIAτ/hν is the average number of absorption events within time interval, τ, which is determined by the average incident light intensity (power per unit area), I, laser spot size, A, and photon energy, hν. Also, η = σ/A is the quantum efficiency of absorption. Substituting η in the previous equation, the number of absorption events can be rewritten as = σIτ/hν, which is independent on the laser spot size. Finally, the probability of back-to-back absorption is given by the product the two probabilities, P = P1P2.
Fig. 4 shows the back-to-back absorption probability calculated for various excited state lifetimes and absorption cross sections. In all cases, the probability saturates when the intensity is sufficiently high. At lower intensities, the probability decreases linearly. This probability plot can be converted to UCL intensity plot by simply multiplying the incident photon flux and UC photon energy, resulting in the well-known power dependence of UCL – quadratic at low intensities and linear at high intensities.47–49 The saturation point corresponds to the intensity of two photons per interval, τ, multiplied by the quantum efficiency η.
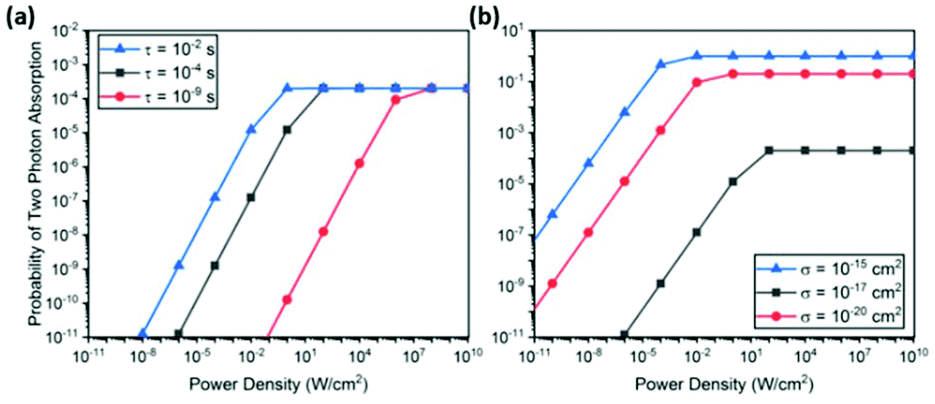 | ||
| Fig. 4 Probability of back-to-back photon absorption within a time interval τ for (a) various time intervals with a fixed absorption cross section, σ = 10−20 cm2, which corresponds to a Ln3+ ion53 and (b) for various absorption cross sections with a fixed excited state lifetime τ = 10−4 s, which is a typical value for rare earth ions. In all calculations, a spherical nanoparticle with a radius 20 nm and Ln3+ ion doping density of 6 × 1020 cm−3 was assumed. These parameters determine the total number of ions within the nanoparticle, which is multiplied to the single ion absorption cross section to obtain, to a first approximation, the aggregate absorption cross section of the entire nanoparticle. The aggregate absorption cross section is then used to calculate the probability P1 of the first absorption event. These parameters do not affect the discussion in the text but scale the total probability to the range commonly encountered in many experiments. | ||
This simple analysis reveals two key parameters that limit the achievable UC efficiency: excited state lifetime τ and absorption cross section σ. As shown in Fig. 4(a), increasing τ lowers the saturation point, thereby increasing the back-to-back absorption probability linearly with the excited state lifetime. On the other hand, an enhancement of σ increases the maximum probability in addition to lowering saturation intensity. As a result, back-to-back absorption probability in the low intensity region scales with σ2. As pointed out recently, this quadratic dependence suggests a very large enhancement in UC efficiency should be achievable with a modest enhancement of σ.48,49
It should be noted that the absorption cross-section, σ, and excited state lifetime, τ, are fundamentally linked together, as both are related to the transition matrix elements.50 Therefore, increasing τ tends to decrease σ and vice versa. One way to increase τ without decreasing σ is to increase the non-radiative lifetime, thereby increasing the overall excited state lifetime without affecting the radiative lifetime, which is directly linked with absorption cross section. Increased non-radiative lifetime is typically achieved by reducing defects and this is believed to be responsible, at least partially, for the recent success with core–shell structures.51,52 UCNP synthesis using an OH-free protocol has already provided evidence that it is possible to achieve quantum yields approaching those of bulk materials and to reduce the presence of inner traps.20
Surface passivation has been demonstrated to inhibit the surface-depletion mechanism due to interactions with the solvent or ligand, and to reduce energy migration to traps. Enhancing luminescence through the use of a passivating shell is generally effective because the increased distance between the luminescent centers and solvent molecules reduces the FRET efficiency and thus suppresses quenching.33 Other elegant approaches to produce efficient UCNPs have been reported in the literature. The latest routes are summarized in the following sections.
3.1. Photonic nanostructure
An effective way to significantly increase absorption cross section without affecting excited state lifetime is to use photonic nanostructures. Metallic and dielectric NPs can generate scattering resonances with electric dipole (ed), electric quadrupole (eq), magnetic dipole (md), and magnetic quadrupole (mq) components, as reported in Fig. 5A and C. For metallic NPs, these resonances arise from the excitation of collective oscillation of free electrons called localized surface plasmon resonance (LSPR). According to Mie's theory, the efficiency of scattering resonances depends on the permittivity ε and the dimension of NPs through a size parameter q = 2πR/λ, where R is the particle radius and λ is the wavelength of the incident light. For dielectric NPs, both electric and magnetic resonances are allowed, and their efficiency is reported in Fig. 5B. It is clear from the Mie theory that the resonance efficiency depends on the incident wavelength and refractive index of the media, n, and that this resonance occurs when the particle size is comparable to the resonant wavelength. | ||
| Fig. 5 (A) Efficiency of scattering resonances versus dielectric permittivity ε (lossless particle, q = 0.5) for metallic (ε < 0) and dielectric (ε > 0) materials. (B) Efficiency of scattering resonances as a function of refractive index n and size parameter. (C) Illustration of electric and magnetic field structures for different electric and magnetic resonances. This figure has been reproduced from ref. 55 with permission from AAAS. | ||
The electric and magnetic field structures in metallic and dielectric NPs can alter the local field of their surroundings. These changes in local field in turn affect the optical processes in UCNPs, resulting in greater UCL by increasing the absorption cross-section, and/or rates of excitation and emission of lanthanide ions. In the framework of quantum electrodynamics, these effects are described by the photonic states. Photonic nanostructures such as the NPs discussed above can greatly impact the photonic states and consequently absorption and scattering cross sections. For this reason, they are often dubbed as optical antennas.54,55 Since photonic nanostructures do not directly change the electronic states, their impact on excited state lifetime is generally small compared to the many orders of magnitude changes possible in absorption cross section. Metallic nanostructures supporting plasmon resonance are particularly effective in increasing absorption cross section.49 Plasmon enhancement of UCL can be achieved via interactions of the LSPR with the excitation and emission wavelengths of UCNPs. It has been demonstrated that there is a greater UCL enhancement when the LSPR is resonant with the excitation wavelength of the UCNPs.54,55 The resonance of the LSPR with the excitation and emission wavelengths is strongly affected by the UCNP size and morphology, metal NP size and morphology, as well as the overall architecture of the plasmonic nanostructure. Inhomogeneity of the nanostructures can play a significant role in the resonance of the system.54,55 A decrease in resonance of the LSPR frequency with the excitation wavelength has been shown to result in a small enhancement, while less efficient resonance with the emission wavelength results in luminescence quenching. Applying Mie's theory, the enhancement factor of absorption, luminescence, and UCQY have been simulated for β-NaYF4:20% Er3+ in proximity of a gold NP at the center of a cubic volume,56,57 as shown in Fig. 6(a–c). The authors first optimized the dimension of the gold NP to achieve resonance with the excitation wavelength of 1523 nm, obtaining maximum resonance for a NP diameter of 300 nm.56 The change factor has been calculated with respect to the light polarization and spatial coordinate, providing a similar trend for the absorption, luminescence, and QY in Fig. 6(d–f), (g–i), and (j–l), respectively. From Fig. 6(j–l), UCQY is clearly quenched in close proximity of the plasmonic NP (d < 40 nm). Fig. 6 summarizes the influence of positioning the UCNPs with respect to the plasmonic nanostructure to achieve the maximum enhancement of the UC luminescence and QY.
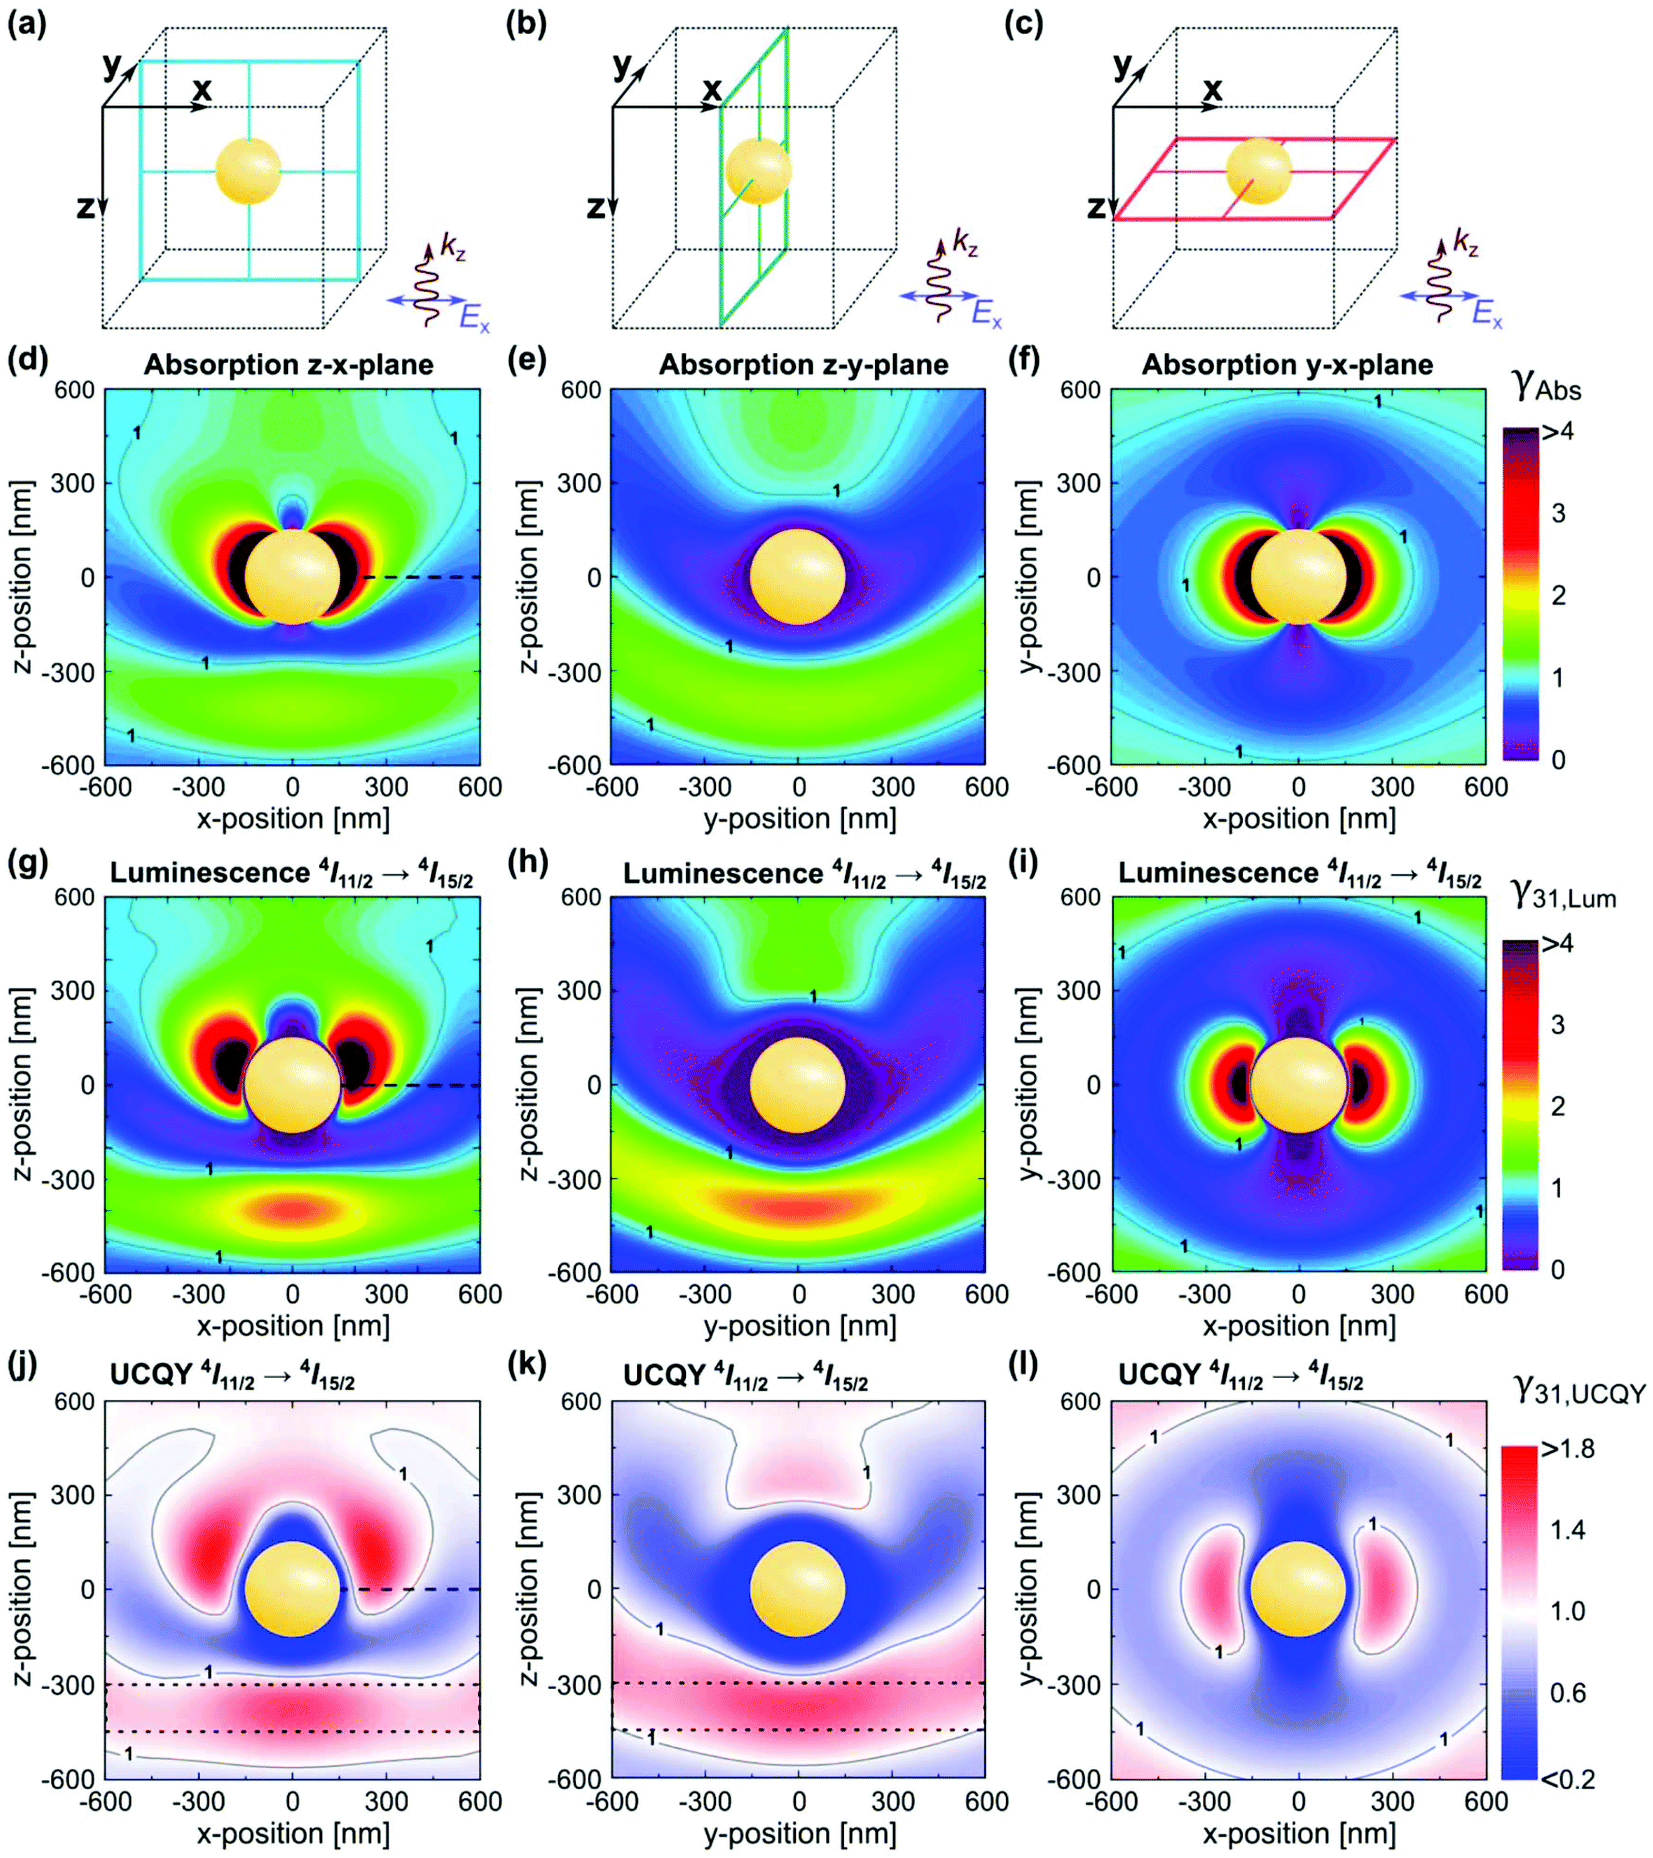 | ||
| Fig. 6 (a–c) Illustration of a spherical gold NP with a diameter of 300 nm in the center of the cubic simulation volume. (d–f) Local absorption change factor γAbs in the planes indicated in (a–c) under an excitation wavelength of 1523 nm. Enhancement factors of luminescence, γ31,Lum (g–i), and UCQY, γ31,UCQY (j–l), for the Er3+ 4I11/2 → 4I15/2 transition at 980 nm. Results determined for an incident irradiance of 0.1 W cm−2. The dotted lines in (j) and (k) frame a large volume where significant UCQY enhancement can be achieved with moderate requirements on polarization of the excitation and positioning of the UC material. This figure has been reproduced from ref. 56 with permission from OSA Publishing. | ||
A recent paper highlights the importance of rationally designing plasmon-enhanced UCNP systems, where a record enhancement factor of ∼1200 has been obtained by using a metal–insulator–metal (MIM) structure.58 After optimization of the MIM dimension for the maximization of the resonances at 980 nm, the influence of the MIM dimension on the UCL of β-NaYF4:18% Yb3+,2% Er3+ UCNPs has been studied in detail, as reported in Fig. 7. The green UCL has been significantly enhanced by varying the MIM dimension, as shown in Fig. 7a. Fig. 7b proves that the main cause for such an impressive increase in the UCL is the improved absorption cross-section derived from the plasmonic MIM structures as a function of their dimension. Although there is not a significant influence of the number of photons involved in the UC process between the UCNPs and the MIM structures (Fig. 7c), the significance of the achieved improvement is a clear proof of the effect of LSPR on the UCL, in particular under low excitation power density (Fig. 7d).
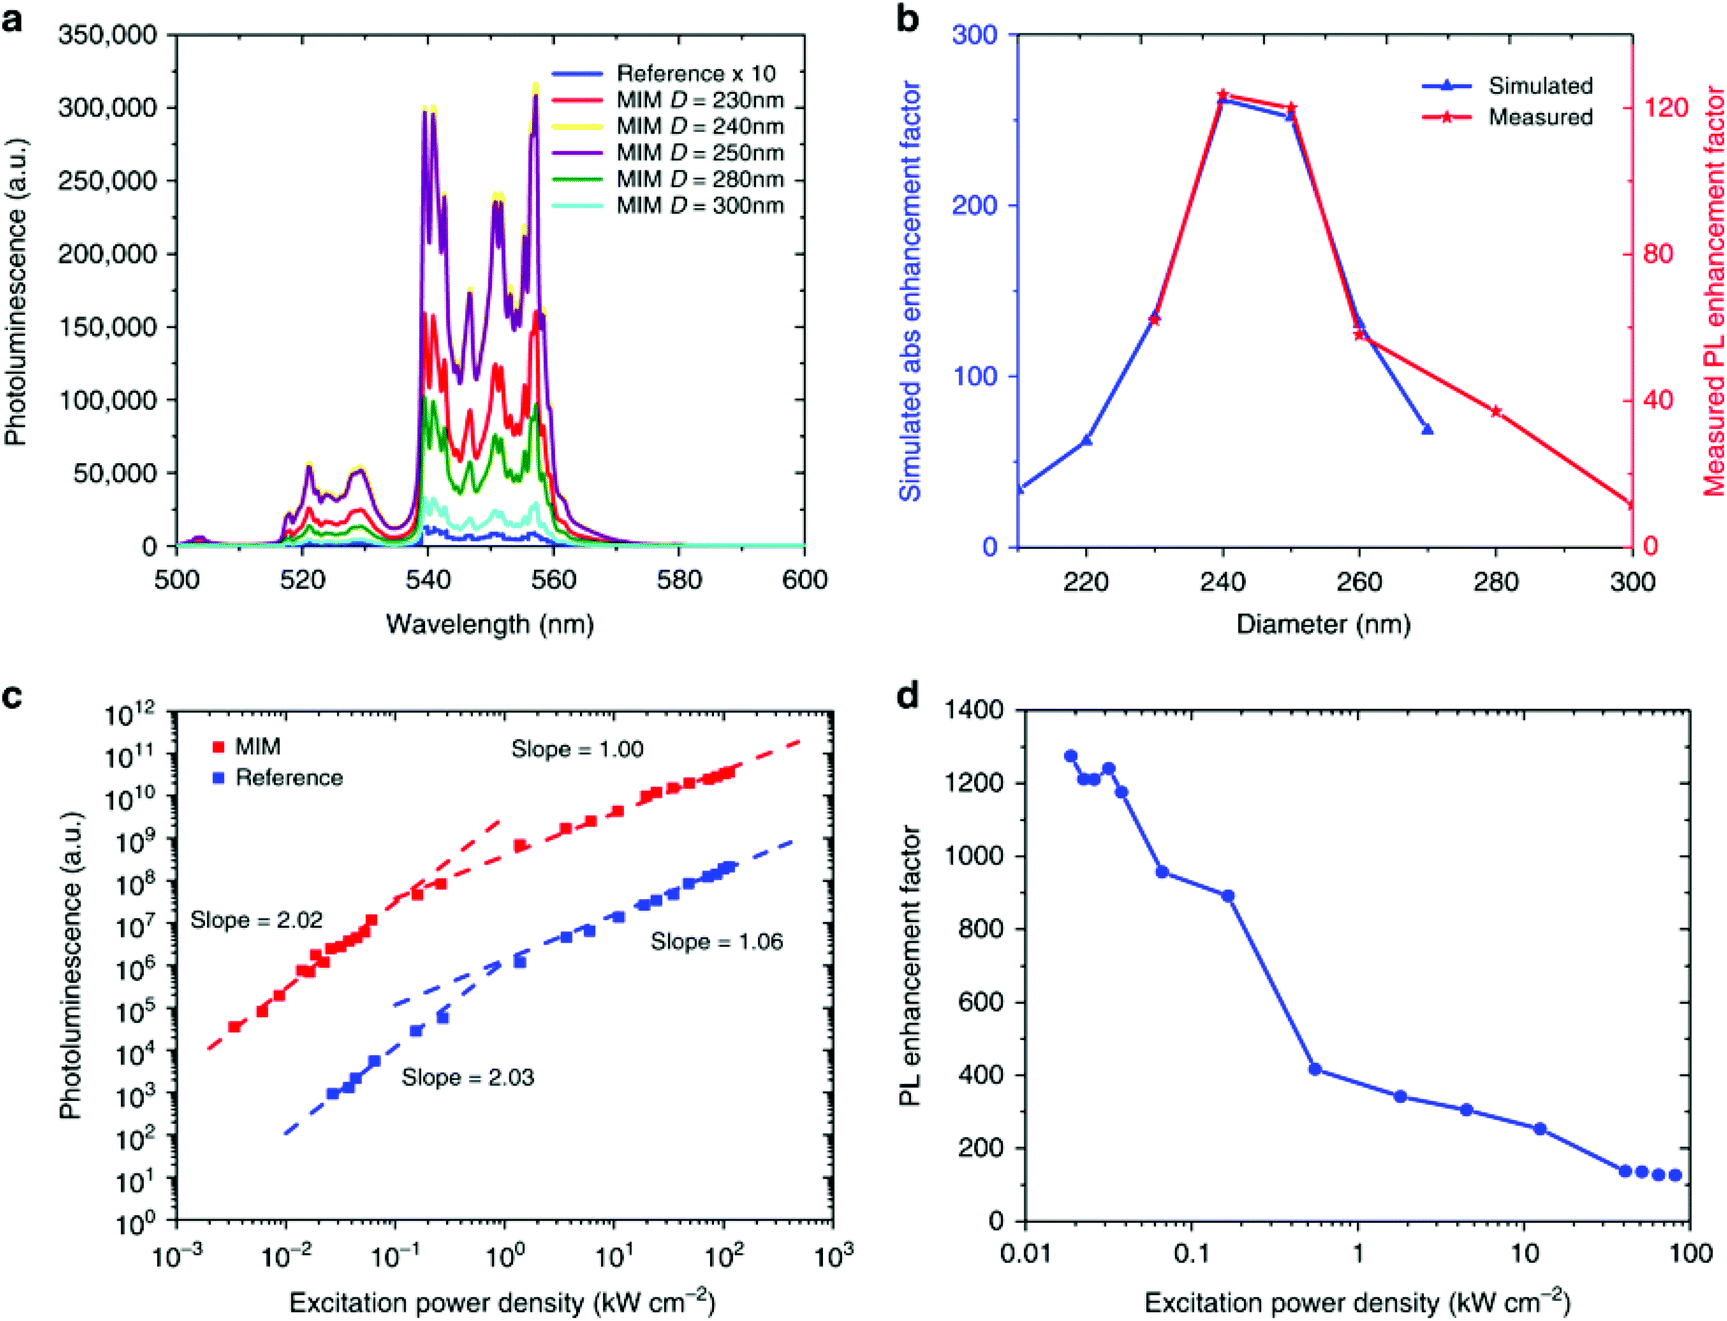 | ||
| Fig. 7 (a) Photoluminescence (PL) of the Er3+ 2H11/2, 4S3/2 → 4I15/2 emissions from β-NaYF4:18% Yb3+,2% Er3+ UCNPs in a metal–insulator–metal (MIM) structure varying diameter of the MIM under 980 nm excitation. The reference sample emission is magnified by 10. (b) Simulated enhancement factor for the absorption (blue curve) and measured PL enhancement (red curve) for MIM structures of various diameters. (c) UCL intensity as a function of power density for 250 nm diameter MIM sample and the reference sample. (d) PL enhancement for 250 nm MIM as a function of power density. This figure has been reproduced from ref. 58 with permission from Nature Publishing Group. | ||
Dielectric nanostructures can also support strong optical resonances and impact absorption, as recently demonstrated with a silicon nanorod array.59 In general, plasmonic nanostructures tend to produce higher local field and thus higher absorption enhancement than dielectric nanostructures. However, dielectric nanostructures usually exhibit much less luminescence quenching than plasmonic nanostructures. Negotiating this trade-off is an on-going effort in UC research.
Energy transfer (ET) is another critical step in UC. Being an extremely short-range interaction, ET is efficient only when the density of dopant ions is sufficiently high to shorten the inter-ionic distance. However, most rare earth ions exhibit severe concentration quenching of the emissions in the visible region at high concentrations, as already discussed. It is possible to further enhance ET rate by using plasmonic nanostructures, as recently proved by the enhancement in UCL from β-NaYF4:Yb3+,Er3+ by a plasmonic nanostructure.60 However, a theoretical study showed that enhancement of ET rate occurs mainly for distant ion pairs and over a narrow frequency range.48 Thus, the enhanced ET tends to make a smaller contributions to the overall enhancement of UC than absorption enhancement. Finally, emission can be enhanced by the well-known Purcell effect. There is a wealth of literature on this topic to which the readers are referred to.49,61,62
3.2. Dye-sensitization in upconversion luminescence
Lanthanides have relatively low absorption cross-sections σ compared to organic dyes. Among the lanthanide ions, Yb3+ has one of the highest σ (10−20 cm2), which is about 1000 times lower than the organic dye IR-806. The enhancement of σ via the so-called “antenna effect” involves organic dyes coupled to the surface of UCNPs. The dyes act as energy transducers, absorbing large amounts of photons and transferring them to the lanthanide ions via ET mechanisms from their singlet and triplet excited states, see Fig. 8.63 The singlet state of the dye can transfer energy directly to a lanthanide ion in a Förster-type process, or the dye can undergo intersystem crossing (ISC) from the singlet to the triplet state, and energy transfer can occur from the triplet state to the lanthanide ion. The probability of energy transfer from either the singlet or triplet states is dependent on the resonance of the levels with the lanthanides, as well as with the kinetics of intersystem crossing in the dye.62 Thus, when determining energy transfer efficiency between the dye and the nanoparticle, the ISC kinetics and the energies of the singlet and triplet states must be well-characterized.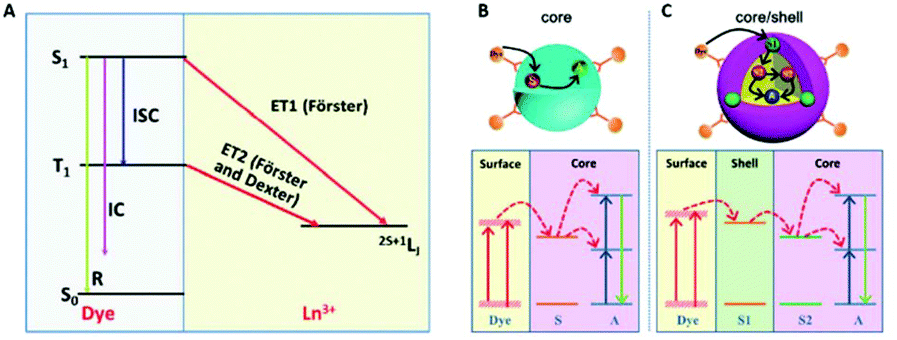 | ||
| Fig. 8 (A) Schematic illustration of non-radiative ET processes from a dye to an Ln3+ ion. R, IC, ISC are the luminescence radiation, internal conversion and inter-system crossing, respectively; dye sensitized UC in (B) a core structure (S and A are the sensitizer and activator ions, respectively) and (C) a core–shell structure (S1 and S2 are sensitizer ions in the shell and core, respectively). This figure has been reproduced from ref. 63 with permission from RSC. | ||
The IR-806 dye has been used to dramatically enhance the luminescence of UCNPs by a factor of 3300 through ET to Yb3+.64,65 This prompted researchers to develop highly efficient dye-UCNP systems by exploiting greater overlap between the IR-806 dye and UCNP by utilizing Nd3+ ions which absorb 800 nm light.66 Also, indocyanine green dye has been proven to act as an efficient energy transducer to both Yb3+ and Nd3+ simultaneously, resulting in highly efficient ET from the dyes to the sensitizer ions.67 To better understand why IR-806 efficiently sensitizes Yb3+, Garfield et al. used DFT calculations coupled with experimental evidence to demonstrate that an intermediate triplet state is responsible for the efficient coupling of the dye and sensitizer ion (Fig. 9).64 They determined that ISC from the singlet to the triplet state of the antenna molecule is enhanced by spin–orbit coupling of lanthanides at the surface of UCNPs. This enhancement of the triplet state plays a critical role in increasing ET efficiency between the dye and Yb3+ ions to produce such an improvement in the UC emissions. They also demonstrated that an increase in concentration of heavy lanthanide ions (in their case, Gd3+) within the UCNP could shift the dye from its singlet to its triplet state due to the heavy atom effect, where ISC is proportional to the effective atomic number (Zeff) of the material. Further studies are required to facilitate the design of dye-UCNP systems with highly efficient luminescence. Despite the obvious advantages of utilizing a high-absorption coefficient molecule to gather energy, the sensitivity of organic molecules with respect to photodegradation represents a major obstacle to their prolonged use. Moreover, dissociation of the dye from the UCNP surface when it is electrostatically attached could result in decreased efficiency over time as the dye diffuses away. The efficiency of these systems is also strongly affected by the concentration of dye on the surface of the UCNPs, as the dyes can interact and self-quench through non-radiative relaxation. Further studies are required to facilitate the design of dye-UCNP systems with highly efficient luminescence that can withstand extended durations of irradiation.
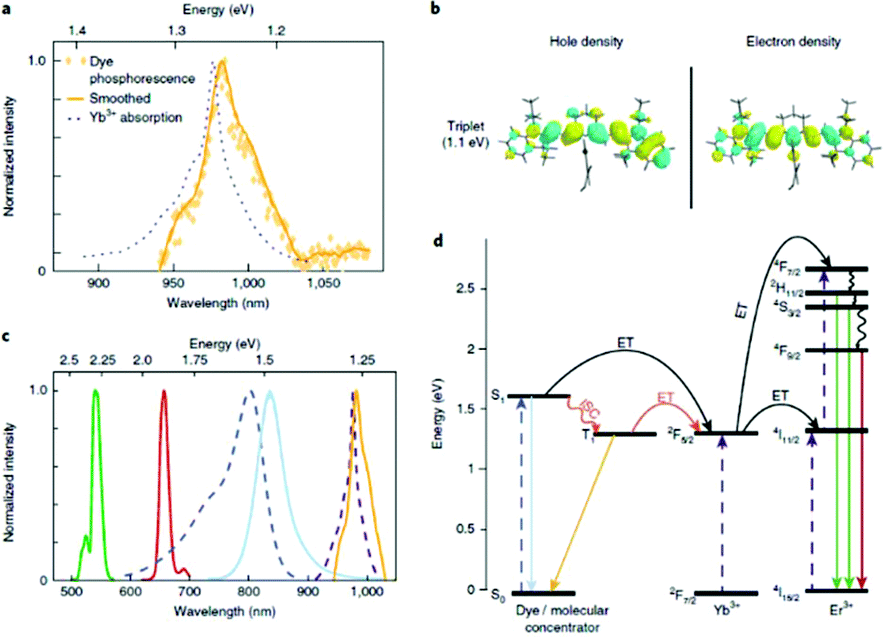 | ||
| Fig. 9 Time gated photoluminescence as evidence of resonant triplet states. (a) Time-gated triplet phosphorescence spectrum of IR-806 in NaGdF4 NPs at 80 K (no Yb3+ or Er3+ present), overlapping with the NIR portion of the UCNP absorption spectrum (at room temperature). (b) Electronic density of the natural transition orbital (NTO) and of the hole and the NTO of the electron for the first excited triplet state of IR-806, calculated using TD-DFT. (c) Spectra colored according to the transitions in (d). From left to right: Er3+ emission (green and red curves), IR-806 absorption (dashed blue curves), IR-806 fluorescence (solid light blue curve), UCNP absorption (dashed purple curves), IR-806 phosphorescence (yellow curve). (d) Jablonski diagram of proposed ET mechanisms, showing dye ISC to the triplet state T1 before transfer to the UCNPs. This figure has been reproduced from ref. 64 with permission from Nature Publishing Group. | ||
3.3. Role of distortions in upconversion luminescence
Radiative emission from lanthanide ions is influenced by the symmetry and local field at the occupied lattice site. Electric dipole transitions within the 4f states of lanthanides are parity forbidden. The selection rules applying to these transitions for the trivalent free ions relax when the ion occupies a site with low symmetry.13,14 The latter allows for a mixing of the “pure” states with odd parity, i.e., J-mixing. Transitions between these new states are no longer forbidden, and thus radiative emission from them can occur. The presence of distortions and occupied sites with different symmetries in NPs further relaxes the selection rules and contributes to line broadening, which is paramount for better spectroscopic matching between the sensitizing and emitting ions involved in the ETU mechanism.Moreover, distortions of lattice sites within the nanocrystals can alter the local-field and modify the ET efficiency and emission characteristics of dopant ions. In particular, line broadening originating from inducing controlled distortions in the crystal structure can efficiently promote a better spectroscopic overlap in UCNPs. A lower-order symmetry of the occupied site can also induce further J-mixing, with beneficial effects on the probability of the electric-dipole transitions to occur.
Based on such double enhancement effect, doping of UCNPs with ions other than the host and luminescent ones produces an improvement of the overall UCL. Li+ ions have been initially used to substitute Na+ ions in UCNP hosts.68–71 Several studies reported differences in the luminescence response and NPs morphology by varying the concentration of Li+ ions. Similar experiments have been performed using K+ ions to substitute for Na+.72 According to Goldschmidt's rules describing ionic substitution in a crystal lattice, the replaced ion and the substituent must have similar charge and ionic radius. Li+, Na+, and K+ differ significantly in terms of ionic radii with the same coordination number.73 The smaller Li+ ions can easily occupy interstitial sites, and an increase in concentration of Li+ ions does not affect the crystallinity of the sample notwithstanding the formation of distortions. In contrast, the larger K+ ions cannot efficiently occupy Na+ sites in the UCNPs lattice, and their inclusion at interstitial sites strongly compromises the crystal integrity and, therefore, does not contribute to the enhancement of luminescence. Substitution of Li+ ions is consequently preferred to achieve distortion-enhanced UCL.
Due to the similarities in the ionic radius, substitution of rare earth ions with Mn2+ at lattice sites is allowed. The use of Mn2+ to improve the red luminescence in UCNPs for biological applications has also been extensively reported. The improvements of the overall luminescence have only recently been attributed to local distortions induced by the inclusion of Mn2+ ions.74,75 ET further determines the favored emission wavelengths in β-NaYF4:Er3+,Yb3+,Mn2+ materials, depending on the relative concentration of each dopant ion.
Finally, co-substitution of different rare earth ions in the host material can also produce the desired distortion, without significantly affecting the crystallinity of the material, as in Fig. 10.76,77 Lu3+ together with Gd3+, has been used in a recent study to fine-tune the concentration and degree of the distortions in β-NaYF4:Er3+,Yb3+, yielding a 1.6-fold enhancement of the Er3+ visible UCL.72 Together with the other proposed methods, distortion-induced improvement of the UCL is a relatively new phenomenon, which deserves further investigation by varying the optically-inactive and distortion-inducing dopant ions.
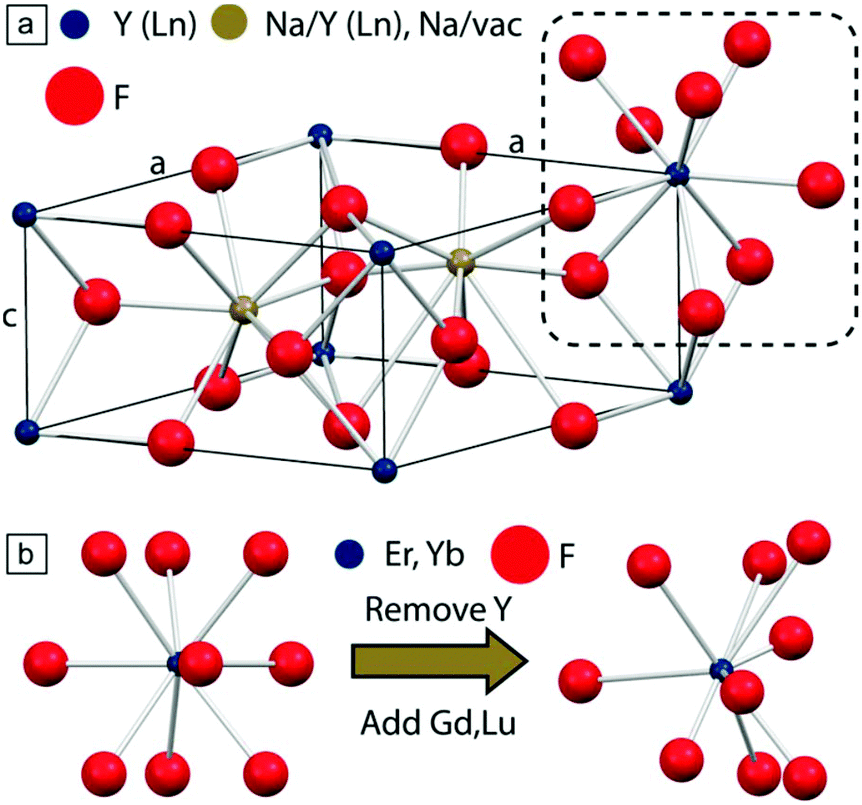 | ||
Fig. 10 (a) Unit cell of β-NaYF4; one internal site is occupied by Na+ and Y3+ (1![[thin space (1/6-em)]](https://www.rsc.org/images/entities/char_2009.gif) :1), while the second contains a Na+ ion. Y3+ and F− ions are located at the cell vertices (blue) and interstices (red), respectively. (b) Effect of co-substitution in the formation of distortion (right) on the native trigonal tricapped prismatic crystal environment (left) experienced by lanthanide ions. This figure has been reproduced from ref. 77 with permission from ACS Publications. :1), while the second contains a Na+ ion. Y3+ and F− ions are located at the cell vertices (blue) and interstices (red), respectively. (b) Effect of co-substitution in the formation of distortion (right) on the native trigonal tricapped prismatic crystal environment (left) experienced by lanthanide ions. This figure has been reproduced from ref. 77 with permission from ACS Publications. | ||
4. Modeling upconversion luminescence in nanoparticles: from fitting to prediction
4.1. DFT-based calculations of surface properties
Since the 1960s,78 Density Functional Theory (DFT) has become an indispensable tool widely used for calculations of a very broad range of physical and chemical characteristics of single molecules, isolated clusters, and solids, including their structural optimization, electronic, optical, elastic and thermodynamic properties. It also allows to treat various defects, such as vacancies, substituted or interstitial atoms, and see their effects on the above-mentioned properties. For any periodic or aperiodic structure its surface (or the termination, or the boundary with another phase/surrounding atmosphere) can be considered as a defect itself, that plays a paramount role in formation of chemical activity of a considered substance. The most important phenomena related to the surface properties fall into two categories, briefly described below.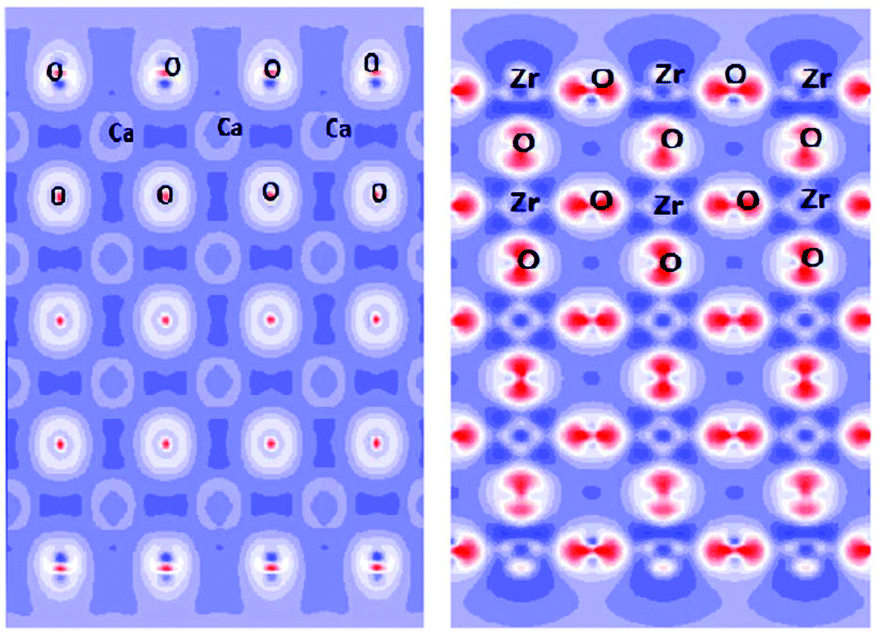 | ||
| Fig. 11 Cross-sections of the electron density distribution in cubic CaZrO3 for the ZrO2 termination. Unused Zr and O chemical bonds in the top-most layers are seen. This figure has been reproduced from ref. 81 with permission from Elsevier. | ||
Calculations of total energy allow us to predict which chemical species will easily get attached to the surface. Low energy of adatom absorption may serve as an indicator of the necessity of protecting the surface of a particle by coating with an additional layer – this is especially important when the nanoparticle is used for bioimaging or optical thermometry.
DFT analyses of system stability can explain the tendency of a system to evolve in a certain direction. An example can be the determination of the relative stability of the cubic and hexagonal phase of β-NaYF4 NPs,76 or of the energy of the exposed facets in the presence of a ligand. DFT calculations have provided further confirmation of the reaction mechanism of the formation of the nanoparticles, and their known transition from the cubic α-phase to the hexagonal β-phase.83 Likewise, the difference in energy of the exposed facets in presence of oleic acid or oleate explains the differences in coverage of the NPs considered by X. Liu, D. Jin et al., as shown in Fig. 12.83 Considering the coverage of the (100) facet is favored in presence of oleate, while the (001) facet will be preferential coordinated by oleic acid (see insert table in Fig. 12), varying the protonation of the ligand can alter the direction of epitaxial growth during the proposed hydrothermal synthesis, as shown in Fig. 12c. The simulations of the different energies of each facet by DFT eloquently supports the proposed mechanism for directional growth of UCNPs.
 | ||
| Fig. 12 (a) Schematic shape of β-NaYF4 nanocrystal. The hexagonal cylinder consists of the (001) facets at the ends and identical (100) and (010) facets around the cylinder sides. (b) The Y3+ arrangements and binding energies (see insert table) of OAH and OA− ligands on the most stable (001) and (100) facets. (c) SEM characterization of submicron-sized nanocrystals synthesized using the hydrothermal route by deprotonation of the OAH ligand (scale bar, 500 nm). This figure has been reproduced from ref. 83 with permission from Nature Publishing Group. | ||
The ionic distribution of dopant ions has been verified for β-NaYF4:Er3+,Yb3+ UCNPs, coupling solid-state nuclear magnetic resonance (NMR) studies and DFT calculations.84 For the UCNPs studied a random distribution of ions was proposed to fit the experimental data.84 The proposed method is particularly interesting in view of experimental evidence of non-random distribution of dopant ions reported for other systems. Together with other spectroscopic techniques, solid-state NMR can definitely provide further insights on the ion distribution in UCNPs.
Another topic which has often led to contradictory results in the literature is the assignment of the space group for the β-NaYF4 lattice. Although the P![[6 with combining macron]](https://www.rsc.org/images/entities/char_0036_0304.gif) crystal structure has been largely reported in the literature for this host material and the other lanthanide ternary compounds, some experimental evidences suggest that the P63/m structure is the best fit to diffuse X-ray scattering and single-crystal absorption spectroscopy data for the β-NaYF4 lattice.85 Recently, DFT analyses of β-NaYF4 have confirmed the P63/m space group is the most likely structure to resemble the provided experimental results.86 Further experiments are required to ultimately corroborate such results, due to the similarities of the P and P63/m structures.
crystal structure has been largely reported in the literature for this host material and the other lanthanide ternary compounds, some experimental evidences suggest that the P63/m structure is the best fit to diffuse X-ray scattering and single-crystal absorption spectroscopy data for the β-NaYF4 lattice.85 Recently, DFT analyses of β-NaYF4 have confirmed the P63/m space group is the most likely structure to resemble the provided experimental results.86 Further experiments are required to ultimately corroborate such results, due to the similarities of the P and P63/m structures.
Recently, the electronic structure of intrinsic and surface defect states in UCNPs was resolved by DFT analyses.87 The authors propose a new approach to boost energy storage via these defect states, i.e. intrinsic surface-related nanophotonic energy storage. This study represents the very first example of surface characterization of ternary lanthanide fluoride NPs using DFT calculations.
These seminal studies confirm the necessity to further investigate the surface of UCNPs through DFT analyses to fully understand the relation between particle stability, ionic distribution, surface defects, ligand coverage and UCL.
4.2. Rate equation models
Rate equations are particularly useful to model the dynamics of complex systems. They have been largely employed in the study of luminescent mechanisms, yielding new insights of the specific paths of the population and depopulation of energy states in lanthanide ions. For simplicity, we consider a three-level system, where the population of the higher energy state occurs by back-to-back photon absorption, i.e. ground state absorption (GSA) followed by excited state absorption (ESA). The intermediate and high energy states can be depopulated by both radiative and non-radiative mechanisms. The radiative processes can be described in terms of emission probabilities as branching ratios, according to the Judd–Ofelt theory.88 The probabilities of non-radiative processes are more complex to calculate, due to the strong dependency of non-radiative phenomena on the ion-ion distances. Among the non-radiative pathways responsible for the excited state depopulation, we can consider multiphonon relaxation, cross-relaxation (CR) or ET in the presence of different ions or molecules, and energy migration.13,14Radiative and non-radiative depopulation pathways of an energy level are competitive processes, occurring simultaneously after excitation of a higher energy state. The rate of multiphonon relaxation depends on the energy difference between the energy states, i.e. the energy gap law.89 The proximity of the ion to impurities or functional groups from ligands or solvents can contribute to depopulation of the level after ET from the ion to resonant vibrational modes, followed by multiphonon relaxation.
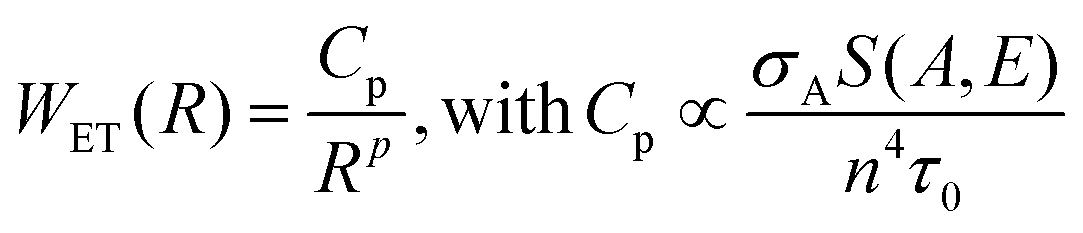
We can consider now a two-ion system to determine the non-radiative ET and CR rates, i.e. a donor–acceptor system, taking into account the higher efficiency of ETU over ESA with Yb3+-sensitization. The donor probability to transfer its energy to the acceptor has to be proportional to the decay time of the donor level. Thus, the longer the lifetime of the emission, the higher the probability of interaction with the acceptor. Also, the absorption cross-section of the acceptor is directly proportional to the ET rate. In addition, the spectral overlap between the donor and acceptor transition must also be taken into account. The non-linear dependency of the ET rate with the inverse of the donor–acceptor distance illustrates the strong influence of the ion concentration on non-radiative ET processes. In summary, the rate for a FRET process for a certain donor–acceptor distance, R, can be expressed in eqn (2) as:90,91
 | (2) |
Finally, the rate of energy migration has also to be included in the rate term for energy transfer. Although it is often considered as infinite for simplification, a finite energy migration rate is more realistic and accurate. Several models have been proposed to take into account the influence of energy migration on the luminescence mechanism, as provided in the literature.92–97
We can now consider the application of the mathematical description of each process to build a system of rate equations. Each individual level of a dopant ion can be described by a single differential equation, including each process populating and depopulating the considered energy state. It appears obvious that the number of the processes to be included in the model and the number of experimental data to fit have to be carefully balanced, to avoid over-parameterization of the system of rate equations. In practice, the number of free parameters has to be significantly smaller than the number of series of experimental data.
The rate of a certain transition is commonly determined in terms of a macroscopic variable, which averages the mean properties and ionic distances of the luminescent material. In practice, an average value of the ET rate, 〈WET(R)〉, is usually considered. Villanueva-Delgado et al. proposed a microscopic approach that takes into account the actual inter-atomic distances in the lattice and calculates the mean ET rate as the average of the rates of each ion within a crystal and not as the rate at an average distance.98,99 This model provides the best fit of experimental decay curves for bulk β-NaYF4:Yb3+,Tm3+ and β-NaYF4:Tm3+.98,99 More importantly, the number of fitting parameters was significantly reduced, with the transition rates directly calculated once the lattice and random ion distribution is assigned.
Recently, Meijerink's group applied the same microscopic rate equation model to the study of UCL in NPs.20 Apart from simulating the dynamics of UCL, they experimentally studied the effect of surface quenching via FRET to solvent molecules and the influence of the refractive index of the media. They provided a route to resolve the solvent quenching mechanisms of the visible UCL of β-NaYF4:Yb3+,Er3+ NPs.20 Quenching of the NIR emissions cannot be explained by the model, due to the influence of defects, which was not included in the model, as reported by the authors.100 We consider these results of extreme importance for the development of tools to predict the UCL dynamics in UCNPs, taking into consideration the actual ionic distributions within the particles and at their interface.
The resolution of rate equations has provided new insights in the UCL mechanism at the nanoscale, as discussed in the previous sessions. The quantification of quenching from solvent/ligand and defects, as well as the extent of energy migration has been obtained by rate equation models. As reported by Berry et al., the ET process involving the active ions for the UC and ligand or solvent molecules is a FRET process, and it was possible to verify the extent of such a process in core–shell structures, see Fig. 13.101 Their model further provides a robust fit for quenching of the NIR emission in the NPs under investigation.
 | ||
| Fig. 13 (a) Energy level diagram illustrating the most important processes relevant to the luminescence properties of β-NaYF4:Yb3+,Er3+ based on our analysis of microcrystalline powder samples. The NIR-to-visible (red, green, and blue) UC mechanisms involve absorbance of excitation light by Yb3+ followed by consecutive Yb3+ → Er3+ ET, resulting ultimately in the population of the Er3+ emitting states. Yb3+ ↔ Er3+ ET are indicated by solid lines labeled with the rate constants kETx–y, where x and y label the initial and final Er3+ states, respectively. Blue solid lines indicate Yb3+ → Er3+ forward ET, whereas red solid lines indicate Yb3+ ← Er3+ back ET. Radiative processes are indicated by dashed arrows, multiphonon relaxation by squiggly arrows, and cross-relaxation by paired dotted arrows. (b) Schematic depiction of the nanoeffect in β-NaYF4:Yb3+,Er3+. Rapid energy migration at the 1 μm energy-level leads to equilibration between interior and surface sites, such that Er3+(4I11/2) and Yb3+(2F5/2) states exhibit enhanced multiphonon relaxation, labeled as kNR3 and kYb_NR, respectively. The rate-equations model for micron-sized powders is adapted to the nanoscale materials analyzed here by the modification of the three rate constants, kNR2, kNR3, and kYb_NR, describing multiphonon relaxation from the three NIR states, Er3+ (4I13/2), Er3+ (4I11/2), and Yb3+(2F5/2), respectively. (c) Comparison of the luminescence spectra of the core, core–shell, and powder samples generated by pulsed NIR excitation (950 nm; 240 mJ per cm2 per pulse). The emission spectra have been normalized to the 1 μm peak. Visible UC features of the spectra have been magnified by 10× relative to the NIR peaks. This figure has been adapted from ref. 101 with permission from ACS Publications. | ||
A recent article underlines the necessity to treat the UCNPs as a complex system.102 In the article the authors commented on the impossibility to assign the power dependency of decay times in UCNPs to an intrinsic mechanism of the single ion. Taking into account a “collective dynamics” of the system, they suggested that the inverse of the decay time of a certain level is dependent on the “excitation history” of the NPs, meaning that the measured lifetime cannot be considered as the intrinsic lifetime of the state. The inverse of the lifetime has to be the difference between population and depopulation rates of the level with respect to the various phenomena occurring in the whole system.
Finally, coupling of Mie's theory with rate equation models was used to derive the enhancement factors of UCL by plasmon resonance, as described in section 2.1. Further developments of the proposed models could lead to a new understanding of the nature of the defects and the luminescence quenching pathways in UNCPs.
5. Conclusions
Although a full characterization of UCNPs from the perspective of ionic distribution and surface states is not still provided in the literature, an improved understanding of the phenomena governing the UC mechanisms at the nanoscale has been achieved in recent years. Future improvements of the currently acquired quantum yields of UC nanomaterials relies on improving the comprehension of the quenching and luminescence mechanisms. It has been determined that UC luminescence can be enhanced in UCNPs by limiting energy migration to surface defective states, and by the growth of an inert shell with sufficient thickness. Limiting the concentration of defects in the nanoparticles can be obtained by using syntheses in strictly anhydrous conditions. Furthermore, the use of plasmonic structures and dyes represents a reliable approach to enhance the UCL in lanthanide-doped NPs by increasing their absorption capacities.Simulating UCL by DFT calculations poses serious challenges with significant limitations, due to the large number of heavy atoms involved, resulting in extensive time requirements to run a simulation. A recently proposed microscopic rate equation model appears to be an appealing alternative to DFT analyses. We believe that a route to predict UCL efficiencies in NPs should involve the coupling of this model with further experimental data of the defects and ionic distribution within the particle and at the particle surface and interface with the environment.
The field of upconversion nanomaterials has largely focused on the applications of these materials. While these applications have been highly informative in demonstrating the potential that these materials have, the need for more fundamental studies of their properties remains, in order to help bring about their successful translation to use. The insights highlighted in this review serve to illustrate the progress being made in the field currently, in the hopes that they will inspire the scientific community to devote more attention to understanding the underlying properties of these interesting materials.
Conflicts of interest
There are no conflicts to declare.Acknowledgements
J. A. C. is a Concordia University Research Chair in Nanoscience and is grateful to Concordia University for financial support. J. A. C. is grateful to the Natural Science and Engineering Research Council (NSERC) of Canada for the sustained support of his research. G. T. is grateful to Concordia University for financial support from the Horizon Post-Doctoral Program. G. A. M. is grateful for the Concordia Merit Scholarship and NSERC graduate scholarship for financial support. M. G. B. thanks the supports from the National Recruitment Program of High-end Foreign Experts (Grant No. GDT20185200479 and GDW20145200225), the Programme for the Foreign Experts (Grant No. W2017011) and Wenfeng High-end Talents Project (Grant No. W2016-01) offered by Chongqing University of Posts and Telecommunications (CQUPT), Estonian Research Council grant PUT PRG111, and European Regional Development Fund (TK141). W. P. acknowledges the National Science Foundation MRSEC: Soft Materials Research Center (DMR-1420736) and the Colorado Office of Economic Development & International Trade (CTGG1 2017-0609) for the support.Notes and references
- C. Dong, J. Pichaandi, T. Regier and F. C. J. M. van Veggel, Nanoscale, 2011, 3, 3376–3384 RSC.
- C. Dong, J. Pichaandi, T. Regier and F. C. J. M. van Veggel, J. Phys. Chem. C, 2011, 115, 15950–15958 CrossRef CAS.
- S. Dühnen, T. Rinkel and M. Haase, Chem. Mater., 2015, 27, 4033–4039 CrossRef.
- D. Hudry, D. Busko, R. Popescu, D. Gerthsen, A. M. M. Abeykoon, C. Kübel, T. Bergfeldt and B. S. Richards, Chem. Mater., 2017, 29, 9238–9246 CrossRef CAS.
- J. F. L. Duval and H. P. van Leeuwen, J. Phys. Chem. A, 2012, 116, 6443–6451 CrossRef CAS.
- C. Dong and F. C. J. M. van Veggel, ACS Nano, 2009, 3, 123–130 CrossRef CAS PubMed.
- D. V. Talapin, A. L. Rogach, E. V. Shevchenko, A. Kornowski, M. Haase and H. Weller, J. Am. Chem. Soc., 2002, 124, 5782–5790 CrossRef CAS PubMed.
- D. V. Talapin, A. L. Rogach, M. Haase and H. Weller, J. Phys. Chem. B, 2001, 105, 12278–12285 CrossRef CAS.
- M. Haase and H. Schäfer, Angew. Chem., Int. Ed., 2011, 50, 5808–5829 CrossRef CAS PubMed.
- R. Naccache, Q. Yu and J. A. Capobianco, Adv. Opt. Mater., 2015, 3, 482–509 CrossRef CAS.
- F. Wang, J. Wang and X. Liu, Angew. Chem., Int. Ed., 2010, 49, 7456–7460 CrossRef CAS PubMed.
- D. Tu, Y. Liu, H. Zhu, R. Li, L. Liu and X. Chen, Angew. Chem., 2013, 125, 1166–1171 CrossRef.
- G. Liu, Chem. Soc. Rev., 2015, 44, 1635–1652 RSC.
- F. Auzel, Chem. Rev., 2004, 104, 139–174 CrossRef CAS PubMed.
- N. Menyuk, K. Dwight and J. W. Pierce, Appl. Phys. Lett., 1972, 21, 159–161 CrossRef CAS.
- K. W. Krämer, D. Biner, G. Frei, H. U. Güdel, M. P. Hehlen and S. R. Lüthi, Chem. Mater., 2004, 16, 1244–1251 CrossRef.
- H. Y. T. Kano and Y. Otomo, J. Electrochem. Soc., 1972, 119, 1561–1564 CrossRef.
- G. Chen, H. Qiu, P. N. Prasad and X. Chen, Chem. Rev., 2014, 114, 5161–5214 CrossRef CAS PubMed.
- S. Fischer, N. D. Bronstein, J. K. Swabeck, E. M. Chan and A. P. Alivisatos, Nano Lett., 2016, 16, 7241–7247 CrossRef CAS PubMed.
- F. T. Rabouw, P. T. Prins, P. Villanueva-Delgado, M. Castelijns, R. G. Geitenbeek and A. Meijerink, ACS Nano, 2018, 12, 4812–4823 CrossRef CAS PubMed.
- L. Cademartiri and G. A. Ozin, Concepts of Nanochemistry, WILEY-VCH Verlag GmbH & Co. KGaA, Weinheim, 2009 Search PubMed.
- J. J. H. A. van Hest, G. A. Blab, H. C. Gerritsen, C. de Mello Donega and A. Meijerink, J. Phys. Chem. C, 2017, 121, 19373–19382 CrossRef CAS PubMed.
- J.-C. Boyer and F. C. J. M. van Veggel, Nanoscale, 2010, 2, 1417–1419 RSC.
- C. Würth, S. Fischer, B. Grauel, A. P. Alivisatos and U. Resch-Genger, J. Am. Chem. Soc., 2018, 140, 4922–4928 CrossRef PubMed.
- S. Fischer, N. J. J. Johnson, J. Pichaandi, J. C. Goldschmidt and F. C. J. M. van Veggel, J. Appl. Phys., 2015, 118, 193105 CrossRef.
- M. Kraft, C. Würth, V. Muhr, T. Hirsch and U. Resch-Genger, Nano Res., 2018, 11, 6360–6374 CrossRef CAS.
- J. Zhao, Z. Lu, Y. Yin, C. McRae, J. A. Piper, J. M. Dawes, D. Jin and E. M. Goldys, Nanoscale, 2013, 5, 944–952 RSC.
- F. Vetrone, J. C. Boyer, J. A. Capobianco, A. Speghini and M. Bettinelli, J. Phys. Chem. B, 2003, 107, 1107–1112 CrossRef CAS.
- M. T. Berry and P. S. May, J. Phys. Chem. A, 2015, 119, 9805–9811 CrossRef CAS PubMed.
- I. Hyppänen, N. Höysniemi, R. Arppe, M. Schäferling and T. Soukka, J. Phys. Chem. C, 2017, 121, 6924–6929 CrossRef.
- J. Shan, M. Uddi, R. Wei, N. Yao and Y. Ju, J. Phys. Chem. C, 2010, 114, 2452–2461 CrossRef CAS.
- R. Arppe, I. Hyppänen, N. Perälä, R. Peltomaa, M. Kaiser, C. Würth, S. Christ, U. Resch-Genger, M. Schäferling and T. Soukka, Nanoscale, 2015, 7, 11746–11757 RSC.
- C. Würth, M. Kaiser, S. Wilhelm, B. Grauel, T. Hirsch and U. Resch-Genger, Nanoscale, 2017, 9, 4283–4294 RSC.
- D. Toptygin, J. Fluoresc., 2003, 13, 201–219 CrossRef CAS.
- C. K. Duan and M. F. Reid, Spectrosc. Lett., 2007, 40, 237–246 CrossRef CAS.
- K. K. Pukhov, T. T. Basiev and Y. V. Orlovskii, JETP Lett., 2009, 88, 12 CrossRef.
- D. Yuan, M. C. Tan, R. E. Riman and G. M. Chow, J. Phys. Chem. C, 2013, 117, 13297–13304 CrossRef CAS.
- Z. Wang and A. Meijerink, J. Phys. Chem. C, 2018, 122, 26298–26306 CrossRef CAS PubMed.
- N. J. J. Johnson, S. He, S. Diao, E. M. Chan, H. Dai and A. Almutairi, J. Am. Chem. Soc., 2017, 139, 3275–3282 CrossRef CAS PubMed.
- S. Dühnen and M. Haase, Chem. Mater., 2015, 27, 8375–8386 CrossRef.
- B. Chen, D. Peng, X. Chen, X. Qiao, X. Fan and F. Wang, Angew. Chem., Int. Ed., 2015, 54, 12788–12790 CrossRef CAS PubMed.
- D. Hudry, A. M. M. Abeykoon, E. Dooryhee, D. Nykypanchuk and J. H. Dickerson, Chem. Mater., 2016, 28, 8752–8763 CrossRef CAS.
- D. Hudry, D. Busko, R. Popescu, D. Gerthsen, A. M. M. Abeykoon, C. Kübel, T. Bergfeldt and B. S. Richards, Chem. Mater., 2017, 29, 9238–9246 CrossRef CAS.
- T. Sun, Y. Li, W. L. Ho, Q. Zhu, X. Chen, L. Jin, H. Zhu, B. Huang, J. Lin, B. E. Little, S. T. Chu and F. Wang, Nat. Commun., 2019, 10, 1811 CrossRef PubMed.
- S. Wen, J. Zhou, K. Zheng, A. Bednarkiewicz, X. Liu and D. Jin, Nat. Commun., 2018, 9, 2415 CrossRef PubMed.
- J. W. Goodman, Statistical Optics, Wiley, 2000 Search PubMed.
- J. F. Suyver, A. Aebischer, S. García-Revilla, P. Gerner and H. U. Güdel, Phys. Rev. B: Condens. Matter Mater. Phys., 2005, 71, 125123 CrossRef.
- D. Lu, S. K. Cho, S. Ahn, L. Brun, C. J. Summers and W. Park, ACS Nano, 2014, 8, 7780–7792 CrossRef CAS PubMed.
- W. Park, D. Lu and S. Ahn, Chem. Soc. Rev., 2015, 44, 2940–2962 RSC.
- B. Di Bartolo, Optical Interactions in Solids, World Scientific, 2010 Search PubMed.
- D. J. Gargas, E. M. Chan, A. D. Ostrowski, S. Aloni, M. V. P. Altoe, E. S. Barnard, B. Sanii, J. J. Urban, D. J. Milliron, B. E. Cohen and P. J. Schuck, Nat. Nanotechnol., 2014, 9, 300 CrossRef CAS PubMed.
- Q. Liu, Y. Zhang, C. S. Peng, T. Yang, L.-M. Joubert and S. Chu, Nat. Photonics, 2018, 12, 548–553 CrossRef CAS.
- R. H. Page, K. I. Schaffers, P. A. Waide, J. B. Tassano, S. A. Payne, W. F. Krupke and W. K. Bischel, J. Opt. Soc. Am. B, 1998, 15, 996–1008 CrossRef CAS.
- P. Bharadwaj, B. Deutsch and L. Novotny, Adv. Opt. Photonics, 2009, 1, 438–483 CrossRef.
- A. I. Kuznetsov, A. E. Miroshnichenko, M. L. Brongersma, Y. S. Kivshar and B. Luk'yanchuk, Science, 2016, 354, aag2472 CrossRef PubMed.
- S. Fischer, D. Kumar, F. Hallermann, G. von Plessen and J. C. Goldschmidt, Opt. Express, 2016, 24, A460–A475 CrossRef CAS PubMed.
- S. Fischer, F. Hallermann, T. Eichelkraut, G. von Plessen, K. W. Krämer, D. Biner, H. Steinkemper, M. Hermle and J. C. Goldschmidt, Opt. Express, 2012, 20, 271–282 CrossRef CAS PubMed.
- A. Das, C. Mao, S. Cho, K. Kim and W. Park, Nat. Commun., 2018, 9, 4828 CrossRef PubMed.
- C. Gong, W. Liu, N. He, H. Dong, Y. Jin and S. He, Nanoscale, 2019, 11, 1856–1862 RSC.
- D. Lu, C. Mao, S. K. Cho, S. Ahn and W. Park, Sci. Rep., 2016, 6, 18894 CrossRef CAS PubMed.
- K. J. Russell, T.-L. Liu, S. Cui and E. L. Hu, Nat. Photonics, 2012, 6, 459 CrossRef CAS.
- G. M. Akselrod, C. Argyropoulos, T. B. Hoang, C. Ciracì, C. Fang, J. Huang, D. R. Smith and M. H. Mikkelsen, Nat. Photonics, 2014, 8, 835 CrossRef CAS.
- X. Wang, R. R. Valiev, T. Y. Ohulchanskyy, H. Ågren, C. Yang and G. Chen, Chem. Soc. Rev., 2017, 46, 4150–4167 RSC.
- D. J. Garfield, N. J. Borys, S. M. Hamed, N. A. Torquato, C. A. Tajon, B. Tian, B. Shevitski, E. S. Barnard, Y. D. Suh, S. Aloni, J. B. Neaton, E. M. Chan, B. E. Cohen and P. J. Schuck, Nat. Photonics, 2018, 12, 402–407 CrossRef CAS.
- W. Zou, C. Visser, J. A. Maduro, M. S. Pshenichnikov and J. C. Hummelen, Nat. Photonics, 2012, 6, 560 CrossRef CAS.
- G. Chen, J. Damasco, H. Qiu, W. Shao, T. Y. Ohulchanskyy, R. R. Valiev, X. Wu, G. Han, Y. Wang, C. Yang, H. Ågren and P. N. Prasad, Nano Lett., 2015, 15, 7400–7407 CrossRef CAS PubMed.
- G. Chen, W. Shao, R. R. Valiev, T. Y. Ohulchanskyy, G. S. He, H. Ågren and P. N. Prasad, Adv. Opt. Mater., 2016, 4, 1760–1766 CrossRef CAS.
- Q. Cheng, J. Sui and W. Cai, Nanoscale, 2012, 4, 779–784 RSC.
- S. Fan, G. Gao, S. Sun, S. Fan, H. Sun and L. Hu, J. Mater. Chem. C, 2018, 6, 5453–5461 RSC.
- M. Ding, Y. Ni, Y. Song, X. Liu, T. Cui, D. Chen, Z. Ji, F. Xu, C. Lu and Z. Xu, J. Alloys Compd., 2015, 623, 42–48 CrossRef CAS.
- H. Lin, D. Xu, D. Teng, S. Yang and Y. Zhang, New J. Chem., 2015, 39, 2565–2572 RSC.
- Z. Liang, X. Wang, W. Zhu, P. Zhang, Y. Yang, C. Sun, J. Zhang, X. Wang, Z. Xu, Y. Zhao, R. Yang, S. Zhao and L. Zhou, ACS Appl. Mater. Interfaces, 2017, 9, 3497–3504 CrossRef CAS PubMed.
- R. D. Shannon, Acta Crystallogr., Sect. A: Cryst. Phys., Diffr., Theor. Gen. Crystallogr., 1976, 32, 751–767 CrossRef.
- B. Zhou, B. Xu, H. He, Z. Gu, B. Tang, Y. Ma and T. Zhai, Nanoscale, 2018, 10, 2834–2840 RSC.
- G. Tian, Z. Gu, L. Zhou, W. Yin, X. Liu, L. Yan, S. Jin, W. Ren, G. Xing, S. Li and Y. Zhao, Adv. Mater., 2012, 24, 1226–1231 CrossRef CAS PubMed.
- L. Yao, Y. Li, D. Xu, H. Lin, Y. Peng, S. Yang and Y. Zhang, New J. Chem., 2019, 43, 3848–3855 RSC.
- M. D. Wisser, S. Fischer, P. C. Maurer, N. D. Bronstein, S. Chu, A. P. Alivisatos, A. Salleo and J. A. Dionne, ACS Photonics, 2016, 3, 1523–1530 CrossRef CAS.
- W. Kohn and L. J. Sham, Phys. Rev., 1965, 140, A1133–A1138 CrossRef.
- E. Heifets, R. I. Eglitis, E. A. Kotomin, J. Maier and G. Borstel, Phys. Rev. B: Condens. Matter Mater. Phys., 2001, 64, 235417 CrossRef.
- S. Piskunov, E. A. Kotomin, E. Heifets, J. Maier, R. I. Eglitis and G. Borstel, Surf. Sci., 2005, 575, 75–88 CrossRef CAS.
- M. G. Brik, C. G. Ma and V. Krasnenko, Surf. Sci., 2013, 608, 146–153 CrossRef CAS.
- R. Eglitis, Int. J. Mod. Phys. B, 2014, 28, 1430009 CrossRef.
- D. Liu, X. Xu, Y. Du, X. Qin, Y. Zhang, C. Ma, S. Wen, W. Ren, E. M. Goldys, J. A. Piper, S. Dou, X. Liu and D. Jin, Nat. Commun., 2016, 7, 10254 CrossRef CAS PubMed.
- A. A. Arnold, V. Terskikh, Q. Y. Li, R. Naccache, I. Marcotte and J. A. Capobianco, J. Phys. Chem. C, 2013, 117, 25733–25741 CrossRef CAS.
- A. Aebischer, M. Hostettler, J. Hauser, K. Krämer, T. Weber, H. U. Güdel and H.-B. Bürgi, Angew. Chem., Int. Ed., 2006, 45, 2802–2806 CrossRef CAS PubMed.
- B. Szefczyk, R. Roszak and S. Roszak, RSC Adv., 2014, 4, 22526–22535 RSC.
- M. Sun, H. Dong, A. W. Dougherty, Q. Lu, D. Peng, W.-T. Wong, B. Huang, L.-D. Sun and C.-H. Yan, Nano Energy, 2019, 56, 473–481 CrossRef CAS.
- M. P. Hehlen, M. G. Brik and K. W. Krämer, J. Lumin., 2013, 136, 221–239 CrossRef CAS.
- M. Wermuth, T. Riedener and H. U. Güdel, Phys. Rev. B: Condens. Matter Mater. Phys., 1998, 57, 4369–4376 CrossRef CAS.
- B. Di Bartolo, Energy Transfer Processes in Condensed Matter, Springer, US, 2012 Search PubMed.
- O. L. Malta, J. Non-Cryst. Solids, 2008, 354, 4770–4776 CrossRef CAS.
- M. Inokuti and F. Hirayama, J. Chem. Phys., 1965, 43, 1978–1989 CrossRef CAS.
- M. Yokota and O. Tanimoto, J. Phys. Soc. Jpn., 1967, 22, 779–784 CrossRef CAS.
- W. J. C. Grant, Phys. Rev. B: Solid State, 1971, 4, 648–663 CrossRef.
- D. A. Zubenko, M. A. Noginov, V. A. Smirnov and I. A. Shcherbakov, Phys. Rev. B: Condens. Matter Mater. Phys., 1997, 55, 8881–8886 CrossRef CAS.
- A. I. Burshtein, Soviet JETP Phys., 1972, 35, 882–885 Search PubMed.
- M. V. Artamonova, Ch. M. Briskina, A. I. Burshtein, L. D. Zusman and A. G. Skleznev, Soviet JETP Phys., 1972, 35, 457–461 Search PubMed.
- P. Villanueva-Delgado, K. W. Krämer, R. Valiente, M. de Jong and A. Meijerink, Phys. Chem. Chem. Phys., 2016, 18, 27396–27404 RSC.
- P. Villanueva-Delgado, K. W. Krämer and R. Valiente, J. Phys. Chem. C, 2015, 119, 23648–23657 CrossRef CAS.
- F. T. Rabouw, P. T. Prins, P. Villanueva-Delgado, M. Castelijns, R. G. Geitenbeek and A. Meijerink, ACS Nano, 2018, 12, 10576–10577 CrossRef CAS PubMed.
- M. Y. Hossan, A. Hor, Q. Luu, S. J. Smith, P. S. May and M. T. Berry, J. Phys. Chem. C, 2017, 121, 16592–16606 CrossRef CAS.
- A. Teitelboim, B. Tian, D. J. Garfield, A. Fernandez-Bravo, A. C. Gotlin, P. J. Schuck, B. E. Cohen and E. M. Chan, J. Phys. Chem. C, 2019, 123, 2678–2689 CrossRef CAS.
| This journal is © The Royal Society of Chemistry 2019 |