
 Open Access Article
 This Open Access Article is licensed under a
 Creative Commons Attribution 3.0 Unported Licence
Thermal enhancement and quenching of upconversion emission in nanocrystals†
Zijun
Wang
 a,
Jeppe
Christiansen
b,
Dennie
Wezendonk
c,
Xiaobin
Xie
d,
Marijn A.
van Huis
d and
Andries
Meijerink
*a
a,
Jeppe
Christiansen
b,
Dennie
Wezendonk
c,
Xiaobin
Xie
d,
Marijn A.
van Huis
d and
Andries
Meijerink
*a
aCondensed Matter and Interfaces, Debye Institute for Nanomaterials Science, Utrecht University, Princetonplein 1, 3584 CC Utrecht, The Netherlands. E-mail: A.Meijerink@uu.nl
bDepartment of Physics and Astronomy, Aarhus University, Ny Munkegade 120, DK-8000 Aarhus C, Denmark
cInorganic Chemistry and Catalysis, Debye Institute for Nanomaterials Science, Utrecht University, Universiteitsweg 99, 3584 CG, Utrecht, The Netherlands
dSoft Condensed Matter, Debye Institute for Nanomaterials Science, Utrecht University, Princetonplein 1, 3584 CC Utrecht, The Netherlands
First published on 24th May 2019
Abstract
Photoluminescence is a powerful tool in temperature sensing. Recently, the application of upconversion (UC) nanocrystals (NCs) has shown great potential for nanothermometry due to high spatial resolution, superior accuracy, and its non-invasive nature. In addition to spectral changes upon heating, anomalous thermal enhancement of UC emission has been reported for UC NCs, but the underlying mechanism remains unclear. Here, we report on NaY(WO4)2 doped with the Er3+–Yb3+ UC couple in NCs and the bulk material, and investigate the temperature-dependent luminescence in both air and dry nitrogen. For UC NCs in air, strong thermal enhancement of UC emission is observed with good reversibility and accompanied by a lengthening of the decay time for the Er3+ UC emission and Yb3+ IR emission. In contrast, the measurements carried out on NCs in dry nitrogen demonstrate a transition from thermal enhancement in the first cycle to thermal quenching in the subsequent cycles. The thermal quenching is similar to that in bulk materials. Thermogravimetric analysis (TGA) and Fourier transform infrared (FT-IR) measurements reveal the presence of water coupled on the NC surface that evaporates upon heating up to ∼470 K but is readsorbed upon cooling. Based on these observations, we explain the anomalous thermal enhancement of UC NCs in air by quenching of the Yb3+ and Er3+ emissions via surface adsorbed water molecules. The present study highlights the importance of careful characterization of surface adsorbed molecules which is crucial for understanding the luminescence properties of NCs, and enables the exploration of UC NCs with higher quantum efficiencies.
Introduction
Temperature is an important parameter in physical and chemical processes thus measuring temperature accurately is critical. However, conventional thermometry is not always capable of detecting and mapping temperatures with high spatial resolution, e.g. in biological systems, catalysis, microelectronics and microfluidics.1 Nanothermometry based on luminescent (upconversion, UC) nanocrystals (NCs) has emerged in recent years because of important advantages, such as its non-invasive nature, high spatial resolution, and a fast response in a wide range of temperatures.2–4 The applications initially involved bio-medicine/therapy/imaging (with a typical temperature range 270–330 K), and has recently expanded to include sensing of higher temperatures, which is required for chemical reactors, microfluidics and electronics.2–4 The self-referenced technique of ratiometric thermometry5–10 based on lanthanide-doped UC NCs is especially promising, and has been investigated extensively. The use of the efficient NIR-to-visible UC makes it possible to record emission spectra with a high signal-to-noise ratio. Hence, an accurate determination of emission intensity ratios and temperature can be realized.For applications of nanothermometry, reproducibility and reversibility of performance are critical. It is challenging for NCs due to the high surface-to-volume ratio and complex surface chemistry (e.g. ligands and defects).11 Moreover, variations in optical properties can originate from minor differences in the synthesis procedure, even for seemingly identical reaction conditions (e.g. presence of water and variations in heating rate and reaction temperature). The advantage of ratiometric methods is the independence of absolute emission intensities, but generally, one ignores measurement of reversibility of emission intensities and focusses on intensity ratios.7,9 The emission intensity ratio can be described by Boltzmann statistics if the two excited states are thermally coupled, and the same temperature dependence is observed with even a continuous decrease (or increase) of the absolute luminescence intensity during cycles of heating and cooling. The examination of reversibility of absolute luminescence intensity12–14 is however important as it affects the signal-to-noise ratio which is important in determining the speed, accuracy and spatial resolution with which temperature can be measured.
Luminescence intensity, typically, shows thermal quenching resulting from the enhanced non-radiative processes at higher temperatures.15–20 However, thermal enhancement of UC emission has been observed in UC NCs.8,21–26 As examples, size-dependent UC thermal enhancement (stronger in smaller NCs) was demonstrated in NaYF4:Er,Yb NCs and attributed to phonon-assisted energy transfer and phonon confinement.21 Recently, the same group proposed the role of water quenching in NCs.23,26 Furthermore, about 2000-fold enhancement of UC emission intensity was reported in NaYF4:Yb,Tm NCs and explained by phonon-assisted energy transfer enabled by Yb–O vibration due to surface ligands.24 The observations of thermal enhancement are interesting and surprising. The underlying mechanism is still unclear and thus further research is needed to provide insight into the mechanism behind the thermal enhancement of UC emission in NCs.
Here, we investigate the temperature dependence of UC emission in the NC system of NaY(WO4)2 doped with different lanthanide ion pairs for UC. Photoluminescence spectra, luminescence decay dynamics and thermal cycling experiments were measured in two types of atmospheres: ambient atmosphere and dry nitrogen. Under ambient atmosphere, a strong UC thermal enhancement is observed up to ∼470 K and is reversible. In dry nitrogen, the NCs show the enhancement of UC emission only in the first heating cycle. However, in the following cycles of heating, thermal quenching with high reversibility occurs and is similar to the thermal behavior of UC emission in the bulk material. The results reveal the role of surface adsorbed water molecules. This is further confirmed by thermogravimetric analysis (TGA) and Fourier transform infrared spectroscopy (FT-IR). Removal of surface adsorbed water that strongly quenches UC emission can explain the observed UC thermal enhancement. Our study sheds light on the mechanism of UC thermal enhancement in NCs, and serves for understanding and controlling absolute intensity variations that are important in the accuracy and sensitivity of nanothermometry based on lanthanide-doped UC NCs.
Results and discussion
Thermal enhancement of UC for NCs under ambient atmosphere
NaY(WO4)2 UC NCs were synthesized by a one-step thermolysis protocol as established in our previous work27 and were subsequently dried at 370 K overnight to reduce adsorbed water on the NC surface. A variety of NCs was synthesized: Er/Yb co-doped UC NCs with varying Yb3+ concentrations (10, 25 and 49%) and a fixed Er3+ concentration (1%). Also, other UC couples were incorporated in NaY(WO4)2 NCs (1Tm/49Yb and 1Ho/49Yb) to investigate the thermal enhancement in these UC systems for comparison. For UC luminescence measurements, a fixed configuration was used to allow for the comparison of emission intensities. The power density of the NIR (980 nm) laser was constant at 1 W cm−2 which is important given the non-linear power dependence of the UC emission intensity. Details on the synthesis and experimental set-ups are in the ESI.†Photoluminescence spectra were recorded for NaY(WO4)2:49Yb1Er NCs under ambient atmosphere under 980 nm laser excitation in the temperature range of 300–600 K. Fig. 1a shows the emission spectra at different temperatures. The typical green emission from the thermally coupled 2H11/2 and 4S3/2 levels of Er3+ is observed at around 540 nm and the red emission from the 4F9/2 level at around 660 nm. The energy transfer scheme responsible for the NIR-to-visible UC is shown in Fig. 1b.28,29 Two excited Yb3+ ions after NIR absorption transfer their energy to one neighbouring Er3+ ion that emits green or red photons. The position of the intra-configurational f–f transitions does not change, but all the emission lines are enhanced with increasing temperature until 470 K, followed by thermal quenching. For a quantitative analysis, the integrated emission intensities are plotted as a function of temperature for each transition as well as the total (Fig. 1c). The total integrated intensity (2H11/2, 4S3/2, 4F9/2 → 4I15/2) is enhanced by a factor of 3.0 from 330 to 470 K. In addition to the total intensity increase, the individual 2H11/2 → 4I15/2 and 4S3/2 → 4I15/2 emission lines show their typical temperature-dependent change in intensity with increasing intensity of emission from the upper thermally coupled state (2H11/2) relative to the lower state (4S3/2). Similar temperature-dependent behavior is observed for other Yb3+ concentrations (10 and 25%, Fig. S1†).
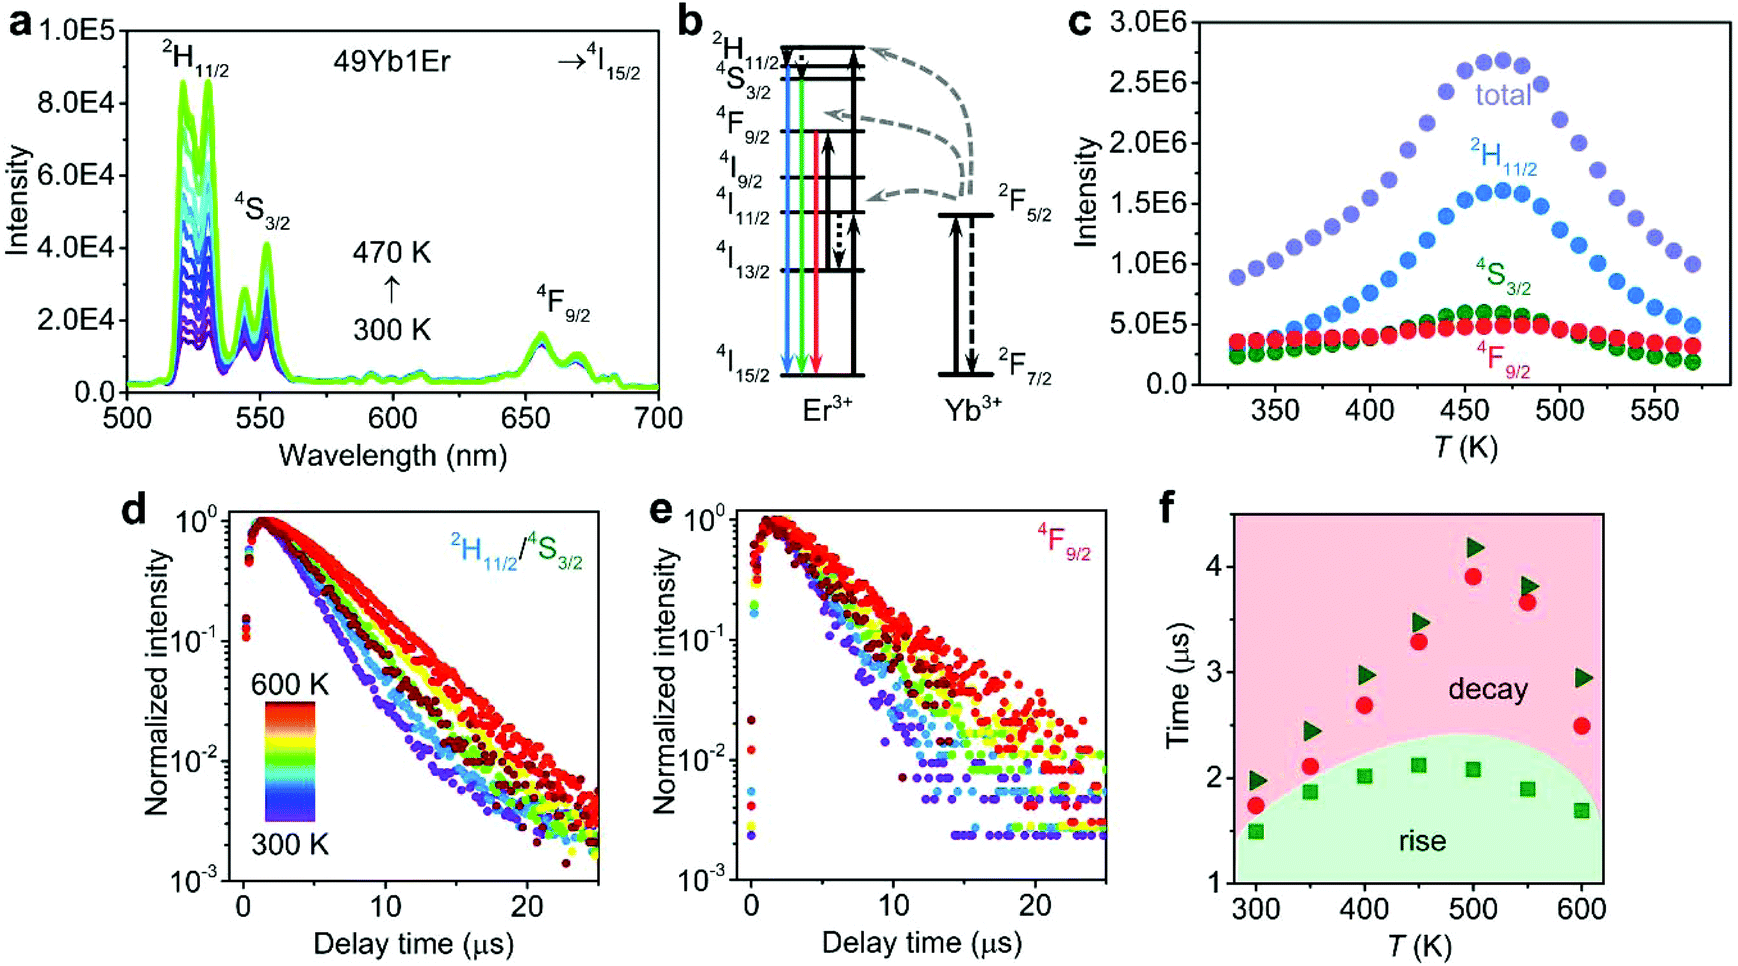 | ||
| Fig. 1 Temperature-dependent UC emission of NaY(WO4)2:49Yb1Er NCs under ambient atmosphere. (a) UC emission spectra under 980 nm excitation at 300–470 K. (b) Energy levels of the Er3+–Yb3+ ion couple showing the UC processes. (c) Integrated intensity of Er3+ emission lines (2H11/2, 4S3/2, 4F9/2 → 4I15/2 transitions and their sum) determined from the emission spectra. (d, e) Luminescence decay curves of (d) green 2H11/2/4S3/2 and (e) red 4F9/2 emitting levels under pulsed (5 ns) 980 nm excitation. (f) Decay times (green triangles for 2H11/2/4S3/2 emission and red circles for 4F9/2 emission) and rise time (green squares for 2H11/2/4S3/2 emission) determined from the decay curves in (d, e). | ||
To test whether the thermal enhancement is specific for the Yb/Er couple, temperature-dependent UC emission spectra were also recorded for NaY(WO4)2 UC NCs with Ho3+–Yb3+ and Tm3+–Yb3+ ion couples under 980 nm excitation (Fig. S2†). For NaY(WO4)2:49Yb1Ho NCs, the UC emission is at 541 and 646 nm (5F4/5S2, 5F5 → 5I8 transitions) and for NaY(WO4)2:49Yb1Tm NCs at 796 nm (3H4 → 3H6 transition). The Tm3+ UC emission line at ∼475 nm (1G4 → 3H6 transition) was too weak to observe. All the observed UC emissions involve a two-photon energy transfer process from Yb3+ ions. Again, the thermal enhancement of UC emission is evident until ∼500 K for 5F4/5S2 → 5I8 green emission and 5F5 → 5I8 red emission of NaY(WO4)2:49Yb1Ho NCs (enhancement factor of 5.0 for the total emission intensity) and for 3H4 → 3H6 IR emission of NaY(WO4)2:49Yb1Tm NCs (enhancement factor of 7.7). The results demonstrate that the thermal enhancement of UC emission is a general phenomenon for different UC couples in NCs. Note that the temperature at which the maximum UC emission intensity is reached varies slightly for the different UC couples and is slightly lower for Yb–Ho (∼450 K) and Yb–Er (∼470 K) than for Yb–Tm (∼500 K). This does not indicate that water desorption occurs at different temperatures (which would be unexpected for the same type of NC) but rather that the temperature at which the UC enhancement because of water desorption is overtaken by thermal quenching processes (e.g. thermally enhanced multi-phonon relaxation) is different. This temperature is determined by a complex interplay between the UC enhancement by water desorption and thermal quenching processes. It is beyond the scope of the present work to fully analyse all these processes. The stronger thermal UC enhancement factor observed for Yb–Tm may contribute to the higher temperature at which the maximum efficiency is reached.
To further confirm the occurrence of thermal enhancement and to obtain insight into the origin, temperature-dependent decay dynamics was measured for the Er3+ emission. Fig. 1d and e show the luminescence decay curves of the green 2H11/2/4S3/2 and red 4F9/2 emissions under pulsed 980 nm excitation. The decay time τ and the rise time τr are determined by fitting the decay curves with I = a![[thin space (1/6-em)]](https://www.rsc.org/images/entities/char_2009.gif) exp(−t/τ) (1 − bexp(−t/τr)), where I is the luminescence intensity at time t, and a and b are constants. The luminescence decay curves for both emissions show a lengthening of the decay and rise time with increasing temperature. The results from the fitting of decay curves at different temperatures are plotted in Fig. 1f. The decay time for the green and red emitting levels lengthens to 4.2 and 3.9 μs at 500 K (vs. 2.0 and 1.7 μs at 300 K). Likewise, the rise time increases from 1.5 μs at 300 K to 2.1 μs at 500 K. The lengthening of the decay and rise time upon heating is consistent with the observed total enhancement of the Er3+ UC emission intensity until 470 K (Fig. 1a and b). Longer rise and decay times result from longer lived intermediate (Yb3+) and emitting (Er3+) excited states and reflect reduced non-radiative decay rates. Temperature-dependent decay dynamics was also measured for NaY(WO4)2:10Yb1Er and NaY(WO4)2:25Yb1Er NCs (Fig. S3†). From the comparison of the rise and decay times for the three samples doped with 10, 25 and 49% Yb3+ ions, it is clear that the decay of the Er3+ 2H11/2/4S3/2 and 4F9/2 emissions is faster for higher Yb3+ concentrations. The faster decay at higher Yb3+ concentrations is generally observed and explained by a shorter lifetime of the feeding 2F5/2 state of Yb3+ due to concentration quenching and an additional decay channel for the green and red emitting levels due to higher back transfer rates to Yb3+.
exp(−t/τ) (1 − bexp(−t/τr)), where I is the luminescence intensity at time t, and a and b are constants. The luminescence decay curves for both emissions show a lengthening of the decay and rise time with increasing temperature. The results from the fitting of decay curves at different temperatures are plotted in Fig. 1f. The decay time for the green and red emitting levels lengthens to 4.2 and 3.9 μs at 500 K (vs. 2.0 and 1.7 μs at 300 K). Likewise, the rise time increases from 1.5 μs at 300 K to 2.1 μs at 500 K. The lengthening of the decay and rise time upon heating is consistent with the observed total enhancement of the Er3+ UC emission intensity until 470 K (Fig. 1a and b). Longer rise and decay times result from longer lived intermediate (Yb3+) and emitting (Er3+) excited states and reflect reduced non-radiative decay rates. Temperature-dependent decay dynamics was also measured for NaY(WO4)2:10Yb1Er and NaY(WO4)2:25Yb1Er NCs (Fig. S3†). From the comparison of the rise and decay times for the three samples doped with 10, 25 and 49% Yb3+ ions, it is clear that the decay of the Er3+ 2H11/2/4S3/2 and 4F9/2 emissions is faster for higher Yb3+ concentrations. The faster decay at higher Yb3+ concentrations is generally observed and explained by a shorter lifetime of the feeding 2F5/2 state of Yb3+ due to concentration quenching and an additional decay channel for the green and red emitting levels due to higher back transfer rates to Yb3+.
Luminescence decay curves were also measured following the direct pulsed excitation at 480 nm (into the 4F7/2 excited level, just above the emitting 2H11/2/4S3/2 levels) for the temperature dependence of the decay dynamics of the green emitting 2H11/2/4S3/2 levels. For NaY(WO4)2:49Yb1Er NCs, Fig. S4a and b† show the temperature-dependent luminescence decay curves and decay times determined from the experimental decay curves. There is no μs rise time since the emitting level is populated by fast relaxation from the 4F7/2 to 2H11/2/4S3/2. As the decay curves deviate from single exponential decay, the luminescence decay curves are characterized by an average lifetime that is determined using 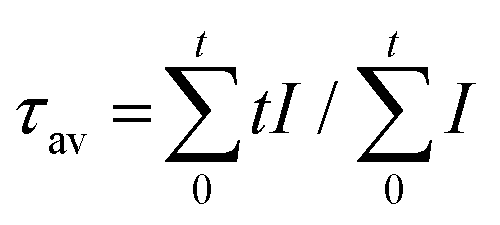 . The deviation from a single exponential decay is typically observed for lanthanide emission in NCs and is explained by differences in decay rates for lanthanide ions in the center of the NC and ions closer to the surface where quenching by high-energy vibrations of surface ligands and surface defects induces a faster overall decay rate. At 1% Er3+ also cross-relaxation processes in Er-pairs contribute to non-exponential decay of the 4S3/2 emission.30 There is a good agreement with the decay times found after pulsed 980 nm excitation (Fig. 1f). Again, higher temperatures lead to lengthening of the decay time from 2.6 (300 K) to 3.8 μs (500 K), and a small decrease above 500 K, in agreement with the trend of thermal enhancement of the UC intensity. Furthermore, Fig. S4c and d† show the temperature-dependent luminescence decay for singly 1% Er3+-doped NCs to exclude the influence of Yb3+. The decay times increase from 3.9 to 7.9 μs between 300 and 600 K. The trend of lengthened decay time at a higher temperature is the same as for the Er3+ emission in the co-doped Yb, Er sample. However, the decay times are about two times longer which is attributed to back energy transfer from Er3+ to Yb3+ in co-doped NCs. The lengthening of decay times at elevated temperatures for Er3+ 2H11/2/4S3/2 emission following direct excitation indicates that non-radiative decay from the 2H11/2/4S3/2 levels is suppressed upon heating giving rise to higher quantum yields for these emitting levels. Therefore, under ambient atmosphere, the thermal enhancement of UC emission is universal for NaY(WO4)2 UC NCs singly Er3+-doped, and co-doped with Yb3+ and Er3+, Tm3+ or Ho3+ in the temperature range of 300–500 K, as demonstrated by measurements of temperature-dependent emission spectra and decay dynamics.
Reversibility and thermal stability of UC NCs under ambient atmosphere
Now that the phenomenon of thermal enhancement of the UC emission has been established, we focus on exploring the reasons behind it. First, we examine the reversibility of temperature-dependent luminescence and the thermal stability of NaY(WO4)2 NCs. As an example, a cycling experiment (repeated heating and cooling between 320 and 480 K) is shown in Fig. 2a. The temperature dependence of the emission intensity of the 2H11/2, 4S3/2, 4F9/2 → 4I15/2 transitions and the sum for the NaY(WO4)2:49Yb1Er NCs indicates that the observed thermal UC enhancement is reversible. To further investigate the thermal stability and exclude the presence of a phase transition at elevated temperatures, temperature-dependent X-ray diffraction (XRD) patterns were recorded. In Fig. 2b, the XRD patterns recorded between 300 and 600 K are shown and no peak shift is observed. This indicates that there is no phase transition when heating up to 600 K and cooling back to 300 K. The diffraction peaks shift ∼0.1 degree towards smaller angles because of the slight thermal expansion of the lattice. The thermal stability of NCs is further demonstrated by in situ heating experiments observed with the transmission electron microscope (TEM). The results are displayed in Fig. 2c, d and Fig. S5a–d.† The NaY(WO4)2 NCs have a diamond shape with a size of ∼10 nm. The TEM images recorded at 300 and 600 K show that the size and shape do not change upon heating to 600 K, indicating the superior thermal stability of core-only NaY(WO4)2 NCs in comparison with core-only NaYF4 NCs (showing aggregation above 575 K).9 The in situ heating was carried out in a vacuum for the TEM measurement. To test whether there is a difference under ambient atmosphere, the NCs were heated ex situ in air at 600 K and the corresponding TEM image (Fig. S5e†) also shows that the NCs have retained their morphology and crystal structure. Therefore, the thermal stability of NaY(WO4)2 NCs is high and the observed thermal UC enhancement with good reversibility cannot be related to a phase transition. | ||
| Fig. 2 Thermal stability of NaY(WO4)2:49Yb1Er NCs. (a) Integrated intensity of emission lines (2H11/2, 4S3/2, 4F9/2 → 4I15/2 transitions and the sum) for three cycles of heating and cooling in air. In each cycle, the integrated emission intensities were measured at 320, 400 and 480 K (heating) and again at 400 and 320 K (cooling). (b) XRD patterns (for Co Kα radiation, λ = 1.79 Å) recorded at 300 K and at elevated temperatures until 600 K and after cooling back to 300 K. At the bottom, the reference XRD pattern of tetragonal NaLu(WO4)2 (pdf 27-0729) is shown. (c, d) Bright field TEM images recorded during in situ heating at (c) 300 and (d) 600 K. (scale bar = 10 nm). | ||
Thermal quenching of UC for microcrystalline materials under ambient atmosphere
It is insightful to compare the temperature dependence of the UC emission of UC NCs with that of the corresponding microcrystalline (bulk) material. If there is a thermally activated (energy transfer) process inherent to the host material, the same thermal enhancement is also expected in the bulk material. If, however, the thermal enhancement is related to surface effects, a different thermal behavior for the bulk material and NCs is expected. In addition, comparison of the luminescence decay times for the bulk material and NCs makes it possible to estimate the role of surface quenching that leads to (much) shorter decay times of emission in NCs. Microcrystalline NaY(WO4)2:49Yb1Er was synthesized by solid state methods31 and studied by temperature-dependent luminescence and decay measurements. Fig. 3a shows the emission spectra for the NaY(WO4)2:49Yb1Er bulk material. Emission peaks are observed in the same spectral regions, green 4S3/2/2H11/2 emission and red 4F9/2 emission. The emission spectra show more structures (sharper lines) which can be explained by more inhomogeneous line broadening in the NCs. The relative intensity of the 4F9/2 emission is much weaker in the microcrystalline material. The higher relative intensity in NCs results from faster 4S3/2 → 4F9/2 relaxation in NCs induced by resonant (∼3000 cm−1) C–H vibrations of the organic ligands on the NC surface.30 | ||
| Fig. 3 Temperature-dependent luminescence of microcrystalline NaY(WO4)2:49Yb1Er under ambient atmosphere. (a) UC emission spectra under 980 nm excitation at 300–600 K. (b) Integrated intensity of emission lines (2H11/2, 4S3/2, 4F9/2 → 4I15/2 transitions and their sum) for the emission spectra in (a). (c, d) Luminescence decay curves of (c) green 2H11/2/4S3/2 emission and (d) red 4F9/2 emission under pulsed 980 nm excitation. (e) Decay times (green triangles for 2H11/2/4S3/2 emission and red circles for 4F9/2 emission) and rise time (green squares for 2H11/2/4S3/2 emission) determined from the decay curves in (c, d). | ||
In Fig. 3b, the temperature dependence of the emission intensities of the three groups of Er3+ emission lines is shown for microcrystalline NaY(WO4)2:49Yb1Er. The behaviour is different from that in NCs and shows an almost stable total intensity up to 475 K followed by thermal quenching between 475 and 600 K. This thermal quenching is consistent with the typically observed thermal quenching of luminescence by thermally activated quenching pathways. In addition to the NaY(WO4)2:49Yb1Er bulk material, thermal quenching was also measured for microcrystalline NaY(WO4)2:49Yb1Ho and NaY(WO4)2:49Yb1Tm (Fig. S6†). Also, here no thermal enhancement was observed and both bulk materials show weak thermal quenching of the UC emission. Fig. 3c and d show the temperature-dependent luminescence decay curves of 2H11/2/4S3/2 and 4F9/2 emissions under pulsed 980 nm excitation for the NaY(WO4)2:49Yb1Er bulk material. The fitted decay times of the 2H11/2/4S3/2 and 4F9/2 emissions and the rise times of 2H11/2/4S3/2 emission are plotted vs. temperature in Fig. 3e. The decay times are more than an order of magnitude longer than that for Er3+ in NCs with the same composition. The temperature dependence is also different: the decay becomes somewhat faster with increasing temperature, consistent with the decrease in UC emission intensity with temperature. Based on the measured temperature dependence of the emission intensities and decay times of the UC emission in microcrystalline NaY(WO4)2:49Yb1Er, it can be concluded that thermal enhancement observed in the NCs must be related to the nanocrystalline nature of the material.
Comparison of the decay dynamics of the UC emission for microcrystalline and nanocrystalline NaY(WO4)2:49Yb1Er shows that the decay times are ∼60–70 μs in the microcrystalline vs. 2–4 μs in nanocrystalline material. The much faster decay in NCs demonstrates that there is a significant contribution of non-radiative decay that is related to surface quenching and therefore the UC efficiency is much lower in NCs. The luminescence decay curves of 2H11/2/4S3/2 emission were also measured under 480 nm direct excitation (Fig. S7†). The decay becomes faster at elevated temperatures and the decay time decreases from 11.4 to 7.1 μs (300 to 600 K). Note that the decay times of the green 2H11/2/4S3/2 emission under direct excitation are shorter than that of the same emission after 980 nm excitation. This indicates that the decay of the UC emission is dominated by the decay of the feeding 2F5/2 level of Yb3+.
Thermal behavior of UC in dry nitrogen
To investigate the role of surface adsorption of molecules (especially water) present under ambient atmosphere, the thermal cycling experiments were repeated for NCs under a dry nitrogen atmosphere. For the NaY(WO4)2:Yb,Er NCs, there is a transition from thermal enhancement to thermal quenching above ∼500 K in air. As we want to understand the origin of the thermal enhancement, the thermal cycling experiments in dry nitrogen were done between 300 and 500 K. For the cycling experiments, UC emission spectra under 980 nm excitation were repeatedly recorded for NaY(WO4)2:49Yb1Er NCs in nitrogen at two extreme temperatures, 320 and 470 K. The integrated intensities of the respective emission lines and their sum are plotted per cycle in Fig. 4a. The first cycle of heating shows the thermal enhancement of UC emission, similar to that in air. The emission spectra measured in the first cycle are shown in Fig. 4b. Upon increasing the temperature from 320 to 470 K, the total emission intensity is enhanced, although the enhancement factor is smaller in nitrogen (1.3 vs. 3.0 in air), which can be explained by the fact that some water is already removed during the flushing with nitrogen prior to the 320 K measurement. Upon cooling back to 320 K, the total UC emission intensity increases further, different from the observations in air where a decrease is observed after cooling to 320 K. The increase is similar to the increase observed in microcrystalline NaY(WO4)2:49Yb1Er when cooling from ∼500 to 300 K. In subsequent cycles (320–470–320 K), the total emission intensity reproducibly decreases upon heating and increases again after cooling to 320 K. The temperature-dependent UC emission spectra during these later cycles are shown in Fig. 4c and the integrated emission intensities are plotted as a function of temperature in Fig. 4d. The thermal coupling of 4S3/2 and 2H11/2 states is confirmed by a good fitting to the integrated emission intensity ratio of 2H11/2/4S3/2vs. temperature (Fig. S8†). The total emission from the 4S3/2/2H11/2 and 4F9/2 levels shows some quenching above 450 K, very similar to that observed in the microcrystalline material. The absence of thermal enhancement after the first heating cycle is confirmed by decay dynamics measurements. Fig. 4e and f display the luminescence decay curves of the green 2H11/2/4S3/2 emission under direct 480 nm and indirect 980 nm excitation. The respective decay times are constant at around 4.5 (480 nm excitation) and 7.9 μs (980 nm excitation). This is in contrast to the lengthening of decay times measured upon heating in air followed by shortening upon cooling. The decay time of the green emission for NaY(WO4)2:49Yb1Er NCs in nitrogen is also 2–3 times longer than that in air, indicating that the ambient atmosphere is responsible for a quenching process that is suppressed/removed by heating. Besides the Er3+ UC emission, we also measured the luminescence decay dynamics of Yb3+ 980 nm emission in single Yb3+-doped NaY(WO4)2:49Yb NCs in ambient atmosphere and dry nitrogen (Fig. S9†). The ambient atmosphere leads to lengthening of Yb3+ decay time from 9.1 to 22.4 μs when the temperature increases from 300 to 500 K. In contrast, in dry nitrogen, the decay time of Yb3+ emission decreases from 31.5 to 24.3 μs. The results are in agreement with the temperature dependence of Er3+ decay time in the two atmospheres. However, in air, upon increasing the temperature from 300 to 500 K, the decay time of Yb3+ 980 nm emission is lengthened by 2.5-fold (vs. ∼1.5-fold for decay time of Er3+ green emission in Fig. S4†). It indicates that water quenching has a bigger influence on the Yb3+ emission, possibly due to concentration quenching for the high concentration of Yb3+. | ||
| Fig. 4 Temperature-dependent luminescence of NaY(WO4)2:49Yb1Er NCs in dry nitrogen. (a) Thermal cycling experiment showing the integrated UC intensity of Er3+ emission lines (2H11/2, 4S3/2, 4F9/2 → 4I15/2 transitions and their sum). (b) Emission spectra of 980 nm excitation for the first three temperature points in the thermal cycling experiment. (c) Temperature-dependent emission spectra under 980 nm excitation for NCs after the first heating cycle. (d) Integrated intensity of Er3+ emission lines (2H11/2, 4S3/2, 4F9/2 → 4I15/2 transitions and their sum) for the emission spectra in (c). (e, f) Luminescence decay curves of green 2H11/2/4S3/2 emission under pulsed (e) 480 and (f) 980 nm excitation as a function of temperature after the first heating cycle. | ||
To examine if the absence of UC thermal enhancement is a general phenomenon for NCs in dry nitrogen, the cycling experiments were repeated for the Yb,Ho and Yb,Tm co-doped NaY(WO4)2 NCs in nitrogen. The temperature dependence of the total UC emission intensity for NaY(WO4)2:49Yb1Ho NCs is shown in Fig. S10 and S11† for NaY(WO4)2:49Yb1Tm NCs. The same effect is observed as for the Er,Yb co-doped NCs: during the first heating stage, the UC emission intensity increases. Different from the results in air, upon cooling, a further increase of the UC emission intensity is observed. In subsequent cycles, the UC emission shows some reversible thermal quenching upon heating from 320 to 470 K. For completeness, also the thermal quenching was studied for microcrystalline NaY(WO4)2:49Yb1Er (Fig. S12†). The temperature-dependent total UC emission intensity in nitrogen is similar to that in air (Fig. 3b) with a nearly constant total intensity between 300 and 475 K.
Mechanism of thermal enhancement under ambient atmosphere for UC NCs
The thermal cycling experiments for the UC emission intensity of NaY(WO4)2:Yb,Er NCs and the microcrystalline material under ambient atmosphere and in dry nitrogen show that strong thermal enhancement is only observed for NCs in air. The same is true for other UC couples (Yb/Ho, Yb/Tm). This suggests that the role of the atmosphere is general. The air and nitrogen are different in several ingredients: air contains oxygen, water and carbon dioxide in addition to nitrogen. O2 and CO2 are not expected to affect the luminescence of the oxide NCs. However, water is known to effectively quench UC emission through multi-phonon relaxation. Especially, the intermediate level 4I11/2 of Er3+ is susceptible to quenching as the 4I11/2–4I13/2 energy spacing is resonant with the high-energy (3200–3500 cm−1) O–H stretching vibrations.30,32–35 Despite a hydrophobic NC surface layer of oleate ligands (∼2 nm thick),36,37 the large surface area of NCs allows for the surface adsorption of water molecules which will be in close proximity to Er3+/Yb3+ ions in the surface layer.26 In the highly Yb-doped NCs, energy migration over the 2F5/2 level of Yb3+ and the resonant 4I11/2 level of Er3+ allows for rapid feeding of surface Er3+/Yb3+ ions that will be quenched by high-energy O–H vibrations (in addition to other surface quenching processes). Thus, surface adsorbed water molecules can be expected to effectively quench the UC emission under ambient atmosphere. Removal of surface adsorbed water by heating will reduce surface quenching by O–H vibrations and give rise to strongly thermally enhanced UC. At ∼470 K, all water will be removed and further heating results in some thermal quenching, similar to what is observed for the bulk material. Upon cooling in air, water will be readsorbed and the UC emission intensity will decrease again. In a dry nitrogen flow, no readsorption of water is possible and the O–H surface quenching will not play a role anymore. After the removal of surface water in the first heating cycle, a similar thermal behaviour of the UC emission is expected in NCs as observed in the microcrystalline material.To provide more evidence for the role of surface adsorbed water in the mechanism proposed for the observed strong thermal UC enhancement, TGA and FT-IR measurements were carried out. Fig. 5a shows two cycles of TGA measurements on UC NCs. The first cycle of heating reveals two stages of mass decrease. The first stage in the temperature range of 300–480 K manifests a mass loss of 0.9%. This is attributed to the loss of surface adsorbed water and gas molecules. Above 500 K, there is a prominent mass loss of 8.2% due to the removal of oleate ligands. Subsequently, during isothermal heating at 570 K, a further loss of mass of 3.8% is observed that is explained by a further loss of oleate ligands. Importantly, during the cooling stage, a mass gain of 0.5% is observed below ∼370 K, suggesting water and gas readsorption. The surface adsorbed water is lost again in the second cycle of heating from 300 to 500 K. Here, the TGA results are consistent with the presence of desorption and adsorption of water and gas during heating and cooling.
 | ||
| Fig. 5 Exploring the mechanism of thermal enhancement of UC emission for NaY(WO4)2 UC NCs. (a) Thermogravimetric analysis of NCs in four stages: heating from 300 to 570 K at the rate of 5 K min−1 of a fresh NC sample; isothermal measurement at 570 K for 10 min; cooling from 570 to 300 K at the rate of 20 K min−1, and heating up again. The blue areas represent the adsorption or desorption of water on the NC surface. (b) FT-IR measurements for the bulk material (black line) and NCs before (blue line) and after (red line) heating to 570 K. (c) Illustration of the UC NC and water on the surface: under ambient atmosphere, the NC surface desorbs water upon heating, giving rise to the thermal enhancement of UC emission through reduced water quenching. Water is readsorbed upon cooling. Without the presence of surface water (in dry nitrogen, lower picture), the NCs show thermal quenching of UC emission similar to that of the microcrystalline material. | ||
To obtain further evidence for the presence of surface adsorbed water and the removal of the oleate ligands upon heating to 570 K, FT-IR analysis was done for NaY(WO4)2 bulk materials and NaY(WO4)2 UC NCs before and after heating to 570 K, as shown in Fig. 5b. For the NCs before heating, the oleate ligands are coupled to the NC surface and confirmed from IR absorption peaks at around 2900 and 1700 cm−1 attributed to C–H and C![[double bond, length as m-dash]](https://www.rsc.org/images/entities/char_e001.gif) O vibrations. In addition to these characteristic peaks of the oleate ligands, there is also a broad band at around 3400 cm−1, characteristic of the O–H stretching vibration of water molecules.38 After heating to 570 K, the FT-IR peaks corresponding to the oleate ligands disappear, consistent with the TGA analysis. However, for the NCs, the broad band between 3200 and 3700 cm−1, characteristic of surface adsorbed water, can still be observed, which indicates that water molecules are again adsorbed on the NC surface. This further supports our model for the thermal enhancement of the UC emission in NCs. The FT-IR spectrum of the bulk material shows no IR-absorption in the 1200–4000 cm−1 region. The IR absorption lines between 500 and 1000 cm−1 are assigned to host vibrations (related to the tungstate group) and are observed for both microcrystalline and nanocrystalline NaY(WO4)2. The small surface-to-volume ratio in the bulk material limits the surface adsorption of water and hence no significant quenching is observed. This explains why the thermal enhancement is not observed for bulk materials,39,40 but is observed exclusively under ambient atmosphere and not in dry nitrogen for NCs.
O vibrations. In addition to these characteristic peaks of the oleate ligands, there is also a broad band at around 3400 cm−1, characteristic of the O–H stretching vibration of water molecules.38 After heating to 570 K, the FT-IR peaks corresponding to the oleate ligands disappear, consistent with the TGA analysis. However, for the NCs, the broad band between 3200 and 3700 cm−1, characteristic of surface adsorbed water, can still be observed, which indicates that water molecules are again adsorbed on the NC surface. This further supports our model for the thermal enhancement of the UC emission in NCs. The FT-IR spectrum of the bulk material shows no IR-absorption in the 1200–4000 cm−1 region. The IR absorption lines between 500 and 1000 cm−1 are assigned to host vibrations (related to the tungstate group) and are observed for both microcrystalline and nanocrystalline NaY(WO4)2. The small surface-to-volume ratio in the bulk material limits the surface adsorption of water and hence no significant quenching is observed. This explains why the thermal enhancement is not observed for bulk materials,39,40 but is observed exclusively under ambient atmosphere and not in dry nitrogen for NCs.
Based on the experiments and analyses presented above, the role of surface adsorbed water on UC emission is schematically illustrated in Fig. 5c. The UC emission intensity is enhanced as water molecules are desorbed from the NC surface. For the water-free NCs, the same thermal quenching is expected as for the microcrystalline material. Both the thermal enhancement and thermal quenching are reversible. Note that the variation in absolute UC intensity has no influence on the intensity ratio of the 2H11/2 and 4S3/2 emissions with the temperature. In both air and nitrogen, the 2H11/2/4S3/2 emission intensity ratio increases from 1.2 to 2.5 from 320 to 470 K (Fig. S13†) since water quenches both 2H11/2 and 4S3/2 emissions equally, as expected for thermally coupled energy levels. Therefore, the thermometry based on the ratiometric technique remains reliable and the NaY(WO4)2:YbEr NCs can serve as nanothermometers in the high temperature range. Also, tungstate based nanothermometry has been demonstrated with a high thermal sensitivity.8,41,42
We propose that our model is universal and can also explain previous observations in the literature. Earlier explanations of thermal enhancement of UC emission in NCs involved phonon confinement and higher-energy Yb–O vibrations. Phonon confinement21,43,44 cannot explain the thermal enhancement as phonon confinement in NCs only occurs for long wavelength and low-energy (<20 cm−1) acoustic phonons. These phonons do not play a role in the (multi-)phonon quenching processes of luminescence of lanthanide ions where the highest energy phonons are involved. In ref. 24, the Yb–O bond was proposed to enable thermal UC enhancement. It was not clear how the slightly higher Yb–O vs. Yb–F vibrational energy could explain the strong thermal enhancement. The Yb–O bond is embedded in the present crystalline host of NaY(WO4)2. The observation that thermal enhancement is absent in the bulk material or NCs in dry nitrogen shows that, at least for NaY(WO4)2, the thermal enhancement is absent to Yb–O bonds. Based on the same reasoning, we can rule out the role of thermally enhanced NIR absorption by Yb3+, phonon-assisted energy transfer,8,21,41 and WO42− group induced charge transfer band or new level.45 All these mechanisms would be active in both bulk materials and NCs, and they should present identical thermal enhancement. In fact, the thermal enhancement is only observable for NCs under ambient atmosphere, but is absent for NCs in the absence of water and for bulk materials. One may argue that during heat treatment the (surface) defect concentrations can be reduced, resulting in the enhanced emission.13,46,47 However, since the healing of defect is irreversible, this model is inconsistent with the good reversibility of the thermal enhancement observed for the thermal cycling experiment in air. Our finding here that surface water is responsible for the thermal enhancement of UC emission is consistent with the previous study in Ref. 23. In their study, a core–shell architecture has been demonstrated to efficiently suppress the water quenching in UC emission. A thick inert shell can eliminate the observation of thermal UC enhancement. Here we have provided not only a universal strategy, the cycling experiment of emission intensity, to examine the thermal behaviour of luminescence, but also a quantitative analysis of the role of surface adsorbed water on the efficiency of NC luminescence.
Conclusions
In the present study, the mechanism behind the surprising thermal enhancement of UC emission in NaY(WO4)2 UC NCs is reported. Temperature-dependent measurements of UC emission spectra and emission intensities as well as luminescence decay dynamics were carried out in two types of atmosphere: air and dry nitrogen. Thermal enhancement of UC emission between 300 and 475 K is observed with good reversibility under ambient atmosphere. In dry nitrogen, only during the first heating cycle, thermal enhancement of the UC emission is observed. Upon cooling, the UC emission intensity does not drop, but increases even further, and subsequent cycles show some thermal quenching similar to that in the bulk material. As the temperature increases, the decay times of Er3+ UC emission and Yb3+ IR emission become longer in air, but not in nitrogen. Based on these observations, the thermal enhancement of UC emission is explained by reversible desorption (upon heating) and adsorption (after cooling) of water on the NC surface. Surface adsorbed water molecules effectively quench UC emission through the high-energy O–H vibrations. TGA and FT-IR measurements provide evidence for water adsorption in support of our model. The present study highlights the significance of surface adsorbed (water) molecules on the quenching of UC emission in NCs and can also explain earlier observations of strong thermal enhancement of UC emission in the NC system. Insight into the role of surface adsorbed molecules will aid the design of UC NCs with higher quantum efficiencies. Our strategy of using cycling experiments on the absolute luminescence intensity forms a universal approach for examining the intrinsic thermal behaviour of luminescence that is fundamental in luminescent materials and determines the performance of nanothermometry.Conflicts of interest
There are no conflicts to declare.Acknowledgements
We are thankful to Thomas N. Ran from Organic Chemistry and Catalysis group for assistance with measurements. This work was financially supported by the China Scholarship Council (No. 201506380101). Jeppe Christiansen would like to acknowledge the financial support from Julie Von Müllen foundation. Xiaobin Xie would like to acknowledge the financial support from the EU H2020-MSCA-ITN-2015 project ‘MULTIMAT’ (project number: 676045).References
- X. D. Wang, O. S. Wolfbeis and R. J. Meier, Chem. Soc. Rev., 2013, 42, 7834–7869 RSC.
- D. Jaque and F. Vetrone, Nanoscale, 2012, 4, 4301–4326 RSC.
- C. D. S. Brites, P. P. Lima, N. J. O. Silva, A. Millan, V. S. Amaral, F. Palacio and L. D. Carlos, Nanoscale, 2012, 4, 4799–4829 RSC.
- E. J. McLaurin, L. R. Bradshaw and D. R. Gamelin, Chem. Mater., 2013, 25, 1283–1292 CrossRef CAS.
- F. Vetrone, R. Naccache, A. Zamarron, A. J. de la Fuente, F. Sanz-Rodriguez, L. M. Maestro, E. M. Rodriguez, D. Jaque, J. G. Sole and J. A. Capobianco, ACS Nano, 2010, 4, 3254–3258 CrossRef CAS PubMed.
- C. D. S. Brites, X. J. Xie, M. L. Debasu, X. Qin, R. F. Chen, W. Huang, J. Rocha, X. G. Liu and L. D. Carlos, Nat. Nanotechnol., 2016, 11, 851–856 CrossRef CAS PubMed.
- C. D. S. Brites, M. C. Fuertes, P. C. Angelome, E. D. Martinez, P. P. Lima, G. J. A. A. Soler-Illia and L. D. Carlos, Nano Lett., 2017, 17, 4746–4752 CrossRef CAS PubMed.
- C. Cascales, C. L. Paino, E. Bazan and C. Zaldo, Nanotechnology, 2017, 28, 185101 CrossRef PubMed.
- R. G. Geitenbeek, P. T. Prins, W. Albrecht, A. van Blaaderen, B. M. Weckhuysen and A. Meijerink, J. Phys. Chem. C, 2017, 121, 3503–3510 CrossRef CAS PubMed.
- V. A. Vlaskin, N. Janssen, J. van Rijssel, R. Beaulac and D. R. Gamelin, Nano Lett., 2010, 10, 3670–3674 CrossRef CAS PubMed.
- S. P. Wang, S. Westcott and W. Chen, J. Phys. Chem. B, 2002, 106, 11203–11209 CrossRef CAS.
- J. Lee, A. O. Govorov and N. A. Kotov, Angew. Chem., Int. Ed., 2005, 44, 7439–7442 CrossRef CAS PubMed.
- W. T. Wu, J. Shen, P. Banerjee and S. Q. Zhou, Biomaterials, 2010, 31, 7555–7566 CrossRef CAS PubMed.
- R. Z. Liang, R. Tian, W. Y. Shi, Z. H. Liu, D. P. Yan, M. Wei, D. G. Evans and X. Duan, Chem. Commun., 2013, 49, 969–971 RSC.
- P. Pust, V. Weiler, C. Hecht, A. Tucks, A. S. Wochnik, A. K. Henss, D. Wiechert, C. Scheu, P. J. Schmidtn and W. Schnick, Nat. Mater., 2014, 13, 891–896 CrossRef CAS PubMed.
- C. C. Lin, A. Meijerink and R. S. Liu, J. Phys. Chem. Lett., 2016, 7, 495–503 CrossRef CAS PubMed.
- J. M. Ogieglo, A. Katelnikovas, A. Zych, T. Justel, A. Meijerink and C. R. Ronda, J. Phys. Chem. A, 2013, 117, 2479–2484 CrossRef CAS PubMed.
- M. D. Chambers, P. A. Rousseve and D. R. Clarke, J. Lumin., 2009, 129, 263–269 CrossRef CAS.
- Y. C. Chang, C. H. Liang, S. A. Yan and Y. S. Chang, J. Phys. Chem. C, 2010, 114, 3645–3652 CrossRef CAS.
- Y. Tian, B. J. Chen, R. N. Hua, N. S. Yu, B. Q. Liu, J. S. Sun, L. H. Cheng, H. Y. Zhong, X. P. Li, J. S. Zhang, B. N. Tian and H. Zhong, CrystEngComm, 2012, 14, 1760–1769 RSC.
- D. D. Li, Q. Y. Shao, Y. Dong and J. Q. Jiang, J. Phys. Chem. C, 2014, 118, 22807–22813 CrossRef CAS.
- L. L. Tong, X. P. Li, R. N. Hua, T. X. Peng, Y. Z. Wang, X. Z. Zhang and B. J. Chen, J. Nanosci. Nanotechnol., 2016, 16, 816–821 CrossRef CAS PubMed.
- Y. Q. Hu, Q. Y. Shao, P. G. Zhang, Y. Dong, F. Fang and J. Q. Jiang, J. Phys. Chem. C, 2018, 122, 26142–26152 CrossRef CAS.
- J. J. Zhou, S. H. Wen, J. Y. Liao, C. Clarke, S. A. Tawfik, W. Ren, C. Mi, F. Wang and D. Y. Jin, Nat. Photonics, 2018, 12, 154–158 CrossRef CAS.
- E. D. Martínez, C. D. S. Brites, L. D. Carlos, A. F. García-Flores, R. R. Urbano and C. Rettori, Adv. Funct. Mater., 2019, 29, 1807758 CrossRef.
- Q. Y. Shao, G. T. Zhang, L. L. Ouyang, Y. Q. Hu, Y. Dong and J. Q. Jiang, Nanoscale, 2017, 9, 12132–12141 RSC.
- Z. J. Wang, Y. L. Zhang, J. P. Zhong, H. H. Yao, J. Wang, M. M. Wu and A. Meijerink, Nanoscale, 2016, 8, 15486–15489 RSC.
- Y. F. Wang, W. Xu, Y. S. Zhu, S. Xu, H. N. Cui and H. W. Song, J. Mater. Chem. C, 2014, 2, 4642–4650 RSC.
- W. G. Yu, Y. Tian, M. M. Xing, Y. Fu, H. Zhang and X. X. Luo, Mater. Res. Bull., 2016, 80, 223–229 CrossRef CAS.
- F. T. Rabouw, P. T. Prins, P. Villanueva-Delgado, M. Castelijns, R. G. Geitenbeek and A. Meijerink, ACS Nano, 2018, 12, 4812–4823 CrossRef CAS PubMed.
- Z. J. Wang, J. P. Zhong, H. B. Liang and J. Wang, Opt. Mater. Express, 2013, 3, 418–425 CrossRef CAS.
- F. Wang, J. A. Wang and X. G. Liu, Angew. Chem., Int. Ed., 2010, 49, 7456–7460 CrossRef CAS PubMed.
- J. C. Boyer, M. P. Manseau, J. I. Murray and F. C. J. M. van Veggel, Langmuir, 2010, 26, 1157–1164 CrossRef CAS PubMed.
- R. Arppe, I. Hyppanen, N. Perala, R. Peltomaa, M. Kaiser, C. Wurth, S. Christ, U. Resch-Genger, M. Schaferling and T. Soukka, Nanoscale, 2015, 7, 11746–11757 RSC.
- Z. J. Wang and A. Meijerink, J. Phys. Chem. C, 2018, 122, 26298–26306 CrossRef CAS PubMed.
- C. Schliehe, B. H. Juarez, M. Pelletier, S. Jander, D. Greshnykh, M. Nagel, A. Meyer, S. Foerster, A. Kornowski, C. Klinke and H. Weller, Science, 2010, 329, 550–553 CrossRef CAS PubMed.
- J. J. Geuchies, C. van Overbeek, W. H. Evers, B. Goris, A. de Backer, A. P. Gantapara, F. T. Rabouw, J. Hilhorst, J. L. Peters, O. Konovalov, A. V. Petukhov, M. Dijkstra, L. D. A. Siebbeles, S. van Aert, S. Bals and D. Vanmaekelbergh, Nat. Mater., 2016, 15, 1248–1254 CrossRef CAS PubMed.
- L. F. Scatena, M. G. Brown and G. L. Richmond, Science, 2001, 292, 908–912 CrossRef CAS PubMed.
- J. W. Qiao, L. X. Ning, M. S. Molokeev, Y. C. Chuang, Q. L. Liu and Z. G. Xia, J. Am. Chem. Soc., 2018, 140, 9730–9736 CrossRef CAS PubMed.
- Y. H. Kim, P. Arunkumar, B. Y. Kim, S. Unithrattil, E. Kim, S. H. Moon, J. Y. Hyun, K. H. Kim, D. Lee, J. S. Lee and W. B. Im, Nat. Mater., 2017, 16, 543–550 CrossRef CAS PubMed.
- W. Xu, Q. T. Song, L. J. Zheng, Z. G. Zhang and W. W. Cao, Opt. Lett., 2014, 39, 4635–4638 CrossRef CAS PubMed.
- Y. Gao, F. Huang, H. Lin, J. C. Zhou, J. Xu and Y. S. Wang, Adv. Funct. Mater., 2016, 26, 3139–3145 CrossRef CAS.
- G. K. Liu, H. Z. Zhuang and X. Y. Chen, Nano Lett., 2002, 2, 535–539 CrossRef CAS.
- J. N. Shan, M. Uddi, N. Yao and Y. G. Ju, Adv. Funct. Mater., 2010, 20, 3530–3537 CrossRef CAS.
- B. Dong, B. S. Cao, Y. Y. He, Z. Liu, Z. P. Li and Z. Q. Feng, Adv. Mater., 2012, 24, 1987–1993 CrossRef CAS PubMed.
- J. Dhanaraj, R. Jagannathan, T. R. N. Kutty and C. H. Lu, J. Phys. Chem. B, 2001, 105, 11098–11105 CrossRef CAS.
- K. Zhang, C. G. Ma, J. Y. Zhang, B. M. Liu, Y. Zhou, S. Q. Guo, J. Y. Xu, J. S. Hou, Y. Z. Fang, L. R. Zheng and H. T. Sun, Adv. Opt. Mater., 2017, 5, 1700448 CrossRef.
Footnote |
| † Electronic supplementary information (ESI) available. See DOI: 10.1039/c9nr02271f |
| This journal is © The Royal Society of Chemistry 2019 |