
 Open Access Article
 This Open Access Article is licensed under a Creative Commons Attribution-Non Commercial 3.0 Unported Licence
Early appearance of crystalline nanoparticles in pulsed laser ablation in liquids dynamics†
Stefan
Reich
 a,
Alexander
Letzel
b,
Andreas
Menzel
c,
Norman
Kretzschmar
d,
Bilal
Gökce
b,
Stephan
Barcikowski
b and
Anton
Plech
*a
a,
Alexander
Letzel
b,
Andreas
Menzel
c,
Norman
Kretzschmar
d,
Bilal
Gökce
b,
Stephan
Barcikowski
b and
Anton
Plech
*a
aInstitute for Photon Science and Synchrotron Radiation, Karlsruhe Institute of Technology, Hermann-von-Helmholtz-Platz 1, D-76344 Eggenstein-Leopoldshafen, Germany. E-mail: anton.plech@kit.edu
bDepartment of Technical Chemistry I and Center for Nanointegration Duisburg-Essen, University of Duisburg-Essen, Universitätsstrasse 7, D-45141 Essen, Germany
cPaul-Scherrer-Institut, CH Villigen-PSI, Switzerland
dEuropean Synchrotron Radiation Facility, F-38043 Grenoble, France
First published on 13th March 2019
Abstract
The size and crystallinity of gold and silver nanoparticles during the process of pulsed laser ablation in water (PLAL) is investigated with microsecond and sub-microsecond time resolution. While basic observations have already been established, such as detection of particles inside the cavitation bubble, trapping of ablated matter by the bubble or the action of size quenching on a sub-millisecond time scale, the structure formation mechanism is still a matter of debate. Quantifying the nanoparticle release and crystallinity close to the irradiated metal target by wide and small angle X-ray scattering reveals the presence of nanoparticles ahead of the developing vapour bubble and inside the bubble. While the (temporal) distribution is in agreement with a homogeneously particle-filled bubble, solid particles are detected at the advancing bubble front. Wide-angle X-ray scattering confirms the crystalline nature of these large particles. This reveals that for picosecond ablation the expulsion of condensed phases of material during the ablation process adds significantly to the bimodal size distribution, relating to recent models of film lift-off and liquid metal Rayleigh instabilities.
1 Introduction
Among the many different routes to nanoparticle generation, pure physical procedures like pulsed laser ablation in liquids (PLAL) are gaining increased attention. PLAL allows for the synthesis of particles from a wide range of material classes, such as pure metals, alloys, organic molecules or even the generation of hybrid materials.1–3 In many cases the use in applications is in reach, in particular in view of recent success in upscaling the process in ablation4 or post-synthesis fragmentation.5 While the general phenomena during the process are similar for many materials, as well as for different liquids, the morphology of the particles may vary significantly from case to case. The particle size distribution is of central concern, as many applications, such as in catalysis, require very small particles below 10 nm for an optimal efficiency in relation to the utilized amount of material. PLAL-produced noble metal nanoparticles show a marked bi- or multimodal size distribution, particularly when using pico- to nanosecond lasers.6 While a part of the population of large particles and agglomerates may be produced as a consequence of the interaction of the nanoparticles with the dynamics of the bubble, it has been pointed out recently that phase explosion and, more specifically, liquid metal droplet jetting from the propagating metal layer lifting off the target may contribute to the fraction of large nanoparticles.7 This adds a peculiar fact to the tuning of the nanoparticle morphology, as these large particles of compact and spherical morphology may be inert to particle size quenching. The latter has been shown to reduce particle sizes already for the addition of minute amounts of salt in the water phase (below millimolar concentration).8,9 It has been confirmed that the ionic content within the vapour bubble is already sufficient to quench particle size growth within tens of microseconds of both the small particle (primary) and the large particle (secondary) size fraction.10,11 This quenching, however, is unlikely to be active within the first few nanoseconds after laser excitation, when the large spheres form and solidify. Hence, the current picture is that there is a primary fraction of small particles growing quickly in the vapour–metal mixing phase, and a separate fraction of larger particles. The primary fraction has been linked to the condensation of atom clusters in simulations.12 It can still grow further, even in the free liquid.13 The secondary fraction seems to originate from two processes: liquid layer break up plus jetting droplets (that even cross the bubble phase boundary at the nanosecond time scale, at least for ultrashort pulses at high intensity)7 as well as the secondary particle fraction trapped for tens to hundreds of microseconds inside the bubble.14 As the large particles have a colloidal nature, their condensation and crystallisation dynamics require a deeper understanding.The characterization of the process poses considerable obstacles to access the dynamics on a nanosecond to microsecond time scale as well as quantifying ejected clusters and nanoparticles in the hierarchical structure formation process.15–18 While metal excitation and mass expulsion develop on a picosecond to nanosecond time scale, the formation of long-lived plasmas (for nanosecond lasers)15,19–21 and the formation of vapour/cavitation bubbles span a sub-millisecond time scale and macroscopic sizes.22 Optical methods are either limited to the macroscale dynamics or to detection of selected species, such as in laser-induced breakdown. Earlier, we have developed methods to facilitate access by X-ray probing. Time-resolved small-angle X-ray scattering (SAXS) with micro beams14,23 allows for a temporal and spatial resolution of emerging nanoparticles, while X-ray imaging adds the macroscale information24 with a less perturbed view and nanoparticle sensitivity through dark-field methods.25,26 X-Ray spectroscopy may even add speciation information.27–29 SAXS and radiography are sensitive to the mass/size of the scattering objects, but are not able to differentiate if these objects are in a liquid or solid/crystalline state.
Here we present the first study on the particle morphology by wide-angle X-ray scattering (WAXS) and SAXS, both to address crystallinity and sizes, as well as to extend significantly the time resolution to the nascent phase of the cavitation bubble, in order to understand whether particles are already present nanoseconds after the ablation event or would only gradually develop through nucleated growth inside the vapour bubble.
2 Experimental
Pulsed-laser ablation setup
The ablation process was performed in a flow chamber with rapidly pumped water and continuous replacement of the target. Thus, conditions for repetitive cycles under identical external conditions were met. The chamber consisted of a 3D printed vessel, with a liquid volume of 0.5 cm3 and a 0.5 cm thickness along the X-ray beam (see sketch in ESI†). The focusing lens sealed the entry channel for the laser, while the sides of the chamber were covered by thin poly-imide foils (Kapton, DuPont) that were replaced frequently. The target, a metal ribbon of gold (99.9%) or silver (99.9%) was pulled through the chamber at constant speed, such that the surface was completely refreshed after about 10 laser shots. A similar setup had been used earlier.24 The water is pumped from a 20 l reservoir of distilled water and replaced regularly.Laser sources were a 12 ps Nd:YAG-based Q-switched laser at 1064 nm and 1 kHz repetition rate (Edgewave PX400-2-GM) at beamline cSAXS (Swiss Light Source, Villigen, Switzerland) and a 2 ps Ti:Sa-based regenerative amplifier at 800 nm and 1 kHz (Coherent Legend) at beamline ID09 (European Synchrotron Radiation Facility, Grenoble, France). Particles for HR-TEM were obtained at a second regenerative amplifier with comparable parameters.30 The laser light was focused onto the target by the plano-convex lens as the chamber wall with an effective focal length in water of 38 mm.
SAXS and WAXS pump–probe setups
SAXS was recorded with a 6 × 24 μm wide X-ray beam at beamline cSAXS that intersected the liquid column parallel to the target and was perpendicular to both the laser path and the target motion at a distance of 0.17 mm. Scattered X-rays were recorded on a pixellated detector (Pilatus 2M) after a 7.1 m long, evacuated flight path. The detector counting can be gated active for variable intervals, of 2 and 5 μs length in our case. The X-ray energy was set to 13.6 keV. Delays between laser and detector gating were defined by a variable delay generator (DG645, Stanford Research Instruments). Temporal overlap was checked by comparing the electronic signals on an oscilloscope with a precision of at least 0.5 μs.SAXS and WAXS were recorded with a 60 × 80 μm wide X-ray beam at beamline ID09 in identical geometry at a distance of 0.2 mm from the target. Scattered X-rays were recorded by a scintillator-coupled charge-coupled device (Rayonix HS170). Time resolution was achieved by isolating single X-ray pulses from the storage ring by means of a mechanical chopper31 to which the laser emission was synchronized at 1 kHz. The mutual delay can be varied by a combination of picking different pulses from the oscillator and the phase shift of the oscillator mode locking. Thus a 5 ps precision is achieved at a time resolution given by the X-ray pulse length of <100 ps.32 SAXS was recorded at a 600 mm detector distance, which was reduced to 120 mm for WAXS. Exposure times for SAXS were 5 seconds and for WAXS 30 seconds, i.e. accumulating scattering from 5000 and 30![[thin space (1/6-em)]](https://www.rsc.org/images/entities/char_2009.gif) 000 shots, respectively. The X-ray spectrum was quasi-monochromatic after passing a multilayer monochromator centred at 15.2 keV with a 0.2 keV width.
000 shots, respectively. The X-ray spectrum was quasi-monochromatic after passing a multilayer monochromator centred at 15.2 keV with a 0.2 keV width.
Scattering data analysis and modelling
Raw X-ray detector data were corrected for pixel outliers, a sensitivity map for the pixel detector and flat field for the CCD detector. Dark and background scattering was derived from recording data prior to the laser impact, which in practice was done by tuning the laser-X-ray delays to negative values. The two-dimensional detector images were in all cases corrected for the solid-angle coverage of each pixel before azimuthal integration to obtain a one-dimensional scattering curve S(q) as function of the scattering vector q. These curves contain the SAXS signal at low angles and the liquid scattering signal at large angles. On top of the liquid scattering, powder rings from the nanoparticles show up, given that crystalline structures are present in the sample.33SAXS curves can be modelled to obtain the particles’ sizes and the particle size distributions. Here, we use a simulation approach with a reverse Monte Carlo optimization of a wide size distribution of presumed spherical particles,34 using the package McSAS by Pauw et al. It allows for a bias-free size distribution optimization. However, the derived distributions of volume fractions of particle sizes are not unique. In the minimization process spurious sharp changes in the distribution of nearby size bins help to minimize the mean simulation error, but do not reflect real fine structure. A model-free analysis encompasses the partial integration of the function S(q)·q2 in an interval of (0.003–0.04) Å−1 and (0.04–0.17) Å−1 to derive the (partial) Porod invariant for large and small particles, respectively.24,35,36
Liquid scattering, while constituting the major component of WAXS, is relatively constant, while a small incremental change of the function is observed, if water pressure or temperature is changed.37 This faint change can be derived by subtracting steady-state data and be interpreted in the present case as the volume (and thus pressure change) of the water phase. Such a change can be initiated by the passing shock wave or the expansion of the vapour bubble.37–39 In particular, the wake of the shock wave was seen distinctly after a delay of 150 ns. This change in liquid scattering was removed from the differential WAXS signal by a polynomial modelling, which then only contained the powder rings of gold and silver, respectively. The (111) peak was fitted by a Gaussian function to derive the width. The Scherrer formula40 links the width to the crystal domain sizes of the particles, in particular in cubic symmetry.
The mass intersected by the X-ray beam at a particular time delay was modelled by assuming (1) a homogeneous and constant filling of the bubble by constant-size particles, so that its density was reduced with the 3rd power of the bubble size. At the same time the signal grows with the length of the intersection of the X-ray beam path with the bubble. It starts as a step function, when the bubble touches the X-ray beam, from where it grows in a sub-linear fashion determined by the geometry. Model (2) assumes that all the nanoparticle mass (with fixed size distribution) is located not in the bubble interior, but at the interface between the bubble and liquid.41,42 Its surface density thus decreases with the 2nd power of the bubble size. It starts as a step function, when the bubble touches the X-ray beam. Afterwards it decreases strongly, as the surface area illuminated by the X-ray beam decreases due to the geometry.
Optical imaging and ex situ size determination
Optical imaging was performed in an independent run by gating a commercial CMOS camera (ace, Basler) and using a 5 μs xenon flash lamp (RT Strobe 3000, Rheintacho) with a diffuser foil. The camera exposure time was set to 10 μs. The bubble was imaged by a photo objective (Ernitec) and its size was derived as function of delay after laser excitation43 for a series of stroboscopic images. A short pass filter at 715 nm (Thorlabs) removed stray laser light.Particles were also produced in a semi-batch process7,44 at similar conditions using the 12 ps laser. Particle sizes were determined by an analytic disc centrifuge (ADC) against a sucrose gradient with photo-optical detection of particles. A suspension was drop-cast onto carbon-coated copper grids and imaged by a transmission electron microscope (TEM, Zeiss EM 910, 120 kV). High-resolution TEM was performed on a machine at the LEM at KIT (FE Titan, 300 kV).
3 Results and discussion
Probing of the ejected particles' mass was done at a finite, constant height of the probe above the substrate in order not to be perturbed by the weak tail of the X-ray beam touching the target. Thus, the recorded temporal evolution contains equally a spatial dimension of the moving bubble front. Assuming that the liquid close to the bubble does not undergo strong convection, the arrival time first probes the material at the front of the bubble followed by the bubble apex and subsequently the bubble interior. Fig. 1 schematically displays the intersection of the (expanding and fully expanded) bubble by the pencil X-ray beam. | ||
| Fig. 1 Scheme of the in situ X-ray scattering setup. The focused X-ray beam from the synchrotron crosses the ablation interaction zone at a fixed height above the gold target, while scattering is recorded as function of delay after laser impact by detectors in small-angle (for size and mass abundance information) or wide-angle geometry (for crystallinity information). The images show a still of the vapour bubble at different delays on the gold target. The sketch below symbolizes the different nano- to macroscopic evolution steps. | ||
The bubble height evolution is shown at the top of Fig. 2 and 3 (time-resolved videographs can be found in the ESI, S1†). In both cases the bubble heights reach a value of about 0.5 mm with lifetimes up to collapse of 85 μs. While the laser pulse energy for the 12 ps laser (1064 nm) is only 1 mJ, the pulse energy of the 2 ps laser (800 nm) is 2.7 mJ. Bubble sizes in each case are similar despite the difference in pulse energy. Two effects possibly contribute to the difference in coupling efficiency:1,43 (i) the higher linear absorption in water at 1064 nm, and thus a stronger heating of the water close to the target; and (ii) the longer pulse length for the 1064 nm irradiation, which may increase non-linear self-absorption after breakdown. This latter effect, however is supposed to be small, given that characteristic time scales in plasma formation (such as thermalization) are supposed to take place on a >30 ps time scale. At the same time, thresholds for cascade ionization are found to be lower at infrared wavelengths.45 Bubble sizes on gold are about 10% larger. In general, pulse length, more than wavelength, in the near-IR to IR is a very critical factor in laser ablation,6,46 in particular, if the emitted nanoparticles do interact with the laser beam or the plasma. Also, non-thermalized electrons that escape deeper into a metallic target might be influenced by laser pulse length.47
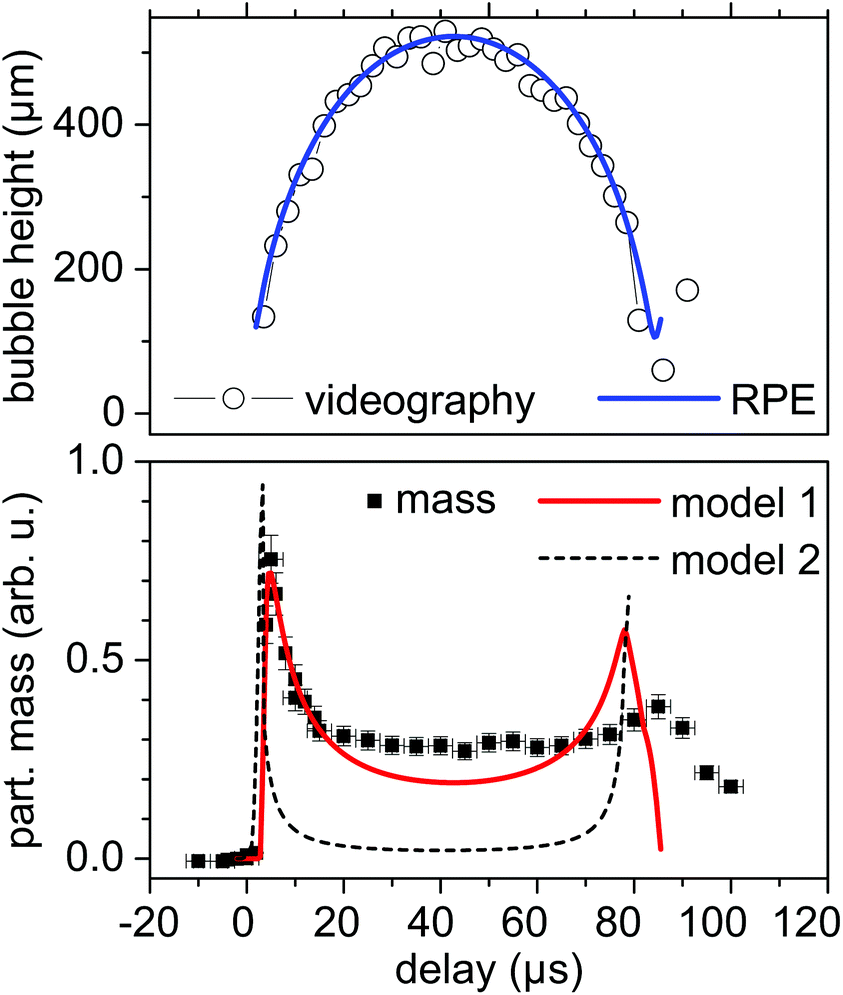 | ||
| Fig. 2 Top: Height of the vapour bubble for excitation with 12 ps pulses at 1064 nm as function of delay after laser ablation impact on silver together with a simulation with the RP equation (line). Bottom: Partial mass of larger silver particles as function of delay (symbols) together with calculations of model 1 (red line, bubble homogeneously filled with particles) and model 2 (black broken line, particles residing exclusively at the bubble interface). | ||
 | ||
| Fig. 3 Top: Height of the vapour bubble for excitation with 2 ps pulses at 800 nm as function of delay after laser impact on silver together with a simulation with the RP equation (line). Bottom: Partial mass of large silver particles as function of delay (symbols) together with calculations of model 1 (red line, bubble homogeneously filled with particles). The dashed line repeats the bubble size from the RP fit. Note that the time axis has been scaled logarithmically in order to highlight the mass abundance before bubble arrival. | ||
A reasonable modelling can be done by the Rayleigh–Plesset (RP) equation, although it is known that RP does not well reproduce the collapse phase, and in particular the size of the bubble rebound.48,49 The Gilmore equation incorporates water compressibility and condensation to reach a better agreement with bubble dynamics.50–52 Nevertheless, we are mostly interested in the expanding bubble, where virtually no differences between the RP and Gilmore equations can be found with appropriate fitting parameters.53
The particle mass as derived from the partial invariant of the large particles (20 to 80 nm) is presented in the bottom part of Fig. 2 and 3. The general evolution displays a sharp rise directly after laser impact for 12 ps pulses followed by a slight reduction until the maximum bubble extension. Thereafter the mass in the X-ray path increases again to drop to a smaller level after bubble collapse. First, this reveals that large nanoparticles are already present during the early expansion phase of the bubble. The evolution of smaller (primary) particles shows a similar course and is given in the ESI (Fig. S4†). Some nanoparticles may stem from redeposited material, which, however, should have undergone melting and fragmentation upon re-irradiation. The amount should be far less than the >109 emitted particles per mm3, given that the ablated layer per shot is more than 100 nm. Second, while the initial rise is related to the nascent bubble crossing the X-ray position, the subsequent decay reflects particle density inside the bubble. In order to quantify the behaviour we used the calculated bubble size evolution (from the RP equation) to estimate the expected particle mass for model 1. This assumes that the bubble is homogeneously filled with particles, as has been described earlier.54 In model 2 the nanoparticles are strongly coupled to the bubble–water interface and do not exist in the vapour phase. In each case the volume and surface area intercepted by the 24 × 6 μm sized X-ray beam (cSAXS) are calculated and related to the total volume and surface of the bubble by assuming a constant total particle mass. A convolution over 3 μs accounted for time resolution and pulse energy fluctuations.
The model calculations strongly suggest that the particle mass is homogeneously dispersed inside the volume of the bubble, as for a surface-laden bubble the fraction of particles in the beam would drop very strongly at maximum bubble extension. The assumption of a constant particle mass inside the bubble as well as the exclusion of shifts from one size fraction to the other are certainly a first crude postulation. Indeed, the mass of large particles at maximum bubble extension is a bit higher than expected for model 1. One assumption could be the onset of a growth or aggregation process at the extended bubble that would feed the large particle-size fraction. In situ quenching has recently shown that the large particles can be reduced in number and size already inside the bubble in a saline solution.10
Nevertheless, the ratio of small-particle mass versus large-particle mass as displayed in Fig. 4 shows a shift towards small particles for the extended bubble, followed by a reversal at bubble collapse. The latter is reasonable, considering the earlier described agglomeration by retraction of the particle mass towards the target upon collapse.14,24 A feeding of the large-size fraction, however, would also reduce the shown ratio at maximum bubble extension.
 | ||
| Fig. 4 Results of the reverse Monte Carlo optimization of the SAXS curves on gold with 12 ps, 1064 nm excitation at two delays of 6 and 40 μs. The size histogram is weighted by the particle mass for better comparison of the contribution from large particles. The inset displays the ratio of the mass fraction of the small to large particles as derived from the partial invariants. The line marks the mass prediction by model 1 for comparison for particle abundance in a homogeneously filled bubble. | ||
Therefore we estimate that the slight deviation of the mass distribution from a homogeneously filled bubble is accounted for by a slightly shifted distribution of particle sizes within the bubble. Ibrahimkutty et al.23 have observed that, while the small particles are distributed in a homogeneous fashion, the large structures tend to prevail within the upper part of the bubble. At the same time more mass seems to emerge from the target with bubble growth. Notably, the ratio of the mass fraction of small to large particles shows a minimum for the early bubble touching the X-ray beam. The particle size distribution in Fig. 4 compares the distribution at the bubble touching the X-ray beam (6 μs delay) with that of the fully expanded bubble (40 μs). Without over-stretching the results from the reverse Monte Carlo fit, an excess of large particle around 60 to 100 nm is registered at 6 μs. Primary particles in both cases peak at 7–10 nm, the typical primary particle size range observed in TEM ex situ during ps PLAL.
Upon bubble collapse the mass detected along the X-ray beam cross section decreases again as a manifestation of the particle retraction. As the signal does not decay to zero, one could reason that some particles may escape the bubble. However, we are not able to quantify this amount, as at bubble collapse a variation in bubble lifetimes smears out the collapse phase in time with this averaging measurement. Therefore the amount of trapping versus particle escape from the bubble is difficult to quantify.
The time resolution for the first experiment at beamline cSAXS (12 ps, 1064 nm) of 5 μs is not high enough to discern more details in the initial explosion phase. A reduction of detector gating time would be possible, however, only at the expense of a signal reduction. The pump probe setup at ID09 (2 ps, 800 nm) allows for a much higher time resolution. The 100 ps X-ray pulse length limit is yet not fully exploited due to the finite distance from the target. Nevertheless, the first event that is seen is the passing shock wave at some 150 ns after laser impact, as seen in Fig. 5, reflected by the pressure signal from the water phase. Particle mass appearance at a height of 0.2 mm (Fig. 3) starts at around 3 μs, which is earlier than the bubble front crossing of the X-ray beam. With the bubble being intercepted by the beam at 6–7 μs, the particle mass of the large particles peaks similarly to the first setup. Decay with bubble growth and the second maximum before collapse follow the model 1 of a bubble filled with particles, as described above. Therefore, the presence of large particles as predicted by MD simulations7 is confirmed experimentally already at the advancing front of the bubble expansion. Nevertheless, SAXS does not reveal the morphology or crystallinity of the particles, which could be either aggregated primary particles in spatial confinement or also incorporating large spheres.
 | ||
| Fig. 5 Powder intensity (open circles) and crystal domain size (filled squares) with 2 ps, 800 nm excitation as function of delay after laser impact on gold. The blue line shows the liquid scattering signal following the pressure change in the water phase, the red line represents the particle mass predicted by model 1. The inset shows selected gold (111) powder profiles together with Lorentz fits at delays of 8 (open circles) and 40 μs (open triangles). | ||
The latter is probed by WAXS, given that solidified particles are present. WAXS probes the crystalline lattice, in the present case the fcc structure of gold and silver. WAXS is sensitive to the size of coherent crystalline domains and not perturbed by clustered individual particles.
Fig. 5 shows the result of the analysis of the powder rings on ablated gold. The scattering intensity (open circles) is a measure for the crystalline mass. It shows a maximum at delays that correspond to a position within the bubble, but a weak intensity is already detected before and at the point of the bubble crossing the X-ray path. At the same time, the width of the (111) powder peak traces the size of the crystalline domains. These are, in contrary, largest at the early bubble expansion (time delay 4–5 μs) with some 15–20 nm domain sizes. The crystallites within the bubble appear smaller with sizes down to 8 nm, coinciding with the primary particle sizes (from SAXS). This, on the one hand, resembles the observation of increasing ratio of smaller particles inside the bubble as compared to those at the expansion front of the bubble. On the other hand, it also documents that at the expansion front there are already rather large particles present, which are crystalline in nature and thus have cooled down. In contact with water or a dense fluid, it is not a surprise that initially hot particles would cool down within few nanoseconds to crystallize.55
These large particles may still be in the minority, as the powder intensity suggests. Nevertheless, in terms of mass and possible detrimental effects in an application they are well visible.
In Fig. 6 such objects are displayed, showing the prevalence of spherical shapes. A magnification of a single sphere shows some structuring. These patterns are testament to an internal domain structure. HR-TEM confirms that the crystallites predominantly display lattice plane spacings matching gold (111) (2.3 ± 0.04) Å, (see ESI Fig. S5†) with a multi-grain morphology. The detected grain sizes are in the range of 10–20 nm, while small particles (<10 nm) are often single-crystalline or multiply twinned. The powder data as well as detailed structures derived from molecular dynamics simulations suggest that individual particles are composed of smaller domains (in the size range <3 nm). Detailed crystallographic analysis of ps PLAL-derived Au and AuAg nanoparticles synthesized by in situ PVP size quenching recently confirmed that each nanoparticle consisted of only one crystalline domain of 3–5 nm and was not twinned. This was the case for the pure metals (Ag and Au) and for all AgAu nano-alloys.56 Note that these primary particles sampled experimentally in the liquid are considerably larger in size than the atom clusters simulated (on a ps to ns time scale) in the vapour phase. Hence, these primary particle fractions may have a different origin. The SAXS and WAXS data presented here reveal information about the secondary, larger particle fraction. Hahn et al. also observed grain boundaries within the secondary particle size fraction of silicone-quenched fs PLAL.57 Also Shih et al. simulated the multidomain structure formation of a silver droplet jetted in front of the bubble, and this solidified with cooling rates far from thermodynamic equilibrium.7,58 Hence, although our experimental findings on gold show such multi-domain particles to be stable in thermodynamic equilibrium, it does not automatically show that these are the jetted species. Note that twinning (or multi-domain formation) of gold or silver nanoparticles is known to be more prominent at larger sizes, even at thermodynamic equilibrium.
 | ||
| Fig. 6 (a) Mass-weighted gold particle size distribution as measured by ADC of a collected suspension after semi-batch ablation with 12 ps, 1064 nm pulses. (b) Transmission electron micrograph of a distribution of gold particles together with a single magnified particle as inset. | ||
The hydrodynamic size distribution as derived by ADC for gold particles ablated in pure water (Fig. 6a) shows a considerable population of particles above 10 nm in diameter. ADC, of course, does not distinguish between large agglomerates and solid spheres, but probes a hydrodynamic quantity.44 However, when quenching the size distribution by adding rock salt, the resulting particle size distribution shifts to smaller values and the large size fraction is considerably reduced. Still, a minor bump of population at around 30–50 nm persists. Size quenching is presently understood as acting on hindering coalescence during the ripening process, but may not be efficient for the observed early-phase large spheres. Therefore, the early detection of large particles coinciding with large crystal domains at the advancing bubble front shows that (i) the phase explosion process is active in ablation and (ii) these particles are one possible source of large solid spheres that may be resistant to size quenching.
As a side note, the temporal interval between the passing shock wave at about 150 ns and the arrival of the bubble front at 4–6 μs seems to be void of particulate mass, that might be ejected at high speed or dragged by the shock wave. Initial ablation front speed in simulations7 exceeds 500 m s−1, which is, however rapidly decelerated by the contact with liquid water. In the present case of picosecond PLAL the extension of the weak plasma is limited, so that mass accumulation at a considerable distance above the target may not been seen.
4 Conclusions
The understanding of the structure formation process during pulsed laser ablation in liquid requires the disentanglement of hierarchies in time and space. By using in situ X-ray powder diffraction with sub-microsecond time resolution we were able to get closer to the ablation and the mass ablation event during ps PLAL. The picosecond laser ablation revealed a size distribution that bears structural features compatible to an expulsion event: SAXS and WAXS showed particles appearing as soon as the bubble front passes the X-ray probed position. While the bubble front shows an abundance of large structures, the interior of the bubble seems to contain more small particles, often named as primary particles. This agrees with the prediction by Shih et al.,7 where the break-up of a liquid layer and jetting produce large spheres that cool down as soon as they are in contact with the liquid, and where smaller particles are formed from atom-cluster-sized seeds in the mixing region. The temporal mass distribution analysed by WAXS is compatible with a model of relatively homogeneous filling of the bubble with particles, rather than the surface being laden with adsorbed mass.At the same time, an important amount of large, crystalline particles with domain sizes from 15 to 20 nm are detected by WAXS that precede the bubble. These large, compact particles correlate with observations in ex situ analysis, such as TEM. Within the bubble interior, the average crystalline diameter decreases to half of that values (about 8 nm), indicating that the solid mass condensed inside the bubble gets dominated by smaller crystals.
The typical bimodal size distribution of ultrashort-pulsed, aqueous PLAL of noble metals thus shows different sources for the large particle content. While agglomeration and growth by coalescence adds to the broadening of size distribution the large particles produced at the jetting event add to this fraction and may be less susceptible to size quenching by ligands.
We could confirm that solid matter escapes or precedes the bubble with large crystalline domains. The domain size of particles trapped inside the bubble is clearly smaller, with diameters representing the mass-weighted primary diameters found during ex situ TEM later in the free liquid. The assignment of the large fraction found ex situ to the respective fraction detected by in situ X ray scattering, nevertheless, is a difficult task. Here, size-quenching experiments (by anions or ligands11) in future may help to distinguish which species are affected (i.e., if the crystallite size is affected as well, or only the mass fraction detected by SAXS).
Getting the whole picture of where and when which species form inside the cavitation bubble will still need further investigation, stretching MD simulations to longer time scales and driving in situ X-ray experiments to shorter time intervals.
Conflicts of interest
The authors declare no conflicts of interest.Acknowledgements
We wish to acknowledge provision of beamtime at the beamlines ID09 (ESRF) and cSAXS (SLS) and the excellent support by M. Levantino and X. Donath. This work is supported by grants of the German Science Foundation (DFG) under PL325/8-2 and BA3580/15-2 and by the Helmholtz programme MML. We thank B. Pauw and I. Bressler for supplying the McSAS software v1.3, Dr Du from Edgewave for providing us with the 12 ps laser and M. Nasse and Andi Chai for supporting access to the regenerative amplifier at FLUTE. HR-TEM by the Laboratory for Electron Microscopy (LEM, KIT), H. Störmer is acknowledged.References
- B. N. Chichkov, C. Momma, S. Nolte, F. von Alvensleben and A. Tünnermann, Appl. Phys. A: Mater. Sci. Process., 1996, 63, 109–115 CrossRef.
- F. Mafuné, J. Kohno, Y. Takeda and T. Kondow, J. Phys. Chem. B, 2001, 105, 5114 CrossRef.
- V. Amendola and M. Meneghetti, Phys. Chem. Chem. Phys., 2009, 11, 3805–3821 RSC.
- R. Streubel, S. Barcikowski and B. Goekce, Opt. Lett., 2016, 41, 1486–1489 CrossRef CAS PubMed.
- S. Sakaki, H. Ikenoue, T. Tsuji, Y. Ishikawa and N. Koshizaki, Appl. Surf. Sci., 2018, 435, 529–534 CrossRef CAS.
- A. V. Kabashin and M. Meunier, J. Appl. Phys., 2003, 94, 7941–7943 CrossRef CAS.
- C.-Y. Shih, R. Streubel, J. Heberle, A. Letzel, M. V. Shugaev, C. Wu, M. Schmidt, B. Gökce, S. Barcikowski and L. V. Zhigilei, Nanoscale, 2018, 10, 6900–6910 RSC.
- C. Rehbock, V. Merk, L. Gamrad, R. Streubel and S. Barcikowski, Phys. Chem. Chem. Phys., 2013, 15, 3057–3067 RSC.
- G. Marzun, J. Nakamura, X. Zhang, S. Barcikowski and P. Wagener, Appl. Surf. Sci., 2015, 348, 75–84 CrossRef CAS.
- A. Letzel, B. Gökce, P. Wagener, S. Ibrahimkutty, A. Menzel, A. Plech and S. Barcikowski, J. Phys. Chem. C, 2017, 121, 5356 CrossRef CAS.
- A. Letzel, S. Reich, T. dos Santos Rolo, A. Kanitz, J. Hoppius, A. Rack, M. Olbinado, A. Ostendorf, B. Gökce, A. Plech and S. Barcikowski, Langmuir, 2019, 35, 3038 CrossRef CAS PubMed.
- C.-Y. Shih, C. Wu, M. V. Shugaev and L. V. Zhigilei, J. Colloid Interface Sci., 2017, 489, 3 CrossRef CAS PubMed.
- S. Jendrzej, B. Gökce, V. Amendola and S. Barcikowski, J. Colloid Interface Sci., 2016, 463, 299–307 CrossRef CAS PubMed.
- S. Reich, P. Schönfeld, P. Wagener, A. Letzel, S. Ibrahimkutty, B. Gökce, S. Barcikowski, A. Menzel, T. dos Santos Rolo and A. Plech, J. Colloid Interface Sci., 2017, 489, 106 CrossRef CAS PubMed.
- B. Kumar, D. Yadav and R. K. Thareja, J. Appl. Phys., 2011, 110, 074903 CrossRef.
- T. Sakka, A. Tamura, A. Matsumoto, K. Fukami, N. Nishi and B. Thornton, Spectrochim. Acta, Part B, 2014, 97, 94 CrossRef CAS.
- J. Lam, D. Amans, F. Chaput, M. Diouf, G. Ledoux, N. Mary, K. Masenelli-Varlot, V. Motto-Ros and C. Dujardin, Phys. Chem. Chem. Phys., 2014, 16, 963–973 RSC.
- M. R. Gavrilović, M. Cvejić, V. Lazić and S. Jovićević, Phys. Chem. Chem. Phys., 2016, 18, 14629 RSC.
- A. Matsumoto, A. Tamura, K. Fukami, Y. H. Ogata and T. Sakka, J. Appl. Phys., 2013, 113, 053302 CrossRef.
- K. K. Kim, M. Roy, H. Kwon, J. K. Song and S. M. Park, J. Appl. Phys., 2015, 117, 074302 CrossRef.
- J. R. Creel and J. G. Lunney, Appl. Phys. A: Mater. Sci. Process., 2018, 124, 124 CrossRef.
- J. Lam, J. Lombard, C. Dujardin, G. Ledoux, S. Merabia and D. Amans, Appl. Phys. Lett., 2016, 108, 074104 CrossRef.
- S. Ibrahimkutty, P. Wagener, A. Menzel, A. Plech and S. Barcikowski, Appl. Phys. Lett., 2012, 101, 103104 CrossRef.
- S. Ibrahimkutty, P. Wagener, T. dos Santos Rolo, D. Karpov, A. Menzel, T. Baumbach, S. Barcikowski and A. Plech, Sci. Rep., 2015, 5, 16313 CrossRef CAS PubMed.
- S. Reich, T. dos Santos Rolo, A. Letzel, T. Baumbach and A. Plech, Appl. Phys. Lett., 2018, 112, 151903 CrossRef.
- T. dos Santos Rolo, S. Reich, D. Karpov, S. Gasilov, T. Baumbach, D. Kunka and A. Plech, Appl. Sci., 2018, 8, 737 CrossRef.
- M. Fischer, J. Hormes, G. Marzun, P. Wagener, U. Hagemann and S. Barcikowski, Langmuir, 2016, 32, 8793–8802 CrossRef CAS PubMed.
- P. Wagener, J. Jakobi, C. Rehbock, V. S. K. Chakravadhanula, C. Thede, U. Wiedwald, M. Bartsch, L. Kienle and S. Barcikowski, Sci. Rep., 2016, 6, 23352 CrossRef CAS PubMed.
- S. Reich, J. Göttlicher, A. Letzel, B. Gökce, B. Barcikowski, T. dos Santos Rolo, T. Baumbach and A. Plech, Appl. Phys. A: Mater. Sci. Process., 2018, 124, 71 CrossRef.
- M. J. Nasse, M. Schuh, S. Naknaimueang, M. Schwarz, A. Plech, Y.-L. Mathis, R. Rossmanith, P. Wesolowski, E. Huttel, M. Schmelling and A.-S. Müller, Rev. Sci. Instrum., 2013, 84, 022705 CrossRef CAS PubMed.
- M. Cammarata, L. Eybert, F. Ewald, W. Reichenbach, M. Wulff, P. Anfinrud, F. Schotte, A. Plech, Q. Kong, M. Lorenc, B. Lindenau, J. Räbiger and S. Polachowski, Rev. Sci. Instrum., 2009, 80, 15101 CrossRef PubMed.
- P. Sondhauss, J. Larsson, M. Harbst, G. A. Naylor, A. Plech, K. Scheidt, O. Synnergren, M. Wulff and J. S. Wark, Phys. Rev. Lett., 2005, 94, 125509 CrossRef CAS PubMed.
- A. Plech, S. Ibrahimkutty, S. Reich and G. Newby, Nanoscale, 2017, 9, 17284–17292 RSC.
- B. R. Pauw, J. S. Pedersen, S. Tardif, M. Takata and B. B. Iversen, J. Appl. Crystallogr., 2013, 46, 365–371 CrossRef CAS PubMed.
- G. Porod, Kolloid-Z., 1952, 125, 51 CrossRef CAS and 108.
- S. Richter, A. Plech, M. Steinert, M. Heinrich, S. Döring, F. Zimmermann, U. Peschel, E. Bernhard Kley, A. Tünnermann and S. Nolte, Laser Photonics Rev., 2012, 6, 787 CrossRef.
- A. Plech, V. Kotaidis, M. Lorenc and M. Wulff, Chem. Phys. Lett., 2005, 401, 565 CrossRef CAS.
- V. Kotaidis and A. Plech, Appl. Phys. Lett., 2005, 87, 213102 CrossRef.
- V. Kotaidis, C. Dahmen, G. von Plessen, F. Springer and A. Plech, J. Chem. Phys., 2006, 124, 184702 CrossRef CAS PubMed.
- B. E. Warren, X-ray Diffraction, reprint, Dover Publications, New York, 1990 Search PubMed.
- F. Ciesa and A. Plech, J. Colloid Interface Sci., 2010, 346, 1 CrossRef CAS PubMed.
- F. Tantussi, G. C. Messina, R. Capozza, M. Dipalo, L. Lovato and F. De Angelis, ACS Nano, 2018, 12, 4116–4122 CrossRef CAS PubMed.
- S. Reich, P. Schönfeld, A. Letzel, S. Kohsakowski, M. Olbinado, B. Gökce, S. Barcikowski and A. Plech, ChemPhysChem, 2017, 18, 1084 CrossRef CAS PubMed.
- A. Letzel, B. Gökce, A. Menzel, A. Plech and S. Barcikowski, Appl. Surf. Sci., 2018, 435, 743–751 CrossRef CAS.
- J. Noack and A. Vogel, IEEE J. Quantum Electron., 1999, 35, 1156–1167 CrossRef CAS.
- B. C. Stuart, M. D. Feit, S. Herman, A. M. Rubenchik, B. W. Shore and M. D. Perry, J. Opt. Soc. Am. B, 1996, 13, 459 CrossRef CAS.
- S. K. Sundaram and E. Mazur, Nat. Mater., 2002, 1, 217–224 CrossRef CAS PubMed.
- W. Soliman, N. Takada and K. Sasaki, Appl. Phys. Express, 2010, 3, 035201 CrossRef.
- N. Dabir-Moghaddam, Z. Liu and B. Wu, J. Appl. Phys., 2017, 121, 044908 CrossRef.
- F. R. Gilmore, Calif. Inst. Tech. Rep, 1952, pp. 26–24 Search PubMed.
- A. Vogel, S. Busch and U. Parlitz, J. Acoust. Soc. Am., 1996, 100, 148–165 CrossRef.
- J. Holzfuss, Proc. R. Soc. London, Ser. A, 2010, 466, 1829–1847 CrossRef CAS.
- D. Fuster, C. Dopazo and G. Hauke, J. Acoust. Soc. Am., 2011, 129, 122 CrossRef CAS PubMed.
- P. Wagener, S. Ibrahimkutty, A. Menzel, A. Plech and S. Barcikowski, Phys. Chem. Chem. Phys., 2013, 15, 3068 RSC.
- A. Plech, V. Kotaidis, S. Grésillon, C. Dahmen and G. von Plessen, Phys. Rev. B: Condens. Matter Mater. Phys., 2004, 70, 195423 CrossRef.
- O. Prymak, J. Jakobi, C. Rehbock, M. Epple and S. Barcikowski, Mater. Chem. Phys., 2018, 207, 442–450 CrossRef CAS.
- A. Hahn, G. Brandes, P. Wagener and S. Barcikowski, J. Controlled Release, 2011, 154, 164–170 CrossRef CAS PubMed.
- C.-Y. Shih, M. V. Shugaev, C. Wu and L. V. Zhigilei, J. Phys. Chem. C, 2017, 121, 16549–16567 CrossRef CAS PubMed.
Footnote |
| † Electronic supplementary information (ESI) available. See DOI: 10.1039/C9NR01203F |
| This journal is © The Royal Society of Chemistry 2019 |