 Open Access Article
Doping of thiolate protected gold clusters through reaction with metal surfaces†
Rania
Kazan
a,
Ulrich
Müller
 b and
Thomas
Bürgi
 *a
*a
aDepartment of Physical Chemistry, University of Geneva, 30 Quai Ernest-Ansermet, CH-1211 Geneva 4, Switzerland. E-mail: Thomas.Buergi@unige.ch
bEmpa, Swiss Federal Laboratories for Materials Science and Technology, Laboratory for Nanoscale Materials Science, CH-8600 Dübendorf, Switzerland
First published on 23rd January 2019
Abstract
A new technique is introduced for doping gold nanoclusters by using a metal surface such as Ag, Cu and Cd as a source of heteroatoms. The importance of the thiol ligand in the doping process is examined by following the reactions with MALDI-TOF mass spectrometry in the presence and the absence of the thiols on the surface. The doping reactions depend greatly on the type of the cluster and the availability of the ligand which is a crucial element for alloying. The thiol acts as a messenger exchanging the metal atoms between the cluster and the metal surface as revealed by the XPS studies performed on the metal surfaces.
Introduction
Monolayer protected gold nanoclusters have gained substantial attention in the last decades due to their precise atomic composition and their well-defined structure.1,2 The clusters are typically composed of a gold core protected by an organic monolayer of SR-(Au-SR-)n (SR: thiolate) staple units.3In recent years many experimental and theoretical studies have investigated the doping of such clusters by metal heteroatoms that were incorporated into their core and staples to tailor their physical and chemical properties respectively.4–9 Among the clusters, Au25 and Au38 were the most commonly used templates for such reactions, where foreign atoms such as Cu,7,9–17 Ag7,9,14,15,18–22 and Cd9,21 were successfully doped into their structures with the aim to enhance their photoluminescence and surface flexibility.11–14,23
Recently, Pradeep and co-workers reported intercluster reactions.24 These reactions served as a new doping technique, where AgAu alloy clusters were synthesized by the exchange of metal atoms between the Agn(SR)m (n = 44,25 and m = 30,18) and the Au25(SR)18 reacting clusters respectively.24,25 This shed light on the molecule-like chemical reactivity of the clusters and their dynamic character adding thus a completely new view on the nature of these clusters.
Some effort was made to uncover the mechanism behind intercluster reactions.25–27 Experiments using membranes indicate a collision mechanism between the reacting clusters rather than the exchange of small species between them.28 However, the detailed aspects of this mechanism remain to be explored.
Here we replace one reacting cluster by a solid surface and we show that metal exchange takes place in a cluster–surface reaction. We therefore introduce a facile new technique to dope gold nanoclusters by using a metal foil as a source of heteroatoms. We furthermore examine the importance and the role of the thiol ligand in the doping process by performing the doping reactions in the presence and the absence of the thiol ligands on the metal surface. The corresponding experiments are not possible for reactions between clusters because pure metal clusters are not stable in solution. Silver, copper and cadmium foils were employed to dope Au25 and Au38 nanoclusters, respectively. The doping reactions were followed over time by MALDI-TOF mass spectrometry. Furthermore, XPS studies were conducted on the Ag and Cu surfaces reacted with Au25 nanocluster to further understand the doping mechanism. The thiol plays the key role in the exchange of metal atoms between cluster and surface and the reaction is strongly depending on the nature of the cluster (Au25vs. Au38) and the metal.
Experimental
Materials and methods
All chemicals were purchased from standard suppliers and used as received. Nanopure water (>18 MΩ cm) was used.The silver foil (99.9% pure and 0.127 mm thickness) was purchased from Strem Chemicals, Inc. Copper foil (Cu-ETP, 99.9% purity and 0.5 mm thickness) was purchased from Euralliag. Cadmium foil (99.99975% pure and 0.25 mm thickness) was purchased from Alfa Aesar.
Mass spectra were obtained using a Bruker Autoflex mass spectrometer equipped with a nitrogen laser at near threshold laser fluence in positive linear mode. [3-(4-tert-Butylphenyl)-2-methyl-2-propenylidene] malononitrile (DCTB) was used as the matrix with a 1![[thin space (1/6-em)]](https://www.rsc.org/images/entities/char_2009.gif) :
:![[thin space (1/6-em)]](https://www.rsc.org/images/entities/char_2009.gif) 10, 1
10, 1![[thin space (1/6-em)]](https://www.rsc.org/images/entities/char_2009.gif) :
:![[thin space (1/6-em)]](https://www.rsc.org/images/entities/char_2009.gif) 100 and 1
100 and 1![[thin space (1/6-em)]](https://www.rsc.org/images/entities/char_2009.gif) :
:![[thin space (1/6-em)]](https://www.rsc.org/images/entities/char_2009.gif) 1000 analyte
1000 analyte![[thin space (1/6-em)]](https://www.rsc.org/images/entities/char_2009.gif) :
:![[thin space (1/6-em)]](https://www.rsc.org/images/entities/char_2009.gif) matrix ratio. A volume of 2 μL of the analyte/matrix mixture was applied to the target and air-dried.
matrix ratio. A volume of 2 μL of the analyte/matrix mixture was applied to the target and air-dried.
XPS spectra were acquired on a Physical Electronics29 (PHI) Quantum 2000 Scanning ESCA Microprobe System using monochromated Al Kα radiation (hν = 1486.7 eV) and a hemispherical capacitor electron-energy analyser equipped with a channel plate and a position-sensitive detector. The electron take-off angle was 45° and the analyser was operated in the constant pass energy mode at 29.35 eV for the spectra of the Au 4f peak and a step size of 0.25 eV was used. The beam diameter is typically 150 μm. The binding energy is calibrated using Cu 2p3/2, Ag 3d5/2 and Au 4f7/2 at 932.62 eV, 368.21 eV and 83.96 eV, respectively to within ±0.1 eV [see ISO 15472; 2010-05]. A control measurement on a pure Au foil immediately after yielded an Au 4f7 peak position of 84.12 eV, so a shift of 0.16 eV. To compensate for eventual surface charging, built-in electron and argon ion neutralizers were used. The base pressure of the system was below 5 × 10⁻⁷ Pa.
The spectra were analysed using the software MultiPak 8.2B.29 The atomic concentrations were calculated using the corrected relative sensitivity factors as given by the manufacturer and normalized to 100 at%. The uncertainty is around 10% relative.
Ultraviolet–visible spectra of the nanoclusters were recorded on a Varian Cary 50 spectrophotometer using a quartz cuvette of 1 cm path length. Spectra were measured in toluene and normalized at 400 nm.
Cleaning and preparation of metal surfaces
Before their reaction with the gold nanoclusters, the foils of ∼2 cm2 surface area were cut into four pieces and cleaned to remove surface contaminations. Mild cleaning procedure was applied, where silver and cadmium foils were rinsed several times by ethanol and then dried under nitrogen stream. Similarly, copper foils were first polished by diamond paste and then rinsed successively with acetone and ethanol to be later dried under nitrogen.The thiol covered surfaces were prepared by further submerging the clean foils into a 1 mM ethanolic solution of 2-phenylethanethiol (2-PET) for ∼24 h at room temperature to allow the deposition of the thiol monolayers on their surface. After deposition, excess thiols were removed from the surface by rinsing the sample thoroughly with ethanol and drying it under a stream of nitrogen.
Reaction of gold nanoclusters with the metal surface
First, Au38(2-PET)24 and Au25(2-PET)18 nanoclusters were synthesized by following the methods reported by Qian et al., and Lu et al. respectively.30,31 The synthesized clusters were characterized by MALDI mass spectrometry (Fig. S1†) and their UV-Vis spectra were recorded (Fig. S2†).Then, the doping reactions were performed easily by mixing the gold nanoclusters with the corresponding metal foil in a 5 mL round bottom flask and adding 1.4 mL of toluene to completely cover the foils. The reactions were stirred with the help of the PSU-10i orbital shaker at 200 rpm to avoid any mechanical abrasion, and samples of equivalent volumes were taken at different time intervals throughout the reaction to be dried and analysed by MALDI mass spectrometry.
The concentration of the cluster in the reaction mixture must be adapted to the surface area of the foil. For too concentrated solutions of the cluster the exchanged metal atoms are too diluted within the reacting cluster sample, leading to very low average exchange numbers. The concentrations needed were roughly estimated by comparing the number of reacting clusters to the number of surface atoms on the foil (number of adsorbed thiolates on the foil). The estimate is provided in the ESI.†
Results and discussion
First, the Ag heteroatom doping of the Au25 nanocluster was investigated. The reactions were performed in the presence and the absence of the thiolate ligands on the surface of the silver foil respectively. The composition of the reaction mixtures was followed by MALDI mass spectrometry over the time span of 25 hours where samples were taken at different reaction times.Fig. 1 shows the composition of the clusters after 2 min, 1 h, 3 h, 5 h, 8 h and 25 h of reaction respectively, in the presence of the thiolates on the silver surface. A distribution of peaks corresponding to Au25−xAgx(2-PET)18 clusters with up to four Ag atoms doped into Au25 was observed after only two minutes. A clear shift of the MALDI peaks towards lower masses, corresponding to higher Ag doping numbers, was detected for longer reaction times (Fig. 1a). This shows that Au25−xAgx(2-PET)18 doped nanoclusters were successfully obtained using the silver foil as a source of Ag heteroatoms.
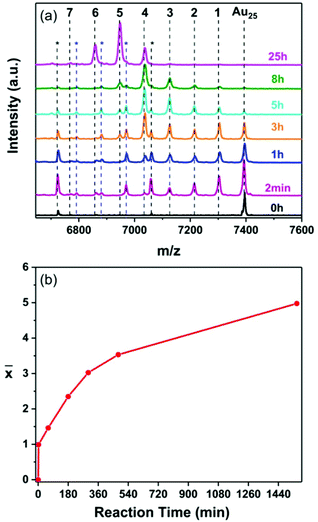 | ||
Fig. 1 (a) MALDI mass spectra of the samples taken at different times during the reaction of Au25(2-PET)18 nanocluster with the Ag surface modified by 2-PET. The number of doped Ag atoms is marked in black above the corresponding peak where MAu25 = 7391 Da (Fig. S1b†) and the mass difference between Au and Ag is 89.1 Da. The peaks marked with a black asterisk correspond to the loss of Au–L units from the parent cluster and the ones with a blue asterisk correspond to the loss of Au–L units from Au24Ag1(SR)18, Au23Ag2(SR)18 and Au22Ag3(SR)18 respectively. (b) The average number of doped Ag atoms (![[x with combining macron]](https://www.rsc.org/images/entities/i_char_0078_0304.gif) ) in the cluster, as determined by MALDI, as a function of reaction time. ) in the cluster, as determined by MALDI, as a function of reaction time. | ||
Interestingly the average number of doped heteroatoms ![[x with combining macron]](https://www.rsc.org/images/entities/i_char_0078_0304.gif) as a function of time reveals a two phase kinetics (Fig. 1b): initially the reaction is extremely fast with a rate of 0.496 exchanged atoms per cluster and per minute, followed by a slower rate of 0.0068 exchanged atoms per cluster and per minute. The rate then further decreases with time.
as a function of time reveals a two phase kinetics (Fig. 1b): initially the reaction is extremely fast with a rate of 0.496 exchanged atoms per cluster and per minute, followed by a slower rate of 0.0068 exchanged atoms per cluster and per minute. The rate then further decreases with time.
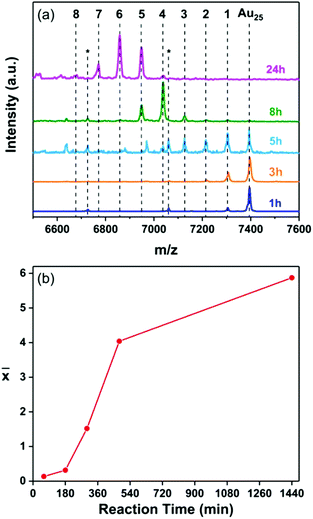
Au25−xAgx(2-PET)18 alloy nanoclusters were also detected in the absence of the 2-PET ligand on the silver surface (Fig. 2). The number of the incorporated Ag atoms is noticed to increase with the reaction time (Fig. 2a). However, compared to the experiment where the silver foils were pre-covered with thiols (Fig. 1), the kinetics is completely different.
In the presence of adsorbed thiol on the silver foil the kinetics is initially extremely fast and slows down considerably afterwards. In the case of the neat silver foil, the reaction is very slow initially and increases its rate after about three hours only. The average number of incorporated silver atoms ![[x with combining macron]](https://www.rsc.org/images/entities/i_char_0078_0304.gif) in the cluster in Fig. 2b shows a sigmoidal trend with an induction period of three hours. This shows that the pre-adsorbed thiol on the foil plays an important role in this cluster–surface reaction.
in the cluster in Fig. 2b shows a sigmoidal trend with an induction period of three hours. This shows that the pre-adsorbed thiol on the foil plays an important role in this cluster–surface reaction.
It is noteworthy that the sigmoidal behaviour observed herein is usually seen in autocatalytic reactions. These reactions proceed slowly at the start (the induction period) because there is little catalyst present, before their rate increases progressively as the amount of the catalyst increases. Therefore, the doping reaction in absence of the thiol on the surface of the foil bears similarities with an autocatalytic reaction. The “catalyst” in this case could be the thiolate on the surface. Since the surface is not covered initially by 2-PET, the latter could be deposited on the surface upon the gradual decomposition of the Au25 cluster on it as will be discussed later.32 In view of the very fast reaction in the presence of the initially 2-PET covered foil the decomposition rate seems comparably negligible in that case, at least at the beginning of the reaction.
The question arises why during the reaction the rate decreases by almost two orders of magnitude after short reaction time in the presence of pre-adsorbed thiol (Fig. 1). Compared to the small amount of cluster used in the experiments the silver foil represents an almost infinitely large reservoir of silver atoms. However, only the atoms at the surface are accessible for the reacting gold clusters. The reaction between cluster and surface leads to the deposition of gold on the surface (metal atom exchange, see below). This slows down the apparent reaction rate because an exchange of a gold atom from the surface with a gold atom in the cluster has no net effect. In order to test this hypothesis we estimated the amount of gold deposited on the silver surface (monolayers) by the exchange of one metal atom with the cluster (![[x with combining macron]](https://www.rsc.org/images/entities/i_char_0078_0304.gif) = 1) (Table S1†). This value is reached after about two minutes reaction time (Fig. 1). This estimate is easily done by relating the number of clusters in the reactor to the number of silver surface atoms of the foil. The latter number can only be estimated as the foil is polycristalline. This estimate yields a value of about 0.33 monolayers of exchanged metal atoms. After that the reaction slows down considerably. Although this is a rough estimate the value is on the same order of magnitude as a monolayer thus supporting the hypothesis that the slowing down of the reaction is related to the deposition of gold on the sliver foil. The fact that the estimate is below one full monolayer could mean that not all the surface silver atoms are exchangable. In fact, the experiment in the absence of pre-adsorbed thiolate shows that (initially) the surface silver atoms do not react with the cluster. Taking this together indicates that only the silver atoms attached to thiolates (possibly silver ad-atoms) are exchangable with gold atoms from the cluster. The coverage of 0.33 mentioned above could then correspond to these ad-atoms.
= 1) (Table S1†). This value is reached after about two minutes reaction time (Fig. 1). This estimate is easily done by relating the number of clusters in the reactor to the number of silver surface atoms of the foil. The latter number can only be estimated as the foil is polycristalline. This estimate yields a value of about 0.33 monolayers of exchanged metal atoms. After that the reaction slows down considerably. Although this is a rough estimate the value is on the same order of magnitude as a monolayer thus supporting the hypothesis that the slowing down of the reaction is related to the deposition of gold on the sliver foil. The fact that the estimate is below one full monolayer could mean that not all the surface silver atoms are exchangable. In fact, the experiment in the absence of pre-adsorbed thiolate shows that (initially) the surface silver atoms do not react with the cluster. Taking this together indicates that only the silver atoms attached to thiolates (possibly silver ad-atoms) are exchangable with gold atoms from the cluster. The coverage of 0.33 mentioned above could then correspond to these ad-atoms.
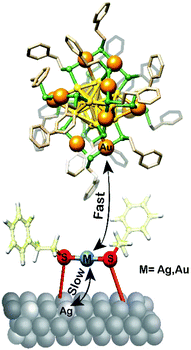
After the initially fast reaction of the exchangeable silver atoms the reaction continues, although at slower rate. This slower kinetics reflects replacement of gold atoms by silver at the exchangeable sites as depicted in Scheme 1.
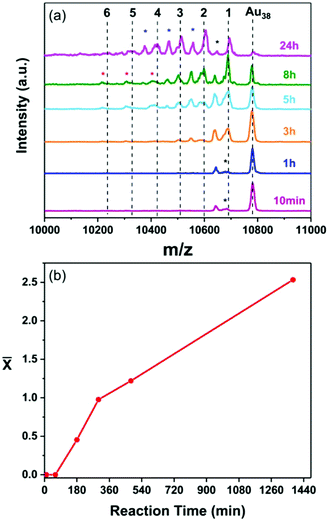
To exclude the possibility that this cluster–surface reaction is a unique property of Au25 both reactions, with and without the adsorbed thiolate monolayer, were performed using the Au38 nanocluster. Fig. 3a and 4a show the MALDI mass spectra of both reactions taken at different reaction times. As in the case of Au25 nanocluster, Au38−xAgx alloy clusters are detected in both cases, indifferent of the availability of thiol on the metal surface.
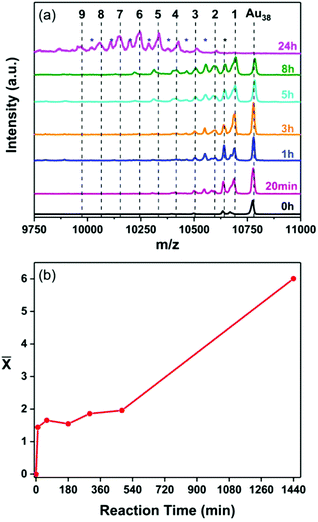 | ||
Fig. 3 (a) MALDI mass spectra of the samples taken at different times during the reaction of Au38(2-PET)24 nanocluster with the 2-PET-modified Ag-surface where MAu38 = 10![[thin space (1/6-em)]](https://www.rsc.org/images/entities/char_2009.gif) 778 Da (Fig. S1a†) and MAu–MAg = 89.1 Da. The number of doped Ag atoms is marked in black above the corresponding peak. The peaks marked with a blue asterisk correspond to the loss of L unit from the subsequent doped cluster. The peak with a black asterisk corresponds to Au38(2-PET)23 species. (b) The average number of doped Ag atoms ( 778 Da (Fig. S1a†) and MAu–MAg = 89.1 Da. The number of doped Ag atoms is marked in black above the corresponding peak. The peaks marked with a blue asterisk correspond to the loss of L unit from the subsequent doped cluster. The peak with a black asterisk corresponds to Au38(2-PET)23 species. (b) The average number of doped Ag atoms (![[x with combining macron]](https://www.rsc.org/images/entities/i_char_0078_0304.gif) ) as a function of time. ) as a function of time. | ||
Like for Au25 the Ag doping reaction of Au38 nanocluster shows a two-phase trend when the thiol is pre-adsorbed on the surface (Fig. 3b). In the absence of the thiol the reaction is initially slow and accelerates afterwards, similar to the Au25 case discussed above (Fig. 4b).
It is worth mentioning that unlike the Au25 where the doping takes place easily, silver doping of the Au38 nanocluster in the presence of the adsorbed thiol is less effective with only two doped atoms after 8 hours (Fig. 3a). This agrees with what was previously reported in the literature for doping by direct synthesis where up to 21 Ag atoms could be doped into Au25![[thin space (1/6-em)]](https://www.rsc.org/images/entities/char_2009.gif) 33 while only nine atoms could be introduced into the Au38 structure.34
33 while only nine atoms could be introduced into the Au38 structure.34
In the light of the successful doping of the Au25 and Au38 nanoclusters by using the silver foil as a source of heteroatoms, this technique was further employed to obtain copper and cadmium doped clusters by conducting analogous experiments with a copper and a cadmium foil, respectively.
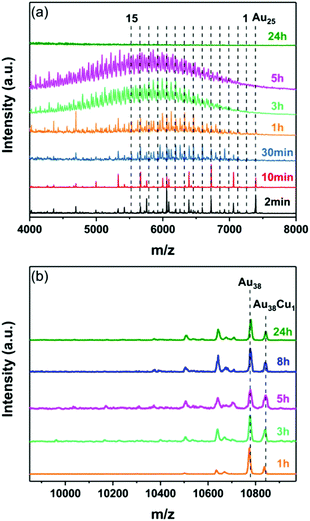
As in the case of Ag, the foil serves as a source of Cu heteroatoms. While for Au25 a monodoped cluster is observed within only 2 minutes (weak peak in the MALDI, Fig. 5a, black trace), no copper alloy cluster formed when using the Au38 cluster, and a Au38Cu1 adduct is solely observed even after 24 hours.
Such adduct was also reported by us recently when reacting Au38 nanocluster with Cu(I)-SR complex.17 This reflects once again the dissimilarity in the doping behaviour of the two clusters.
It is noteworthy that a maximum of 15 copper atoms can be incorporated into Au25 after 1 hour (Fig. 5a). With longer reaction times the MALDI mass spectra become more and more complex due to the overlap between the Au25−xCux peaks and the fragmentation peaks. A MALDI mass spectrum with less fragmentation (of another experiment) is provided in the ESI (Fig. S4†).
After 24 hours no peaks were observed anymore in the mass range of the Au25−xCux cluster which we ascribe to the total decomposition of the cluster. It has been shown before that heavily copper doped clusters are unstable.35
In the same manner, Au25 nanoclusters reacted readily with the Cd foil covered with the 2-PET thiol and mono-doped Cd1Au24 product was exclusively detected (m/z = 7309 Da, Fig. 6a). This is similar to what was reported earlier by Wang et al.36 Nevertheless, the Au38 nanocluster remained intact and no Cd doped clusters were observed (Fig. 6b).
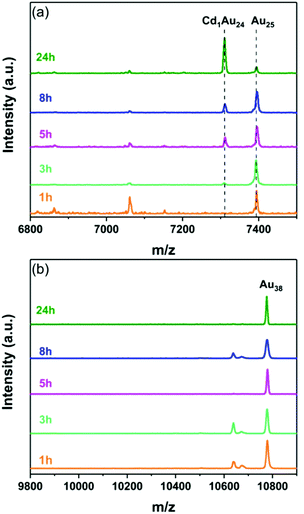 | ||
| Fig. 6 MALDI mass spectra of the samples taken at different times during the reaction of Au25(2-PET)18 (a) and Au38(2-PET)24 nanoclusters (b) with Cd surface modified by 2-PET. | ||
Interestingly, in the absence of 2-PET thiol on the Cu and Cd surfaces, neither Au25 nor Au38 alloy clusters were obtained (Fig. S5 and S6†), in contrast to the experiments with silver. A possible explanation is that on Cu and Cd foils, the gold clusters do not decompose thus avoiding the thiol deposition on their surface and therefore the doping reaction.
The experiments presented above demonstrate that this new doping method can serve as a facile and fast technique to obtain alloy clusters and provide a conclusive evidence that the thiol is a key factor in doping gold nanoclusters.
MALDI mass spectrometry provides information on the reacting cluster only. X-ray photoelectron spectroscopy (XPS) was used to study the other reaction partner, i.e. the surface.
Measurements were carried out on the thiol covered and free surfaces of silver and copper substrates that were employed in the doping reactions of the Au25 nanocluster respectively. This was done by removing from the reaction mixture four different pieces of the foil at certain times (two pieces in the case of thiol-free Cu surface). The pieces were copiously washed with toluene immediately after removal. For the same reaction, cluster solution was sampled at the corresponding times and analysed by mass spectrometry.
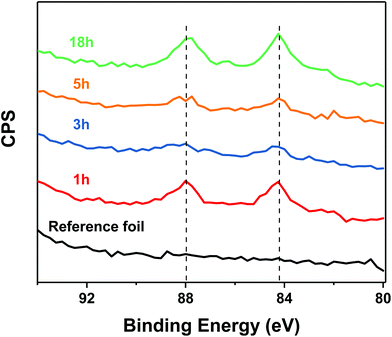
Fig. 7 shows the XPS spectra (Au 4f7/2 and Au 4f5/2) of the reaction between Au25 and the Ag substrate covered with 2-PET and the spectrum of the unreacted thiol-modified foil for comparison. Unlike the reference foil, the reacted foils showed a peak corresponding to Au 4f7/2 at 84.25 eV and Au 4f5/2 at 87.92 eV (Fig. 7). Thus, XPS confirms the presence of gold on the silver surface, as expected for a metal exchange reaction. In agreement with the MALDI experiments (Fig. S7†) the XPS show gold on the surface already at short reaction times. The [Au]/([Au] + [Ag]) ratio remains around 0.5% and for 5 hours and increases after that (Fig. S8a†).
Moreover, by comparing the average number of silver atoms in the cluster (Fig. S8b†) to the fraction of gold on the silver surface ([Au]/([Au] + [Ag]) (Fig. S8a†) as a function of time, one can see that the two are correlated. Both show a fast jump from zero to a value that remains approximately stable for five hours and an increase afterwards. This correlation is further evidence for the metal exchange between cluster and foil.
As expected, all these samples show the presence of sulphur on the surface (Table S2†), in similar amounts as the reference sample (silver foil with pre-adsorbed 2-PET).
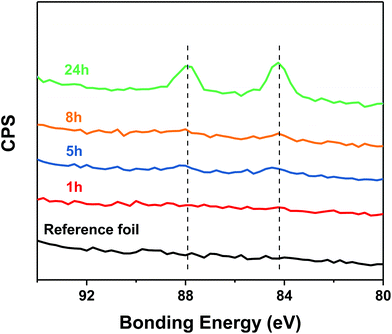
Likewise, the surface compositions of the thiol free silver foils reacted with Au25 were followed by XPS. As Fig. 8 shows, no gold could be detected after one hour reaction time, in contrast to the reaction with the silver foil that was pre-treated with 2-PET. However, after longer reaction time the XPS spectra show evidence for gold, in agreement with the MALDI experiments (Fig. S9 and S10†). In addition, sulphur could be detected (after 1 hour) on the silver foil, although the surface was initially thiol free (Table S3†).
Taken together, these observations indicate the decomposition of the Au25 cluster on the surface leading to the deposition of the thiols and the gold atoms on the foil.32
The XPS results confirm that the thiol is a key factor in the doping of the gold cluster and suggest that the latter plays the role of a “messenger” exchanging the silver and gold atoms between the cluster and the surface.
The experiments of Au25 with the copper foils reveal similar results. In the presence of the thiol ligand on the foil, Au25−xCux(2-PET)18 clusters were detected in MALDI (Fig. S11a†) and gold could be detected by XPS already at short reaction times (Fig. S12a†). These observations are completely different from the ones obtained in the absence of thiol ligand (Fig. S11b and S12b†) on the foil.
In this experiment no doping takes place according to MALDI and no gold can be detected on the Cu foil by XPS, at least at the beginning of the reaction.
Conclusions
A novel method to dope thiolate protected gold nanoclusters is presented where metal surfaces of silver, copper and cadmium were used to dope Au25 and Au38 nanoclusters, respectively in a cluster–surface metal exchange reaction. A strong difference in the doping behaviour of these clusters was detected depending on the nature of the metal surface used. Moreover, the role of the ligand and its importance in the doping reactions were investigated. The thiol was found to play the key role for exchanging the gold and the heterometal atoms between the cluster and the metal surface. It was found that the exchange reaction between silver foils that were pre-treated with thiols and gold clusters was initially extremely fast, followed by a much slower reaction. This result indicates that not all the surface atoms are easily exchangeable. In contrast, for thiol free surfaces the reaction is initially slow and accelerates once thiolates are deposited on the foil due to some decomposition of the clusters. This new type of cluster–surface reaction allows one to obtain surface alloys in a fast and easy manner.Conflicts of interest
There are no conflicts to declare.Acknowledgements
Generous support by the University of Geneva and the Swiss National Science Foundation (grant number 200020_172511) is kindly acknowledged.Notes and references
- I. Chakraborty and T. Pradeep, Chem. Rev., 2017, 117, 8208–8271 CrossRef CAS PubMed.
- R. Jin, C. Zeng, M. Zhou and Y. Chen, Chem. Rev., 2016, 116, 10346–10413 CrossRef CAS PubMed.
- P. D. Jadzinsky, G. Calero, C. J. Ackerson, D. A. Bushnell and R. D. Kornberg, Science, 2007, 318, 430–433 CrossRef CAS PubMed.
- R. Jin and K. Nobusada, Nano Res., 2014, 7, 285–300 CrossRef CAS.
- Y. Negishi, W. Kurashige, Y. Niihori, T. Iwasa and K. Nobusada, Phys. Chem. Chem. Phys., 2010, 12, 6219–6225 RSC.
- Y. Negishi, K. Igarashi, K. Munakata, W. Ohgake and K. Nobusada, Chem. Commun., 2012, 48, 660–662 RSC.
- S. Sharma, S. Yamazoe, T. Ono, W. Kurashige, Y. Niihori, K. Nobusada, T. Tsukuda and Y. Negishi, Dalton Trans., 2016, 45, 18064–18068 RSC.
- H. Qian, D.-e. Jiang, G. Li, C. Gayathri, A. Das, R. R. Gil and R. Jin, J. Am. Chem. Soc., 2012, 134, 16159–16162 CrossRef CAS PubMed.
- S. Wang, Y. Song, S. Jin, X. Liu, J. Zhang, Y. Pei, X. Meng, M. Chen, P. Li and M. Zhu, J. Am. Chem. Soc., 2015, 137, 4018–4021 CrossRef CAS PubMed.
- S. Sharma, W. Kurashige, K. Nobusada and Y. Negishi, Nanoscale, 2015, 7, 10606–10612 RSC.
- W. Kurashige, K. Munakata, K. Nobusada and Y. Negishi, Chem. Commun., 2013, 49, 5447–5449 RSC.
- Y. Negishi, K. Munakata, W. Ohgake and K. Nobusada, J. Phys. Chem. Lett., 2012, 3, 2209–2214 CrossRef CAS PubMed.
- A. C. Dharmaratne and A. Dass, Chem. Commun., 2014, 50, 1722–1724 RSC.
- S. Yamazoe, W. Kurashige, K. Nobusada, Y. Negishi and T. Tsukuda, J. Phys. Chem. C, 2014, 118, 25284–25290 CrossRef CAS.
- J.-P. Choi, C. A. Fields-Zinna, R. L. Stiles, R. Balasubramanian, A. D. Douglas, M. C. Crowe and R. W. Murray, J. Phys. Chem. C, 2010, 114, 15890–15896 CrossRef CAS.
- J. Chai, Y. Lv, S. Yang, Y. Song, X. Zan, Q. Li, H. Yu, M. Wu and M. Zhu, J. Phys. Chem. C, 2017, 121, 21665–21669 CrossRef CAS.
- R. Kazan, B. Zhang and T. Burgi, Dalton Trans., 2017, 46, 7708–7713 RSC.
- C. Kumara and A. Dass, Nanoscale, 2011, 3, 3064–3067 RSC.
- C. Kumara and A. Dass, Nanoscale, 2012, 4, 4084–4086 RSC.
- N. Yan, L. Liao, J. Yuan, Y.-j. Lin, L.-h. Weng, J. Yang and Z. Wu, Chem. Mater., 2016, 28, 8240–8247 CrossRef CAS.
- S. Yang, S. Wang, S. Jin, S. Chen, H. Sheng and M. Zhu, Nanoscale, 2015, 7, 10005–10007 RSC.
- C. Yao, J. Chen, M.-B. Li, L. Liu, J. Yang and Z. Wu, Nano Lett., 2015, 15, 1281–1287 CrossRef CAS PubMed.
- B. Zhang and T. Bürgi, J. Phys. Chem. C, 2016, 120, 4660–4666 CrossRef CAS.
- K. R. Krishnadas, A. Ghosh, A. Baksi, I. Chakraborty, G. Natarajan and T. Pradeep, J. Am. Chem. Soc., 2016, 138, 140–148 CrossRef CAS PubMed.
- K. R. Krishnadas, A. Baksi, A. Ghosh, G. Natarajan, A. Som and T. Pradeep, Acc. Chem. Res., 2017, 50, 1988–1996 CrossRef CAS PubMed.
- G. Salassa, A. Sels, F. Mancin and T. Bürgi, ACS Nano, 2017, 11, 12609–12614 CrossRef CAS PubMed.
- B. Zhang, O. V. Safonova, S. Pollitt, G. Salassa, A. Sels, R. Kazan, Y. Wang, G. Rupprechter, N. Barrabés and T. Bürgi, Phys. Chem. Chem. Phys., 2018, 20, 5312–5318 RSC.
- B. Zhang, G. Salassa and T. Bürgi, Chem. Commun., 2016, 52, 9205–9207 RSC.
- Physical Electronics Inc., Chanhassen, MN 55317 (USA), https://www.phi.com/.
- H. Qian, Y. Zhu and R. Jin, ACS Nano, 2009, 3, 3795–3803 CrossRef CAS PubMed.
- Y. Lu, Y. Jiang, X. Gao and W. Chen, Chem. Commun., 2014, 50, 8464–8467 RSC.
- E. Pensa and T. Albrecht, J. Phys. Chem. Lett., 2018, 9, 57–62 CrossRef CAS PubMed.
- R. Jin, S. Zhao, C. Liu, M. Zhou, G. Panapitiya, Y. Xing, N. L. Rosi, J. P. Lewis and R. Jin, Nanoscale, 2017, 9, 19183–19190 RSC.
- C. Kumara and A. Dass, Nanoscale, 2012, 4, 4084–4086 RSC.
- Y. Negishi, K. Munakata, W. Ohgake and K. Nobusada, J. Phys. Chem. Lett., 2012, 3, 2209–2214 CrossRef CAS PubMed.
- S. Wang, Y. Song, S. Jin, X. Liu, J. Zhang, Y. Pei, X. Meng, M. Chen, P. Li and M. Zhu, J. Am. Chem. Soc., 2015, 137, 4018–4021 CrossRef CAS PubMed.
Footnote |
| † Electronic supplementary information (ESI) available: MALDI, UV–Vis, and XPS measurement results described in the text. Estimation of the number of Au monolayers covering the Ag surface. See DOI: 10.1039/c8nr09214a |
| This journal is © The Royal Society of Chemistry 2019 |

