
 Open Access Article
 This Open Access Article is licensed under a Creative Commons Attribution-Non Commercial 3.0 Unported Licence
Sink or float? Characterization of shell-stabilized bulk nanobubbles using a resonant mass measurement technique†
Christopher
Hernandez‡
a,
Eric C.
Abenojar‡
 a,
Judith
Hadley
b,
Al Christopher
de Leon
a,
Robert
Coyne
b,
Reshani
Perera
a,
Ramamurthy
Gopalakrishnan
a,
James P.
Basilion
ac,
Michael C.
Kolios
d and
Agata A.
Exner
*a
a,
Judith
Hadley
b,
Al Christopher
de Leon
a,
Robert
Coyne
b,
Reshani
Perera
a,
Ramamurthy
Gopalakrishnan
a,
James P.
Basilion
ac,
Michael C.
Kolios
d and
Agata A.
Exner
*a
aDepartment of Radiology, Case Western Reserve University, Cleveland, OH, 44106 USA. E-mail: agata.exner@case.edu
bMalvern Panalytical, Westborough, MA, 01581 USA
cDepartment of Biomedical Engineering, Case Western Reserve University, Cleveland, OH, 44106 USA
dDepartment of Physics, Ryerson University, Toronto, Ontario, Canada M5B 2K3
First published on 21st December 2018
Abstract
Nano-sized shell-stabilized gas bubbles have applications in various fields ranging from environmental science to biomedical engineering. A resonant mass measurement (RMM) technique is demonstrated here as a new and only method capable of simultaneously measuring the size and concentration of buoyant and non-buoyant particles in a nanobubble sample used as a next-generation ultrasound contrast agent.
Bulk nanobubbles have emerged as useful agents in various fields of science and engineering, such as agricultural science, environmental science, and biomedical engineering.1 The oxygenation of water with submicron bubbles has been shown to promote the growth of plants, fish, and mice.2 Highly reactive free radicals generated by sonicated bubbles have been found to aid in water disinfection and catalyze chemical reactions for water detoxification.3,4 More recently, shell-stabilized nanobubbles have gained interest as contrast agents for diagnostic ultrasound and drug delivery vehicles because of their ability to passively accumulate in tissues with highly permeable vasculature (such as some tumors).5–11 Due to their size, nanobubbles can penetrate the tumor parenchyma via the enhanced permeability and retention (EPR) effect due to the leaky vasculature and poor lymphatic drainage present in many tumors, and tissues exhibiting states of inflammation.12 Little is known about the physical and morphological properties of nanobubbles, as their small size makes nanobubble characterization challenging. Traditional characterization techniques such as dynamic light scattering (DLS), electro-impedance volumetric zone sensing (Coulter counter), and nanoparticle tracking analysis are unable to differentiate between gas-filled nanobubbles and similarly sized solid contaminates, leading to inaccurate/misleading bubble concentrations and size measurements.13–15 Imaging techniques such as atomic force microscopy (AFM) or electron microscopy (EM) are expensive, sample dependent, and involve processing steps that inhibit them from directly visualizing fragile nanobubbles.16–18
Here we demonstrate, for the first time, the use of a resonant mass measurement (RMM) technique to conduct a comprehensive physical property analysis of shell-stabilized nanobubble ultrasound contrast agents in solution.19–21 The RMM technology utilizes a micro-electro-mechanical systems (MEMS) resonator (Fig. 1a) with a microfluidic channel embedded in a resonating cantilever under vacuum to detect, count, and measure the buoyant mass of particles in a liquid passing through the channel. As particles flow through a microfluidic channel in a suspended cantilever, the resonant frequency of the cantilever, which is associated with a change in the buoyant mass, is altered (Fig. 1b). If the particle density (ρp) is lower than the fluid density (ρf), a resonant positive frequency shift (Δfr) is induced, indicating the presence of a positively buoyant particle. A particle with a density higher than the fluid density (negatively buoyant particles) will induce a negative shift. The size range measurable by the equipment is determined by several factors. The width of the microfluidic channel determines the largest detectable particle size limit. The lower mass limit is a function of the system noise floor as well as sample and fluid densities.
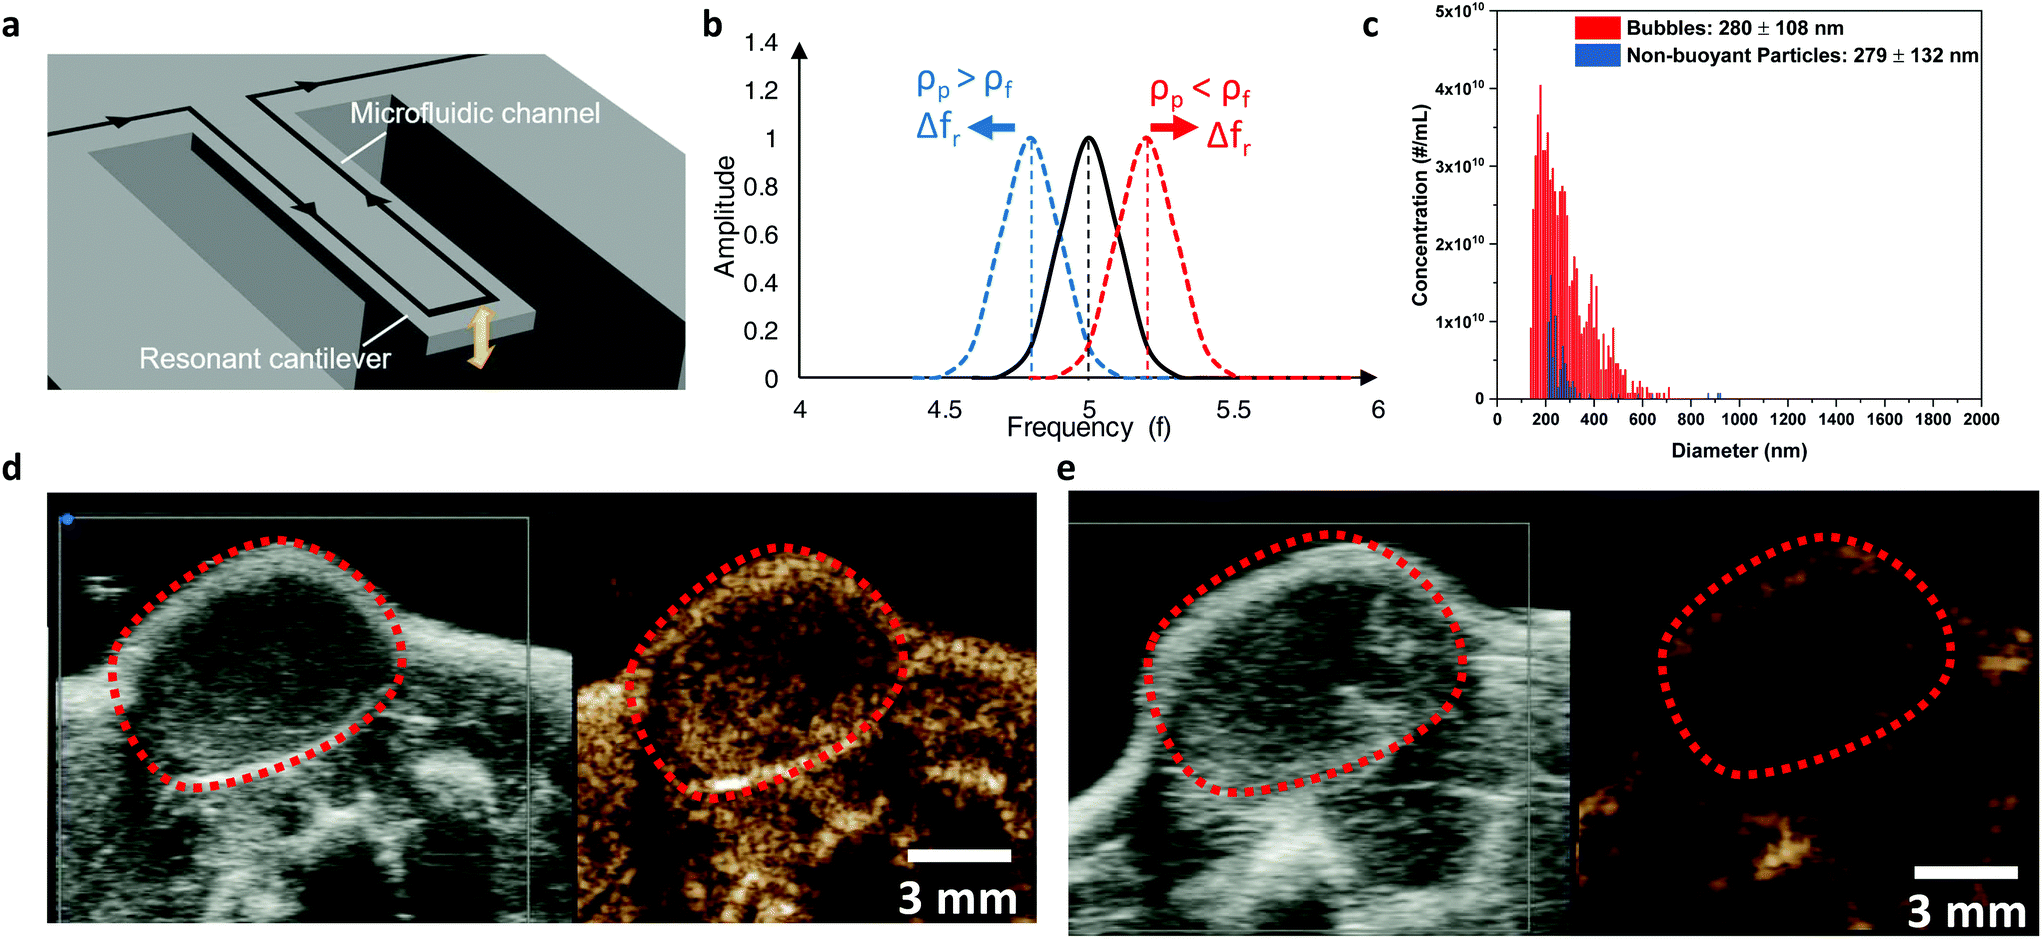 | ||
| Fig. 1 Principle of the resonant mass measurement system and the characterization of shell-stabilized nanobubbles. (a) Schematic diagram of the resonating microfluidic cantilever. (b) When a particle travels through the microfluidic channel, the peak resonance frequency of the cantilever (Δfr) is altered. The mass of the particle can be determined by the peak frequency shift. (c) Representative size distribution plots for shell-stabilized nanobubbles. All positively buoyant particles were considered nanobubbles and had a mean diameter of ∼290 nm. Negatively buoyant particles were also detected and were assumed to be a combination of liposomes and large lipid aggregates that were not incorporated into the bubble shell. These nanobubbles are small enough to move beyond the vasculature and into the tumor parenchyma potentially allowing for improved tumor detection through multi-parametric ultrasound imaging. Mice bearing subcutaneous PC-3 prostate cancer tumors demonstrated better ultrasound signal distribution (Vevo 3100, FUJIFILM VisualSonics, 18 MHz) throughout a tumor cross-section with (d) nanobubbles compared to (e) clinically available (Lumason®) microbubble contrast agents. The bright yellow-orange dots are ultrasound signals generated by the bubbles. | ||
RMM is highly accurate with sub-femtogram sensitivity21 and has the unique ability to discriminate and characterize nanoparticle formulations with mixed populations of positively buoyant and negatively buoyant particles. In our samples, which contain lipid-shelled nanobubbles (positively buoyant with a density less than the surrounding fluid) and lipid micelles/liposomes (negatively buoyant with a density greater than the fluid), the RMM (Archimedes, Malvern Instruments) simultaneously provides separate size distributions for both particle types (Fig. 1c). Nanobubbles were found to have a mean diameter of 290 nm with a typical range between 100 and 600 nm. The negatively buoyant particles detected were found to have a size ranging from 200 to 919 nm in diameter. This size range is consistent with measurements taken with DLS, which is limited compared to RMM due to its inability to distinguish between buoyant and non-buoyant particles and it provides data on particle concentration.
Unlike clinically available shell-stabilized microbubbles which are between 1 and 10 μm in diameter, nanobubbles are small enough to extravasate from the highly permeable vasculature regions in cancerous tumors. The ability to detect a subtle difference in bubble distribution kinetics could potentially allow for improved tumor detection through multi-parametric ultrasound imaging. When injected intravenously into a subcutaneous PC3 human prostate tumor-bearing mouse, nanobubbles (Fig. 1d, ESI Video 1†) were found to have more detailed and longer-lasting ultrasound signal distribution through the tumor compared to the clinically available microbubble contrast agent (Lumason®) (Fig. 1e, ESI video 2†). This enhanced tumor cross-section signal distribution improves the visualization of the shape and extent of tumor parenchyma which could assist in disease diagnosis, prognosis, and surgical planning.
The characterization of the physical properties of nanobubbles, such as concentration, size distribution, and stability, is not only critical to ensure their clinical translation but also necessary to study how these parameters relate to their response under ultrasound. Here, we used RMM to measure the concentration of the buoyant population in our nanobubble solution to study the effect of the concentration on contrast enhancement. Ultrasound scans (Fig. 2a) were acquired at various measured nanobubble concentrations using clinical diagnostic ultrasound. The ultrasound contrast enhancement (Fig. 2b) produced by these nanobubbles increased with their concentration up to ∼109 particles per mL. A further increase in the nanobubble concentration resulted in a decrease of the ultrasound signal due to acoustic shadowing (due to increased ultrasound attenuation and/or nanobubble interactions).22
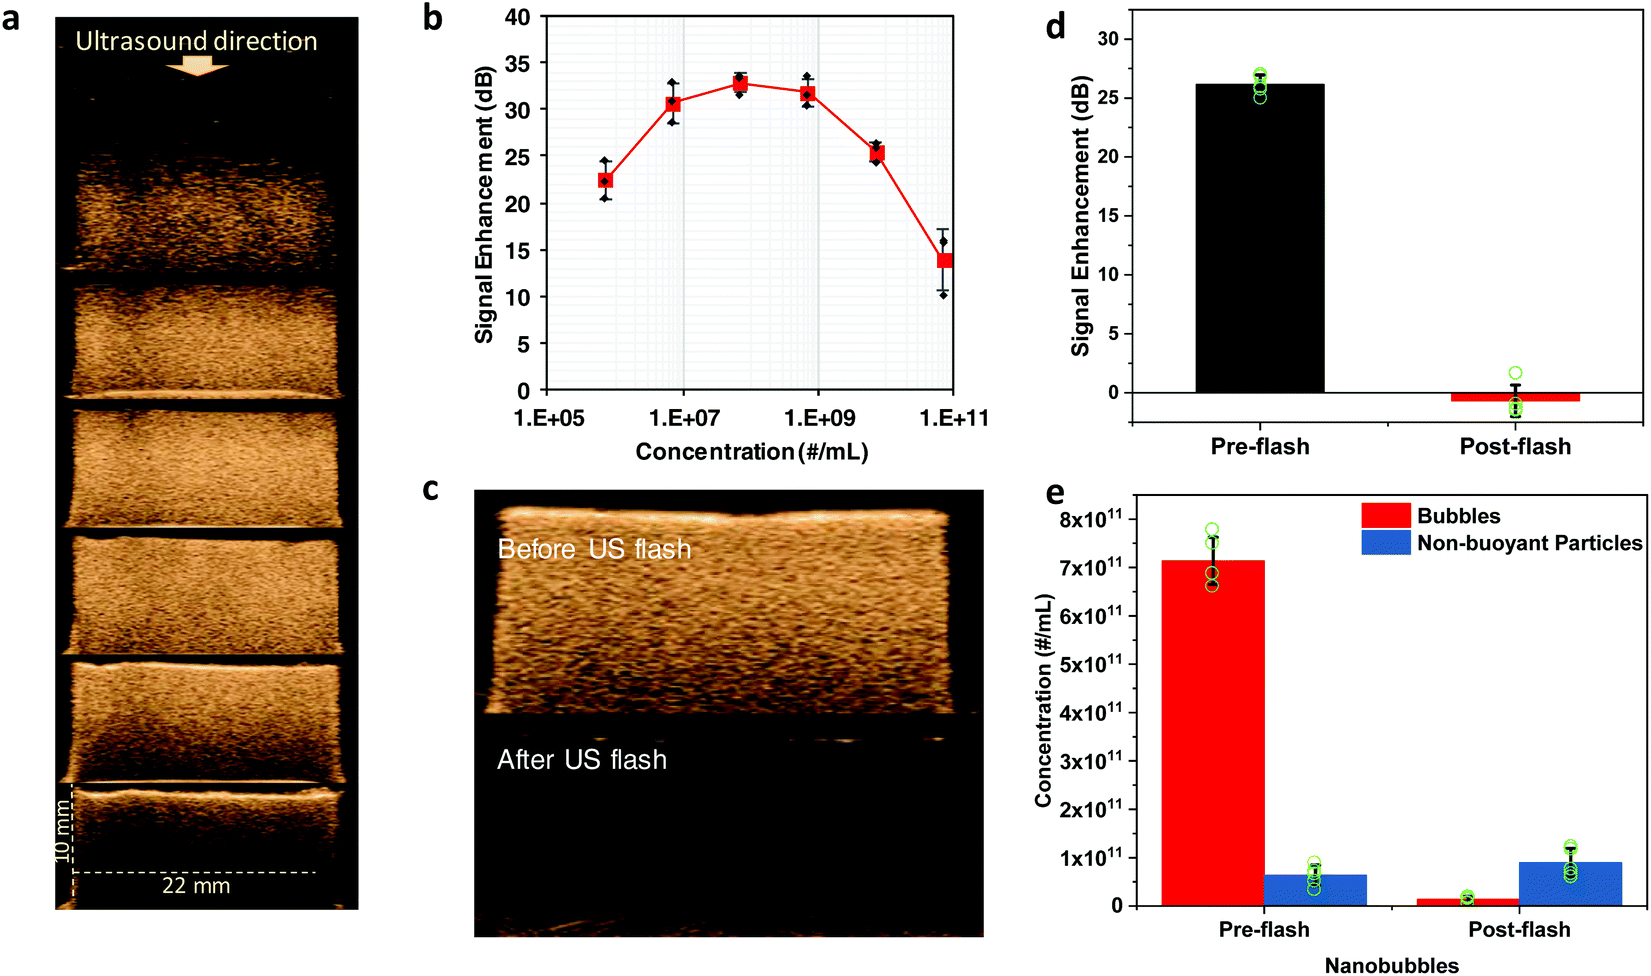 | ||
| Fig. 2 In vitro characterization of signals from nanobubble under clinical ultrasound (AplioXG SSA-790A, Toshiba Medical Imaging Systems, 12 MHz). (a) Representative ultrasound images of nanobubbles at various concentrations with the topmost for gas-free PBS and the rest corresponding to those in (b). (b) Quantitative ultrasound intensities (normalized to gas free PBS) (n = 3) at concentrations diluted successively ten-fold in between for each point from 7 × 10⁵ to 7 × 10¹⁰. Nanobubble disruption with high power ultrasound led to a decrease in their signal (c) as they were destroyed. The average intensity (n = 5) before and after the application of high power ultrasound was quantified and shown in (d). The RMM of bubbles (e) before and after the application of high power ultrasound indicated that 98% of bubbles were destroyed (n = 5). | ||
In addition to their application as a diagnostic agent, there is significant interest in the use of nanobubbles as chemotherapeutic carrier vehicles due to their improved tumor distribution and proximity to cancerous cells compared to microbubbles (as microbubbles are intravascular contrast agents). With strong interest in the use of bubbles as drug delivery vehicles, their ultimate stability and in vivo kinetics are of great importance. Nanobubble exposure to high power ultrasound disrupts the lipid shell membrane, leading to a loss of gas and consequently a decrease in the ultrasound signal. We have demonstrated that the remnant bubble shells reassemble into lipid sheets, liposomes, and micelles.18 To investigate these effects, we used RMM to characterize the structure of the nanobubbles before and after their exposure to high-intensity US. After exposure to high power ultrasound, a significant decrease in the signal (Fig. 2c and d) was observed as the nanobubbles were destroyed. RMM of the destroyed bubbles (Fig. 2e) indicated a 98% decrease in the nanobubble concentration. Nanobubble destruction with ultrasound also led to an increase in the concentration (Fig. 2e and ESI Fig. S1†) of the negatively buoyant particle population.
The small size and fragile nature of nanobubbles have limited the characterization of their stability to correlations with their loss of signals over time under ultrasound. Ultrasound pulses, however, can induce a partial dissolution, accelerating their dissolution process. To assess the passive dissolution of nanobubbles, RMM was used to monitor the change in the bubble concentration and size over time. The in vitro US signal of the nanobubbles was measured every hour for 5 hours to determine their stability over time (Fig. 3a). The quantification of US signal enhancement showed a progressively lower signal over time for the nanobubbles (Fig. 3b). The corresponding RMM was also simultaneously performed to determine changes in the diameter and concentration of buoyant and non-buoyant particles in solution. Additional representative outputs from the RMM including the frequency shift and buoyant mass raw data are shown in ESI Fig. S2 and S3,† respectively. A statistically significant decrease in the size was observed 1 h after the nanobubbles were prepared and isolated while no change in the size was observed after that (Fig. 3c). The decrease in the size could be due to C3F8 gas slowly diffusing out of the bubbles until a quasi-steady state equilibrium is reached. A reduction in the bubble size due to a loss of gas could lead to a lower US signal enhancement. The gradual decrease in the bubble size as a result of gas diffusion (and not immediate total collapse/destruction) could likely be the reason that no significant changes in the concentration of buoyant and non-buoyant particles over time were detected following RMM (Fig. 3d). A likely reason for this could be that US appears to be more sensitive to bubble concentration especially for the larger sized bubbles, wherein gas dissipate faster leading to bigger changes in the US signal over time. Smaller sized bubbles, however, persist and may not be activated by US under low pressure conditions used in this study. They are not acoustically active but still counted in the concentration measurement using RMM. Thus, US signal enhancement was statistically significant over time but the size (from 1–5 h) and concentration (from 0–5 h) were not.
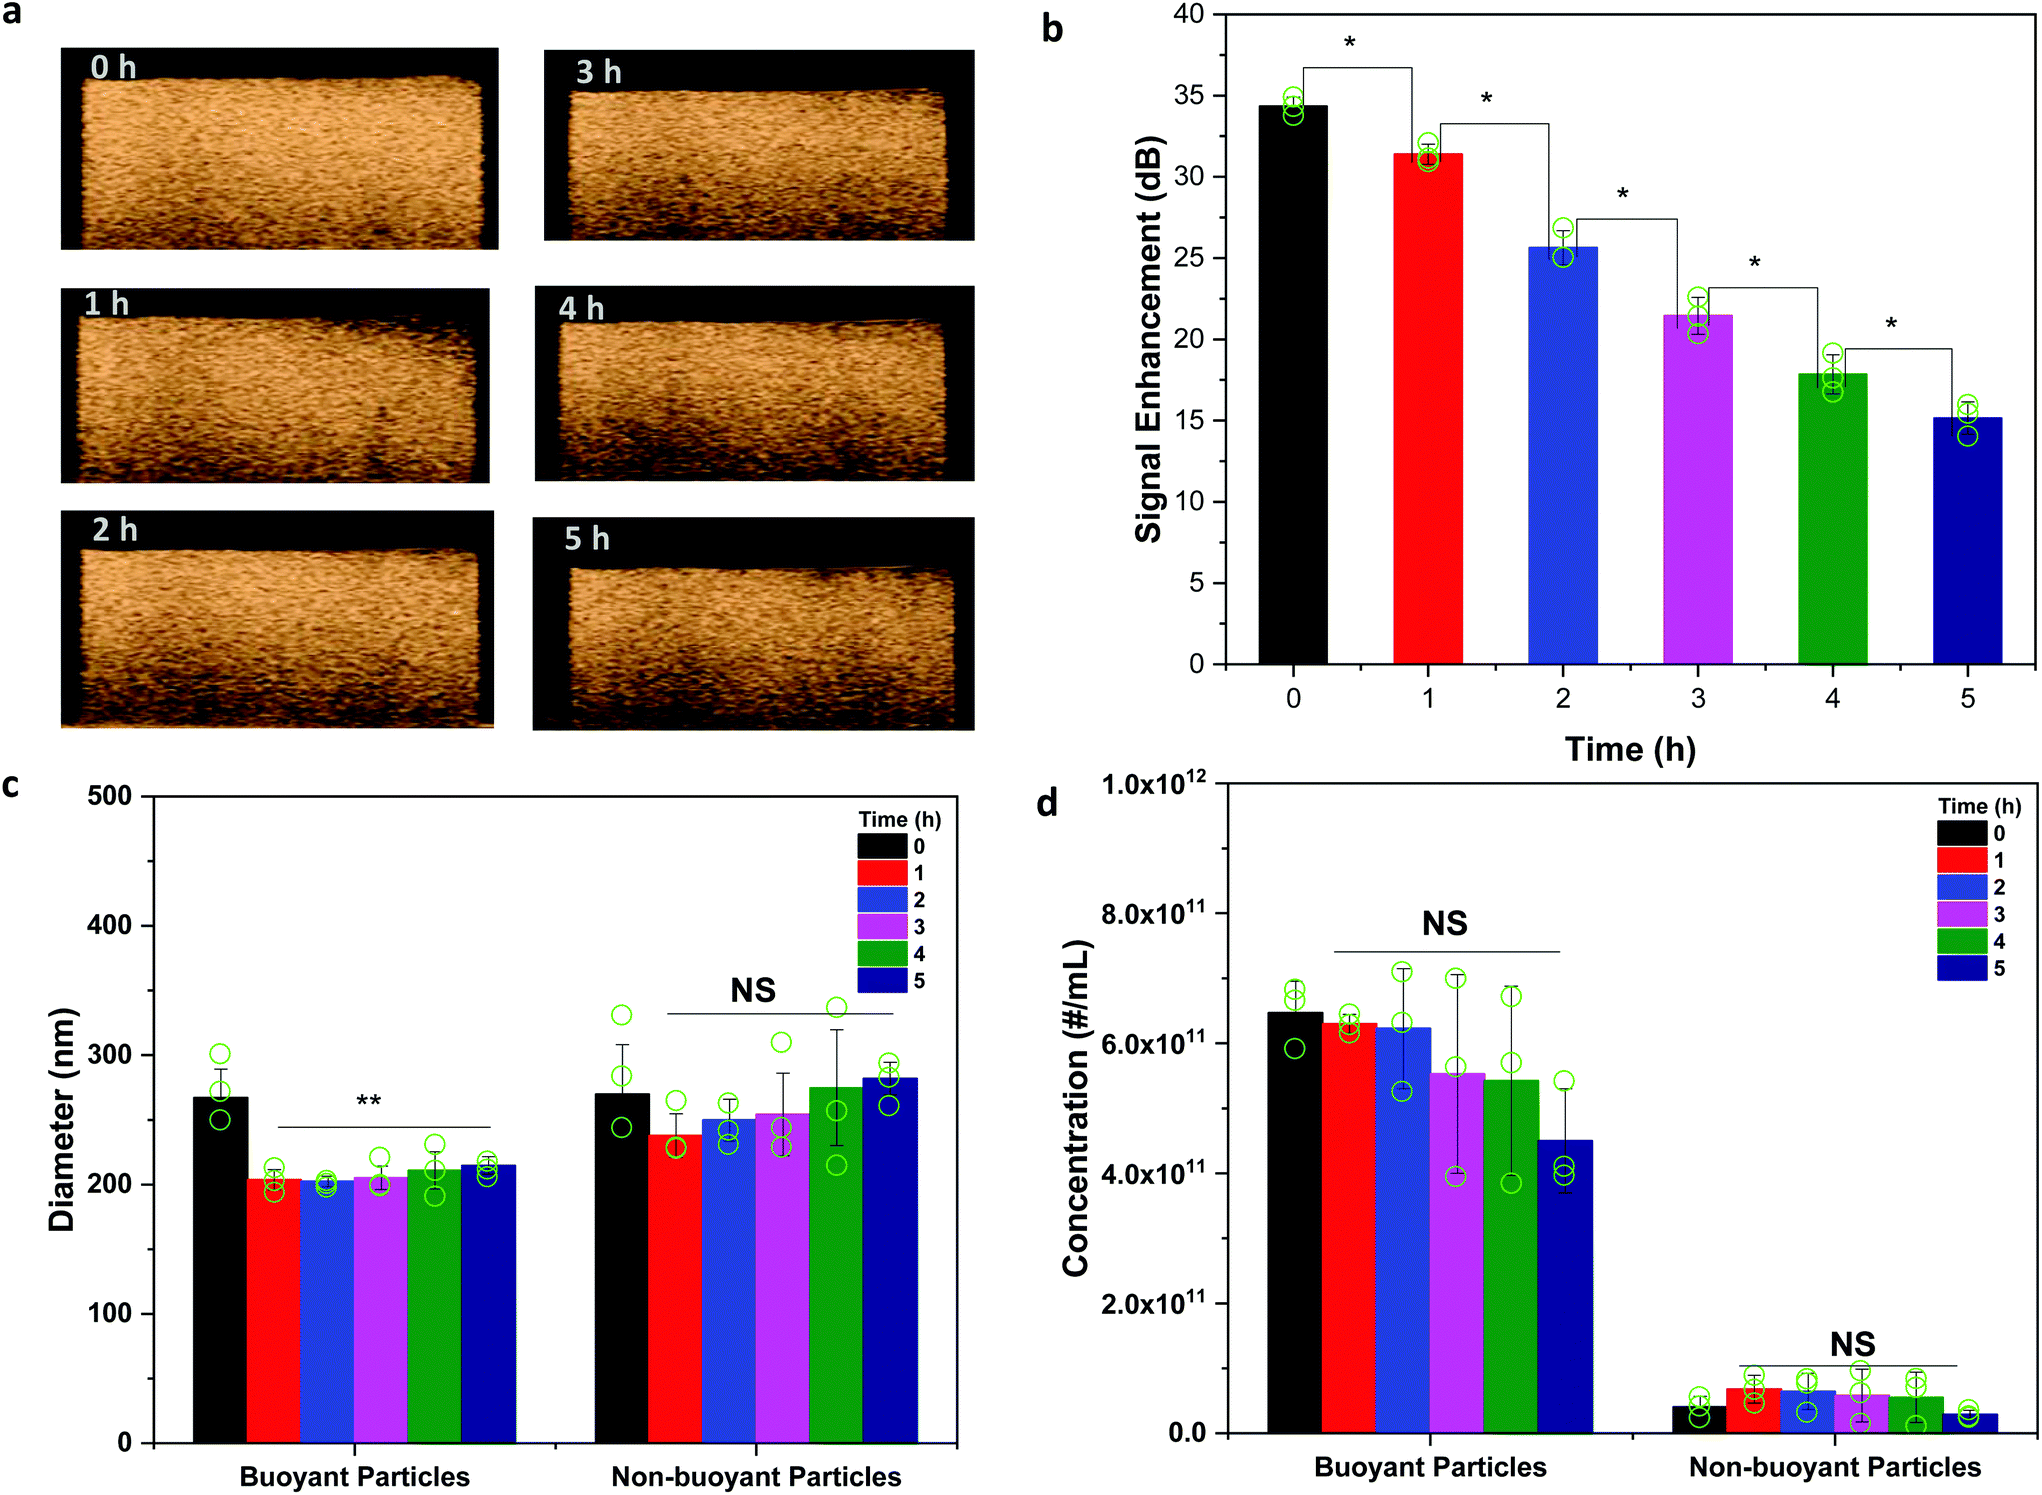 | ||
| Fig. 3 In vitro stability evaluation of nanobubble signal time decay under clinical ultrasound (AplioXG SSA-790A, Toshiba Medical Imaging Systems, 12 MHz). (a) Representative ultrasound images of nanobubbles at various time points (0–5 h). (b) Initial enhancement comparison of ultrasound intensities at various time points (n = 3, p < 0.05). (c) Average size comparison for nanobubbles (buoyant and non-buoyant particles) at different time points (n = 3, p < 0.01, NS means non-significant). (d) Comparison of the concentration of buoyant and non-buoyant particles at different time points (n = 3, p < 0.05, NS means non-significant). | ||
In this study, we report the use of RMM for the characterization of shell-stabilized bulk nanobubbles, which in our application shows great potential as ultrasound contrast agents. This technique presents the unique ability to rapidly detect, count, and measure the buoyant mass of particles in the solution. In the case of lipid-stabilized nanobubbles, this technique can simultaneously measure the size and concentration, and distinguish between buoyant particles (bubbles) and non-buoyant particles (aggregated solids/lipids present in a sample), which is critical in US contrast imaging where only buoyant particles (bubbles) enhance the non-linear contrast signal. One limitation of the RMM technique is the need to know the density of the particle to determine its size.23 However, the density of the particle can be determined using a RMM resonator by measuring the shifts in buoyant mass relative to the changes in the solution density.24
In conclusion, the RMM technique is a revolutionary technology that has fully addressed the inherent challenges brought upon by the limitations of existing and established methods used in bulk nanobubble characterization. It is an innovative quantitative analytical tool capable of performing comprehensive characterization of positively buoyant and negatively buoyant particle samples, which overcomes prior uncertainty regarding bulk nanobubble characterization, in which the most significant of concerns is the ability to clearly distinguish and quantify simultaneously the size and concentration of buoyant and non-buoyant particles.
Conflicts of interest
There are no conflicts to declare.Acknowledgements
This work is supported by funding from the Office of the Assistant Secretary of Defense for Health Affairs, through the Prostate Cancer Research Program under Award No. W81XWH-16-1-0371 (to AAE) and W81XWH-16-1-0372 (to JBP). This work is also supported by the National Institutes of Health via the National Institute of Biomedical Imaging and Bioengineering (NIBIB) under Award No. R01EB025741. The content is solely the responsibility of the authors and does not necessarily represent the official views of the National Institutes of Health, the National Institute of Biomedical Imaging and Bioengineering or the Department of Defense. JPB is a Fellow of the National Foundation for Cancer Research.References
- M. Alheshibri, J. Qian, M. Jehannin and V. S. J. Craig, Langmuir, 2016, 32, 11086–11100 CrossRef CAS PubMed.
- K. Ebina, K. Shi, M. Hirao, J. Hashimoto, Y. Kawato, S. Kaneshiro, T. Morimoto, K. Koizumi and H. Yoshikawa, PLoS One, 2013, 8, e65339 CrossRef CAS PubMed.
- K. Jyoti and A. Pandit, Biochem. Eng. J., 2001, 7, 201–212 CrossRef CAS.
- M. A. Oturan and J.-J. Aaron, Crit. Rev. Environ. Sci. Technol., 2014, 44, 2577–2641 CrossRef CAS.
- R. H. Perera, H. Wu, P. Peiris, C. Hernandez, A. Burke, H. Zhang and A. A. Exner, Nanomedicine, 2017, 13, 59–67 CrossRef CAS PubMed.
- Y. Wang, X. Li, Y. Zhou, P. Huang and Y. Xu, Int. J. Pharm., 2010, 384, 148–153 CrossRef CAS PubMed.
- S. S. Thakur, M. S. Ward, A. Popat, N. B. Flemming, M.-O. Parat, N. L. Barnett and H. S. Parekh, PLoS One, 2017, 12, e0178305 CrossRef PubMed.
- Q.-L. Zhou, Z.-Y. Chen, Y.-X. Wang, F. Yang, Y. Lin and Y.-Y. Liao, Biomed. Res. Int., 2014, 2014, 1–13 Search PubMed.
- L. Zhu, Y. Guo, L. Wang, X. Fan, X. Xiong, K. Fang and D. Xu, J. Nanobiotechnol., 2017, 15, 63 CrossRef PubMed.
- M. Meng, J. Gao, C. Wu, X. Zhou, X. Zang, X. Lin, H. Liu, C. Wang, H. Su, K. Liu, Y. Wang, X. Xue and J. Wu, Tumor Biol., 2016, 37, 8673–8680 CrossRef CAS PubMed.
- Y. Xie, J. Wang, Z. Wang, K. A. Krug and J. D. Rinehart, Nanoscale, 2018, 10, 12813–12819 RSC.
- A. K. Iyer, G. Khaled, J. Fang and H. Maeda, Drug Discovery Today, 2006, 11, 812–818 CrossRef CAS PubMed.
- C. A. Sennoga, J. S. M. Yeh, J. Alter, E. Stride, P. Nihoyannopoulos, J. M. Seddon, D. O. Haskard, J. V. Hajnal, M. X. Tang and R. J. Eckersley, Ultrasound Med. Biol., 2012, 38, 834–845 CrossRef PubMed.
- N. T. Blum, A. Yildirim, R. Chattaraj and A. P. Goodwin, Theranostics, 2017, 7, 694–702 CrossRef CAS PubMed.
- N. Nirmalkar, A. W. Pacek and M. Barigou, Langmuir, 2018, 34, 10964–10973 CrossRef CAS PubMed.
- B. Eslami and S. D. Solares, Microsc. Res. Tech., 2017, 80, 41–49 CrossRef CAS PubMed.
- H. An, B. H. Tan and C.-D. Ohl, Langmuir, 2016, 32, 12710–12715 CrossRef CAS PubMed.
- C. Hernandez, S. Gulati, G. Fioravanti, P. L. Stewart and A. A. Exner, Sci. Rep., 2017, 7, 13517 CrossRef PubMed.
- T. P. Burg and S. R. Manalis, Appl. Phys. Lett., 2003, 83, 2698–2700 CrossRef CAS.
- T. P. Burg, A. R. Mirza, N. Milovic, C. H. Tsau, G. A. Popescu, J. S. Foster and S. R. Manalis, J. Microelectromech. Syst., 2006, 15, 1466–1476 Search PubMed.
- T. P. Burg, M. Godin, S. M. Knudsen, W. Shen, G. Carlson, J. S. Foster, K. Babcock and S. R. Manalis, Nature, 2007, 446, 1066–1069 CrossRef CAS PubMed.
- M. Lampaskis and M. Averkiou, Ultrasound Med. Biol., 2010, 36, 306–312 CrossRef PubMed.
- M. Alheshibri and V. S. J. Craig, J. Phys. Chem. C, 2018, 122, 21998–22007 CrossRef CAS.
- E. Folzer, T. A. Khan, R. Schmidt, C. Finkler, J. Huwyler, H.-C. Mahler and A. V. Koulov, J. Pharm. Sci., 2015, 104, 4034–4040 CrossRef CAS PubMed.
Footnotes |
| † Electronic supplementary information (ESI) available: Experimental details, supporting information. See DOI: 10.1039/c8nr08763f |
| ‡ These authors contributed equally to this work. |
| This journal is © The Royal Society of Chemistry 2019 |