 Open Access Article
Creative Commons Attribution 3.0 Unported Licence
Multi-layer graphene as a selective detector for future lung cancer biosensing platforms†
E.
Kovalska
 *a,
P.
Lesongeur
ab,
B. T.
Hogan
 a and
A.
Baldycheva
 a
a
aDepartment of Engineering and Centre for Graphene Science, College of Engineering, Mathematics and Physical Sciences, University of Exeter, Exeter, EX4 4QF, UK. E-mail: evgeniya.kovalska.ua@gmail.com
bMechanics and Micromechanics Engineering School, École Nationale Supérieure de Mécanique et des Microtechniques, 26 rue de l’épitaphe, 25030 Besançon Cedex, France
First published on 23rd January 2019
Abstract
Highly selective, fast detection of specific lung-cancer biomarkers (CMs) in exhaled human breath is vital to the development of enhanced sensing devices. Today, e-nose is a promising approach for the diagnosis of lung cancer. Nevertheless, considerable challenges to early-stage disease diagnostics still remain: e.g. decrease in sensor sensitivities in the presence of water vapor, sensor drift leading to the inability to calibrate exactly, relatively short sensor lifetimes, and difficulty discriminating between multiple diseases. However, there is a wide scope for breath diagnostics techniques, and all advanced electrodes applicable to e-nose devices will benefit them. Here, we present the promising sensing capabilities of bare multi-layer graphene (MLG) as a proof of concept for advanced e-nose devices and demonstrate its utility for biomolecule discrimination of the most common lung CMs (ethanol, isopropanol, and acetone). We report on a comparative study involving exposure of the three CM solutions on flat MLG (f-MLG) and patterned MLG (p-MLG) electrodes, where the electrical conductivity of p-MLG is significantly increased while applying acetone. Based on sensitivity tests, we demonstrate the ability to monitor the electrical response of graphene electrodes employing graphene of various wettabilities. Specifically, the f-MLG electrode displays almost 2 times higher sheet resistance (30 Ω sq−1) compared to the hydrophilic p-MLG (12 Ω sq−1). We show significant sensitivity to selected specific molecules of pristine f-MLG and p-MLG while applying CM solutions with a 1.4 × 10⁵ ppm concentration. Finally, we show the selectivity of f-MLG and p-MLG-based sensors when exposed to 2.0 × 10⁵ ppm solutions containing different CM combinations. Both sensors were selective in particular to acetone, since the presence of acetone leads to a sheet resistance increase. We demonstrate that an advanced e-nose approach integrated with MLG electrodes has significant potential as a design concept for utilization of molecular detection at variable concentrations such as in early-stage disease diagnosis. This early-stage approach will provide convenient and reusable complex monitoring of CMs compared to typical contact sensors which require target analysis and are limited by disposable measuring. Moreover, further integration of the Internet of Things will introduce advanced e-nose devices as a biotechnological innovation for disease resilience with the potential for commercialization.
Introduction
The lack of clinical symptoms of early-stage lung cancer is a critical global challenge which leads to the late-stage diagnoses1 and hence inability to cure patients. Lung cancer is one of the most common and aggressive cancers, with mortality rates of about 1.4 million per year, worldwide.2,3 The danger comes from the unrestrainable nature of abnormal cells that begin in one or both lungs and are prone to spread to other parts of the human body rapidly. Due to the severity of lung cancer, the necessity of monitoring specific cancer markers (CMs) present in the exhaled volatile organic compounds (VOCs)4 is of particular interest for human safety and quality of life reasons. CM monitoring can be greatly improved by finding methods for early-stage disease diagnosis, specifically by developing novel 2D materials-based e-nose5 (breath sensor) approaches with ultra-sensitive and highly selective capabilities.In order to look at the breath-print of patients with lung cancer,6 studies on various existing breath sensors have been carried out.7,8 For instance, chemically sensitive and resistive vapour detectors based on single-walled carbon nanotubes, which demonstrate relative humidity dependence, were demonstrated.9 Surface acoustic wave10 sensors based on a quartz crystal microbalance11 for sensing gas/odour were proposed for artificial olfaction with a high sensitivity. Furthermore, the method was then improved by polymer film technology that allowed the detection of several CMs: styrene, decane, undecane, isoprene, benzene, 1-hexene, hexanal, propyl benzene and 1,2,4-trimethyl benzene. Santonico et al.12 show how the metalloporphyrin-coated quartz crystal microbalance sensor was employed for the differentiation of lung cancer from other lung disease and control groups. By this approach, 75% reliable classification among lung cancer carcinoma subtypes was demonstrated for the first time. In general, many prototypes of complex e-nose devices have been developed to analyze VOCs including metal–oxide,13–15 semiconducting polymers,16,17 conductive electroactive polymers,18–20 as well as optical,21 surface acoustic wave21 and electrochemical gas sensors.5 However, although there has been a significant effort in the research community towards the development of e-nose sensors, a practical, robust technology integrated with graphene for early-detection of lung cancer is still not existent today.
Graphene has been demonstrated as an appropriate electrode candidate for a variety of biosensing systems22,23 due to its remarkable physical–chemical properties.24 The large surface area and superior electrical conductivity of graphene make it an excellent “electron wire” between the redox centres of a molecule of interest and the electrode's surface. Graphene is extremely stable under the environmental conditions and does not degrade with time, making it an ideal material for stable sensor performance. Moreover, graphene exhibits antibacterial effects25 and biocompatibility with the user,26 which is especially important for healthcare applications. Graphene also has a range of surface chemistry which can be used to modify the graphene structure,27,28 which makes it amenable to detecting different (bio)markers.23 Furthermore, graphene-based cancer biosensors demonstrate promising results for early-stage disease identification, usually via direct contact with the analyzed target: blood, urine, sweat, biopsy material etc.29,30 However, contact-reliant biosensors can be inconvenient for some measurements due to a range of factors, such as causing discomfort for young and elderly patients, and are limited by poor reusability. On the other hand, diagnosis of lung cancer or any type of disease through a non-invasive e-nose approach can guarantee a practical and reusable method of complex monitoring of VOCs in the human breath.
In this work, we report the feasibility of bare multi-layer graphene (MLG) as a proof of concept for the e-nose technology. We demonstrate a comparable study of two types of graphene, namely flat (f-MLG) and patterned (p-MLG). Both samples were synthesized under similar conditions in a chemical vapor deposition (CVD) system, applying flat and preliminary structured nickel (Ni) foil as a catalyst for f-MLG and p-MLG growth, correspondingly. The obtained graphene films were transferred to a flexible polyvinyl chloride (PVC) film for further characterization and sensor fabrication. Based on scanning electron microscopy (SEM) and Raman spectroscopy characterization, we demonstrate the high-quality morphology and multilayered nature of the grown graphene, where the p-MLG has wrinkled ordering with fewer defects. We show promising sensing capabilities for multi-layer graphene for biomolecule discrimination of common lung CMs such as ethanol, isopropanol, and acetone. Sensing capabilities were determined by measuring the electrical response of f-MLG and p-MLG electrodes with respect to exposed solutions of the mentioned CMs across a range of concentrations. We also report the results of selectivity tests (on the basis of sheet resistance change), where f-MLG and p-MLG-based sensors display potential in discriminating specific lung cancer markers. This research provides a new approach to advanced e-nose technology integrated with multi-layer graphene for early disease diagnosis in a convenient and reusable way.
Experimental
Multi-layer flat and patterned graphene films growth
Flat and patterned31 MLG films were grown in a CVD system at high temperature (950 °C) and atmospheric pressure. Commercial, 25 μm thick Ni foil (99%, Alfa Aesar item #12722) was used as a catalyst for graphene growth. Argon (Ag) and hydrogen (H2) gases were flushed through a quartz chamber (3′′ size) in the ratio 100/100 sccm. Methane (CH4, as a carbon source) was introduced to the chamber at a flow rate of 30 sccm once the temperature reached 950 °C. The graphene growth process in the Ag/H2/CH4 environment was carried out for 5 min and was followed by rapid cooling (∼1 h) to room temperature under the Ag and H2 flows (CH4 flow was shut off).Graphene electrode preparation and characterization
Flexible flat and patterned MLG-based electrodes were prepared using a lamination technique. The patch of graphene on the Ni foil and PVC film (Sigma, lamination foils), protected by paper, was laminated at about 120 °C in a laminator (PAVO A3 HD FOTO-Laminiergerät HD320-PRO). Afterwards, the Ni catalyst was etched in 1 M iron(III) chloride hexahydrate solution (98%, Sigma Aldrich item #207926). Samples of graphene/PVC were washed in DI water (by immersing for at least 1 hour) and then blow-dried with nitrogen gas (N2).The morphology of the graphene surface was analysed by SEM (TESCAN VEGA3). The graphitization fingerprint and defectiveness of flat and patterned MLG-based electrodes were determined using a Renishaw Raman Microscope system with 40× microscope objectives, 10 s integration time, and 532 nm excitation wavelength.
Preparation of “cancer markers”
Ethanol (99.8%, Fisher Chemical item #12458740), isopropanol (Fisher Chemical item #12906197) and acetone (99%, Alfa Aesar item #11358415) in aqueous solution, assumed as “cancer markers”, were prepared in a range of concentrations covering 0–3.3 × 10⁵ ppm. All solutions were ultra-sonicated for 20 min at room temperature using an industrial-grade professional ultrasonic cleaner (SONIC 3D, James Products).Electrical measurements
All measurements were conducted under ambient conditions using a Keithley 2600 source meter assisted with LabVIEW for the I–V recording. The graphene electrodes (flat and patterned) were biased at ±1 V, and the gate voltage was applied via two tungsten probe tips with a “cat whisker” (PSE-GA, Flexible Probe Tips) attached to the top of the graphene.Results and discussion
Large-sized flat and patterned MLG films were grown on nickel foil at 950 °C by chemical vapor deposition. For the growth of p-MLG, we used pre-structured Ni foil, patterned by a nonlinear laser lithography technique that we recently presented and discussed.31 The procedure (Fig. 1) was carried out under ambient conditions in an atmosphere of Ar and H2, and methane (CH4) was used as the carbon source. | ||
| Fig. 1 Chemical vapor deposition growth of multi-layer graphene (a schematic image). Methane was used as a carbon source, which under high temperature and an argon atmosphere decomposed into C and H2, as seen from the chemical reaction (a). Resulted carbon atoms were created in nucleation centers on both sides of the Ni foil through penetration and “dissolution” in the catalyst volume32,33 (b). Following the nucleation stage, the first graphene layers were grown directly on the top and bottom sides of Ni foil (c). Formation of multiple layers of graphene occurred according to the “underlayer growth model” with each newly grown layer pushing up the previously grown one (d). | ||
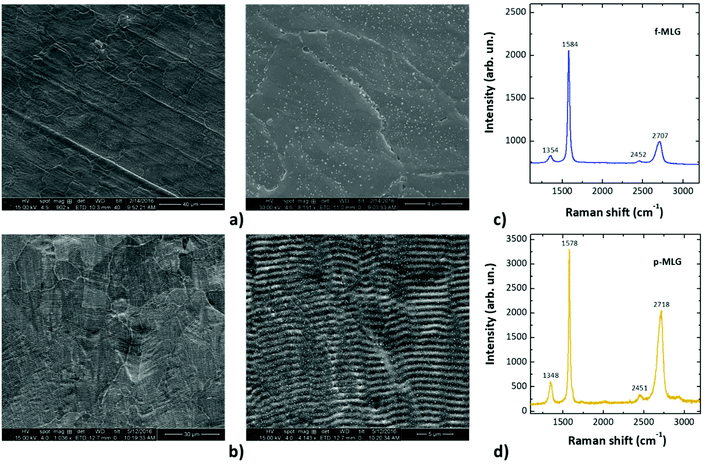
After being transferred (using a hot lamination method) onto a flexible PVC substrate, the graphene films were characterized by SEM and Raman spectroscopy. The SEM images of the top view of the graphene samples on the PVC substrate (Fig. 2a and b) display highly structured graphene films following the surface structure fingerprint of the Ni foil employed during the CVD growth. It is obvious that the catalyst determines the morphology and structure alignment, and consequently, serves as a template for the resulting graphene. Therefore, f-MLG (Fig. 2a) has a flat structure permeated with grain boundaries and surface defects; meanwhile, p-MLG demonstrates additional wrinkled ordering, aligned in accordance with the initial Ni structure.
Raman spectra at the lowest laser power were found to be typical for multi-layer graphene with evident D, G and 2D features at 1354, 1584 and 2707 cm−1 (f-MLG, Fig. 2c) and 1348, 1578 and 2718 cm−1 (p-MLG, Fig. 2d), respectively. Two peaks 2452 and 2451 cm−1 for f-MLG and p-MLG, respectively, were also observed, which originate from double-resonance Raman scattering involving two phonons around the K-point in the phonon dispersion of a two-dimensional structure.34 The presence of the D peaks indicates a number of sp3 centers in the flat and patterned graphene occurring due to structural edge defects, grain boundary formation and, specifically for p-MLG, artificial wrinkle-like ordering. The position of the G peaks indicates stability of the sp2-hybridized carbon arrangement for both types of graphene, despite the slight 6 cm−1 downshift of the G peak for p-MLG. The intensity ratio ID/G estimates the relative defect concentration of graphene samples, with a higher value indicating more defects. In this case the ratio was found to be 0.4 (f-MLG) and 0.2 (p-MLG). Therefore, the wrinkled surface of p-MLG has fewer defects due to a distinct structure alignment that suppresses the influence of grain boundaries; meanwhile the defectiveness of f-MLG is mainly determined by the multiple grain boundaries, including edge or surface defects. An obvious 2D peak intensity difference and its 11 cm−1 downshift for f-MLG in comparison with p-MLG are caused by the difference in the graphene thickness. The intensity ratio I2D/G for the samples is equal to 0.5 (f-MLG) and 0.6 (p-MLG), which indicates a multi-layered nature and confirms the high quality of the obtained flat and patterned MLG.
Flexible f-MLG and p-MLG-based films were considered as potential electrodes for e-nose devices in the discrimination of lung CMs. Early-stage lung cancer diagnosis applications require quantitative (sensitivity test) and qualitative (selectivity test) identification of cancer markers. Therefore, electrical measurements of the proposed electrodes were performed, when exposed to modelled external breath stimuli, such as concentration value changes or combining several classes of volatile organics.
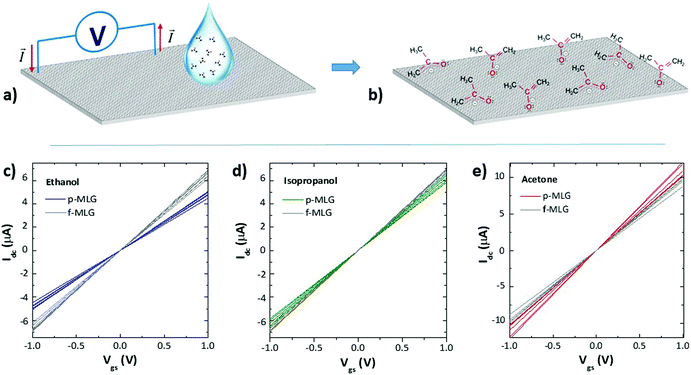
Electrical measurements of the f-MLG and p-MLG on the flexible PVC substrate were carried out by a two probe method (Fig. 3a) for the electrode sensitivity testing. Graphene electrodes were characterized by measuring the drain current (Idc) and gate–source voltage (Vgs) functions (further I–V), applying ±1 V via two tungsten probes while solutions of various cancer markers (in the range of 1.4–3.3 × 10⁵ ppm concentration) were dropped on to the surface of the electrodes (Fig. 3c and d). Ethanol, isopropanol, and acetone were chosen as the cancer markers (which are all VOCs4) due to their abundance in the exhaled breath from an infected human body. Moreover, among the huge number of various classes of VOCs, for instance, (un)saturated hydrocarbons and O-, S- and N-containing7 compounds etc., the most commonly identified are acetone, ethanol, and isopropanol.35
The molecules of each CM solution interact with the graphene electrodes based on a noncovalent mechanism in accordance with the wetting ability of graphene surface,36 molecular structure and orientation of CMs due to the charge distribution while applying a voltage (Fig. 3b displays orientation of acetone molecules as an example). There are certain adsorbate structures adjacent to the graphene substrate which are present after applying a bias voltage, providing evidence for electron-induced
 | (1) |
![[double bond, length as m-dash]](https://www.rsc.org/images/entities/char_e001.gif) O bonds to the substrate.37 Molecules of isopropanol (2) and ethanol (3), due to the low kinetic energies38 of the O–H bonds, provide only a single orientation each.
O bonds to the substrate.37 Molecules of isopropanol (2) and ethanol (3), due to the low kinetic energies38 of the O–H bonds, provide only a single orientation each. | (2) |
 | (3) |
Our results indicate a linear relationship of the I–V curves achieved after applying CMs onto the f-MLG and p-MLG electrodes (Fig. 3c–e). An increase of electrical conductivity up to 11 μA (p-MLG) and 10 μA (f-MLG) was observed while exposed to acetone. Meanwhile, when ethanol and isopropanol were applied, the electrical conductivity of both electrodes remained stable: ∼7 μA for f-MLG and ∼5 μA for p-MLG. After applying CMs on the graphene electrodes, the influences on the active centres (surface/edge defects) are reduced for both types of graphene in the following order (4):
 | (4) |
The ethyl group of ethanol shields the oxygen atom sterically and the alcohol molecule has to be positioned within a limited range in order to interact with the graphene defects via the O–H groups. Despite the generally nonpolar nature of isopropanol and acetone, acetone is the more polar molecule (dielectric constant (ε) equaling 20.7), which has a significant positive inductive effect of the alkyl group in comparison to the nonpolar isopropanol (ε = 17.9) and polar ethanol (ε = 24.5); thus the electron density around the oxygen atom in acetone is highest and more stable. Consequently, the electrical conductivity of p-MLG, while applying acetone, gives a higher value due to the enhanced electron content of acetone and its interaction with the initially reactive graphene surface.
Proceeding further, the sensitivity characterization of graphene electrodes through the analysis of sheet resistance as a function of CM concentration was also provided using Ohm's law and I–V measurement data (SFig. 1†). To simplify the sheet resistance analysis, which is complicated by multiple measurements, MATLAB code was created (SFig. 2†).
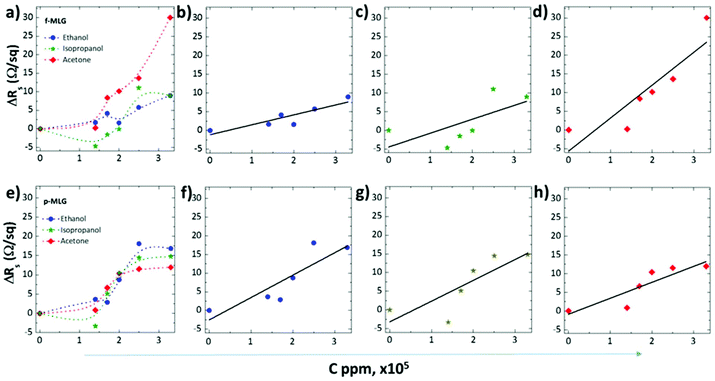
As shown in Fig. 4, varying CM concentrations, in the range of 1.4–3.3 × 10⁵ ppm, led to increased alteration of the electrochemical response of both graphene electrodes. While exposed to acetone, the maximum sheet resistances are measured to be 30 Ω sq−1 and 12 Ω sq−1 for the f-MLG (Fig. 4a) and p-MLG (Fig. 4e) electrodes, respectively. Essentially, surface morphology and geometry influence the electrical transport properties of electrode materials, and, as a result, the defect-rich structure of the f-MLG exhibits almost 2 times higher sheet resistance (30 Ω sq−1, Fig. 4b and c). Thereby, molecules of acetone interact more intensively with the active centres of graphene and thus, repair defects via electron sharing. Applying a p-MLG electrode (Fig. 4f–h), the influences of defects are reduced (due to structure alignment) owing to the opening up of new conduction channels by bridging grain boundaries and line disruption in the graphene electrode.39,40 Hence, the chances of current passing through the graphene defects increase and the sheet resistance reduces correspondingly (12 Ω sq−1).
As seen in (Fig. 4b, c, f and g), the values of sheet resistance of f-MLG (∼8 Ω sq−1) and p-MLG (∼16 Ω sq−1), after exposure to either ethanol or isopropanol, reduced and remained stable. This can be attributed not to the grain boundary influence in the case of f-MLG, but rather to the effect of the low kinetic energy of O–H bonds and its single structural orientation formed during applying a bias of ±1 V. The doubling of the sheet resistance observed for the more hydrophilic p-MLG occurs due to its stronger interaction with the surrounding CMs and the resulting attenuation of the reactivity.
In general, after applying the 1.4 × 10⁵ ppm concentration of all CM solutions, a sufficient sensitivity was represented (Fig. 4a and e). It means that the initial structures of f-MLG and p-MLG are sufficiently sensitive to the selected specific molecules and can be practically used as sensory electrodes for lung cancer detection. To enhance the sensitivity of the proposed graphene structures, further functionalization (by heteroatoms, linker agents, liquid crystals, quantum dots, various patterning techniques etc.)36 or combining materials (heterostructure fabrication)41 is required.
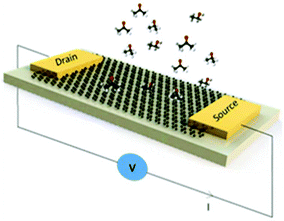
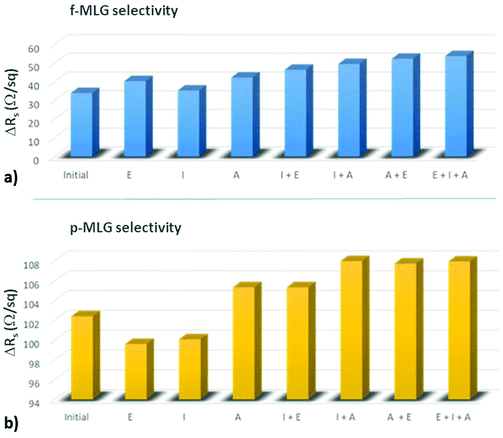
To further investigate the selectivity of the proposed f-MLG and p-MLG-based electrodes for CM detection, the potential graphene biosensor (with a schematic design as shown in Fig. 5) was exposed to a 2.0 × 10⁵ ppm solution containing different CM combinations: single solutions of ethanol (E), isopropanol (I), and acetone (A); double solutions E + I, E + A, and A + I; and the triple solution E + I + A. The electrochemical response of graphene electrodes was recorded by using a two-probe station during CM solution exposure and recalculated to the sheet resistance value through a MATLAB code (SFig. 2†).
As can be seen from Fig. 6, the selectivity of either f-MLG- or p-MLG-based sensors is increasing while acetone is present in the solution. Such behaviour reaffirms our analysis of sheet resistance discussed above (Fig. 4), where the stronger interaction of acetone with the graphene surface is due to an electronically enriched form of the molecule and its ability to be oriented in two different ways against electrodes. The double increase of the sheet resistance value for the p-MLG-based sensor (about 100 Ω sq−1, Fig. 6b) indicates a stronger interaction between the CMs and graphene surface, resulting in the “healing” of defects, which causes the increase in sheet resistance (as was concluded during electrical characterization of the graphene electrodes). The more defective surface of the f-MLG-based sensor displays a decrease in the sheet resistance of about 50 Ω sq−1 (Fig. 6a) while exposed to the CM solutions. The hydrophobic nature of f-MLG in comparison with p-MLG provides a weaker interaction between the CMs and the graphene surface and, therefore, only grain boundaries and surface defects are responsible for changes in electrical properties. In general, our results demonstrate a specific selectivity of both devices to acetone, since the presence of acetone in the solution is indicated by a sheet resistance value increase.
Conclusions
In summary, we demonstrate that bare multi-layer graphene (either flat or patterned) can contribute to e-nose engineering as a suitable electrode material. This can detect the appearance of specific CMs in real and short times, providing a high throughput platform for functional studies and discrimination of cancer signatures. Of special note is that MLG consists of a number of layers, permeated by various natural defects, and as such, it exhibits strong chemical affinity and specificity toward other atoms and molecules in its vicinity. We report the results of electrical measurements for f-MLG and p-MLG electrodes while exposing three CM solutions of various concentrations (ethanol, isopropanol, and acetone in the range of 1.4–3.3 × 10⁵ ppm), where we observed a noticeable increase of electrical conductivity for p-MLG electrodes during exposure to acetone. We conclude that the enhanced electron content of an acetone molecule (ε = 20.7) and its interaction with the initially reactive p-MLG surface led to the conductivity increase. In turn, low kinetic energy O–H groups of isopropanol (ε = 17.9) and ethanol (ε = 24.5) provide single type orientation and thus lower the conductivity. Based on sensitivity tests, we show the ability to monitor the electrical response of graphene electrodes by applying graphene of various wettabilities: hydrophilic p-MLG electrodes display an 12 Ω sq−1 sheet resistance while f-MLG electrodes exhibit almost 2 times higher value – 30 Ω sq−1. We demonstrate noticeable sensitivity to all applied specific molecules, which is exhibited after exposure of CM solutions at 1.4 × 10⁵ ppm concentration. This also confirms an increased reactivity of the proposed graphene electrodes, which could be useful for further modification of the graphene surface providing devices with a higher value of sensitivity threshold. Finally, based on the selectivity test we demonstrate the great potential of the f-MLG and p-MLG-based sensors using 2.0 × 10⁵ ppm solutions of different CM combinations. Both sensors were selective, specifically to acetone, because the presence of acetone is indicated by an increase in sheet resistance value. Our first demonstrations employing bare MLG for the discrimination of CMs may in the near future have a potential application for the detection of the increased level of acetone caused by either acetone poisoning or in lung cancer cases. Further advances in the selectivity of MLG with its functionalization will significantly enhance the early diagnostic capacity to detect CMs in human experiments. Additionally, greater sensitivity can be expected through optimisation of the patterned structures used. We anticipate that this approach for effective MLG-based e-nose engineering may revolutionize biosensing and bioelectronics industries by providing a convenient, highly sensitive, and reliable platform for future applications.Conflicts of interest
There are no conflicts to declare.Acknowledgements
This work was supported by EPSRC First Grant No. 35569/1 and also the EPSRC Centre for Doctoral Training in Electromagnetic Metamaterials Grant No. EP/L015331/1. Authors gratefully acknowledge Prof. Monica Craciun for providing the materials growth and characterization facilities at the Centre for Graphene Science. We thank Dr Ihor Pavlov and Dr Petro Deminskyi for the assistance with Ni-catalyst pre-structuring provided under ERC-617521 NLL grant support at the Bilkent University. We also acknowledge Dr Ana Neves and PhD student Gopika Rajan for their support and assistance with sheet resistance measurements.References
- C. Reddy, D. Chilla and J. Boltax, Hospital Practice, 2011, 39, 107–112 CrossRef PubMed.
- A. Jemal, F. Bray, M. M. Center, J. Ferlay, E. Ward and D. Forman, CA-Cancer J. Clin., 2011, 61, 69–90 CrossRef PubMed.
- J. Ferlay, I. Soerjomataram, R. Dikshit, S. Eser, C. Mathers, M. Rebelo, D. M. Parkin, D. Forman and F. Bray, Int. J. Cancer, 2015, 136, E359–E386 CrossRef CAS PubMed.
- S. M. Gordon, J. P. Szidon, B. K. Krotoszynski, R. D. Gibbons and H. J. O'Neill, Clin. Chem., 1985, 31, 1278–1282 CAS.
- A. Wilson and M. Baietto, Sensors, 2009, 9, 5099 CrossRef CAS PubMed.
- Y. Adiguzel and H. Kulah, Biosens. Bioelectron., 2015, 65, 121–138 CrossRef CAS PubMed.
- P. J. Mazzone, J. Thorac. Oncol., 2008, 3, 774–780 CrossRef PubMed.
- A. D'Amico, G. Pennazza, M. Santonico, E. Martinelli, C. Roscioni, G. Galluccio, R. Paolesse and C. Di Natale, Lung Cancer, 2010, 68, 170–176 CrossRef PubMed.
- G. Peng, E. Trock and H. Haick, Nano Lett., 2008, 8, 3631–3635 CrossRef CAS PubMed.
- C. Xing, C. Mingfu, L. Yi, H. Weijun, W. Ping, Y. Kejing and P. Hongming, Meas. Sci. Technol., 2005, 16, 1535 CrossRef.
- C. Di Natale, A. Macagnano, E. Martinelli, R. Paolesse, G. D'Arcangelo, C. Roscioni, A. Finazzi-Agrò and A. D'Amico, Biosens. Bioelectron., 2003, 18, 1209–1218 CrossRef CAS PubMed.
- M. Santonico, G. Lucantoni, G. Pennazza, R. Capuano, G. Galluccio, C. Roscioni, G. La Delfa, D. Consoli, E. Martinelli, R. Paolesse, C. Di Natale and A. D'Amico, Lung Cancer, 2012, 77, 46–50 CrossRef CAS PubMed.
- M. Egashira and Y. Shimizu, Sens. Actuators, B, 1993, 13, 443–446 CrossRef CAS.
- H. Nanto, H. Sokooshi and T. Kawai, Sens. Actuators, B, 1993, 14, 715–717 CrossRef CAS.
- H. V. Shurmer, J. W. Gardner and H. T. Chan, Sens. Actuators, 1989, 18, 361–371 CrossRef CAS.
- H.-S. Yim, C. E. Kibbey, S.-C. Ma, D. M. Kliza, D. Liu, S.-B. Park, C. E. Torre and M. E. Meyerhoff, Biosens. Bioelectron., 1993, 8, 1–38 CrossRef CAS PubMed.
- E. Schaller, J. O. Bosset and F. Escher, LWT–Food Sci. Technol., 1998, 31, 305–316 CrossRef CAS.
- M. S. Freund and N. S. Lewis, Proc. Natl. Acad. Sci. U. S. A., 1995, 92, 2652–2656 CrossRef CAS.
- J. V. Hatfield, P. Neaves, P. J. Hicks, K. Persaud and P. Travers, Sens. Actuators, B, 1994, 18, 221–228 CrossRef CAS.
- K. C. Persaud, A. A. Qutob, P. Travers, A. M. Pisanelli and S. Szyszko, in Olfaction and Taste XI, ed. K. Kurihara, N. Suzuki and H. Ogawa, Springer, Tokyo, 1994, pp. 708–709 Search PubMed.
- E. J. Staples, Proceedings of IEEE Ultrasonics Symposium, 1999, 1051-0117 Search PubMed.
- L. Tapasztó, G. Dobrik, P. Lambin and L. P. Biró, Nat. Nanotechnol., 2008, 3, 397 CrossRef PubMed.
- J. Feng, W. Li, X. Qian, J. Qi, L. Qi and J. Li, Nanoscale, 2012, 4, 4883–4899 RSC.
- X. Yu, H. Cheng, M. Zhang, Y. Zhao, L. Qu and G. Shi, Nat. Rev. Mater., 2017, 2, 17046 CrossRef CAS.
- L. Shi, J. Chen, L. Teng, L. Wang, G. Zhu, S. Liu, Z. Luo, X. Shi, Y. Wang and L. Ren, Small, 2016, 12, 4165–4184 CrossRef CAS PubMed.
- L. Pang, C. Dai, L. Bi, Z. Guo and J. Fan, Nanoscale Res. Lett., 2017, 12, 564 CrossRef PubMed.
- D. V. Kosynkin, A. L. Higginbotham, A. Sinitskii, J. R. Lomeda, A. Dimiev, B. K. Price and J. M. Tour, Nature, 2009, 458, 872 CrossRef CAS PubMed.
- Z. Wei, Z. Qiang, Z. Meng-Qiang and K. Luise Theil, Nanotechnology, 2013, 24, 275301 CrossRef PubMed.
- O. J. Guy, G. Burwell, Z. Tehrani, A. Castaing, K. A. Walker and S. H. Doak, Mater. Sci. Forum, 2012, 711, 246–252 CAS.
- P. Suvarnaphaet and S. Pechprasarn, Sensors, 2017, 17, 2161 CrossRef PubMed.
- E. Kovalska, I. Pavlov, P. Deminskyi, A. Baldycheva, F. Ö. Ilday and C. Kocabas, ACS Omega, 2018, 3, 1546–1554 CrossRef CAS PubMed.
- L. Baraton, Z. B. He, C. S. Lee, C. S. Cojocaru, M. Châtelet, J. L. Maurice, Y. H. Lee and D. Pribat, EPL, 2011, 96, 46003 CrossRef.
- S. J. Chae, F. Güneş, K. K. Kim, E. S. Kim, G. H. Han, S. M. Kim, H.-J. Shin, S.-M. Yoon, J.-Y. Choi, M. H. Park, C. W. Yang, D. Pribat and Y. H. Lee, Adv. Mater., 2009, 21, 2328–2333 CrossRef CAS.
- T. Shimada, T. Sugai, C. Fantini, M. Souza, L. G. Cançado, A. Jorio, M. A. Pimenta, R. Saito, A. Grüneis, G. Dresselhaus, M. S. Dresselhaus, Y. Ohno, T. Mizutani and H. Shinohara, Carbon, 2005, 43, 1049–1054 CrossRef CAS.
- M. Phillips, K. Gleeson, J. M. B. Hughes, J. Greenberg, R. N. Cataneo, L. Baker and W. P. McVay, Lancet, 1999, 353, 1930–1933 CrossRef CAS.
- V. Georgakilas, M. Otyepka, A. B. Bourlinos, V. Chandra, N. Kim, K. C. Kemp, P. Hobza, R. Zboril and K. S. Kim, Chem. Rev., 2012, 112, 6156–6214 CrossRef CAS PubMed.
- S. C. Sparks, A. Szabo, G. J. Szulczewski, K. Junker and J. M. White, J. Phys. Chem. B, 1997, 101, 8315–8323 CrossRef CAS.
- X.-D. Wang, Ch.-J. Xuan, W.-L. Feng and Sh. X. Tian, J. Chem. Phys., 2015, 142, 064316 CrossRef PubMed.
- I. N. Kholmanov, C. W. Magnuson, A. E. Aliev, H. Li, B. Zhang, J. W. Suk, L. L. Zhang, E. Peng, S. H. Mousavi, A. B. Khanikaev, R. Piner, G. Shvets and R. S. Ruoff, Nano Lett., 2012, 12, 5679–5683 CrossRef CAS PubMed.
- T. H. Seo, A. H. Park, S. Park, S. Chandramohan, G. H. Lee, M. J. Kim, C.-H. Hong and E.-K. Suh, Opt. Mater. Express, 2015, 5, 314–322 CrossRef.
- M.-Y. Li, C.-H. Chen, Y. Shi and L.-J. Li, Mater. Today, 2016, 19, 322–335 CrossRef CAS.
Footnote |
| † Electronic supplementary information (ESI) available. See DOI: 10.1039/c8nr08405j |
| This journal is © The Royal Society of Chemistry 2019 |

