
Bone remodeling-inspired dual delivery electrospun nanofibers for promoting bone regeneration†
Yi
Wang
a,
Wenguo
Cui
 b,
Xin
Zhao
c,
Shizhu
Wen
a,
Yulong
Sun
a,
Jianmin
Han
*d and
Hongyu
Zhang
*a
b,
Xin
Zhao
c,
Shizhu
Wen
a,
Yulong
Sun
a,
Jianmin
Han
*d and
Hongyu
Zhang
*a
aState Key Laboratory of Tribology, Department of Mechanical Engineering, Tsinghua University, Beijing 100084, China. E-mail: zhanghyu@tsinghua.edu.cn; Tel: +86 010 62796053
bShanghai Institute of Traumatology and Orthopaedics, Shanghai Key Laboratory for Prevention and Treatment of Bone and Joint Diseases, Ruijin Hospital, Shanghai Jiao Tong University School of Medicine, Shanghai 200025, China
cDepartment of Biomedical Engineering, The Hong Kong Polytechnic University, Hung Hom, Hong Kong, China
dDepartment of Dental Materials, National Engineering Laboratory for Digital and Material Technology of Stomatology, Peking University School and Hospital of Stomatology, Beijing 100081, China. E-mail: hanjianmin@bjmu.edu.cn; Tel: +86 010 82195769
First published on 10th October 2018
Abstract
Developing a highly bioactive bone tissue engineering scaffold that can modulate the bone remodeling process for promoting bone regeneration is a great challenge. In order to tackle this issue, inspired by the balance between bone resorption and formation in the bone remodeling process, here we developed a mesoporous silicate nanoparticle (MSN)-based electrospun polycaprolactone (PCL)/gelatin nanofibrous scaffold to achieve dual delivery of alendronate (ALN) and silicate for a synergetic effect in modulating bone remodeling, where ALN inhibited the bone-resorbing process via preventing guanosine triphosphate-related protein expression, and silicate promoted the bone-forming process via improving vascularization and bone calcification. The scaffold was successfully prepared by encapsulation of ALN into MSNs (ALN@MSNs) and co-electrospinning of an acetic acid-mediated PCL/gelatin homogeneous solution with well-dispersed ALN@MSNs. The results of ALN and Si element release profiles indicated that the ALN@MSN-loaded nanofibers achieved dual release of ALN and silicate (produced due to the hydrolysis of MSNs) simultaneously. The bone repair data from a rat critical-sized cranial defect model revealed that the developed strategy accelerated the healing time from 12 weeks to 4 weeks, almost three times faster, while the other nanofiber groups only had limited bone regeneration at 4 weeks. In addition, we used interactive double-factor analysis of variance for the data of bone volume and maturity to evaluate the synergetic effect of ALN and silicate in promoting bone regeneration, and the result clearly proved our original design and hypothesis. In summary, the presented bone remodeling-inspired electrospun nanofibers with dual delivery of ALN and silicate may be highly promising for bone repair in the clinic.
1. Introduction
Natural bone is a vascularized tissue that is constantly updated and remodeled throughout lifetime.1 Bone remodeling is a highly complex biochemical reaction that consists of both the osteoclast-mediated bone resorption process and the osteoblast-mediated bone formation process.2 The effect of bone remodeling depends entirely on the balance of bone resorption and bone formation, where plenty of cytokines are involved.3–5 For bone resorption, many signaling pathways regulate the differentiation and function of osteoclasts. As a typical example, the guanosine triphosphate (GTP)-binding proteins are responsible for osteoclasts’ transcytosis route.6 For bone formation, the effect of bone regeneration mainly relies on bone calcification, which is related to osteoblasts’ differentiation.7 Besides, vascularization is of great importance for bringing timely nutrient supply to the newly formed bones. It has been proven that angiogenesis can promote osteogenesis and facilitate bone maturation.8 At present, the most widely studied strategy for promoting bone regeneration is bone tissue engineering.9 However, to the best of our knowledge, almost all reported designs of bone tissue engineering scaffolds have been focusing on only one aspect of bone remodeling, in particular the bone formation process, such as promoting the differentiation of bone stem cells, while neglecting the synergistic relationship between bone resorption and bone formation in the bone remodeling process.10,11 Therefore, in order to develop a more bioactive scaffold to repair bone defects as rapidly and effectively as possible, a multi-functional scaffold that can simultaneously modulate the balance of bone resorption and bone regeneration should be designed.To date, among various bone tissue engineering scaffolds, electrospun nanofibers have been widely developed and attracted massive attention due to their superior ability to promote osteogenesis.12,13 Electrospinning is a versatile and popular technology that can produce nanofibers with highly controllable hierarchical structures and desirable components.14 Moreover, the electrospun nanofibers possess interconnected porous microstructures, which preferably mimic the natural extracellular matrix structure, rendering them as a temporary platform for the osteoblast cells to migrate, adhere, differentiate and proliferate until new bones are formed. Meanwhile, the free-standing electrospun nanofibrous membranes can be easily cut into any desired shape to match irregular bone defects to promote osteointegration. Furthermore, a variety of bioactive agents can also be incorporated into the single nanofiber interior or grafted to the single nanofiber surface to achieve localized and sustained drug delivery.15,16 In our previous research, it was shown that electrospun polycaprolactone (PCL)/gelatin nanofibers could be used as a potential bone tissue engineering scaffold.17 PCL is a biodegradable and biocompatible polymer approved for biomedical applications by the U.S. Food and Drug Administration (FDA). So far, PCL has been extensively used for bone tissue engineering due to its suitable tensile property and biocompatibility. However, PCL chains lack bioactive sites for promoting cell adhesion. Gelatin, as a hydrophilic protein containing an arginine–glycine–aspartic peptide (RGD peptide sequence), has been widely used to be composited with PCL in order to enhance cell adhesion to the nanofibers.18 Consequently, incorporating gelatin into nanofibers can improve the hydrophilicity and make the nanofibers and tissue fit much better.19
Alendronate sodium (ALN) is a kind of nitrogen-containing bisphosphonate approved by U.S. Food and Drug Administration, and has been widely used for preventing and curing osteoporosis in the clinic.20 It is confirmed both in vitro and in vivo that ALN can inhibit osteoclastic bone resorption via GTP associated pathways.21 For instance, Qu et al. loaded ALN into ultrahigh molecular weight polyethylene to achieve locally sustainable release, and they validated the effectiveness of this design for preventing osteolysis caused by the wear of artificial joints.22 However, if ALN is taken orally at high doses, it will inevitably induce very serious side effects such as jaw osteonecrosis and gastrointestinal ulceration.23,24 As a consequence, a local administration of ALN with controlled release is practically required. Therefore, it is considered that loading ALN into electrospun nanofibrous scaffolds to achieve localized and sustained release is an appropriate strategy.
Mesoporous silica nanoparticles (MSNs), which have a high specific surface area and large pore volume, have been frequently utilized as controlled drug delivery carriers individually25 or are embedded in electrospun nanofibers to achieve long-term release for tumor treatment26 and peritendinous adhesion prevention.27 MSNs are proven to be biocompatible and biodegradable, and have often been designed for responsive drug delivery.28–30 Beyond these merits, it has been demonstrated lately that MSNs can also be applied for bone tissue engineering due to their drug loading capacity and inorganic constituent.31,32 More attractively, in a very recent research study, Ke et al. showed that loading MSNs into electrospun poly(L-lactic acid) nanofibers significantly improved angiogenesis and accelerated diabetic wound healing due to the release of silicate from MSNs within the nanofibers.33 Khashab et al. indicated that the degradation mechanism of MSNs to release silicate was related to the effects of hydration, hydrolysis and ion exchange.34 Silicate produced from MSNs has been confirmed to improve angiogenesis of endothelial cells and bone calcification.35–37
Single drug delivery from electrospun nanofibers has a relatively limited effect on bone regeneration,38 therefore a dual delivery system may represent an optimal design for multifunctional bone tissue engineering scaffolds.39 Inspired by the bone remodeling process, in the present study we designed and developed a MSN-based electrospun PCL/gelatin nanofibrous scaffold for synchronous dual delivery of ALN and silicate to achieve a synergetic effect in modulating the balance of bone resorption and formation, as shown in Scheme 1. The use of MSNs not only promotes localized and sustained delivery of ALN via encapsulating into the mesoporous channels but also enables the sustained release of silicate. Besides, the electrospun PCL/gelatin nanofibrous scaffold possesses optimal cell adhesion and thus has better osteointegration. Furthermore, in order to systematically investigate the in vivo therapy for promoting bone regeneration, a critical-sized rat bone defect model was established, and the designed nanofibrous scaffold was implanted in the bone defect zones and characterized at 4 weeks and 12 weeks. To prove the assumed merits, PCL/gelatin nanofibers, ALN-loaded PCL/gelatin nanofibers and MSN-loaded PCL/gelatin nanofibers were set as control groups versus the experiment group of ALN@MSN-loaded PCL/gelatin nanofibers. The four kinds of specimens were abbreviated as PG, PG-ALN, PG-MSNs and PG-ALN@MSNs, respectively. In particular, interactive double-factor analysis of variance (ANOVA) was conducted for the data of micro-CT and Masson staining to verify the synergistic effect of ALN and silicate in promoting bone regeneration proposed in the present study.
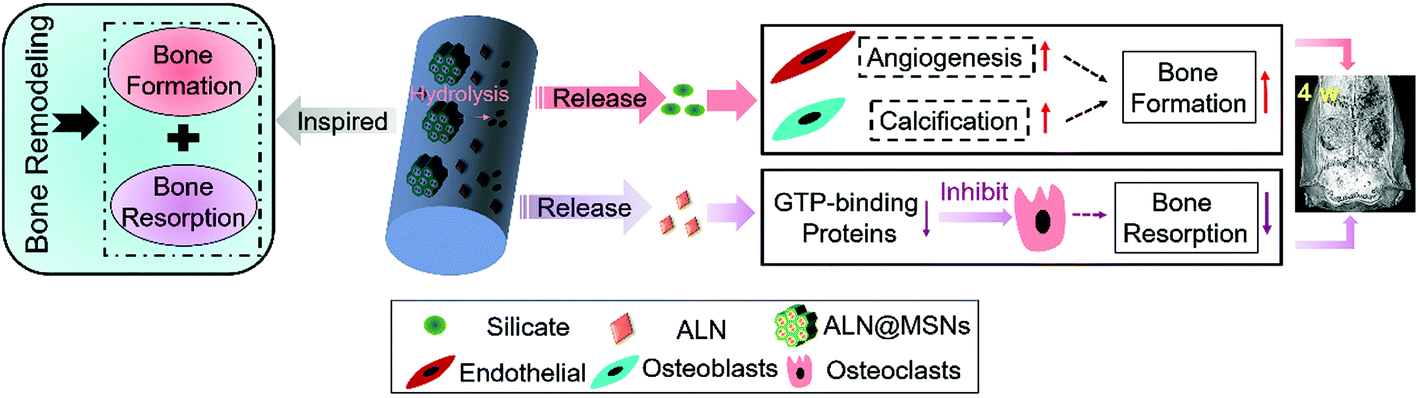 | ||
| Scheme 1 The design of PG-ALN@MSN nanofibers can achieve synchronous dual delivery of ALN and silicate, which further adjusts the balance between bone resorption and bone formation for accelerating bone repair. The ALN pre-loaded within the MSNs is released from the nanofibers and inhibits the bone-resorbing process via preventing GTP-related protein expression, and the silicate produced due to the hydrolysis of MSNs is released from the nanofibers and promotes the bone-forming process via improving vascularization and bone calcification. | ||
2. Experimental section
2.1. Preparation of PG-ALN@MSN nanofibers
The fabrication process of PG-ALN@MSN nanofibers is presented in Fig. 1. As shown in Fig. 1a, MSNs were synthesized through a classic temple-removing method and then loaded with ALN to obtain ALN@MSNs. In the meantime, as depicted in Fig. 1b, an acetic acid (HAc)-mediated PCL/gelatin (w/w: 7/3) homogeneous solution was prepared. The weight ratio of PCL versus gelatin within the nanofibers was chosen as 7![[thin space (1/6-em)]](https://www.rsc.org/images/entities/char_2009.gif) :3, which was determined based on our previous studies, in order to ensure that the added gelatin could function properly whilst not affecting ALN release from the MSNs.15,17 In sequence, the ALN@MSNs were carefully added into the PCL/gelatin homogeneous solution followed by ultrasonic treatment to obtain a uniformly-dispersed spinning solution, which was further electrospun into PG-ALN@MSN nanofibrous membranes. Other nanofibrous specimens of the control groups including PG, PG-ALN and PG-MSNs were prepared by changing the compounds based on the same process. The preparation process is described in detail as follows.
:3, which was determined based on our previous studies, in order to ensure that the added gelatin could function properly whilst not affecting ALN release from the MSNs.15,17 In sequence, the ALN@MSNs were carefully added into the PCL/gelatin homogeneous solution followed by ultrasonic treatment to obtain a uniformly-dispersed spinning solution, which was further electrospun into PG-ALN@MSN nanofibrous membranes. Other nanofibrous specimens of the control groups including PG, PG-ALN and PG-MSNs were prepared by changing the compounds based on the same process. The preparation process is described in detail as follows.
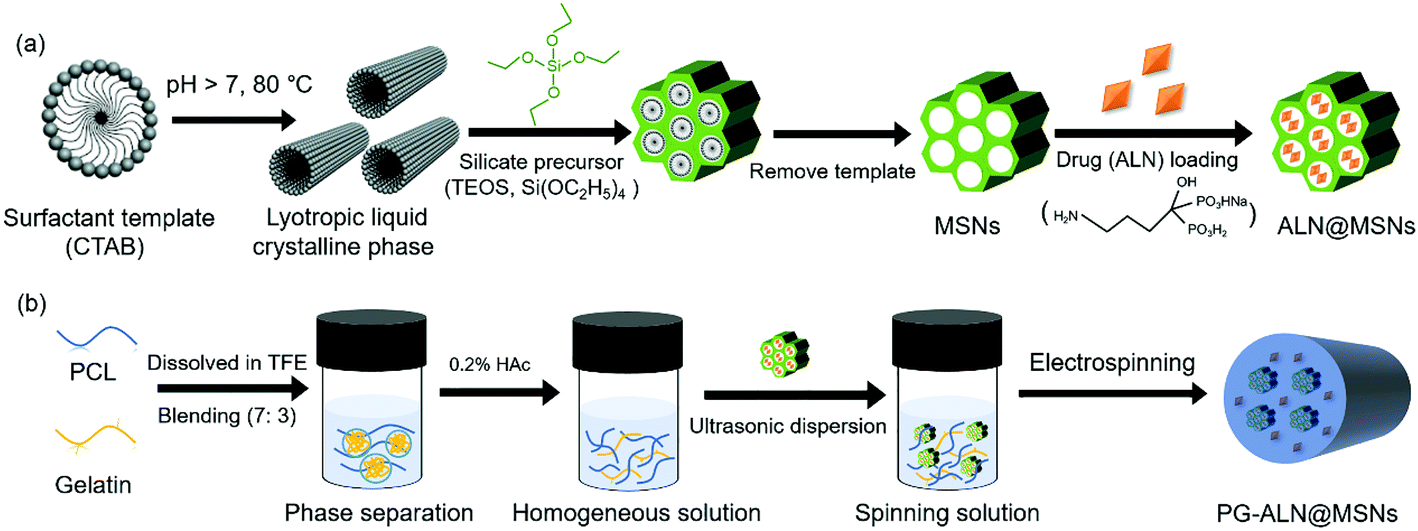 | ||
| Fig. 1 Schematic illustration showing the fabrication process of electrospun PG-ALN@MSN nanofibers. (a) Preparation of ALN@MSNs. (b) Electrospinning of PG-ALN@MSN nanofibers. The final spinning solution was obtained by well dispersing ALN@MSNs into PCL/gelatin homogeneous solution. | ||
To prepare ALN-loaded MSNs, 0.2 g ALN was dispersed in 50 mL deionized water, and then 0.1 g MSNs were mixed into the solution, followed by continuous stirring for at least 24 h. ALN-loaded MSNs were collected by centrifuging the solution. The final actual drug loading capacity could be calculated by the residual drug content in the supernatant, which was 0.113 g ALN/0.1 g MSNs. The drug content in the supernatant was determined through an ultraviolet and visible spectrometer (Agilent Technology Co. Ltd, Germany). It should be particularly noticed that the standard curve of ALN was established after being reacted with triketohydrindene hydrate, and the purple product was measured at an absorbance of 568 nm. This initial ALN dosage versus MSNs (ALN/MSNs: 0.2 g/0.1 g) was chosen because the actual weight of ALN loaded in MSNs reached saturation at this point, as shown in Fig. S1.†
000) solution in trifluoroethanol (TFE) and 10 wt% gelatin solution in TFE were blended together at a volume ratio of 7:3. HAc (0.2%, v/v) was then added to resolve the phase separation between PCL and gelatin molecular chains. Subsequently, the ALN@ MSNs were carefully incorporated into the PCL/gelatin homogeneous solution. After 10 min of ultrasonic dispersion and 1 h of stirring, the spinning solution was electrospun into nanofibrous membranes with the following parameters: 18 kV voltage, 20 cm distance between the needle tip and the aluminum foil-attached wheel, 5 mL h−1 feeding rate. The PG-ALN@MSN nanofiber sample was harvested from the aluminum foil and then vacuum desiccated to remove any remaining solvent until use.
| Composition | |||||
|---|---|---|---|---|---|
| Sample | PCL (g) | Gelatin (g) | MSNs (g) | ALN (g) | TFE (mL) |
| PG | 1.4 | 0.6 | 0 | 0 | 20 |
| PG-ALN | 1.4 | 0.6 | 0 | 0.113 | 20 |
| PG-MSNs | 1.4 | 0.6 | 0.1 | 0 | 20 |
| PG-ALN@MSNs | 1.4 | 0.6 | 0.1 | 0.113 | 20 |
2.2. Characterization
The silicate release experiment was performed with a similar sampling process and time points. The concentrations of silicate released from PG-MSN and PG-ALN@MSN nanofibers at each time point were represented indirectly through the amount of the silicon element, which was measured employing an inductive coupled plasma-optical emission spectrometer (ICP-OES, IRIS Intrepid II, Thermo, USA). On the other hand, in order to obtain the total amount of the silicon element in the nanofibers, X-ray fluorescence (XRF, XRF-1800, Shimadzu, Japan) was used to determine the silicon element in MSNs, and meanwhile the content of MSNs in the nanofibers was calculated by TGA. Accordingly, the cumulative release profile of silicate could be obtained by dividing the amount of the released silicon element from the nanofibers by the total amount of the silicon element in the corresponding nanofibers.
2.3. Cell experiments
000 cells per well. The CCK-8 measurement was used to determine cell proliferation under the CCK-8 kit protocol. For cell adhesion observation, the cell material was fixed employing 4% paraformaldehyde for 3 h and then gradiently dehydrated with ethanol of different concentrations (30%, 50%, 70%, 80%, 90%, 95%, and 100%) for 5 min, respectively. SEM images were obtained by the same process mentioned in section 2.2.2. The cell areas were measured and counted via the ImageJ software.
000 cells per well. Both normal culture media (α-MEM) and osteoconductive media (Sigma-Aldrich, USA) were used. On day 7 and day 14, the alizarin red staining image was captured, and meanwhile the semi-quantitative measurement of the minerals on the material surface was conducted. The alizarin red staining procedure was followed according to the alizarin red kit protocol. For the semi-quantitative measurement, each well was immersed in cetylpyridinium chloride solution after the images were taken, and the absorbance at 540 nm of the supernatant from each well served as the relative calcium compound amount of each sample.
2.4. Animal experiments
2.5. Statistical analysis
The experiments were performed with multiple duplicate specimens (n ≥ 6). The data were presented as mean ± standard deviation. Statistical significance between the sample groups was determined by single factor ANOVA. The difference was considered significant when * p < 0.05 and #p < 0.005. Besides, in order to determine the synergistic effect of ALN and MSNs, interactive double-factor ANOVA was applied for the micro-CT and Masson staining results, where the difference was considered significant when the p-value of the interactive factor was lower than 0.05 (**).3. Results and discussion
3.1. Characterization of MSNs and nanofibers
The morphologies of MSNs are evaluated by SEM and TEM. As seen from the SEM images in Fig. S2† and the TEM image in Fig. 2a, MSNs have a spherical shape with visible mesoporous channels, and the diameter shows a typical Gaussian distribution (insert in the TEM image) with an average value of about 115 nm, indicating a relatively uniform particle size distribution. The specific surface area and pore volume of MSNs measured by the BET procedure are exhibited in Fig. S3,† which are calculated as 805 m2 g−1 and 0.806 mL g−1, respectively. The isotherm (Fig. S3a†) demonstrates a typical type IV N2 adsorption–desorption pattern, which further confirms the mesoporous structure of the MSNs, ensuring successful drug loading into the channels.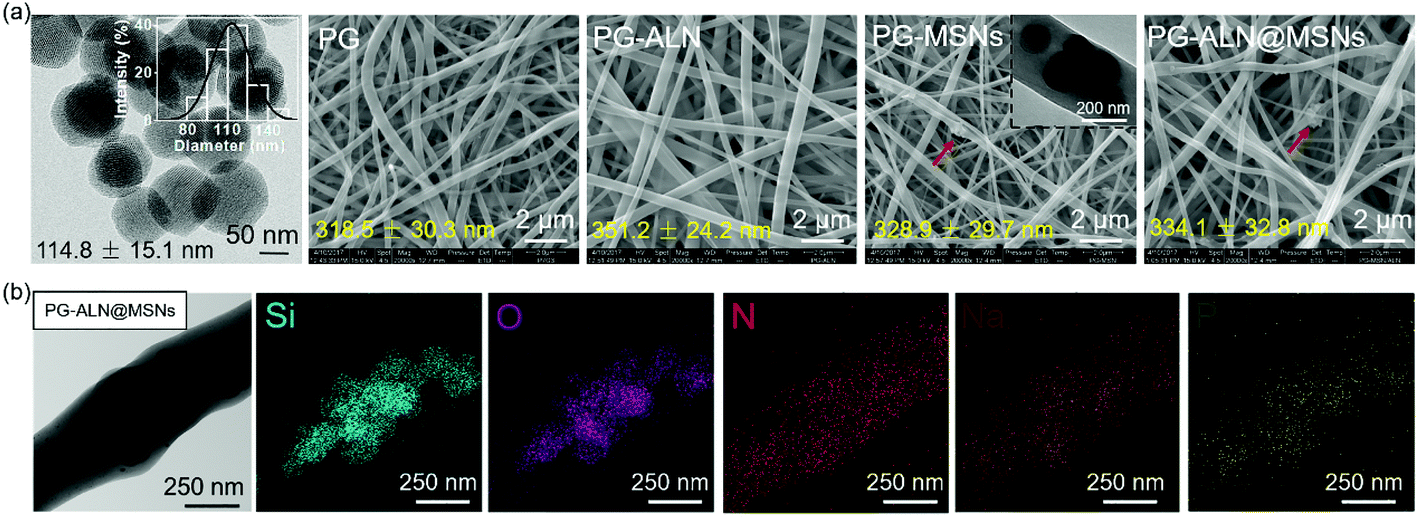 | ||
| Fig. 2 (a) Representative TEM image of MSNs and SEM images of electrospun nanofibers. Inserts are the diameter distribution of MSNs and the TEM image of the PG-MSN sample. The red arrows point to where MSNs may aggregate within the nanofibers. (b) Representative TEM image and the corresponding EDS elemental mappings of the PG-ALN@MSN sample. | ||
As exhibited in Fig. 2a, all the nanofibers possess an interconnected porous structure with uniform distribution of the fiber diameter. There are no significant differences in the fiber diameter between different samples, indicating that the incorporation of ALN and MSNs does not affect the fiber diameter. The inserted TEM image in the SEM graph of PG-MSNs (Fig. 2a) confirms the successful loading of MSNs into nanofibers. There exists visible aggregation of MSNs or ALN@MSNs within the nanofibers where the red arrows point to. Besides, the TEM image and the corresponding energy dispersive spectrometer (EDS) element mappings in Fig. 2b indicate the successful preparation of PG-ALN@MSNs. In detail, based on the consideration that the Si element only comes from MSNs and P and Na elements only originate from ALN, it can be speculated that MSNs and ALN are both successfully incorporated within single nanofibers. In addition, as obviously seen from the EDS mappings, most of the P and Na elements distribute in the corresponding positions of the Si element, indicating that ALN is successfully loaded into the first barrier of MSNs and then the second barrier of PCL/gelatin nanofibers. The other Na and P elements with the distribution that does not correspond to the Si element positions elucidate that a tiny amount of ALN may release from the ALN@MSNs to PCL-gelatin nanofibers, resulting in a major distribution within the MSNs and a minor distribution within the nanofibers.
The thermal and tensile properties of the nanofiber samples are displayed in Fig. 3. The TGA curves in Fig. 3a indicate that the actual composition of each component in the nanofibers is consistent with the initial spinning composition. The DSC heating and cooling curves shown in Fig. 3b and c reveal that the addition of inorganic ALN and MSNs can improve the thermal stability of the nanofibers. For instance, the Tc value of PG-ALN@MSNs (33.28 °C) is around two degrees higher than that of PG (30.54 °C), meanwhile the Tm value of PG-ALN@MSNs (61.98 °C) is about three degrees higher than that of PG (59.04 °C). For tensile properties, as presented in Fig. 3d–f, there are no significant differences between the experiment group and all the control groups for strain at break, tensile strength and Young's modulus because the p values between every two sample groups are higher than 0.05. This indicates that the incorporation of ALN and MSNs within the nanofibers has no influence on the tensile properties.
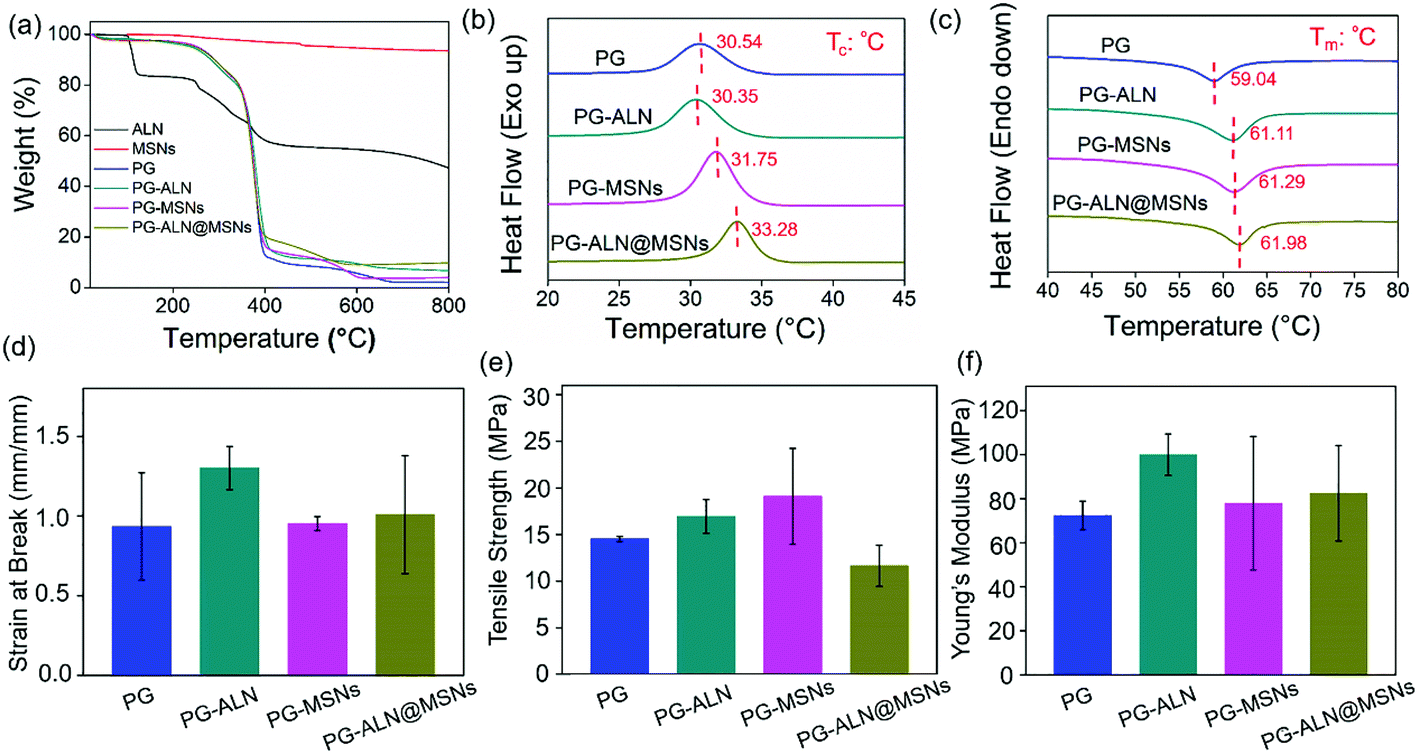 | ||
| Fig. 3 (a) TGA curves of ALN, MSNs and all the nanofiber samples. (b, c) DSC curves of different nanofibers. Tc: crystallization temperature, Tm: melting temperature. (d) Strain at break, (e) tensile strength and (f) Young's modulus of different nanofibers. | ||
3.2. Release profiles of ALN and silicate from nanofibers
To determine the actual ALN content in the release solution, the release medium needs to react with ninhydrin to afford the purple product which can be measured via UV-Vis spectroscopy, as illustrated in Fig. 4a. The image in Fig. 4b manifests that the purple color of the final reacted solution becomes deeper with the increase of the initial ALN concentration, which is the basis to establish the standard curve. The cumulative ALN concentration released from PG-ALN and PG-ALN@MSNs is shown in Fig. 4c. The result clearly demonstrates that ALN is released more slowly from PG-ALN@MSNs compared to PG-ALN, further indicating that the encapsulation of ALN into MSNs can prolong the drug release time. This can be explained by the adsorption of ALN to MSNs due to the ion–dipole interaction between the amino groups of ALN and the hydroxyl groups of MSNs. The stagnation of ALN release at a later period may be ascribed to the slow degradation of PCL in PBS, which is consistent with our previous findings.10 As the excessive use of ALN can lead to serious side effects, the sustained release of ALN from the nanofibers can decrease its high dose-related toxicity. Specifically, ALN has been reported to possess dosage-dependent side effects both in vitro and in vivo, at a dosage of over 10 μM in vitro44 and over 2 mg kg−1in vivo.45 It is found that the total amounts of ALN in the PG-ALN and PG-ALN@MSN nanofibers are comparable to the critical dosage in vitro and in vivo. However, from the results of the release profile, the amounts of ALN released at each time point are all lower than the critical dosage due to the sustained release property from the nanofibers. The burst release from PG-ALN@MSN samples within one day is attributed to the tiny amount of ALN, which is distributed in the nanofibers but without the first barrier of MSNs, as discussed in section 3.1. Additionally, the cumulative release profiles of silicate from PG-MSN and PG-ALN@MSN nanofibers are depicted in Fig. 4d. It is obvious that the silicate concentration increases gradually with the test time, indicating that the PG-MSN and PG-ALN@MSN nanofibers enable sustained silicate release. Besides, it is noted that the silicate release speed is slower for PG-ALN@MSNs than for PG-MSNs. It has been reported that silicate hydrolysis is related to MSNs’ pore size and porosity,34 and larger pore size and higher porosity allow more water molecules to enter into MSNs, promoting the silicate release process. Therefore, the slower silicate release for PG-ALN@MSNs can be explained by the encapsulation of ALN into MSNs, which results in the reduction of MSNs’ pore size and porosity. Overall, the results shown in Fig. 4c and d demonstrate clearly the simultaneous dual release of ALN and silicate from the PG-ALN@MSN nanofibers.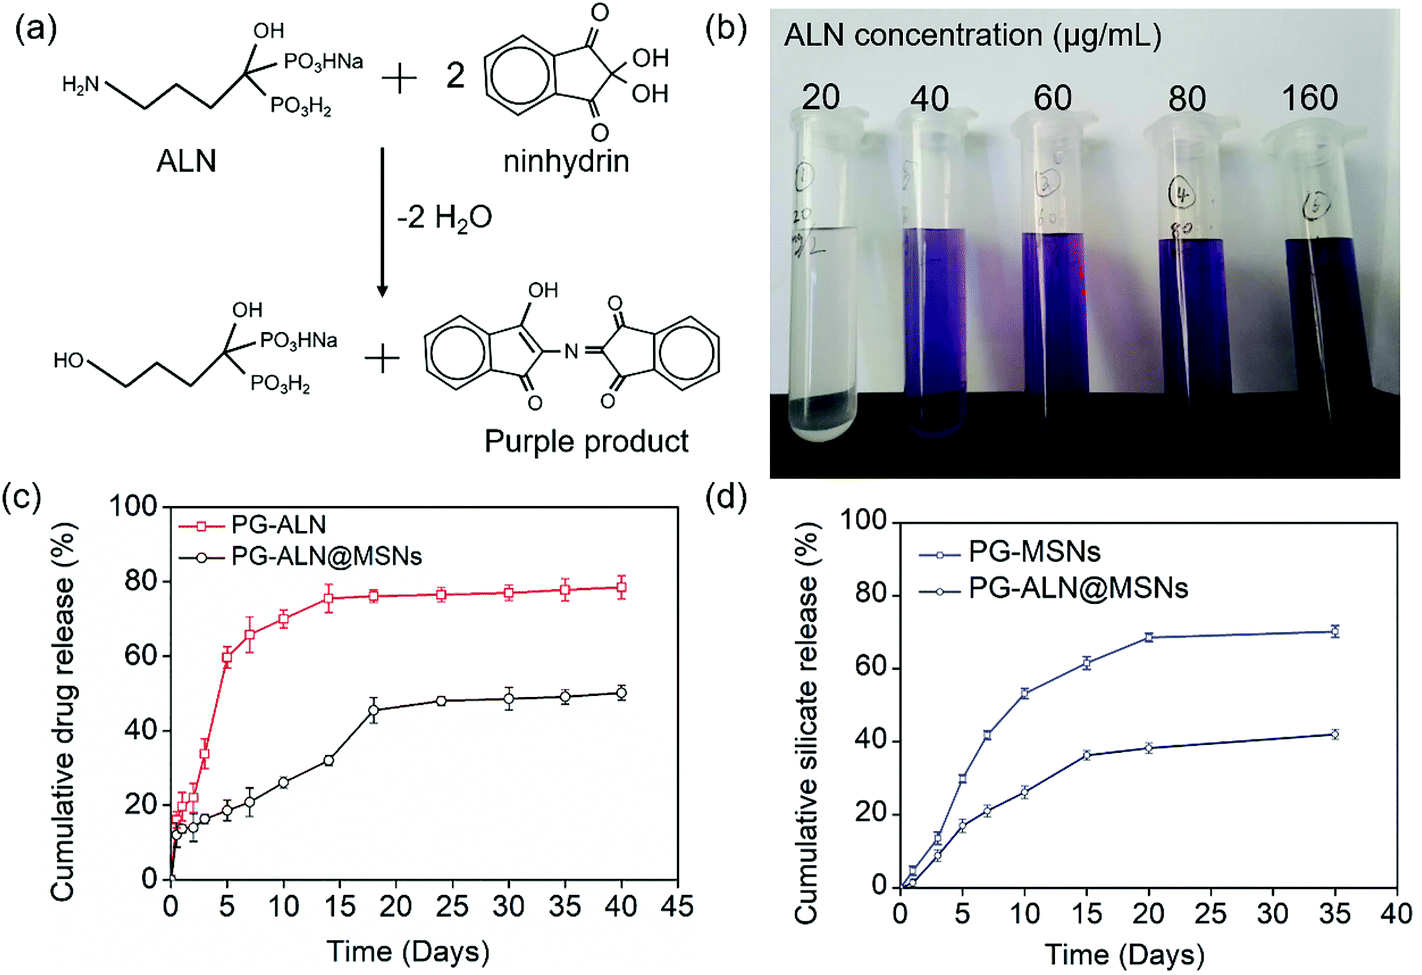 | ||
| Fig. 4 (a) Chemical reaction of ALN and ninhydrin to generate a purple product, which is the basis for the determination of the ALN concentration in the release solution. (b) An image of the final reacted solutions which correspond to different ALN concentrations. (c) Cumulative ALN release profiles of PG-ALN and PG-ALN@MSN nanofibers. (d) Cumulative silicate release profiles of the PG-MSN and PG-ALN@MSN nanofibers. | ||
3.3. Cell adhesion and proliferation
The interaction between MC3T3-e1 cells and nanofibers is displayed in Fig. 5. It is indicated in Fig. 5a that the cells adhere to all the nanofibers quite well because the nanofibers contain gelatin with the RGD peptide, which has been shown to promote cell adhesion. Besides, as determined in Fig. 5c, the average cell areas of the PG-MSN and PG-ALN@MSN samples (with MSNs) are significantly higher than those of the PG and PG-ALN samples (without MSNs). This phenomenon may be explained by the high bioactivity of MSNs for promoting cell spreading, which has been proven in the study performed by Du et al., where the MSN-embedded nanofibers induce obviously higher cell spreading areas.46 In addition, the result of the CCK-8 measurement (Fig. 5b) shows that all the nanofibers possess superior biocompatibility to MC3T3-e1 cells as expected. Therefore, it is speculated that the nanofibers are able to support cell adhesion and proliferation.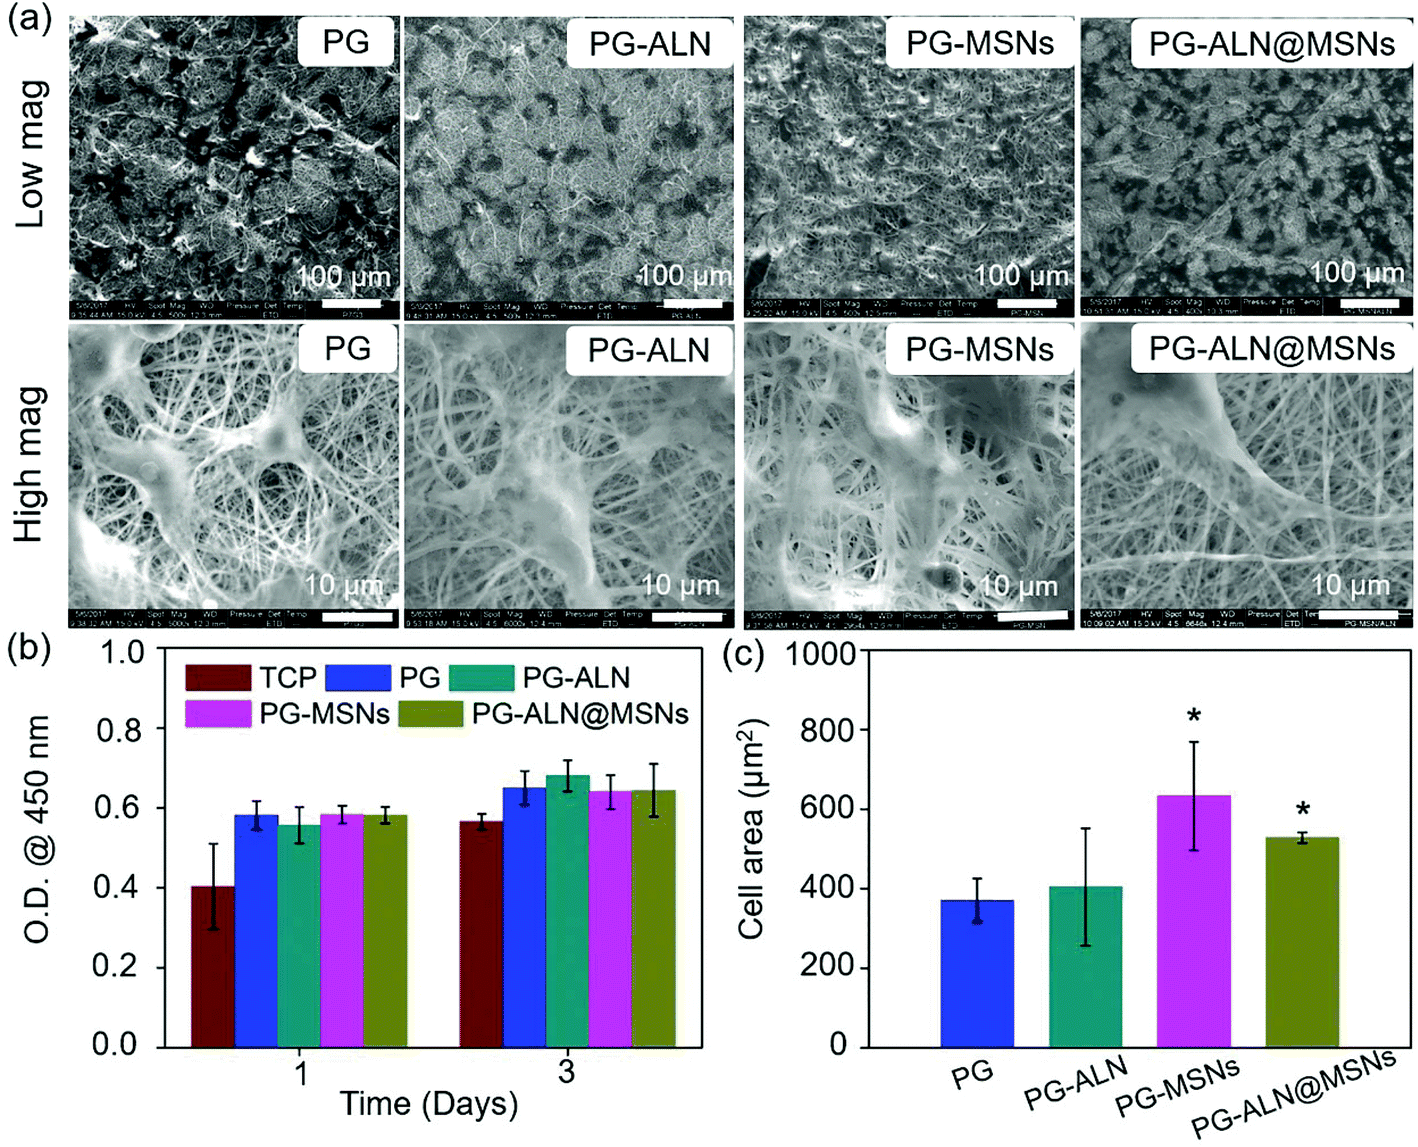 | ||
| Fig. 5 (a) Representative SEM images of MC3T3-e1 cells that adhere to different nanofibers on day 3. (b) The CCK-8 measurement of all the nanofibers on day 1 and day 3. (c) Cell spreading area counted from the representative SEM images. * p < 0.05 compared with the PG group. | ||
3.4. Alizarin red measurement
The in vitro osteogenic characterization is conducted by alizarin red measurement, as shown in Fig. 6. Alizarin red is a commonly used calcium nodule indicator associated with osteogenesis in vitro. From the staining images in Fig. 6a, it can be observed in general that (i) the tissue culture plate (TCP) groups cultured in normal media almost have no calcium nodules both on 7 days and 14 days, while all the sample groups cultured in normal media have large areas of osteogenic mineralization; (ii) all the sample groups cultured in osteoconductive media seem to have similar osteogenic capability to that of the TCP groups both on 7 days and 14 days. In addition, the semi-quantitative relative values summarized in Fig. 6b and c indicate that (i) when cultured in normal media both on 7 days and 14 days, all the sample groups have significantly higher calcification amounts than the TCP groups. In particular, the PG-ALN, PG-MSN and PG-ALN@MSN groups possess significantly better osteoinductivity than the PG group on day 7; (ii) there are no significant differences between the TCP groups and all the sample groups both on day 7 and day 14 when cultured in osteoconductive media. These results indicate that the nanofibers are beneficial to the osteogenesis of MC3T3-e1 cells.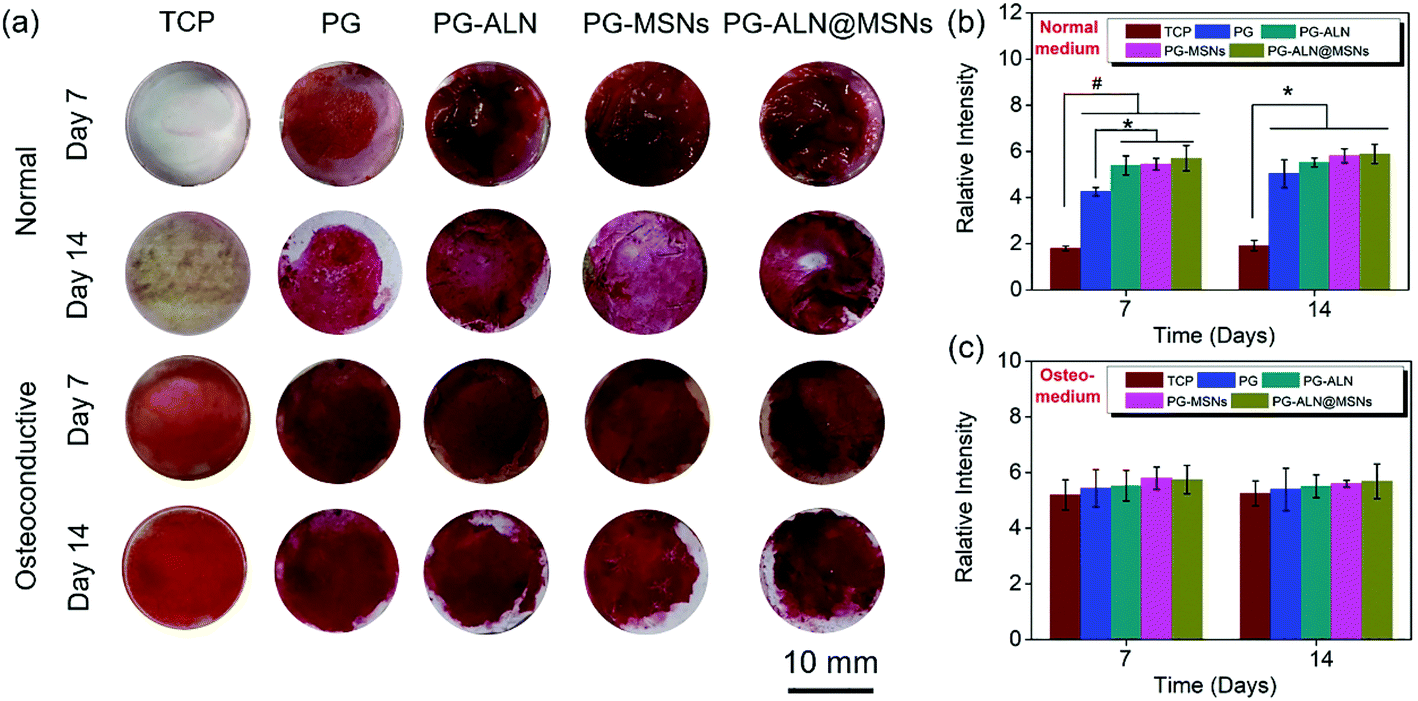 | ||
| Fig. 6 (a) Selected alizarin red staining images in normal and osteoconductive media on day 7 and day 14. Relative amount of calcium compounds on the samples’ surfaces of (b) normal medium and (c) osteoconductive medium. * p < 0.05, # p < 0.005. The tissue culture plate (TCP) group is set as the blank control. | ||
3.5. In vivo repair of critical-sized cranial defects
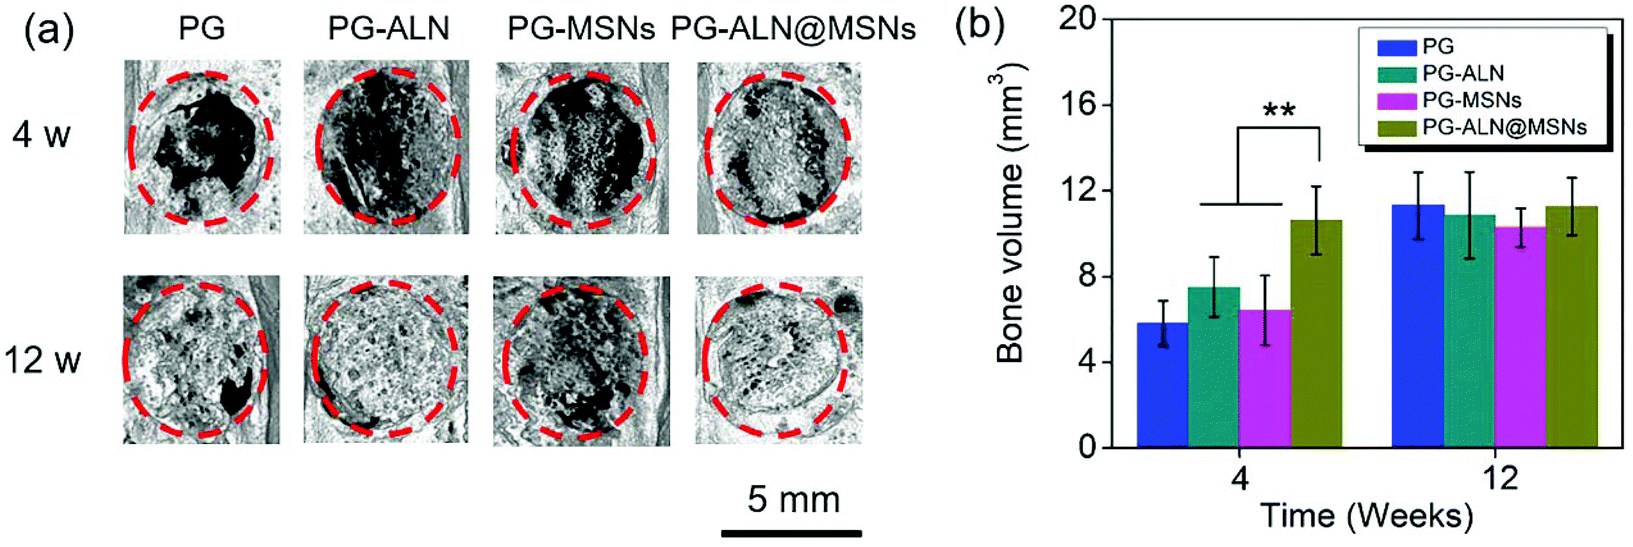 | ||
| Fig. 7 (a) Representative micro-CT reconstruction images on week 4 and week 12. The red dotted lines stand for the boundary of critical-sized bone defects. The scale bar is 5 mm. (b) The newly formed bone volume calculated from the micro-CT reconstruction images (n = 5) of all the samples. ** p < 0.05, interactive double-factor ANOVA. | ||
Masson staining is a common approach that can determine the maturity of the bone tissue. In the Masson staining images, mature bones are stained bright red, while immature bones are stained blue. From Fig. 8a, it can be clearly seen that at 4 weeks the PG-ALN@MSN group possesses the maximum area of mature bones compared to all the other control groups where immature bones predominate the majority areas. At 12 weeks, the area of mature bones in the PG, PG-ALN and PG-MSN groups increases slightly, but is still less than that of the PG-ALN@MSN group. The semi-quantitative values of bone maturity revealed in Fig. 8c are consistent with the Masson staining result. Both at 4 weeks and 12 weeks, the interactive double-factor ANOVA indicates that ALN and MSNs have a significant interactive effect on the relative bone maturity. Besides, at 4 weeks, the bone maturity value of the PG-ALN@MSN group is higher than 60%, which is significantly higher than that of the PG-ALN and PG-MSN groups. Even at 12 weeks, the PG-ALN@MSN group possesses a bone maturity value of about 80%, while those of all the other groups are less than 40%. Based on these qualitative and semi-quantitative results of Masson staining, it can be speculated that the loading of ALN and MSNs into the nanofibers may have a synergistic effect in promoting the maturity of regenerated bone, thus accelerating the repair of critical-sized cranial defects.
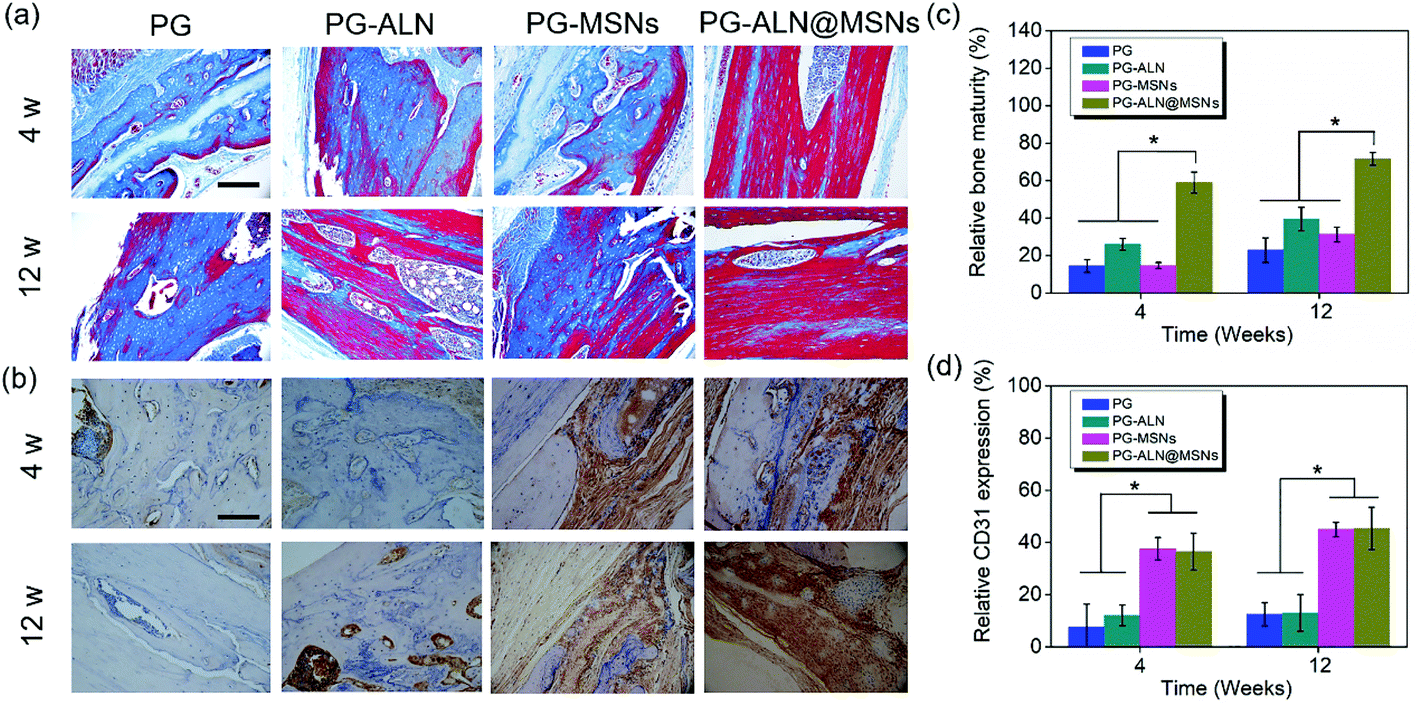 | ||
| Fig. 8 Determination of bone maturity and angiogenesis of the regenerated bone tissue. (a) Representative Masson staining images of the harvested regenerated skull tissue at 4 weeks and 12 weeks. The blue zones represent the immature bone tissue, while the red zones represent the mature bone tissue. Scale bar is 50 μm. (b) Representative IHC images of CD31 staining of the harvested regenerated skull tissue at 4 weeks and 12 weeks. CD31 is expressed in a dark brown color. Scale bar is 50 μm. (c) The relative bone maturity value reflected by the red regions at 4 weeks and 12 weeks. (d) The relative CD31 expression reflected by the dark brown regions at 4 weeks and 12 weeks. ** p < 0.05, interactive double-factor ANOVA. | ||
In IHC measurements, CD31 secreted by endothelial cells is usually used to evaluate the degree of angiogenesis. The formation of new blood vessels is crucial for bone regeneration. In order to testify that MSNs within nanofibers have a positive effect on angiogenesis, the CD31 staining images and the corresponding semi-quantitative result are presented in Fig. 8b and d, respectively. As exhibited in Fig. 8b, the PG-MSN and PG-ALN@MSN groups possess much more CD31 positive areas than the PG and PG-ALN groups both at 4 weeks and 12 weeks. Similarly, the semi-quantitative result shown in Fig. 8d demonstrates that the relative CD31 expression of the PG-MSN and PG-ALN@MSN groups is significantly higher than that of the PG and PG-ALN groups both at 4 weeks and 12 weeks. The CD31 IHC results indicate that the MSNs loaded within the electrospun nanofibers facilitate vascularization during bone regeneration via silicate release (Fig. 4d).
To further evaluate bone calcification, OC, which plays an important role in adjusting bone calcium metabolism, was measured by IHC analysis. The OC staining images and corresponding relative expression are presented in Fig. 9a and c, respectively. It can be observed that at 4 weeks, the relative OC expression of the PG-ALN@MSN group is significantly higher than that of all the other control groups with a p value lower than 0.005. However, at 12 weeks, all the different nanofiber groups have no significant differences between each other. This trend is in accordance with the micro-CT result.
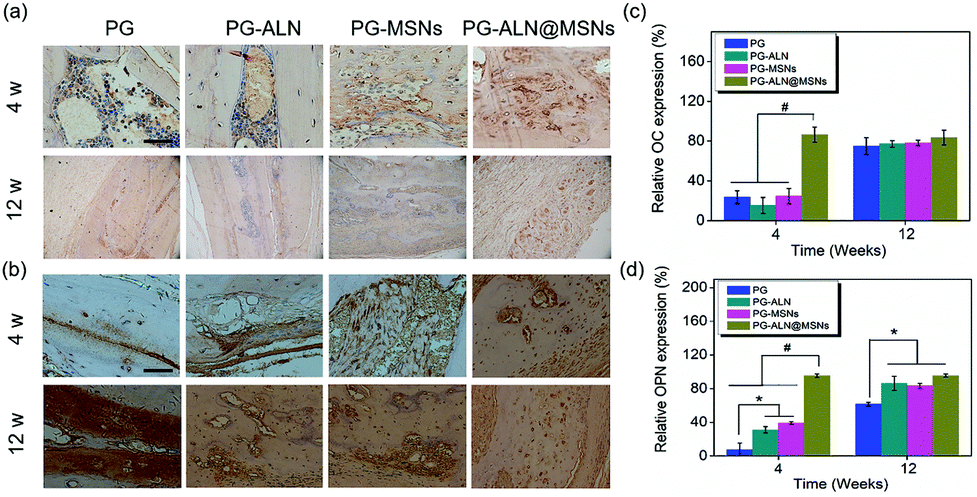 | ||
| Fig. 9 (a) Representative IHC images of OC staining of the harvested regenerated skull tissue at 4 weeks and 12 weeks. Scale bar is 50 μm. (b) Representative IHC images of OPN staining of the harvested regenerated skull tissue at 4 weeks and 12 weeks. Scale bar is 50 μm. (c) Relative OC expression at 4 weeks and 12 weeks. (d) Relative OPN expression at 4 weeks and 12 weeks. * p < 0.05, # p < 0.005. | ||
It has been indicated that OPN can inhibit adipogenesis and promote osteogenesis by using mesenchymal stem cells.47 Therefore, OPN is also chosen for IHC analysis to gain an insight into the mechanism of PG-ALN@MSN nanofibers in accelerating bone repair. As shown in Fig. 9b, at 4 weeks, the OPN positive area of the PG-ALN@MSN group is clearly larger than that of the PG, PG-ALN and PG-MSN groups. The corresponding semi-quantitative data (Fig. 9d) at 4 weeks indicate that relative OPN expression is significantly higher (p < 0.005) in the PG-ALN@MSN group than in all the other control groups. In addition, compared with the PG group, the PG-ALN and PG-MSN groups possess significantly higher (p < 0.05) relative OPN expression at 4 weeks. At 12 weeks, as demonstrated in Fig. 9b and d, there are no significant differences between the PG-ALN@MSN group and the other two groups (PG-ALN and PG-MSNs). However, the PG-ALN, PG-MSN and PG-ALN@MSN groups still possess significantly higher relative OPN expression compared with the PG group.
3.6. Mechanism of accelerating bone regeneration
As demonstrated from the results of the in vivo repair of critical-sized cranial defects, it can be concluded that bone regeneration is prominently accelerated through dual delivery of ALN and silicate from electrospun ALN@MSN-loaded PCL/gelatin nanofibers. As expected, the PG-ALN@MSN nanofibers can accelerate the bone regeneration process from 12 weeks to 4 weeks, based on the medical characterization discussed in detail in section 3.5. The data of bone volume and maturity in Fig. 7b and 8c, which have been analyzed by interactive double-factor ANOVA, demonstrate the significant synergetic effect of ALN and MSNs, as mentioned in sections 3.5.2 and 3.5.3. Naturally, human bone is a highly vascularized tissue with the ability to remodel throughout lifetime by the regulated activity of bone-resorbing (osteoclasts) and bone-forming (osteoblasts) cells.8,48 The possible accelerating mechanism can be explained due to the synergistic effect of dual delivery of ALN and silicate from the PG-ALN@MSN nanofibers on the bone resorbing-forming process. ALN has been proven to be a potential inhibitor of osteoclastic bone resorption via GTP-related pathways; thus it can inhibit the activity of osteoclasts.21 Additionally, silicate, which is produced from the MSNs based on the process of hydration, hydrolysis and ion exchange (Fig. S7†)29 and then released from PG-ALN@MSN nanofibers, has been demonstrated to improve angiogenesis and bone calcification.36 In the bone regeneration process, the newly formed bones with intensive new blood vessels have sufficient nutrient supply, which can further accelerate bone repair. For the PG-ALN@MSN nanofibers, ALN and silicate can both be sustainably released from PCL/gelation nanofibers (Fig. 4c and d), which enables continuous synergy in the bone regeneration process as proved by the in vivo data. However, the nanofibers only with ALN (PG-ALN) or MSNs (PG-MSNs) cannot achieve obvious bone repair at the early stage, i.e. at 4 weeks.4. Conclusions
In summary, inspired by the bone remodeling process, we successfully accelerated bone regeneration through dual delivery of ALN and silicate from electrospun ALN@MSN-loaded PCL/gelatin nanofibers for a synergetic effect in modulating the balance between bone resorption and formation. The in vivo data of the micro-CT measurement and Masson staining proved the synergetic effect of ALN and MSNs on bone volume and maturity, based on the interactive double-factor ANOVA. The PG-ALN@MSN group could reduce bone healing time from 12 weeks to nearly 4 weeks, almost three times faster. Besides, at 4 weeks, the maturity of the newly formed bones exceeded 60% in the PG-ALN@MSN group, which was significantly higher than that of all the other control groups. Likewise, at 12 weeks, the PG-ALN@MSN group possessed about 80% bone maturity, while the bone maturity values of all the other groups were less than 40%. In addition, both at 4 weeks and 12 weeks, more new blood vessels were observed in MSN-loaded nanofibers than in those without MSNs, which could introduce sufficient nutrient supply to the newly formed bones. Therefore, in this study the electrospun ALN@MSN-loaded PCL/gelatin nanofibers may represent great promise for accelerating bone regeneration in the clinic, and we believe the developed strategy will inspire the design of highly active osteogenic scaffolds in the future.Conflicts of interest
There are no conflicts of interest to declare.Acknowledgements
This work is financially supported by the National Natural Science Foundation of China (grant no. 51675296), the Ng Teng Fong Charitable Foundation (grant no. 202-278-132-13), the Tsinghua University Initiative Scientific Research Program (grant no. 20151080366), and the Research Fund from the State Key Laboratory of Tribology, Tsinghua University, China (grant no. SKLT2018B08).References
- O. Tsigkou, I. Pomerantseva, J. A. Spencer, P. A. Redondo, A. R. Hart, E. O'Doherty, Y. Lin, C. C. Friedrich, L. Daheron and C. P. Lin, Proc. Natl. Acad. Sci. U. S. A., 2010, 107, 3311–3316 CrossRef CAS.
- K. Ikeda and S. Takeshita, J. Bone Metab., 2014, 21, 163 CrossRef PubMed.
- A. Shieh, W. Han, S. Ishii, G. A. Greendale, C. J. Crandall and A. S. Karlamangla, J. Clin. Endocrinol. Metab., 2016, 101, 2802–2809 CrossRef CAS PubMed.
- R. Sapir-Koren and G. Livshits, Osteoporosis Int., 2014, 25, 2685–2700 CrossRef CAS.
- N. M. Appelman-Dijkstra and S. E. Papapoulos, Drugs, 2015, 75, 1049–1058 CrossRef CAS.
- A. Cappariello, A. Maurizi, V. Veeriah and A. Teti, Arch. Biochem. Biophys., 2014, 558, 70–78 CrossRef CAS.
- A. Henmi, H. Okata, T. Anada, M. Yoshinari, Y. Mikami, O. Suzuki and Y. Sasano, J. Bone Miner. Metab., 2016, 34, 41–50 CrossRef CAS.
- L. H. Nguyen, N. Annabi, M. Nikkhah, H. Bae, L. Binan, S. Park, Y. Kang, Y. Yang and A. Khademhosseini, Tissue Eng., Part B, 2012, 18, 363–382 CrossRef CAS.
- C. R. Black, V. Goriainov, D. Gibbs, J. Kanczler, R. S. Tare and R. O. Oreffo, Curr. Mol. Biol. Rep., 2015, 1, 132–140 CrossRef PubMed.
- A. Paul, V. Manoharan, D. Krafft, A. Assmann, J. A. Uquillas, S. R. Shin, A. Hasan, M. A. Hussain, A. Memic, A. K. Gaharwar and A. Khademhosseini, J. Mater. Chem. B, 2016, 4, 3544–3554 RSC.
- A. K. Gaharwar, S. M. Mihaila, A. Swami, A. Patel, S. Sant, R. L. Reis, A. P. Marques, M. E. Gomes and A. Khademhosseini, Adv. Mater., 2013, 25, 3329–3336 CrossRef CAS PubMed.
- Z. Chen, A. Bachhuka, F. Wei, X. Wang, G. Liu, K. Vasilev and Y. Xiao, Nanoscale, 2017, 9, 18129–18152 RSC.
- F. Cristofaro, M. Gigli, N. Bloise, H. Chen, G. Bruni, A. Munari, L. Moroni, N. Lotti and L. Visai, Nanoscale, 2018, 10, 8689–8703 RSC.
- G. Yang, X. Li, Y. He, J. Ma, G. Ni and S. Zhou, Prog. Polym. Sci., 2018, 81, 80–113 CrossRef CAS.
- Y. Wang, C. Luo, G. Yang, X. Wei, D. Liu and S. Zhou, Macromol. Biosci., 2016, 16, 1598–1609 CrossRef CAS PubMed.
- L. Cheng, X. Sun, X. Zhao, L. Wang, J. Yu, G. Pan, B. Li, H. Yang, Y. Zhang and W. Cui, Biomaterials, 2016, 83, 169–181 CrossRef CAS PubMed.
- K. Ren, Y. Wang, T. Sun, W. Yue and H. Zhang, Mater. Sci. Eng., C, 2017, 78, 324–332 CrossRef CAS.
- H. Wang and Z. Yang, Nanoscale, 2012, 4, 5259–5267 RSC.
- N. D. Heo, N. J. Castro, S.-J. Lee, H. Noh, W. Zhu and L. Zhang, Nanoscale, 2017, 9, 5055–5062 RSC.
- S. C. Kim, D. H. Kim, H. Mogun, W. Eddings, J. M. Polinski, J. M. Franklin and D. H. Solomon, J. Bone Miner. Res., 2016, 31, 1536–1540 CrossRef CAS.
- H. Yuan, L. Niu, K. Jiao, D. Pei, C. Pramanik, J. Li, R. Messer, S. Kumar, D. H. Pashley and F. R. Tay, Acta Biomater., 2016, 31, 312–325 CrossRef CAS.
- K. Gong, S. Qu, Y. Liu, J. Wang, Y. Zhang, C. Jiang and R. Shen, J. Mech. Behav. Biomed. Mater., 2016, 61, 334–344 CrossRef CAS.
- M. Inui, N. Asakura, S. Nakamura, K. Okumura, T. Takeoka and T. Tagawa, Int. J. Oral Surg., 2011, 23, 204–206 Search PubMed.
- S. L. Ruggiero, Ann. N. Y. Acad. Sci., 2011, 1218, 38–46 CrossRef CAS PubMed.
- F. Tang, L. Li and D. Chen, Adv. Mater., 2012, 24, 1504–1534 CrossRef CAS PubMed.
- Z. Yuan, Y. Pan, R. Cheng, L. Sheng, W. Wu, G. Pan, Q. Feng and W. Cui, Nanotechnology, 2016, 27, 245101 CrossRef.
- C. Hu, S. Liu, Y. Zhang, B. Li, H. Yang, C. Fan and W. Cui, Acta Biomater., 2013, 9, 7381–7388 CrossRef CAS.
- Y. Yang, J. Wan, Y. Niu, Z. Gu, J. Zhang, M. Yu and C. Yu, Chem. Mater., 2016, 28, 9008–9016 CrossRef CAS.
- J. Zhang, J. Zhang, W. Li, R. Chen, Z. Zhang, W. Zhang, Y. Tang, X. Chen, G. Liu and C. Lee, Theranostics, 2017, 7, 3007–3020 CrossRef CAS.
- M. Kong, J. Tang, Q. Qiao, T. Wu, Y. Qi, S. Tan, X. Gao and Z. Zhang, Theranostics, 2017, 7, 3276–3292 CrossRef CAS PubMed.
- Y. Hu, K. Cai, Z. Luo and K. D. Jandt, Adv. Mater., 2010, 22, 4146–4150 CrossRef CAS PubMed.
- T. H. Kim, R. K. Singh, M. S. Kang, J. H. Kim and H. W. Kim, Nanoscale, 2016, 8, 8300–8311 RSC.
- X. Ren, Y. Han, J. Wang, Y. Jiang, Z. Yi, H. Xu and Q. Ke, Acta Biomater., 2018, 70, 140–153 CrossRef CAS PubMed.
- J. G. Croissant, Y. Fatieiev and N. M. Khashab, Adv. Mater., 2017, 29, 1604634 CrossRef PubMed.
- H. Li and J. Chang, Acta Biomater., 2013, 9, 6981–6991 CrossRef CAS.
- A. Hoppe, N. S. Güldal and A. R. Boccaccini, Biomaterials, 2011, 32, 2757–2774 CrossRef CAS.
- E. M. Carlisle, Science, 1970, 167, 279–280 CrossRef CAS.
- L. Li, G. Zhou, Y. Wang, G. Yang, S. Ding and S. Zhou, Biomaterials, 2015, 37, 218–229 CrossRef CAS PubMed.
- M. Farokhi, F. Mottaghitalab, M. A. Shokrgozar, K. Ou, C. Mao and H. Hosseinkhani, J. Controlled Release, 2016, 225, 152–169 CrossRef CAS.
- H. Zhang, Y. Sun, Y. Sun and M. Zhou, Bio-Med. Mater. Eng., 2014, 24, 2211–2218 CAS.
- Y. Sun, H. Zhang, Y. Wang and Y. Wang, J. Controlled Release, 2017, 259, e45–e46 CrossRef.
- T. Sun, Y. Sun and H. Zhang, Polymer, 2018, 10, 513 Search PubMed.
- H. Zhang, J. Han, Y. Sun, Y. Huang and M. Zhou, Mater. Sci. Eng., C, 2015, 56, 22–29 CrossRef CAS.
- R. Tamai and K. Yusuke, Life Sci., 2018, 198, 8–17 CrossRef CAS.
- C. B. Correa, G. V. Camargos, M. Chatterjee, M. F. Mesquita, A. A. Del Bel Cury, I. Naert, J. Duyck and K. Vandamme, Osteoporosis Int., 2017, 28, 1287–1293 CrossRef CAS.
- P. Zhou, X. Cheng, Y. Xia, P. Wang, K. Zou, S. Xu and J. Du, ACS Appl. Mater. Interfaces, 2014, 6, 20895–20903 CrossRef CAS PubMed.
- Q. Chen, P. Shou, L. Zhang, C. Xu, C. Zheng, Y. Han, W. Li, Y. Huang, X. Zhang, C. Shao, A. I. Roberts, A. B. Rabson, G. Ren, Y. Zhang, Y. Wang, D. T. Denhardt and Y. Shi, Stem Cells, 2014, 32, 327–337 CrossRef CAS PubMed.
- A. M. Cortizo, M. S. Molinuevo, D. A. Barrio and L. Bruzzone, Int. J. Biochem. Cell Biol., 2006, 38, 1171–1180 CrossRef CAS PubMed.
Footnote |
| † Electronic supplementary information (ESI) available. See DOI: 10.1039/c8nr07329e |
| This journal is © The Royal Society of Chemistry 2019 |