 Open Access Article
Creative Commons Attribution 3.0 Unported Licence
Liquid phase hydrogenation of CO2 to formate using palladium and ruthenium nanoparticles supported on molybdenum carbide†
Claire E.
Mitchell
 a,
Umberto
Terranova
 a,
Ihfaf
Alshibane
b,
David J.
Morgan
 a,
Thomas E.
Davies
 a,
Qian
He
a,
Justin S. J.
Hargreaves
b,
Meenakshisundaram
Sankar
a,
Qian
He
a,
Justin S. J.
Hargreaves
b,
Meenakshisundaram
Sankar
 *a and
Nora H.
de Leeuw
 *a
*a
aCardiff Catalysis Institute, School of Chemistry, Cardiff University, Cardiff CF10 4AT, UK. E-mail: Sankar@cardiff.ac.uk; deleeuwn@cardiff.ac.uk
bSchool of Chemistry, Glasgow University, Glasgow G12 8QQ, UK
First published on 5th August 2019
Abstract
We report the development of palladium nanoparticles supported on Mo2C as an active catalyst for the liquid-phase hydrogenation of CO2 to formate under mild reaction conditions (100 °C and 2.0 MPa of a 1![[thin space (1/6-em)]](https://www.rsc.org/images/entities/char_2009.gif) :
:![[thin space (1/6-em)]](https://www.rsc.org/images/entities/char_2009.gif) 1 CO2
1 CO2![[thin space (1/6-em)]](https://www.rsc.org/images/entities/char_2009.gif) :
:![[thin space (1/6-em)]](https://www.rsc.org/images/entities/char_2009.gif) H2 mixture). A series of Pd/Mo2C catalysts were synthesised via the modified wet-impregnation (MIm) and sol-immobilization (SIm) techniques and evaluated for CO2 hydrogenation, in an aqueous 1 M NaOH solution. MIm catalysts synthesised using PdCl2 dissolved in a 2 M HCl solution gave the highest formate yield with turnover numbers of up to 109 after 19 h. We further report the crucial role of base and the pH of the reaction medium for the hydrogenation of CO2 to formate. Based on stability studies, electron microscopic characterisation and density functional theory calculations we found that Ru has a stronger affinity than Pd to Mo2C resulting in the development of a stable bimetallic RuPd/Mo2C catalyst for the hydrogenation of CO2 to formate.
H2 mixture). A series of Pd/Mo2C catalysts were synthesised via the modified wet-impregnation (MIm) and sol-immobilization (SIm) techniques and evaluated for CO2 hydrogenation, in an aqueous 1 M NaOH solution. MIm catalysts synthesised using PdCl2 dissolved in a 2 M HCl solution gave the highest formate yield with turnover numbers of up to 109 after 19 h. We further report the crucial role of base and the pH of the reaction medium for the hydrogenation of CO2 to formate. Based on stability studies, electron microscopic characterisation and density functional theory calculations we found that Ru has a stronger affinity than Pd to Mo2C resulting in the development of a stable bimetallic RuPd/Mo2C catalyst for the hydrogenation of CO2 to formate.
Introduction
The growing demand for natural gas and petroleum based feedstock for power generation, transport and chemicals production has, in recent decades, resulted in an unsustainable increase in CO2 emissions.1,2 Irreversible climate change, diminishing conventional fossil fuel reserves and the complexities involved in extracting unconventional fossil reserves, are driving the development of sustainable, renewable and non-fossil-based feedstock for the production of chemicals and fuels. In spite of its thermodynamic stability, carbon dioxide has become an attractive C-1 feedstock for the production of chemicals and fuels.3–5 With the recent advances in carbon capture technologies, cost-competitive pure CO2 could become available for its conversion to value-added chemicals.6 Economically sustainable large-scale CO2 conversion could help in achieving the emission targets set out in the Paris Agreement7 while increasing the production of chemicals and fuels.Commercially, CO2 utilisation is thus far limited to the production of a few chemicals, including urea8 (for nitrogen fertilizers and plastics), polycarbonates9 (for plastics), salicylic acid (a pharmaceutical ingredient)10 and methanol.5 Among all the possible transformations, CO2 hydrogenation to acids, alcohols and hydrocarbons using H2 derived from non-fossil feedstock (e.g. water splitting using electricity derived from a renewable source) is the most promising strategy.11 Here, it is important to note that recently tremendous progress has been made in the production of H2via water-splitting using electricity.12 CO2 hydrogenation is challenging because of the inherent thermodynamic stability of CO2 along with the lack of active catalysts that can activate CO2 under reasonable reaction conditions.4 However, the potential of such an abundant feedstock for producing organic compounds, coupled with the possibility of balancing CO2 emissions make CO2 hydrogenation an exciting and challenging topic for research.
An important product that is formed from the hydrogenation of CO2 is formic acid, which is a liquid at room temperature and contains 4.4 wt% of hydrogen.13 Current annual production of formic acid is around 600![[thin space (1/6-em)]](https://www.rsc.org/images/entities/char_2009.gif) 000 tons and this is projected to grow by 22% annually.14 Formic acid is a vital intermediate in many industries including dyeing, leather, food, agrochemical and many more.15–17 It is also used to promote the fermentation of acetic acid, as a coagulant in rubber synthesis, an antibacterial agent in animal feed and as a de-icing agent in many manufacturing industries.18 Using appropriate catalysts, formic acid can be controllably converted to CO2 and H2 even at room temperature.19 Hence, hydrogenation of CO2 to formic acid is considered as an effective strategy to store H2 chemically. Current technology for the production of formic acid involves the hydrolysis of methyl formate, with a capacity of ca. 770 kilotons per annum in 2014.20 Limitations of this process include the use of fossil fuel based feedstock, slow reaction rate, undesirable by-products and high cost. Therefore, it is not surprising that utilization of CO2 is gaining momentum in the scientific community in order to shift from conventional fossil-based processes toward environment-friendly direct hydrogenation of CO2 to formic acid.
000 tons and this is projected to grow by 22% annually.14 Formic acid is a vital intermediate in many industries including dyeing, leather, food, agrochemical and many more.15–17 It is also used to promote the fermentation of acetic acid, as a coagulant in rubber synthesis, an antibacterial agent in animal feed and as a de-icing agent in many manufacturing industries.18 Using appropriate catalysts, formic acid can be controllably converted to CO2 and H2 even at room temperature.19 Hence, hydrogenation of CO2 to formic acid is considered as an effective strategy to store H2 chemically. Current technology for the production of formic acid involves the hydrolysis of methyl formate, with a capacity of ca. 770 kilotons per annum in 2014.20 Limitations of this process include the use of fossil fuel based feedstock, slow reaction rate, undesirable by-products and high cost. Therefore, it is not surprising that utilization of CO2 is gaining momentum in the scientific community in order to shift from conventional fossil-based processes toward environment-friendly direct hydrogenation of CO2 to formic acid.
Most of the reported catalysts for the hydrogenation of CO2 to formic acid are homogeneous metal (Rh, Ru, Ir and Fe) complexes containing sophisticated ligands (N-heterocyclic carbenes, pincer ligands and phosphines) that require complicated synthesis and/or handling procedures.21–24 Although these homogeneous catalysts are highly active, heterogeneous catalysts are preferred for a number of reasons, e.g. catalyst separation and scalability. Transition metal carbides have been reported to exhibit catalytic activities for a number of chemical reactions, including CO hydrogenation,25 the water gas shift reaction,26 hydrodesulphurization27 and methane reforming.28 Recently, transition metal carbides have also been reported as catalysts for CO2 hydrogenation29 including by Dubois et al.30 and Vidal et al.31 All these reactions were carried out at relatively high temperatures (220–320 °C), and mostly in the gas-phase, where the most interesting products like CH3OH or HCOOH are thermodynamically not favoured.32,33 Hence, it is desirable to perform the hydrogenation of CO2 at lower temperatures where CO (a product from an endothermic reaction) is not favoured.
Chen et al. demonstrated this by performing CO2 hydrogenation at 200 °C in the liquid phase for the production of MeOH, they reported catalysis using metal nanoparticles supported on Mo2C using 1,4-dioxane as the solvent.34,35 They synthesized a series of M/Mo2C (M = Pd, Cu, Co and Fe) catalysts, for the formation of CH3OH, C2H5OH and C2+ hydrocarbons. 1,4-Dioxane however, is not an environmentally-benign solvent of choice,36 other organic solvents have also been reported for the liquid phase hydrogenation of CO2, including ethanol.37 Organic solvents have the disadvantage of being involved in the reaction itself, and may play a role in the synthesis of the targeted products; hence, it is better to avoid using them. It has been reported that addition of water is effective for improving CO2 hydrogenation to formic acid.38,39 It is proposed that the hydrogen-bonding between the H2O molecule and CO2 improves the electrophilicity of the carbon atom on the CO2 molecule,39 thus reducing the reaction barrier for CO2 activation. The same group reported Mo2C acted as a co-catalyst as well as a support as it performed CO2 conversion without any other metals present. Posada-Perez et al. compliment this by explaining that the specific carbon/metal ratio of Mo2C is responsible for the high reactivity resulting in the breaking of both C–O bonds in CO2 before hydrogenation.40 Mori et al. reported the formation of formic acid from CO2 hydrogenation using a ruthenium-based catalyst, in water under alkaline conditions at 100 °C,41 Song et al. also reported hydrogenation of CO2 to formic acid in water using a Na2CO3 base, catalysed by palladium supported on chitin.42 These alkaline conditions are important in improving the CO2 solubility in water. CO2 has poor solubility in pure water (0.0693 mol kg−1 at 1 bar at 30 °C)43 and the solubility decreases with increasing temperature. Carbonic acid (H2CO3), formed when CO2 dissolves in water, deprotonates sequentially to form the carbonate ion (eqn (R1)–(R3)).
| CO2(aq) + H2O ↔ H2CO3(aq) pH = 4–6 | (R1) |
| H2CO3(aq) ↔ H+(aq) + HCO3(aq)− pH = 6–10 | (R2) |
| HCO3(aq)− ↔ H+(aq) + CO3(aq)2− pH > 10 | (R3) |
Plausible mechanisms for formation of formic acid from CO2 hydrogenation has been widely investigated.48–52 H2 is a non-polar molecule, therefore is not very soluble in water as it does not readily form hydrogen bonds with water. It has been widely reported that Pd readily adsorbs and dissociates H2 gaseous molecules.53–55 In fact, Wang et al. found that H2 chemisorption increased when Pd was supported on Mo2C in comparison with Pd supported on Al2O3 due to additional chemisorption onto the Mo2C support56 likely due to the strong electronic interaction between the β-Mo and H2 (−0.67 eV).57 Wang et al. studied palladium nanoparticles supported on nitrogen-doped mesoporous carbon in aqueous conditions.49 Here they report the metallic palladium nanoclusters help the dissociative adsorption of H from H2. The resulting Pd–H bond activates the adsorbed bicarbonate by inserting the adsorbed H into the C–OH group of the bicarbonate, replacing the –OH which then binds with the remaining adsorbed H to form water. These findings are within good agreement with He et al.50 and also Mori and co-workers work51 all within aqueous conditions. Using systematic calculations, both of these papers go on to explain that the reduction of HCO3− through the attack of the adsorbed H atom to the C atom of HCO3− leading to formate formation is much more energetically favoured rather than hydrogenation at its O atoms leading to carboxyl formation.48 He and Mori's kinetic investigations demonstrate that the attack of the adsorbed H onto the HCO3− species is the rate determining step rather than the dissociation of H2.
Here, we report palladium nanoparticles supported on molybdenum carbide, and a synthesis method to produce a more active Pd/Mo2C catalyst for the liquid phase hydrogenation of CO2 to formate, as the reaction solution is in basic conditions. The catalytic activities of four Pd/Mo2C monometallic catalysts were studied and compared at mild reaction conditions (100 °C, 2 MPa (CO2![[thin space (1/6-em)]](https://www.rsc.org/images/entities/char_2009.gif) :
:![[thin space (1/6-em)]](https://www.rsc.org/images/entities/char_2009.gif) H2 1
H2 1![[thin space (1/6-em)]](https://www.rsc.org/images/entities/char_2009.gif) :
:![[thin space (1/6-em)]](https://www.rsc.org/images/entities/char_2009.gif) 1)), with the most active catalyst producing a significant amount of formate salt with a turnover number (TON) of 109. Palladium is known as an active metal for H2 activation as well as CO2 activation,58 Chen et al. reported Pd/Mo2C as the most active catalyst for CO2 hydrogenation to methanol albeit achieving a TON of 4.25, in an environmentally benign solvent (1,4-dioxane), at higher temperatures (135 °C) and pressure (40 bar).35 Finally, a bimetallic RuPd/Mo2C catalyst was also developed and tested for the liquid phase hydrogenation of CO2. All monometallic and bimetallic catalysts were tested for their stability and the results were rationalised using a combination of high-resolution transmission electron microscopy (HR-TEM), field emission gun scanning electron microscopy (FEG-SEM) and density functional theory (DFT) calculations.
1)), with the most active catalyst producing a significant amount of formate salt with a turnover number (TON) of 109. Palladium is known as an active metal for H2 activation as well as CO2 activation,58 Chen et al. reported Pd/Mo2C as the most active catalyst for CO2 hydrogenation to methanol albeit achieving a TON of 4.25, in an environmentally benign solvent (1,4-dioxane), at higher temperatures (135 °C) and pressure (40 bar).35 Finally, a bimetallic RuPd/Mo2C catalyst was also developed and tested for the liquid phase hydrogenation of CO2. All monometallic and bimetallic catalysts were tested for their stability and the results were rationalised using a combination of high-resolution transmission electron microscopy (HR-TEM), field emission gun scanning electron microscopy (FEG-SEM) and density functional theory (DFT) calculations.
Materials and methods
Mo2C
Two different Mo2C materials have been used in this work. Commercial β-Mo2C was purchased from Alfa Aesar (99.5% purity) and was used without any further modification. β-Mo2C was also synthesized via the procedure reported by Volpe et al.59 Briefly, β-Mo2C was prepared by the direct carburisation of MoO3 (0.5 g, B.D.H.) using a flow of 12 ml min−1 of 20 vol% CH4 in H2 (BOC, 99.98%) at 800 °C for 2 hours with a heating rate of 6 °C min−1 till 350 °C followed by a 1 °C min−1 heating rate till 800 °C. The resultant material was characterised by powder XRD (ESI,† Fig. S1). Thus prepared β-Mo2C was used as support for the synthesis of Pd/Mo2C catalyst and was used in the hydrogenation reaction without any further modification.M/Mo2C synthesis
Two different synthesis methods were used for the preparation of monometallic Pd nanoparticles supported on Mo2C (commercial and synthesised) i.e. modified wet-impregnation method60,61 and sol-immobilisation method.62 Bimetallic RuPd/Mo2C was prepared using a modified wet-impregnation method. A brief description of these methods is given below.Modified wet-impregnation (MIm) method:
In a typical synthesis, of 2 g of 1 wt% M/Mo2C catalyst, the requisite amount of the aqueous metal precursor (metal chloride) solution (equivalent to 0.02 g of metal; in the case of bimetallic catalyst, the two metals were taken in a equimolar ratio) was added to 16 ml of deionized water in a 50 ml glass round bottom flask with vigorous stirring. To this precursor solution, 1.98 g of Mo2C was added slowly and steadily with constant stirring at 25 °C. After the completion of the addition of Mo2C, the temperature of the stirring slurry was raised to 60 °C and stirred for 30 minutes. Finally, the temperature was raised to 95 °C and left overnight (16 hours) for the complete evaporation of water. After 16 h, the remaining dry, dark-grey solid was ground thoroughly and this dried material was reduced under 5 vol% H2 in Ar at 400 °C for 4 hours with a heating rate of 10 °C min−1. The reduced catalyst was used in the liquid phase reduction of CO2 without any further modification unless specified otherwise.Sol-immobilization (SIm) method
For the synthesis of 1 g of 1 wt% Pd/Mo2C catalyst, an aqueous solution of PdCl2 (Sigma Aldrich) was prepared. Polyvinyl alcohol (PVA) (1 wt% aqueous solution, Aldrich, MW = 10![[thin space (1/6-em)]](https://www.rsc.org/images/entities/char_2009.gif) 000, 80% hydrolyzed) and an aqueous solution of NaBH4 (0.1 M) were also freshly prepared. To the requisite amount of an aqueous solution of PdCl2, the required amount of a freshly prepared PVA solution (1 wt%) (PVA/(Au + Pd) (w/w) = 1.3) was added. A freshly prepared solution of NaBH4 (0.1 M, NaBH4/(Pd) (mol/mol) = 5) was then added to form a dark-brown metallic sol. After 30 min of sol-generation, the colloid was immobilized by adding the support material (Mo2C (0.99 g) Alfa Aesar). 5 drops of concentrated H2SO4 was added under vigorous stirring. After 2 h, the slurry was filtered, and the catalyst was washed thoroughly with 2 L of distilled water (until the mother liquor was neutral) and then dried at 120 °C overnight under static air in an oven.
000, 80% hydrolyzed) and an aqueous solution of NaBH4 (0.1 M) were also freshly prepared. To the requisite amount of an aqueous solution of PdCl2, the required amount of a freshly prepared PVA solution (1 wt%) (PVA/(Au + Pd) (w/w) = 1.3) was added. A freshly prepared solution of NaBH4 (0.1 M, NaBH4/(Pd) (mol/mol) = 5) was then added to form a dark-brown metallic sol. After 30 min of sol-generation, the colloid was immobilized by adding the support material (Mo2C (0.99 g) Alfa Aesar). 5 drops of concentrated H2SO4 was added under vigorous stirring. After 2 h, the slurry was filtered, and the catalyst was washed thoroughly with 2 L of distilled water (until the mother liquor was neutral) and then dried at 120 °C overnight under static air in an oven.
All the above-mentioned catalysts were used in the hydrogenation reaction without any further modification or activation.
Catalyst characterisation
XRD
The bulk crystalline structures were characterised using X-ray diffraction. Conventional powder X-ray diffraction (PXRD) analysis of the materials was performed on a (θ–θ) PANalytical X’pert Pro powder diffractometer with a Ni filtered CuKα radiation source operating at 40 keV and 40 mA. Patterns were recorded over the 2θ angular range 10–80° using a step size of 0.016°.XPS
X-ray photoelectron spectroscopy (XPS) was performed on a Thermo Fisher Scientific K-alpha+ spectrometer. Samples were analysed using a micro-focused monochromatic Al X-ray source (72 W) over an elliptical area of approximately 400 μm. Data were recorded at pass energies of 150 eV for survey scans and 40 eV for high resolution scan with 1 eV and 0.1 eV step sizes respectively. Charge neutralisation of the sample was achieved using a combination of both low energy electrons and argon ions. Data analysis was performed in CasaXPS using a Shirley type background and Scofield cross sections, with an energy dependence of −0.6.Microscopic studies
Transmission electron microscopy (TEM) were performed on a JEOL JEM-2100 operating at 200 kV. Energy dispersive X-ray analysis (EDX) was done using an Oxford Instruments X-MaxN 80 detector and the data analysed using the Aztec software. Samples were prepared by dispersion in ethanol by sonication and deposited on 300 mesh copper grids coated with holey carbon film. Scanning electron microscopy was performed on a Tescan Maia3 field emission gun scanning electron microscope (FEG-SEM) fitted with an Oxford Instruments X-MaxN 80 energy dispersive X-ray detector (EDX). Images were acquired using the secondary electron and backscattered electron detectors. Samples were prepared by dispersion in ethanol by sonication and deposited on 300 mesh copper grids coated with holey carbon film.Catalytic CO2 hydrogenation reaction and products analyses
The hydrogenation of CO2 to formate was carried out in a high-pressure stainless steel Parr autoclave (50 ml) reactor fitted with an overhead stirrer. In a typical run, 150 mg of the catalyst was charged into a Teflon liner containing 15 ml of 1 M aqueous NaOH (Sigma Aldrich) solution. Then the Teflon liner was placed inside the autoclave reactor before the reactor was closed airtight. The reactor with its contents was first purged with N2 (3 times) and then with CO2 (3 times) to remove traces of air or oxygen from the system and then finally charged with CO2 (10 bar) and H2 (10 bar) at 25 °C. Then the reactor was heated to the reaction temperature (100 °C) while stirring at 800 rpm, when the reaction temperature is stabilised, the reaction pressure reaches approximately 26 bar. After 19 h of the reaction time the reactor was cooled to <10 °C using an ice bath, the gas-phase was collected in a gas-bag and the liquid sample was collected and the solid catalyst was removed via centrifugation followed by filtration using a syringe filter fitted with a 45 μl filter tip.The gas phase products were analysed by gas chromatography (Varian 450-GC with a CPSil5 column 50 m × 0.32 mm × 5 μl, fitted with FID), while the liquid products were analysed by high performance liquid chromatography (HPLC) (Agilent 1260 infinity), injected into an Agilent Metacarb 67H column fitted with a refractive index detector. The method ran at 25 °C with a flow rate of 0.25 ml min−1 with dilute sulfuric acid (0.1 vol%) as the mobile phase. The identity of the products (HCOOH) were confirmed using 1H-NMR. A series of known standard solutions of formic acid were prepared to generate a calibration curve and response factors, which were used for quantitative analyses of the reaction mixtures.
When stability tests were conducted; 4 identical reactions were run using the procedure above, the solvent was removed by filtration and the catalyst was washed twice with H2O and once again with acetone, and left to dry in a vacuum oven. The remaining catalyst was reused using the same reaction procedure as above, washed and dried again to continue the study. The turn over number (TON) was determined as the number of moles of sodium formate produced per mole of metal, calculated using microwave plasma atomic emission spectroscopy (MP-AES) (Agilent 4100), present in the catalyst used. Catalyst was digested in aqua regia first (HCl/HNO3 = 3![[thin space (1/6-em)]](https://www.rsc.org/images/entities/char_2009.gif) :
:![[thin space (1/6-em)]](https://www.rsc.org/images/entities/char_2009.gif) 1) until all solid was dissolved, before being diluted with water and manually submitted into the instrument.
1) until all solid was dissolved, before being diluted with water and manually submitted into the instrument.
Density functional theory calculations
We have modelled the orthorhombic phase of Mo2C (a = 4.732, b = 6.037, c = 5.20463) and its low Miller-index surfaces. The (001), (010), (011) and (101) surface slabs contained, respectively, 4, 6, 8 and 6 layers of Mo2C units, and were separated by a vacuum region of at least 12 Å along the normal to avoid spurious interactions. We performed all geometry optimisations with the VASP 5.3 code,64,65 using the PBE functional,66 spin polarisation and the projector augmented wave method,67 treating explicitly the 5s and 4d electrons of Pd, Ru and Mo, and the 2s and 2p of C. We adopted a plane wave cut off of 400 eV and scaled the bulk converged 5 × 5 × 5 Monkhorst–Pack68 grid to 5 × 5 × 1 for surfaces.69 Optimisations stopped when forces acting on ions were less than 2 × 10⁻² eV Å−1.Results and discussion
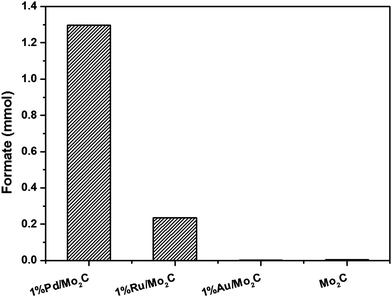
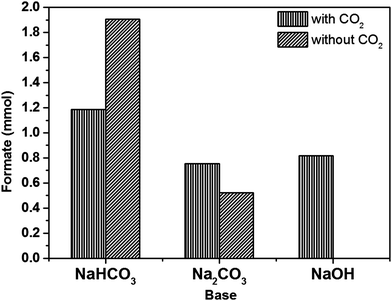
Monometallic Au, Pd and Ru nanoparticles supported on Mo2C were prepared via the modified wet-impregnation (MIm) method and tested for the CO2 hydrogenation reaction in liquid phase using an aqueous NaHCO3 solution as solvent. Results presented in Fig. 1 show that Pd/Mo2C unsurprisingly is the most active catalyst for CO2 hydrogenation, followed by Ru/Mo2C and Au/Mo2C. Based on this result, Pd/Mo2C was used as the catalyst for further tests. It should be noted that Mo2C alone managed to produce formate, with no supported metal, confirming that although only a small amount of product was formed (0.0049 mmol), the support material holds catalytic activity. Therefore, when acting as a support for metal nanoparticles, it also acts as a co-catalyst for the reaction.As discussed in the Introduction section, for CO2 hydrogenation reactions, an alkaline solution is vital to improve the solubility and reactivity of CO2 and thereby increase the yield of desired product(s). In order to choose the most appropriate base, the hydrogenation reaction was carried out using different bases (NaHCO3, Na2CO3 and NaOH) with and without CO2, using 1% Pd/Mo2C catalyst at 100 °C for 19 h. Many previous reports in the literature have used NaHCO3 for CO2 hydrogenation reaction;41,45–47 while HCO3− from the sodium bicarbonate is able to form formate in the absence of CO2, it has been reported that the presence of CO2 increases the formate productivity.70 However, under our reaction conditions more formate was formed from an aqueous NaHCO3 solution without CO2 (1.91 mmol) compared to the reaction with CO2 (1.18 mmol); a decrease of approximately 38% (Fig. 2). This effect may be due to the dissolution of CO2 affecting the equilibrium of the carbonate species, reducing the amount of HCO3− available in solution for further hydrogenation. Na2CO3 again produces formate in the absence of CO2, but more formate was formed in the presence of CO2 (0.75 mmol) than in the absence of CO2 (0.52 mmol). When NaOH was used, formate was formed only in the presence of CO2 (0.82 mmol). When CO2 was dissolved in 1 M NaOH aqueous reaction mixture, the pH of the solution started decreasing and in 10 min, it stabilized at 8.0 until the end of the reaction. It is well established that at pH 8 the dissolved CO2 forms HCO3− species, hence it is considered as the intermediate in the formation of formate.44 During the course of the reaction there is always an equilibrium between CO2, HCO3− and HCOO−. By choosing NaOH as the base we are confident that the C in HCOO− comes from CO2 only.
The catalytic properties of any supported metal catalyst depend on its structural properties, such as particle size and morphology for monometallic catalysts and additional composition and nanostructure for bimetallic catalysts.71–75 We have developed a number of synthesis strategies to control these structural properties of monometallic and bimetallic supported Pd catalysts. In an effort to tune the structural properties of the Pd/Mo2C catalyst, four different Pd/Mo2C structures were synthesised using modified wet-impregnation and sol-immobilisation methods.60–62 1% Pd/Mo2C and 5% Pd/Mo2C were prepared using an aqueous solution of Pd precursor, where PdCl2 is dissolved in 0.58 M HCl solution; for the purpose of simplicity these will be labelled 1% Pd/Mo2C-MIm (0.58 M) and 5% Pd/Mo2C-MIm, respectively, for the rest of this paper. Another 1% Pd/Mo2C was prepared using another precursor solution where PdCl2 was dissolved in a 2 M HCl solution, we will label this 1% Pd/Mo2C-MIm (2 M). We have reported previously that addition of excess of Cl− ions (via the addition of either HCl or NaCl) during the wet-impregnation procedure controls the particle size and morphology of supported AuPd catalysts.60 Recently Li et al. reported the beneficial effect of the addition of excess chloride during the preparation of bimetallic PdRe catalyst for glycerol hydrogenolysis.76 The fourth catalyst was synthesised using sol-immobilization, which will be labelled 1% Pd/Mo2C-SIm. To confirm Mo2C was an appropriate support material for this reaction, Pd supported on CeO2 (1 wt%) was also tested and found that it was almost 20× less active than 1% Pd/Mo2C, forming only 0.063 mmol of formate (ESI,† Table S2).
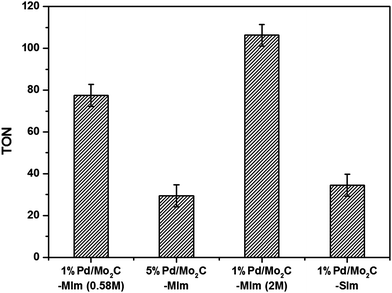
All the four Pd catalysts were tested for CO2 hydrogenation and the formate yields are presented in the ESI† Table S2. As expected the 1% Pd/Mo2C-MIm (2 M), prepared from the precursor in 2 M HCl was found to be much more active (1.53 mmol) in comparison to the 1% Pd/Mo2C-MIm (0.58 M) prepared from 0.58 M HCl (1.09 mmol). However, 5% Pd/Mo2C-MIm catalyst gave only 2.14 mmol of formate under the same reaction conditions. For this catalyst, in spite of a 5-fold increase in Pd content compared to 1% Pd/Mo2C-MIm (0.58 M) catalyst, the increase in formate yield is less than 2-fold. To normalise the formate productivity with Pd loading, the amounts of Pd present in all these catalysts were determined by MP-AES (ESI,† Table S2), Pd surface content analysis was attempted via CO chemisorption, although this proved unsuccessful, possibly due to the low weight loading and low surface area of the large nanoparticles. Actual Pd contents of all the wet-impregnation catalysts were found to be closer to the nominal loading (calculated from the amount of Pd precursor added during the catalyst preparation). The actual loading of the sol-immobilisation catalyst was found to be less than the expected nominal loading, possibly due to inefficient immobilisation of Pd nanoparticles onto the support and their subsequent loss during the washing of 1% Pd/Mo2C-SIm catalyst. The TON of all the catalysts, calculated based on the actual amount of Pd (Fig. 3), indicate that 1% Pd/Mo2C-MIm (2 M) catalyst prepared from a 2 M HCl solution is the most active catalyst exhibiting a TON of 109. Chloride ions have long been considered a poison for noble metal catalysts and chloride precursors have therefore been avoided in the preparation of supported noble metal catalysts. Chen et al., who have previously reported M/Mo2C for CO2 hydrogenation, have avoided the use of PdCl2 precursor as they report that the chlorine ions poison the catalyst surface and consequently reduce their catalytic activities,34 which is not the first time Cl− ions has considered as a poison.77,78 However, contradicting reports found Cl− ions aid the dispersion of metal nanoparticles on the support surface.60 Our current results clearly suggest that the addition of an excess of Cl− ions, during the preparation of 1% Pd/Mo2C-MIm (2 M) catalyst, is beneficial and 1% Pd/Mo2C-MIm (2 M) was thus selected for the continuing studies in this paper. We have studied the effect of adding excess of chloride ions during the preparation of Pd based bimetallic catalysts by wet impregnation method in detail.55,56
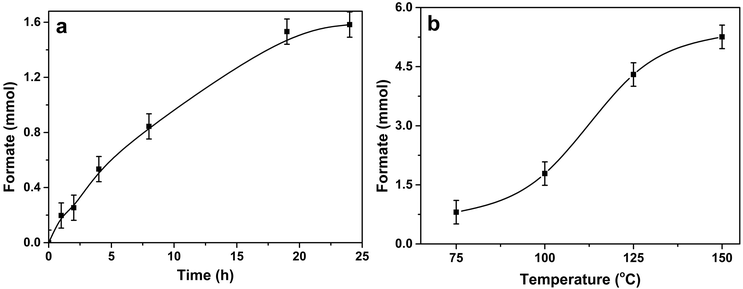
Time on line data (Fig. 4a) for 1% Pd/Mo2C-MIm (2 M) catalyst, show that the formation of formate increases steadily with time until 19 h (1.53 mmol of formate) after which time the productivity starts to plateau (1.58 mmol after 24 h). The hydrogenation of CO2 was also tested at different temperatures (75, 100, 125 and 150 °C) and the formate productivity increases (Fig. 4b) with increasing reaction temperature, which is in line with many reported trends.79,80 At 75 °C 0.81 mmol of formate was produced and increasing the temperature to 125 °C, we see a remarkable increase in formate productivity, achieving 4.30 mmol of formate, with a TON of 307. At 150 °C formate production increases again to 5.26 mmol. The initial activity (turn over frequency) of 1% Pd/Mo2C-MIm (2 M) for the CO2 hydrogenation at 100 °C is ∼14.1 h−1 during the first initial 2 hours (calculated from ESI,† Fig. S5). It then decreases steadily in an approximately exponential way until it reaches a final activity of 4.6 h−1 after 19 hours. For a 125 °C reaction we see a TOF of approximately 42.5 h−1 during the first 2 hours (Fig. S5, ESI†), and after 19 hours this drops to 16.2 h−1. This result is comparable to Mori et al.'s Pd/TiO2 and PdAg/TiO2 catalysts, achieving TOFs of 12 and 31 h−1 respectively,51 also their Ru/LDH catalyst, with TOF of 29. However, this catalyst indeed has a lot of competition and achieves TOFs less than Song et al.'s Pd/Chitin (TOF = 257 h−1)42 and Maru et al.'s Pd/g-C3N4 (TOF = 660 h−1)81 both achieving results at higher pressure but lower temperatures. A comparison of recent CO2 hydrogenation catalysts, their TOFs and reaction conditions can be found in the ESI† (Table S1).
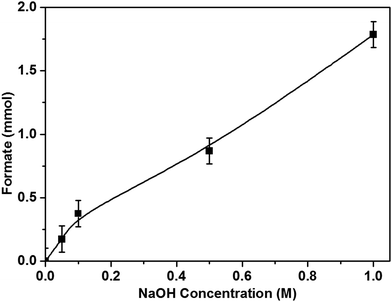
The pH of the reaction medium is an important parameter for the dissolution, activation and hence the hydrogenation of CO2. As mentioned previously, upon CO2 dissolution the pH of 1 M NaOH solution (pH = 14) dropped to pH 8 within 10 minutes as bicarbonate species formed in solution. Hence the hydrogenation of CO2 to formate can be represented as HCO3− + H2 → HCO2− + H2O. Reducing the concentration of NaOH by half (0.5 M), halved the amount of HCOOH formed and the same effect occurred with 0.1 and 0.05 M NaOH solutions (Fig. 5); when no base is added to the reaction solution, the formate production is negligible, resulting in direct correlation between NaOH concentration and formate production.
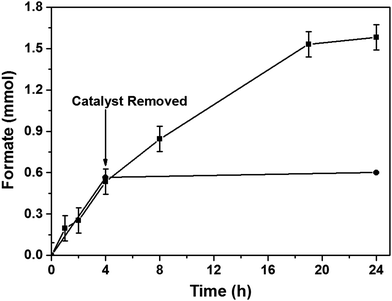
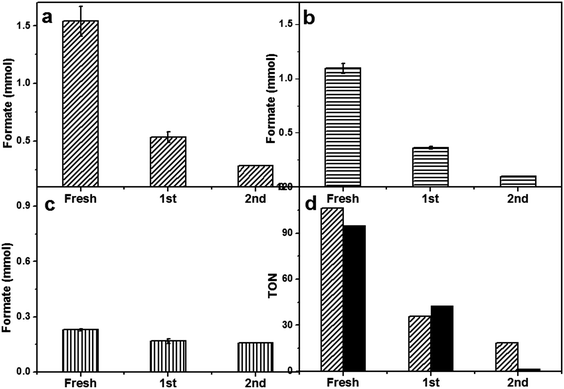
After optimizing the reaction conditions, we studied the heterogeneous nature of the 1% Pd/Mo2C-MIm (2 M) catalyst using the hot filtration method. The catalyst was removed by filtration after 4 h of the reaction (0.6 mmol of formate) and the reaction was continued without any catalyst. There was no increase in the formate yield even after 20 h of further reaction without catalyst (Fig. 6) which proves the heterogeneous nature of the 1% Pd/Mo2C-MIm (2 M) catalyst. We further tested the stability and reusability of the Pd/Mo2C catalyst by recycling the catalyst two times for CO2 hydrogenation reactions (Fig. 7a) under identical reaction conditions. The 1% Pd/Mo2C-MIm (2 M) catalyst displayed a large drop in the catalytic activity from 1.54 mmol of formate for the fresh catalyst to the 0.28 mmol after the 2nd reuse; an 82% drop in the catalytic activity (Fig. 7a).
Commercial Mo2C was found to have very low surface area (<1 m2 g−1) as BET and CO chemisorption of Pd/Mo2C did not give any reasonable data. It has been reported that synthesised Mo2C can have a much higher surface area of 151 m2 g−1.34 Therefore, increasing the support surface area would be expected to decrease the size of the supported metal nanoparticles and thus improve the catalyst stability. In an effort to improve the stability of the Pd/Mo2C catalyst, a fresh batch of β-Mo2C was synthesized in the lab. These materials were found to have a slightly improved surface area of approximately 13 m2 g−1 compared to commercial source and was used as the support for the synthesis of 1% Pd/Mo2C catalyst. For the purpose of simplicity, this catalyst will be labelled 1% Pd/Mo2C-Sy. Another approach to improve catalytic stability was to synthesize a Pd-based bimetallic catalyst. It is well known that the addition of a second metal to Pd can dramatically increase the stability of supported Pd catalysts.33,82–84 Recently, we reported supported bimetallic RuPd nanoparticles for the hydrodeoxygenation of levulinic acid to γ-valerolactone with enhanced stability.61,85 Two Pd catalysts were prepared to improve the stability of Pd/Mo2C catalyst based on the two approaches mentioned above. 1% Pd/Mo2C-Sy was prepared using home-made β-Mo2C and a bimetallic 1% RuPd/Mo2C (commercially sourced Mo2C) and both these catalysts were tested for catalytic activity and stability. Lab-synthesised β-Mo2C support neither improved the catalytic activity nor the stability of 1% Pd/Mo2C (Fig. 7d). However, the bimetallic 1% RuPd/Mo2C displayed a much better stability compared to the monometallic 1% Pd/Mo2C-MIm (2 M) catalyst, we did not load the lab synthesised β-Mo2C with RuPd bimetallic nanoparticles as the commercial and synthesised supports produced the similar results when loaded with Pd monometallic nanoparticles. For the monometallic catalyst, during the 2nd reuse, an 82% reduction in activity was observed, whereas for the bimetallic RuPd catalyst only a 30% drop in activity was observed (Fig. 7c). The total Pd contents of fresh and spent catalysts were analysed by MP-AES (ESI,† Table S3), which showed that there is no decrease in Pd content, suggesting there is no leaching of Pd which was further confirmed by the absence of Pd in the reaction mixture.
In an effort to understand the reason for this deactivation, the Pd metal particle size of fresh and used catalysts, all fresh and used catalysts were analysed by HR-TEM and FEG-SEM. When observing catalysts synthesised using a commercially sourced Mo2C, HR-TEM image (Fig. 8a), showed large, highly crystalline Mo2C particles, which implies that the support has a very small surface area and few defects on the surface for Pd nanoparticles to bind to, resulting in large Pd particles on the surface. Due to the density of the Mo2C support, the HR-TEM images give us minimal information as the material was blocking any transmission through the bulk of the material. FEG-SEM provides us with more detail with respect to the size of the metal particles and the nature of the support surface. The LE-BSE detector was used for distinguishing the palladium from the molybdenum surface. The BSE is strongly related to atomic number, with heavier elements backscattering more electrons, thereby contributing to a brighter signal. Large Pd nanoparticles can be observed (Fig. 8b) with a size range of approximately 50–70 nm and a good dispersion. When analysing the elemental composition of the Mo2C surface, EDX showed a Pd wt% of 0.5–0.8%, which is a good result for a 1 wt% loading. Characterising the used Pd/Mo2C sample we see a less even particle distribution and large agglomerations of palladium particles with sizes of approx. 1 μm (Fig. 8c), phase separated agglomerations were also found isolated from the support (not shown). This implies that during reaction, due to a weak metal–support interaction and surface decomposition, palladium nanoparticles sinter, and in turn, are lost from the support as heterogeneous particles, explaining the drop in catalytic activity. This did not show in the leaching studies as the particles are too large to be retained in the filtrate solution. Tests were run to confirm that these Pd particles were not the catalyst for formate production; PdCl2 and Pd colloids were catalytically tested and compared to 1% Pd/Mo2C-MIm (2 M), using the same palladium weight and reaction conditions. Formate productivities of 0.06 and 0.09 mmol were observed for PdCl2 solution and Pd colloids respectively (ESI,† Fig. S2), compared to 0.42 mmol produced from 1% Pd/Mo2C-MIm (2 M). This confirms that the metal–support interactions are indeed causing an increase in catalytic activity of the palladium. Observing fresh bimetallic 1% RuPd/Mo2C under HR-TEM and FEG-SEM shows a larger range of metal nanoparticle sizes, ca.10–85 nm, with an even dispersion over the support (Fig. 9a). Analysing recycled 1% RuPd/Mo2C, it was found that the metal particles had increased in size (Fig. 9c), exceeding 100 nm. However, no metal particles, palladium or ruthenium, were found isolated from the support. This implies that, although there was sintering along the support surface during reaction, the addition of the ruthenium creates a stronger metal–support interaction and as a result, no metal particles are lost from the support, explaining the improved stability compared to the monometallic 1% Pd/Mo2C.
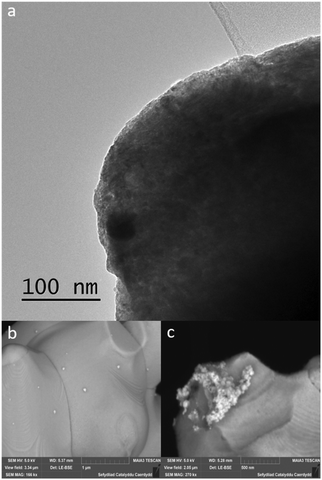 | ||
| Fig. 8 (a) HR-TEM images of fresh 1% Pd/Mo2C-MIm (2 M). FEG-SEM images of (b) fresh 1% Pd/Mo2C-MIm (2 M) LE-BSE (c) used 1% Pd/Mo2C-MIm (2 M), Pd cluster LE-BSE. | ||
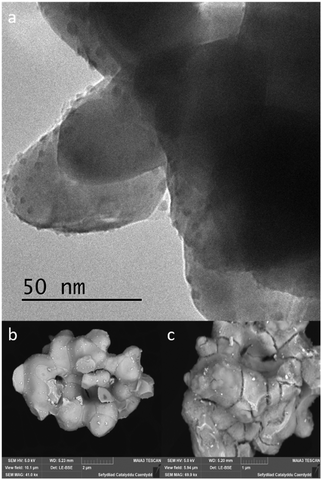 | ||
| Fig. 9 (a) HR-TEM image of fresh 1% RuPd/Mo2C; FEG-SEM images: (b) fresh 1% RuPd/Mo2C LE-BSE, (c) used 1% RuPd/Mo2C LE-BSE. | ||
We have used atomistic simulations based on DFT to shed light on the improved stability of the bimetallic nanoparticles. In order to have a model for the support, we have first calculated the surface energies, γ, of the low index (001), (010), (011) and (101) surfaces of orthorhombic Mo2C, shown in ESI,† Fig. S3, according to the formula:
 | (1) |
We report in ESI,† Table S4 the surface energies of the different surfaces. Our calculations indicate that the (101) is the most stable face of Mo2C, in agreement with the previous literature,87 followed by the (010), (011) and (001). In view of these results, we have used the (101) and (010) surfaces as substrate models for the adsorption of single Pd and Ru atoms.
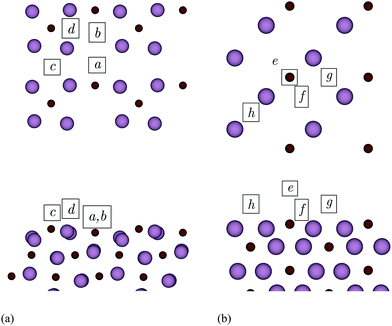
Fig. 10 illustrates the adsorption sites obtained after relaxing a number of different initial positions. On the (101) surface, a and b are sixfold hollow sites. Here, the metal adatoms coordinate to one C and four Mo atoms of the top layer, in addition to one Mo atom of the second layer. In c, which is a fourfold hollow site, the adatoms coordinate only to topmost Mo atoms. Site d is threefold, and the adatoms form a bridging bond with two Mo besides bonding a third C atom. Considering the (010) surface, site e is above a C atom of the topmost layer, while f is a sixfold hollow site. Finally, g and h are different bridging sites.
We list in Table 1 the adsorption energies, ΔE, of Pd and Ru atoms at the sites described above, which have been calculated according to the formula:
 | (2) |
| Surface | Site | ΔE (eV per atom) | |
|---|---|---|---|
| Pd | Ru | ||
| (101) | a | −4.25 | −6.52 |
| b | −4.03 | −6.17 | |
| c | −4.34 | −6.05 | |
| d | −3.06 | −4.77 | |
| (010) | e | −3.01 | −4.35 |
| f | −3.05 | −4.54 | |
| g | −4.19 | −6.40 | |
| h | −3.71 | −5.36 | |
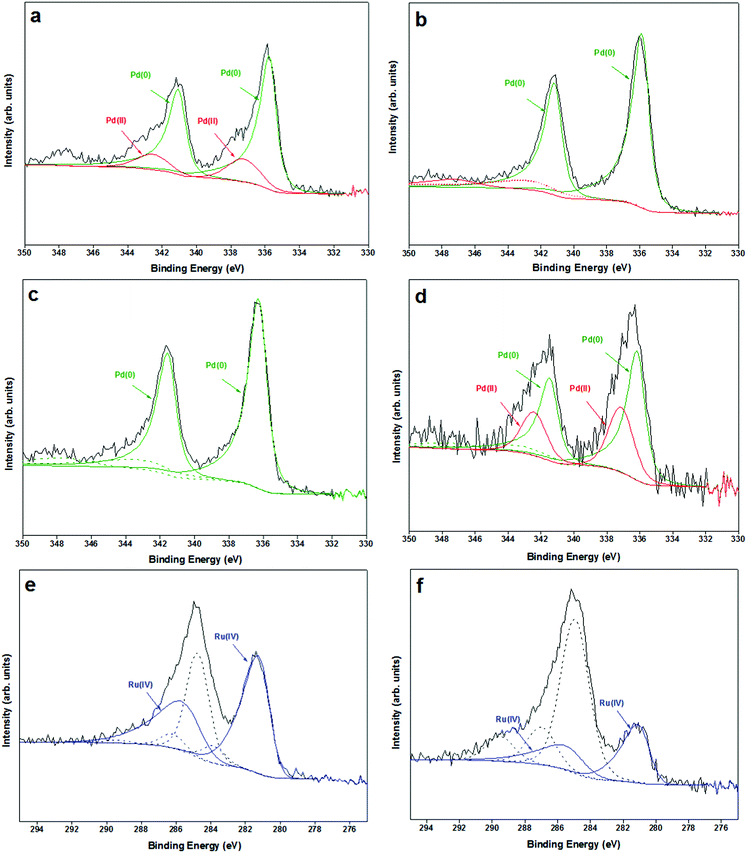
Pd/Mo2C and RuPd/Mo2C catalysts were characterised by XPS. From previous XPS studies of Mo2C catalysts, Moon et al. concluded that the deactivation of a Mo2C catalyst is caused by the transformation of Mo2C (Mo2+) to MoO3 (Mo6+) on the surface of the catalyst in the presence of H2O during WGS reaction.88 X-ray photoelectron spectroscopic data (Mo 3d) of 1% Pd/Mo2C-MIm (2 M) (ESI,† Fig. S4) reveals that the support is predominantly oxidised with several oxidation states of molybdenum ranging from Mo(δ+) to Mo(6+) (1 < δ < 4). However, these oxidised species do not show much deviation between the fresh and used samples. In respect of the metal, palladium is observed as a well resolved doublet, with the Pd3d5/2 centred at 335.7 eV, and exhibiting shake-up structure to higher binding energies indicative of metallic Pd56 and Pd3d5/2 centred at 337 eV indicative of Pd(II) (Fig. 11). Post- reaction we only see Pd(0) present in the sample possibly accounting to the hydrogenation conditions of the reaction process.
In the XPS of bimetallic RuPd samples, Ru peak (Fig. 11) is observed as an asymmetric doublet with Ru3d5/2 centred at ca. 281 eV indicative of RuO2.89 The amount of Pd(II) increases post-reaction (Fig. 11d) which may be a result of some charge transfer from Pd to Ru. This is in line with Zhang et al., who reported that for PdRu bimetallic samples the addition of Ru increases Pd(II) species.90 Ru(IV) has a higher reduction potential (+1.12 E°/V) than Pd(II) (+0.95 E°/V) causing an electron transfer from Pd to Ru resulting in an increase in Pd(II) species, which could be one of the reasons for the deactivation of this bimetallic catalyst.
A positive shift (+0.5eV) of the Pd 3d binding energies is observed for the RuPd bimetallic catalyst compared to the monometallic Pd catalyst (Table 2), indicating that a change in the electronic properties of Pd is modified upon alloying with Ru.90 Comparing the fresh and used RuPd bimetallic catalyst, shifts for the Pd 3d binding energies are within experimental error, however a negative shift (−0.3 eV) for the Ru 3d binding energy in the post reaction catalyst is observed, suggesting that there are still some alloy properties even after 3 uses, but it has decreased. It is this alloying affect that may be the reason of the bimetallic increased stability, as this metal–metal interaction is contributing to stronger metal–support interaction for Pd. Unfortunately, due to the similar atomic number of Pd, Ru and Mo it has proved very difficult to confirm this alloying through EDX.
| Sample | Pd(0) | Pd(II) | Ru(IV) | |||
|---|---|---|---|---|---|---|
| 3d5/2, eV | 3d3/2, eV | 3d5/2, eV | 3d3/2, eV | 3d5/2, eV | 3d3/2, eV | |
| 1% Pd/Mo2C-MIm (2 M) fresh | 335.73 | 341.03 | 337.25 | 342.55 | — | — |
| 1% Pd/Mo2C-MIm (2 M) used | 335.84 | 341.14 | — | — | — | — |
| 1% RuPd/Mo2C fresh | 336.20 | 341.50 | — | — | 281.03 | 285.23 |
| 1% RuPd/Mo2C used | 336.11 | 341.41 | 337.06 | 342.36 | 280.71 | 284.91 |
The initial rate of formation of formate were calculated at different temperatures (75, 100 & 125 °C) for both monometallic Pd/Mo2C and bimetallic RuPd/Mo2C catalysts under standard conditions for the first 2 hours of the reaction (ESI,† Fig. S5 + S6). Using this rate data, the apparent activation energies for 1% Pd/Mo2C and 1% RuPd/Mo2C were calculated as +36 kJ mol−1 and +43 kJ mol−1 respectively. Luo et al.61 reported that alloying RuPd results in Ru diluting and isolating certain active sites of Pd, which may result in this increase in activation energy as well as creating stabilising effects. In comparison with the literature, these results are lower than Chen et al.'s work, reporting CO2 hydrogenation to methanol Fe and Cu supported on Mo2C within an organic solvent, with activation energies of +96 and +105 kJ mol−1 respectively.34 In other catalytic systems known for hydrogenation of CO2 and HCO3− salts, the activation energy values are larger than our Pd/Mo2C catalyst, for example +54.3 kJ mol−1 for Ru/LDH,41 +39 kJ mol−1 with Pd/C catalyst.91,92 The activation energy is similar to certain homogeneous catalysts [RhCl(TPPMS)3]93 with +36 kJ mol−1. But higher than others for example with K[RuCl(EDTA-H)]94 it is +31 kJ mol−1, and [RhCl(TPPTS)3]95 it is 25 kJ mol−1.
Conclusions
Here we report 1% Pd/Mo2C as an active catalyst for the liquid phase hydrogenation of CO2 to formate under relatively mild reaction conditions. It was found that increasing the HCl concentration from 0.58 M to 2 M for the preparation of PdCl2 precursor solution for catalyst preparation increased the catalytic activity by more than 70%, producing 1.5 mmol of formate with a TON of 109 and activation energy of +36 kJ. Our study found that compared to NaHCO3 and Na2CO3, a 1 M NaOH basic solvent proved the most effective as it allowed 100% of formate formed to be derived from the CO2. Stability studies and electron microscopy data found that 1% Pd/Mo2C has a poor reusability as Pd nanoparticles easily sinter and can be partially lost from the support. However, when introducing ruthenium in a bimetallic 1% RuPd/Mo2C catalyst, although less active, greatly improves its reusability. Simulations based on DFT have found that the adsorption energies of Ru on the Mo2C surfaces are significantly lower than Pd. As such, Ru atoms have a stronger affinity towards the Mo2C support. XPS data suggests close interaction between Pd and Ru, thus, in the bimetallic catalyst the Ru atoms act like a link between the Pd and Mo2C surface, resulting in an increased stability of the RuPd/Mo2C catalyst.Conflicts of interest
There are no conflicts of interest to declare.Acknowledgements
We thank the Cardiff University electron microscopy facility for the transmission (TEM) and scanning electron microscopy (SEM). XPS data collection was performed at the EPSRC National Facility for XPS (‘HarwellXPS’), operated by Cardiff University and UCL, under contract No. PR16195. Via our membership of the UK's HEC Materials Chemistry Consortium, which is funded by EPSRC (EP/L000202), this work used the ARCHER UK National Supercomputing Service (http://www.archer.ac.uk). All data created during this research are openly available from the Cardiff University Research Portal at http://doi.org/10.6084/m9.figshare.9586913.References
- R. Kawase, Y. Matsuoka and J. Fujino, Energy Policy, 2006, 34, 2113–2122 CrossRef.
- P. Nejat, F. Jomehzadeh, M. M. Taheri, M. Gohari and M. Z. Abd. Majid, Renewable Sustainable Energy Rev., 2015, 43, 843–862 CrossRef CAS.
- G. Centi and S. Perathoner, Catal. Today, 2009, 148, 191–205 CrossRef CAS.
- G. Centi, E. A. Quadrelli and S. Perathoner, Energy Environ. Sci., 2013, 6, 1711 RSC.
- A. Dibenedetto, A. Angelini and P. Stufano, J. Chem. Technol. Biotechnol., 2014, 89, 334–353 CrossRef CAS.
- E. A. Quadrelli, G. Centi, J.-L. Duplan and S. Perathoner, ChemSusChem, 2011, 4, 1194–1215 CrossRef CAS PubMed.
- Unfccc, Adoption of the Paris Agreement – Paris Agreement text English.
- P. Styring, D. Jansen, H. de Coninck, H. Reith and K. Armstrong, Carbon Capture and Utilisation in the green economy, 2011.
- S. Ghazali-Esfahani, H. Song, E. Păunescu, F. D. Bobbink, H. Liu, Z. Fei, G. Laurenczy, M. Bagherzadeh, N. Yan and P. J. Dyson, Green Chem., 2013, 15, 1584 RSC.
- E. Alper and O. Yuksel Orhan, Petroleum, 2017, 3, 109–126 CrossRef.
- S. Y. Tee, K. Y. Win, W. S. Teo, L.-D. Koh, S. Liu, C. P. Teng and M.-Y. Han, Adv. Sci., 2017, 4, 1600337 CrossRef PubMed.
- M. Ni, M. K. H. Leung, D. Y. C. Leung and K. Sumathy, Renewable Sustainable Energy Rev., 2007, 11, 401–425 CrossRef CAS.
- J. Eppinger and K.-W. Huang, ACS Energy Lett., 2017, 2, 188–195 CrossRef CAS.
- A. Weilhard, M. I. Qadir, V. Sans and J. Dupont, ACS Catal., 2018, 8, 1628–1634 CrossRef CAS.
- G. Peng, S. J. Sibener, G. C. Schatz and M. Mavrikakis, Surf. Sci., 2012, 606, 1050–1055 CrossRef CAS.
- T. Maihom, S. Wannakao, B. Boekfa and J. Limtrakul, J. Phys. Chem. C, 2013, 117, 17650–17658 CrossRef CAS.
- D. Mellmann, P. Sponholz, H. Junge and M. Beller, Chem. Soc. Rev., 2016, 45, 3954–3988 RSC.
- J. Klankermayer, S. Wesselbaum, K. Beydoun and W. Leitner, Angew. Chem., Int. Ed., 2016, 55, 7296–7343 CrossRef CAS PubMed.
- S. A. Burgess, K. Grubel, A. M. Appel, E. S. Wiedner and J. C. Linehan, Inorg. Chem., 2017, 56, 8580–8589 CrossRef CAS PubMed.
- M. Rumayor, A. Dominguez-Ramos and A. Irabien, Appl. Sci., 2018, 8, 914 CrossRef.
- S. Moret, P. J. Dyson and G. Laurenczy, Nat. Commun., 2014, 5, 4017 CrossRef CAS PubMed.
- R. Tanaka, M. Yamashita and K. Nozaki, J. Am. Chem. Soc., 2009, 131, 14168–14169 CrossRef CAS PubMed.
- H. Hayashi, S. Ogo and S. Fukuzumi, Chem. Commun., 2004, 2714–2715 RSC.
- C. Ziebart, C. Federsel, P. Anbarasan, R. Jackstell, W. Baumann, A. Spannenberg and M. Beller, J. Am. Chem. Soc., 2012, 134, 20701–20704 CrossRef CAS PubMed.
- E. T. Liakakou and E. Heracleous, Catal. Rev. Eng., 2016, 6, 1106–1119 CAS.
- N. M. Schweitzer, J. A. Schaidle, O. K. Ezekoye, X. Pan, S. Linic and L. T. Thompson, J. Am. Chem. Soc., 2011, 133, 2378–2381 CrossRef CAS PubMed.
- B. Dhandapani, T. St. Clair and S. T. Oyama, Appl. Catal., A, 1998, 168, 219–228 CrossRef CAS.
- P. Liang, H. Gao, Z. Yao, R. Jia, Y. Shi, Y. Sun, Q. Fan and H. Wang, Catal. Sci. Technol., 2017, 7, 3312–3324 RSC.
- M. G. Quesne, A. Roldan, N. H. de Leeuw and C. R. A. Catlow, Phys. Chem. Chem. Phys., 2018, 20, 6905–6916 RSC.
- J.-L. Dubois, K. Sayama and H. Arakawa, Chem. Lett., 1992, 5–8 CrossRef CAS.
- A. B. Vidal, L. Feria, J. Evans, Y. Takahashi, P. Liu, K. Nakamura, F. Illas and J. A. Rodriguez, J. Phys. Chem. Lett., 2012, 3, 2275–2280 CrossRef CAS PubMed.
- L. Fan, Y. Sakaiya and K. Fujimoto, Appl. Catal., A, 1999, 180, L11–L13 CrossRef CAS.
- A. García-Trenco, A. Regoutz, E. R. White, D. J. Payne, M. S. P. Shaffer and C. K. Williams, Appl. Catal., B, 2018, 220, 9–18 CrossRef.
- Y. Chen, S. Choi and L. T. Thompson, J. Catal., 2016, 343, 147–156 CrossRef CAS.
- Y. Chen, S. Choi and L. T. Thompson, ACS Catal., 2015, 5, 1717–1725 CrossRef CAS.
- S. D. Richardson and S. Y. Kimura, Environ. Technol. Innov., 2017, 8, 40–56 CrossRef.
- I. U. Din, M. S. Shaharun, A. Naeem, S. Tasleem and M. Rafie Johan, Chem. Eng. J., 2018, 334, 619–629 CrossRef.
- P. G. Jessop, Y. Hsiao, T. Ikariya and R. Noyori, J. Am. Chem. Soc., 1996, 118, 344–355 CrossRef CAS.
- C. Yin, Z. Xu, S.-Y. Yang, S. Man Ng, K. Yin Wong, Z. Lin and C. Po Lau, Organometallics, 2001, 20, 1216–1222 CrossRef CAS.
- S. Posada-Perez, Phys. Chem. Chem. Phys., 2014, 16, 14912–14921 RSC.
- K. Mori, T. Taga and H. Yamashita, ACS Catal., 2017, 7, 3147–3151 CrossRef CAS.
- H. Song, N. Zhang, C. Zhong, Z. Liu, M. Xiao and H. Gai, New J. Chem., 2017, 41, 9170–9177 RSC.
- Z. Duan and R. Sun, Chem. Geol., 2003, 193, 257–271 CrossRef CAS.
- O. Pedersen, T. D. Colmer and K. Sand-Jensen, Front. Plant Sci., 2013, 4, 140 Search PubMed.
- Y. M. Badiei, W.-H. Wang, J. F. Hull, D. J. Szalda, J. T. Muckerman, Y. Himeda and E. Fujita, Inorg. Chem., 2013, 52, 12576–12586 CrossRef CAS PubMed.
- E. Fujita and Y. Himeda, Biochim. Biophys. Acta, Bioenerg., 2013, 1827, 1031–1038 CrossRef CAS PubMed.
- L. Gábor, J. Ferenc and L. Nádasd, Inorg. Chem., 2000, 39, 5083–5088 CrossRef PubMed.
- G. Peng, S. J. Sibener, G. C. Schatz, S. T. Ceyer and M. Mavrikakis, J. Phys. Chem. C, 2012, 116, 3001–3006 CrossRef CAS.
- F. Wang, J. Xu, X. Shao, X. Su, Y. Huang and T. Zhang, ChemSusChem, 2016, 9, 246–251 CrossRef CAS PubMed.
- C. S. He, L. Gong, J. Zhang, P. P. He and Y. Mu, J. CO2 Util., 2017, 19, 157–164 CrossRef CAS.
- K. Mori, T. Sano, H. Kobayashi and H. Yamashita, J. Am. Chem. Soc., 2018, 140, 8902–8909 CrossRef CAS PubMed.
- W.-H. Wang, Y. Himeda, J. T. Muckerman, G. F. Manbeck and E. Fujita, Chem. Rev., 2015, 115, 12936–12973 CrossRef CAS PubMed.
- H. Conrad, G. Ertl and E. E. Latta, Surf. Sci., 1974, 41, 435–446 CrossRef.
- I. Cabria, M. J. Lópezlópez, S. Fraile and J. A. Alonso, J. Phys. Chem. C, 2012, 116, 21179–21189 CrossRef CAS.
- T. Mitsui, M. K. Rose, E. Fomin, D. F. Ogletree and M. Salmeron, Nature, 2003, 422, 705–707 CrossRef CAS PubMed.
- X. Wang, N. Perret, L. Delannoy, C. Louis and M. A. Keane, Catal. Sci. Technol., 2016, 6, 6932–6941 RSC.
- S. Posada-Pérez, F. Viñes, R. Valero, J. A. Rodriguez and F. Illas, Surf. Sci., 2017, 656, 24–32 CrossRef.
- W. Wang, S. Wang, X. Ma and J. Gong, Chem. Soc. Rev., 2011, 40, 3703 RSC.
- L. Volpe and M. Boudart, J. Solid State Chem., 1985, 59, 348–356 CrossRef CAS.
- M. Sankar, Q. He, M. Morad, J. Pritchard, S. J. Freakley, J. K. Edwards, S. H. Taylor, D. J. Morgan, A. F. Carley, D. W. Knight, C. J. Kiely and G. J. Hutchings, ACS Nano, 2012, 6, 6600–6613 CrossRef CAS PubMed.
- W. Luo, M. Sankar, A. M. Beale, Q. He, C. J. Kiely, P. C. A. Bruijnincx and B. M. Weckhuysen, Nat. Commun., 2015, 6, 1–10 Search PubMed.
- N. Dimitratos, A. Villa and L. Prati, Catal. Lett., 2009, 133, 334–340 CrossRef CAS.
- A. N. Christensen, Acta Chem. Scand., Ser. A, 1997, 31, 509–511 Search PubMed.
- G. Kresse and J. Hafner, Phys. Rev. B: Condens. Matter Mater. Phys., 1993, 47, 558–561 CrossRef CAS PubMed.
- G. Kresse and J. Furthmuller, J. Comput. Mater. Sci, 1996, 6, 15–50 CrossRef CAS.
- J. P. Perdew, K. Burke and M. Ernzerhof, Phys. Rev. Lett., 1996, 77, 3865 CrossRef CAS PubMed.
- P. E. Blöchl, Phys. Rev. B: Condens. Matter Mater. Phys., 1994, 50, 17953 CrossRef PubMed.
- H. J. Monkhorst and J. D. Pack, Phys. Rev. B: Solid State, 1976, 13, 5188 CrossRef.
- J. R. D. S. Politi, F. Vines, J. A. Roriguez and F. Illas, Phys. Chem., 2013, 15, 12617–12625 CAS.
- K. Rohmann, J. Kothe, M. W. Haenel, U. Englert, M. Hölscher and W. Leitner, Angew. Chem., Int. Ed., 2016, 55, 8966–8969 Search PubMed.
- G. J. Hutchings and C. J. Kiely, Acc. Chem. Res., 2013, 46, 1759–1772 CrossRef CAS PubMed.
- D. Wu, K. Kusada and H. Kitagawa, Sci. Technol. Adv. Mater., 2016, 17, 583–596 CrossRef CAS PubMed.
- J. Yang, C. Tian, L. Wang and H. Fu, J. Mater. Chem., 2011, 21, 3384 RSC.
- M. L. Toebes, J. A. van Dillen and K. P. de Jong, J. Mol. Catal. A: Chem., 2001, 173, 75–98 CrossRef CAS.
- P. Paalanen, B. M. Weckhuysen and M. Sankar, Catal. Sci. Technol., 2013, 3, 2869 RSC.
- Y. Li, H. Liu, L. Ma and D. He, Appl. Catal., A, 2016, 522, 13–20 CrossRef CAS.
- T. Narita, H. Miura, M. Ohira, H. Hondou, K. Sugiyama, T. Matsuda and R. D. Gonzalez, Appl. Catal., 1987, 32, 185–190 CrossRef CAS.
- V. Ragaini, R. Carli, C. L. Bianchi, D. Lorenzetti and G. Vergani, Appl. Catal., A, 1996, 139, 17–29 CrossRef CAS.
- L. T. M. Nguyen, H. Park, M. Banu, J. Y. Kim, D. H. Youn, G. Magesh, W. Y. Kim and J. S. Lee, RSC Adv., 2015, 5, 105560–105566 RSC.
- D. Preti, C. Resta, S. Squarcialupi and G. Fachinetti, Angew. Chem., Int. Ed., 2011, 50, 12551–12554 Search PubMed.
- M. S. Maru, S. Ram, J. H. Adwani and R. S. Shukla, ChemistrySelect, 2017, 2, 3823–3830 CrossRef CAS.
- X. Nie, X. Jiang, H. Wang, W. Luo, M. J. Janik, Y. Chen, X. Guo and C. Song, ACS Catal., 2018, 8, 4873–4892 CrossRef CAS.
- R. K. Rai, K. Gupta, D. Tyagi, A. Mahata, S. Behrens, X. Yang, Q. Xu, B. Pathak and S. K. Singh, Catal. Sci. Technol., 2016, 6, 5567–5579 RSC.
- C. J. Baddeley, Chem. Phys. Solid Surf., 2002, 10, 495–526 CAS.
- E. Nowicka and M. Sankar, J. Zhejiang Univ., Sci., A, 2018, 19, 5–20 CrossRef CAS.
- P. W. Tasker, J. Phys. Chem. C, 1979, 12, 4977–4984 CAS.
- T. Wang, X. Tian, Y. Yang, Y.-W. Li, J. Wang, M. Beller and H. Jiao, Surf. Sci., 2016, 651, 195–202 CrossRef CAS.
- D. J. Moon and J. W. Ryu, Catal. Lett., 2004, 92, 17–24 CrossRef CAS.
- D. J. Morgan, Surf. Interface Anal., 2015, 47, 1072–1079 CrossRef CAS.
- J. Zhang, K. Gao, S. Wang, W. Li and Y. Han, RSC Adv., 2017, 7, 6447–6456 RSC.
- H. Wiener, J. Blum, H. Feilchenfeld, Y. Sasson and N. Zalmanov, J. Catal., 1988, 110, 184–190 CrossRef CAS.
- C. J. Stalder, S. Chao, D. P. Summers and M. S. Wrighton, J. Am. Chem. Soc., 1983, 105, 6318–6320 CrossRef CAS.
- Á. Kathó, Z. Opre, G. Laurenczy and F. Joó, J. Mol. Catal. A: Chem., 2003, 204–205, 143–148 CrossRef.
- M. M. Taqui Khan, S. B. Halligudi and S. Shukla, J. Mol. Catal., 1989, 57, 47–60 CrossRef.
- F. Gassner and W. Leitner, J. Chem. Soc., Chem. Commun., 1993, 1465 RSC.
Footnote |
| † Electronic supplementary information (ESI) available. See DOI: 10.1039/c9nj02114k |
| This journal is © The Royal Society of Chemistry and the Centre National de la Recherche Scientifique 2019 |

