 Open Access Article
Creative Commons Attribution 3.0 Unported Licence
Effects of pore surfaces on the electronic states of metal complexes formed on bipyridine periodic mesoporous organosilica†
Soichi
Shirai
 *,
Minoru
Waki
 ,
Yoshifumi
Maegawa
 ,
Yuri
Yamada
 and
Shinji
Inagaki

Toyota Central R&D Laboratories, Inc., Nagakute, Aichi 480-1192, Japan. E-mail: shirai@mosk.tytlabs.co.jp
First published on 11th January 2019
Abstract
Bipyridine periodic mesoporous organosilica (BPy-PMO) is a porous material in which the pore walls consist of silica frameworks bridged by 2,2′-bipyridine (bpy) functional groups, and is expected to be a novel platform for catalysts and photocatalysts. Metal complexes formed on the pore surfaces of BPy-PMO are under unusual environmental conditions that are entirely different from those in the bulk solids or in solution. To understand the effects of the unique structural features of the pore surfaces on the metal complexes, this study focused on the combination of BPy-PMO with Re(bpy)(CO)3Cl (Re-BPy-PMO) and analyzed the metal-to-ligand charge transfer (MLCT) absorption band of this material. UV/vis and infrared analyses demonstrated that the Re-complex in Re-BPy-PMO interacts with water molecules adsorbed on the pore surfaces. Quantum chemical calculations suggest that the Re-complex also interacts with SiOH groups on the silica framework. Combined interactions are responsible for the unexpectedly short MLCT absorption wavelength of Re-BPy-PMO. This hypothetical mechanism is consistent with a red shift of the MLCT absorption following trimethylsilylation, which transforms SiOH groups to SiOSiMe3 (TMS) groups and removes adsorbed water. Calculations also suggest that the TMS group is more electron-donating than the SiOH group. Therefore, the trimethylsilylation should result in a blue shift of the MLCT absorption with regard to the substituent effect, which is inconsistent with the experimental observations. Evidently, the effect of the removal of water and SiOH groups is sufficiently powerful to counteract the blue shift. Thus, the pore-surface features have a significant influence on the metal complex.
1 Introduction
Periodic mesoporous organosilica (PMO) is a class of porous materials with a highly-ordered porous structure, uniform pore sizes of 2–30 nm and pore walls in which organic functional groups are homogeneously and densely integrated.1–5 PMO is synthesized by the poly-condensation of an organosilane precursor having the formula R–{Si(OR′)3}x (R: organic bridging group, R′: Me, Et, i-Pr, etc. and x ≥ 2) in the presence of a template surfactant.6–8 Thus, various functionalities originating from R can be introduced on the pore walls.9,10 By taking advantage of this feature, PMOs with organic ligands that enable metal complex formation on the pore surfaces have been synthesized.11–13 These PMOs show promise as novel platforms for functional materials such as catalysts and photocatalysts, and the immobilization of homogeneous complexes on PMOs may allow separation from reaction solutions, for recovery and reuse.14–21 Porous structures having high surface areas and large pores are also advantageous with regard to obtaining efficient catalytic reactions. In particular, a PMO incorporating 2,2′-bipyridine (BPy-PMO, Fig. 1),13 which acts as a chelating ligand for a wide variety of metal ions (such as Ru, Ir, Re, Pd and Mo), has special potential for a wide variety of applications.22–27The metal complexes formed on the pore surfaces of BPy-PMO are unusual in that they are discretely fixed by an array of bipyridine (bpy) groups without fully contacting one another, in contrast to the bulk solid. These complexes also have no interactions with solvent molecules, unlike those in solution. The silica framework of BPy-PMO, which is connected to the bpy groups through Si–C bonds, behaves as a huge substituent group and exhibits substituent effects on the complexes. In addition, silanol (SiOH) groups are densely distributed over the framework and thus are in close proximity to the complexes. These specific structural features have the potential to induce anomalous electronic properties in the metal complex, although the specific effects are still insufficiently understood.
In prior work, we formed Re(bpy)(CO)3Cl complexes on the bpy ligands embedded in the pore surfaces of BPy-PMO (Re-BPy-PMO) and investigated the physicochemical properties26 and selective CO2 reduction photocatalytic activity of the resulting materials.28,29 This work found that the metal-to-ligand charge transfer (MLCT) absorption band (λMLCT) of Re-BPy-PMO in air is close to that of Re(bpy)(CO)3Cl in toluene. It has been reported that λMLCT is sensitive to both solvent polarity and the substituents on the bpy ligand, such that lower solvent polarity results in a longer λMLCT.30–33 Thus, the λMLCT of Re-BPy-PMO in air should be longer than that of Re(bpy)(CO)3Cl in solution because air can be regarded as a solvent having an extremely low polarity (εr ≈ 1). With regard to the substituent effect, λMLCT is red-/blue-shifted by electron-withdrawing/-donating substituents on the bpy ligand, and quantum chemical calculations suggest that a silica framework with SiOH groups behaves as an electron-withdrawing substituent.34 Based on both these factors, the λMLCT of Re-BPy-PMO in air should be longer than that of Re(bpy)(CO)3Cl dissolved in any solution. However, actual experimental observations are inconsistent with this theoretical prediction. In fact, the environmental effects of the pore walls, which are derived from the unique structural features discussed above, most likely decide the experimentally-observed λMLCT. Assessing the MLCT absorption band of Re(bpy)(CO)3Cl formed on the pore surfaces enables a detailed investigation of environmental effects on the complex. Such information will definitely be useful in the future development of BPy-PMO-based functional materials.
In the present study, we examined the effects of the pore surfaces on a metal complex formed on BPy-PMO, focusing on the relationship between the λMLCT of Re(bpy)(CO)3Cl and the pore surface molecular structures. For this purpose, trimethylsilylated Re-BPy-PMO (Re-BPy-PMO-TMS), in which the SiOH groups have been converted to SiOSiMe3 groups, was prepared and compared with the original Re-BPy-PMO to explore the factors affecting the λMLCT. Quantum chemical calculations were utilized to corroborate the mechanism proposed for the observed shifts of the λMLCT.
2 Experimental and computational details
2.1 Experiments
2.2 Calculations
Quantum chemical calculations were utilized to estimate λMLCT values and to explore the mechanism by which these values were shifted. All calculations were carried out utilizing the Gaussian09 program35 and the following conditions were adopted unless otherwise noted. The molecular geometric structures were optimized using the density functional theory (DFT) method with the B3LYP functional36,37 and the excited states were calculated using the time-dependent DFT (TDDFT) method38–42 with the CAM-B3LYP functional.43 The def2-TZVP and def2-SVP basis sets were employed for Re and for other elements, respectively.44 The functional and the basis sets for the TDDFT calculations were selected on the basis of our brief assessment (Table S1, ESI†). Single excitation from the second highest occupied molecular orbital (HOMO−1) to the lowest unoccupied molecular orbital (LUMO) is primarily responsible for the MLCT excitation of Re(bpy)(CO)3Cl, giving an absorption band in the vicinity of 400 nm in the UV/vis spectrum.30–32 The excited states corresponding to the HOMO−1 → LUMO excitation of Re(bpy)(CO)3Cl were identified based on their dominant excitations and relevant molecular orbitals, and the calculated excitation energies were converted to wavelengths (nm) to obtain λMLCT values. Although spin–orbit interactions are typically significant in molecular systems with heavy atoms, it has been reported that, in the case of the λMLCT of Re(bpy)(CO)3Cl, the values obtained by spin-free calculations are in good agreement with experimental results.30–32 Thus, the spin-free TDDFT method was employed in this study.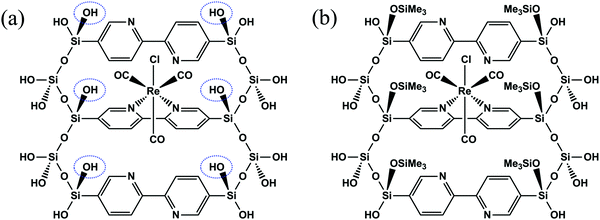 | ||
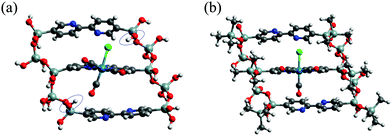
| Fig. 2 Molecular structures of (a) ReBP and (b) ReBPT. ReBPT was prepared by converting circled OH groups of ReBP to OSiMe3 groups. | ||
The molecular structures of ReBP and ReBPT were optimized and their excited states were calculated. The silica framework of the PMO forms a three-dimensional network structure, and both T2 (R–Si(OH)(OSi)2) and T3 (R–Si(OSi)3) species are present in large amounts in BPy-PMO synthesized under basic conditions,13 suggesting that the silica framework of BPy-PMO is inflexible. Therefore, the positions of Si atoms were fixed for the duration of the optimizations of the cluster models, except for those in the OSiMe3 groups of ReBPT.
3 Results and discussion
3.1 Experimental results
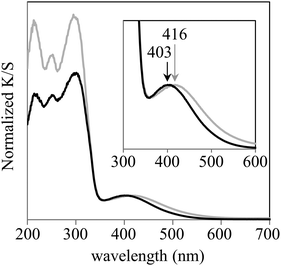
The UV/vis spectra acquired in this work are shown in Fig. 3. The λMLCT of Re-BPy-PMO had an absorption maximum at 403 nm, which is close to that of Re(bpy)(CO)3Cl in toluene.26 However, the λMLCT of Re-BPy-PMO-TMS was 416 nm, meaning that the trimethylsilylation of Re-BPy-PMO resulted in a red shift of the MLCT absorption.The IR spectra are presented in Fig. 4. The Re-BPy-PMO spectrum exhibits an absorption peak around 1600 cm−1 that is assigned to the bending vibration of water.56 This peak almost disappears upon heating under reduced pressure, indicating that the adsorbed water was almost completely removed. In the case of the Re-BPy-PMO-TMS, only a small peak was observed in this region and the spectral change upon heating under reduced pressure was insignificant, suggesting that only a small amount of water was adsorbed on the pore surfaces. The lack of water is consistent with an increase in the hydrophobicity of the pore surfaces due to trimethylsilylation.
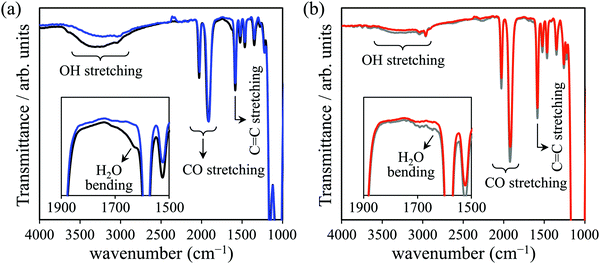 | ||
| Fig. 4 IR spectra of (a) Re-BPy-PMO before (black) and after (blue) heating, and (b) Re-BPy-PMO-TMS before (gray) and after (red) heating. | ||
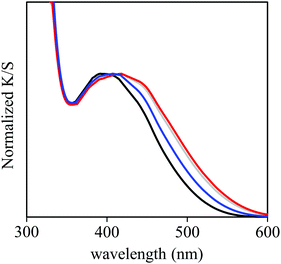
In the in situ UV/vis spectra, the MLCT absorption band of Re-BPy-PMO is red-shifted following the heating under vacuum and appears close to that generated by Re-BPy-PMO-TMS (Fig. 5). In contrast, the shift in the Re-BPy-PMO-TMS peak following the same treatment was negligible.
3.2 Calculation results
Vibrational analyses were carried out for the B3LYP-optimized geometries to confirm the absence of imaginary number frequencies. Because the second singlet excited state (S2) of each model exhibited the largest oscillator strength in the wavelength region above 300 nm (Table S2, ESI†), this excited state was regarded as the origin of the visible MLCT absorption band. The HOMO−1 → LUMO single excitation was dominant in the S2 states, while contributions from other excitations were negligible (Table S2, ESI†). Thus, these orbitals were carefully analyzed (Fig. S1, ESI†).Fig. 6 and Fig. S2 show the 5 × 2 × 5 supercell created by replicating the optimized unit cell. The optimized cell parameters and the Cartesian coordinates of the atoms are provided in Table S3 (ESI†). The calculated length of the c axis (4.75 Å) is close to the intermolecular distance between the organic groups (4.4 Å), which was previously estimated by molecular mechanics calculations.5 A cluster including three organic groups within the silica framework was cut out from this supercell along the c axis and was utilized to prepare the ReBP and ReBPT models (see Section 2.2.1).
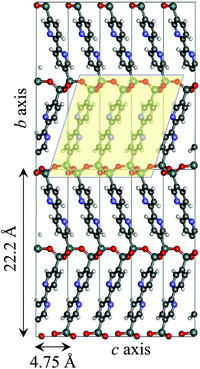 | ||
| Fig. 6 Molecular structure of BPy-PMO pore-wall model optimized by utilizing first principle calculation. The bc plane of 5 × 2 × 5 supercell is presented. A cluster including three bipyridine groups and silica framework in a square were cut out and used for preparing ReBP and ReBPT (Fig. 2). | ||
The calculated λMLCT values of the model clusters are also collected in Table 1. The ReBP and ReBPT values were 404.7 and 432.8 nm, respectively, and thus were in good agreement with the experimental results, where the λMLCT values were in the order of Re-BPy-PMO < Re-BPy-PMO-TMS (Fig. 3). The HOMO−1 and LUMO levels of ReBPT were shifted upward by 0.60 and 0.36 eV from those of ReBP, leading to a smaller ΔH−1/L and a longer λMLCT. In this case, in contrast to the changes from XOH to XOTMS, the HOMO−1 level rises more significantly than the LUMO level. The optimized structures for ReBP and ReBPT are shown in Fig. 7. In ReBP, the OH bonds of SiOH groups are oriented relative to the CO and Cl ligands of the Re-complex moiety, suggesting hydrogen-bond-like interactions (Fig. 7(a)). These interactions attract the CO and Cl ligands to the SiOH groups and induce a slight distortion of the Re-complex. Such interactions and distortion of the complex are not observed in the case of the ReBPT, for which there are no SiOH groups around the complex.
| Molecule | Solvent | λ MLCT (nm) | Orbital energy level (eV) | |||
|---|---|---|---|---|---|---|
| Calc. | Exptl.a | HOMO−1 | LUMO | Δ H−1/L | ||
| a Ref. 32. b Re[5,5′-{Si(OH)3}2bpy](CO)3Cl. c Re[5,5′-{Si(OH)2(OSiMe3)}2bpy](CO)3Cl. | ||||||
| Re(bpy)(CO)3Cl | Toluene | 408.9 | 403 | −7.06 | −1.59 | 5.47 |
| CH2Cl2 | 374.8 | 387 | −7.24 | −1.48 | 5.76 | |
| CH3CN | 364.7 | 371 | −7.31 | −1.45 | 5.86 | |
| Water | 362.9 | −7.32 | −1.45 | 5.87 | ||
| XOHb | Toluene | 421.4 | −7.08 | −1.76 | 5.32 | |
| CH2Cl2 | 389.1 | −7.26 | −1.69 | 5.57 | ||
| CH3CN | 379.5 | −7.32 | −1.67 | 5.66 | ||
| Water | 377.7 | −7.33 | −1.66 | 5.67 | ||
| XOTMSc | Toluene | 417.8 | −7.07 | −1.72 | 5.35 | |
| CH2Cl2 | 386.4 | −7.26 | −1.66 | 5.60 | ||
| CH3CN | 377.0 | −7.32 | −1.64 | 5.68 | ||
| Water | 375.3 | −7.33 | −1.63 | 5.70 | ||
The results for Re(bpy)(CO)3Cl–(H2O)n are collected in Table 3. The λMLCT was shortened with increases in n and the values were in the order of 1BPy > 1CO ≈ 1CL for n = 1 and 2BPy > 2CO ≈ 2CL for n = 2. These data demonstrate that the blue shift induced by the solvent primarily originates from the interactions of the solvent molecules with the CO and Cl ligands. The HOMO−1 levels of 1CO, 1CL, 2CO and 2CL were all shifted downward from those of Re(bpy)(CO)3Cl, while the LUMO levels varied over a narrow range. The ΔH−1/L value was therefore increased with increases in n and correlated with λMLCT. The optimized structures for Re(bpy)(CO)3Cl–(H2O)n are shown in Fig. 8. The O–H bonds of H2O, which are polarized as Oδ−–Hδ+, are determined to be oriented relative to the CO and Cl ligands in 1CO, 1CL, 2CO and 2CL. The HOMO−1 of Re(bpy)(CO)3Cl is stabilized when Hδ+ approaches the CO and/or Cl ligands, since the orbital is distributed over the Re(CO)3Cl moiety (Fig. S1, ESI†). Although the Re(bpy)(CO)3Cl complex formed on BPy-PMO is half embedded in the pore wall, the CO and Cl ligands stick out from the pore surface and the space around these ligands is expected to be vacant. Therefore, the adsorbed water molecules can readily approach these ligands to induce a blue shift in the MLCT adsorption.
| Model | λ MLCT (nm) | Orbital energy level (eV) | ||
|---|---|---|---|---|
| HOMO−1 | LUMO | Δ H−1/L | ||
| Re(bpy)(CO)3Cl | 460.7 | −6.85 | −1.76 | 5.09 |
| 1CO | 423.9 | −7.03 | −1.69 | 5.34 |
| 1CL | 421.3 | −7.11 | −1.77 | 5.34 |
| 1BPy | 448.1 | −6.69 | −1.52 | 5.17 |
| 2CO | 408.7 | −7.05 | −1.59 | 5.46 |
| 2CL | 393.0 | −7.35 | −1.76 | 5.59 |
| 2BPy | 434.0 | −6.55 | −1.29 | 5.26 |
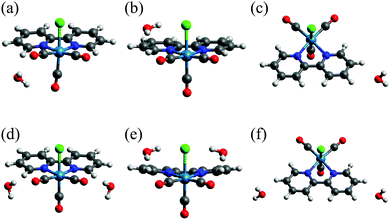 | ||
| Fig. 8 Optimized structures of Re(bpy)(CO)3Cl–(H2O)n: (a) 1CO, (b) 1CL, (c) 1BPy, (d) 2CO, (e) 2CL and (f) 2BPy. | ||
In the optimized structures of 1BPy and 2BPy, water molecules interact with C–H bonds of the bpy ligand (Fig. 8(c and f)). In actual systems, the O–H bonds of water molecules may interact with π orbitals of the bpy ligand.58 In our calculations of Re(bpy)(CO)3Cl–(H2O)n, however, such structures were not obtained. In the calculation employing an initial structure of Re(bpy)(CO)3Cl–(H2O) in which a water molecule is placed above the bpy-ligand molecular plane, the water molecule departed from the bpy ligand and moved toward the CO or Cl ligands as a result of the geometry optimizations. The result suggests that the interactions of water molecules with the CO and Cl ligands are stronger than those with the bpy ligand. The O–H/π interactions may be predicted by incorporating the cluster of water molecules with hydrogen bond networks.
3.3 Discussion
The IR spectra (Fig. 4) suggest that water is adsorbed on the pore surfaces of Re-BPy-PMO in air, but is almost absent on Re-BPy-PMO-TMS. The interactions between the Re(bpy)(CO)3Cl complex and water molecules induces a blue shift in the MLCT absorption band. This mechanism is supported by the red shift in the MLCT band of Re-BPy-PMO following heating under vacuum (Fig. 5) and the results of calculations incorporating solvent effects (Tables 2 and 3). Thus, it is likely that the blue shift due to adsorbed water dictates the experimentally-obtained ordering of the λMLCT values (Re-BPy-PMO < Re-BPy-PMO-TMS).The optimized structure of ReBP shown in Fig. 7(a) suggests that the Re(bpy)(CO)3Cl moieties of Re-BPy-PMO also interact with SiOH groups on the silica framework. The OH bonds of these SiOH groups are oriented relative to the CO and Cl ligands as well as the OH bonds of water molecules in Re(bpy)(CO)3Cl–(H2O)n (Fig. 8). The optimized structures suggest that the SiOH groups have similar effects to the water molecules and also contribute to a blue shift of the MLCT absorption band through the downward shift of the HOMO−1 level. To examine this hypothetical mechanism, ReBPH was prepared by substituting H atoms for the two OH groups that interact with the Re-complex moiety (Fig. S3, ESI†). The positions of these two H atoms were re-optimized and the λMLCT was calculated adopting the conditions described in Section 2.2. The resulting λMLCT of 446.1 nm was significantly longer than that for ReBP (404.7 nm). The HOMO−1 and LUMO levels of ReBPH were −6.79 and −1.64 eV, respectively, while the ΔH−1/L was 5.15 eV (Table S2, ESI†). The reduced ΔH−1/L is primarily attributed to the increase in the HOMO−1 level and is consistent with the change in λMLCT. The calculated λMLCT for ReBPH is longer even than that for ReBPT, which is consistent with the substituent effects of SiOH and SiOSiMe3 groups estimated from the results for XOH and XOTMS (Table 1). As the predicted interactions between SiOH groups and Re(bpy)(CO)3Cl moieties are originated from the local molecular structures around the Re-complex moieties, the calculation results are expected to be independent of the ReBP cluster size.
These results indicate that both adsorbed water and SiOH groups in Re-BPy-PMO induce a blue shift in the MLCT absorption band, resulting in the λMLCT values in the order of Re-BPy-PMO < Re-BPy-PMO-TMS. The combined effects of the adsorbed water and SiOH groups are responsible for the unexpectedly short MLCT absorption wavelength of Re-BPy-PMO which is close to that of Re(bpy)(CO)3Cl in toluene.26 The MLCT band of Re-BPy-PMO was red-shifted following heating in a vacuum, and its λMLCT approached that of Re-BPy-PMO-TMS (Fig. 5). The red shift can be attributed to the removal of adsorbed water, while the interactions between Re(bpy)(CO)3Cl moieties and SiOH groups remain even after the vacuum heating. The blue shift resulting from SiOH groups is responsible for the λMLCT of Re-BPy-PMO which is shorter than that of Re-BPy-PMO-TMS after the vacuum heating.
In the case of ReBP, the Re-complex moiety was distorted by the attractive interactions with SiOH groups (Fig. 7(a)). To examine the effect of this distortion on λMLCT, the complex moiety of ReBP was cut out from the optimized structure by breaking the Si–C bonds. The dangling bonds were terminated by H atoms and the positions of the two H atoms were re-optimized. The λMLCT was then calculated utilizing the same procedure and conditions discussed in Section 2.2. The calculated λMLCT was 461.4 nm (Table S2, ESI†) and thus similar to that of Re(bpy)(CO)3Cl having an optimized structure (460.7 nm, Table 1), indicating that the influence of the distortion was negligible.
The red shift of λMLCT following trimethylsilylation was inconsistent with the substituent effects suggested by the λMLCT values in the order of XOH > XOTMS (Table 1). The results demonstrate that the red shift due to the removal of the interactions of Re(bpy)(CO)3Cl moieties with the SiOH groups and adsorbed water counteracts the blue shift due to the change in the substituent effect. In this case, the structural properties of the pore surfaces have a significant influence on the electronic properties of the metal complex formed on the BPy-PMO. Thus, modification of the pore surfaces is a potential means of controlling the properties and functionalities of the metal complex, in addition to selecting specific metal ions and ligands. The effects of the modification of the pore surfaces on catalytic activity, selectivity and stability, as implied in our recent study,27 are currently being investigated in our laboratory.
4 Conclusions
Metal complexes formed on the pore surfaces of BPy-PMO exist under unusual environmental conditions that are entirely different from those in the bulk solids or in solution. In this study, we examined the MLCT absorption band of Re(bpy)(CO)3Cl to understand the effects of the pore surfaces on the electronic properties of the complex. The experimental and calculation results indicate that the Re(bpy)(CO)3Cl moieties of Re-BPy-PMO interact with both adsorbed water and SiOH groups on the silica framework. These interactions contribute to a blue shift of the MLCT absorption band and are responsible for the significantly shorter λMLCT wavelength of Re-BPy-PMO which is close to that of Re(bpy)(CO)3Cl in toluene. These interactions are largely absent in Re-BPy-PMO-TMS, resulting in λMLCT values that increase in the order of Re-BPy-PMO < Re-BPy-PMO-TMS. The calculation results suggest that the SiOSiMe3 group is more electron-donating than the SiOH group, and therefore trimethylsilylation contributes to a blue shift of the MLCT absorption with regard to the substituent effect. However, a red shift was experimentally observed following trimethylsilylation as a result of the removal of water molecules and SiOH groups, which was more powerful than the blue shift. Thus, the pore surface has dominant effects on the electronic properties of the metal complex.Conflicts of interest
There are no conflicts to declare.Acknowledgements
This work was partially supported by the Advanced Catalytic Transformation Program for Carbon Utilization (ACT-C) of the Japan Science and Technology Agency (JST) (Grant number: JPMJCR12Y1). Prof. Atsushi Satsuma at Nagoya University is acknowledged for his technical support while acquiring in situ UV/vis spectra. The authors are also grateful to Drs Ryoji Asahi and Nobuko Ohba at Toyota Central R&D Labs., Inc. for their suggestions, supports and encouragement.References
- S. Inagaki, S. Guan, Y. Fukushima, T. Ohsuna and O. Terasaki, J. Am. Chem. Soc., 1999, 121, 9611–9614 CrossRef CAS.
- T. Asefa, M. J. MacLachlan, N. Coombs and G. A. Ozin, Nature, 1999, 402, 867–871 CrossRef CAS.
- B. J. Melde, B. T. Holland, C. F. Blanford and A. Stein, Chem. Mater., 1999, 11, 3302–3308 CrossRef CAS.
- C. Yoshina-Ishii, T. Asefa, N. Coombs, M. J. MacLachlan and G. A. Ozin, Chem. Commun., 1999, 2539–2540 RSC.
- S. Inagaki, S. Guan, T. Ohsuna and O. Terasaki, Nature, 2002, 416, 304–307 CrossRef CAS PubMed.
- K. J. Shea, D. A. Loy and O. Webster, J. Am. Chem. Soc., 1992, 114, 6700–6710 CrossRef CAS.
- R. J. P. Corriu, Angew. Chem., Int. Ed., 2000, 39, 1376–1398 CrossRef CAS PubMed.
- D. A. Loy and K. J. Shea, Chem. Rev., 1995, 95, 1431–1442 CrossRef CAS.
- S. Fujita and S. Inagaki, Chem. Mater., 2008, 20, 891–908 CrossRef CAS.
- N. Mizoshita, T. Tani and S. Inagaki, Chem. Soc. Rev., 2011, 40, 789–800 RSC.
- M. Waki, N. Mizoshita, T. Ohsuna, T. Tani and S. Inagaki, Chem. Commun., 2010, 46, 8163–8165 RSC.
- M. Waki, N. Mizoshita, T. Tani and S. Inagaki, Angew. Chem., Int. Ed., 2011, 50, 11667–11671 CrossRef CAS PubMed.
- M. Waki, Y. Maegawa, K. Hara, Y. Goto, S. Shirai, Y. Yamada, N. Mizoshita, T. Tani, W. J. Chun, S. Muratsugu, M. Tada, A. Fukuoka and S. Inagaki, J. Am. Chem. Soc., 2014, 136, 4003–4011 CrossRef CAS PubMed.
- Z. M. Michalska and D. E. Webster, Platinum Met. Rev., 1984, 18, 65–73 Search PubMed.
- X. S. Zhao, X. Y. Bao, W. P. Guo and F. Y. Lee, Mater. Today, 2006, 9, 32–39 CrossRef CAS.
- C. E. Song and S.-g. Lee, Chem. Rev., 2002, 102, 3495–3524 CrossRef CAS PubMed.
- D. E. De Vos, M. Dams, B. F. Sels and P. A. Jacobs, Chem. Rev., 2002, 102, 3615–3640 CrossRef CAS PubMed.
- P. McMorn and G. J. Hutchings, Chem. Soc. Rev., 2004, 33, 108–122 RSC.
- C. Li, Catal. Rev.: Sci. Eng., 2004, 46, 419–492 CrossRef CAS.
- A. E. C. Collis and I. T. Horváth, Catal. Sci. Technol., 2011, 1, 912–919 RSC.
- C. Perego and R. Millini, Chem. Soc. Rev., 2013, 42, 3956–3976 RSC.
- Y. Maegawa and S. Inagaki, Dalton Trans., 2015, 44, 13007–13016 RSC.
- X. Liu, Y. Maegawa, Y. Goto, K. Hara and S. Inagaki, Angew. Chem., Int. Ed., 2016, 55, 7943–7947 CrossRef CAS PubMed.
- N. Ishito, H. Kobayashi, K. Nakajima, Y. Maegawa, S. Inagaki, K. Hara and A. Fukuoka, Chem. – Eur. J., 2015, 21, 15564–15569 CrossRef CAS PubMed.
- Y. Kuramochi, M. Sekine, K. Kitamura, Y. Maegawa, Y. Goto, S. Shirai, S. Inagaki and H. Ishida, Chem. – Eur. J., 2017, 23, 10301–10309 CrossRef CAS PubMed.
- M. Waki, K.-i. Yamanaka, S. Shirai, Y. Maegawa, Y. Goto, Y. Yamada and S. Inagaki, Chem. – Eur. J., 2018, 24, 3846–3853 CrossRef CAS PubMed.
- S. Ishikawa, Y. Maegawa, M. Waki and S. Inagaki, ACS Catal., 2018, 8, 4160–4169 CrossRef CAS.
- J. Hawecker, J. M. Lehn and R. Ziessel, J. Chem. Soc., Chem. Commun., 1983, 536–538 RSC.
- J. Hawecker, J. M. Lehn and R. Ziessel, Helv. Chim. Acta, 1986, 69, 1990–2012 CrossRef CAS.
- L. Yang, A. M. Ren, J. K. Feng, X. J. Liu, Y. G. Ma, M. Zhang, X. D. Liu, J. C. Shen and H. X. Zhang, J. Phys. Chem. A, 2004, 108, 6797–6808 CrossRef CAS.
- A. Vlček and S. Zális, J. Phys. Chem. A, 2005, 109, 2991–2992 CrossRef PubMed.
- R. Heydová, E. Gindensperger, R. Romano, J. Sýkora, A. Vlček, S. Zális and C. Daniel, J. Phys. Chem. A, 2012, 116, 11319–11329 CrossRef PubMed.
- L. A. Worl, R. Duesing, P. Y. Chen, L. Dellaciana and T. J. Meyer, J. Chem. Soc., Dalton Trans., 1991, 849–858 RSC.
- S. Shirai, S. Iwata, Y. Maegawa, T. Tani and S. Inagaki, J. Phys. Chem. A, 2012, 116, 10194–10202 CrossRef CAS PubMed.
- M. J. Frisch, G. W. Trucks, H. B. Schlegel, G. E. Scuseria, M. A. Robb, J. R. Cheeseman, G. Scalmani, V. Barone, G. A. Petersson, H. Nakatsuji, X. Li, M. Caricato, A. Marenich, J. Bloino, B. G. Janesko, R. Gomperts, B. Mennucci, H. P. Hratchian, J. V. Ortiz, A. F. Izmaylov, J. L. Sonnenberg, D. Williams-Young, F. Ding, F. Lipparini, F. Egidi, J. Goings, B. Peng, A. Petrone, T. Henderson, D. Ranasinghe, V. G. Zakrzewski, J. Gao, N. Rega, G. Zheng, W. Liang, M. Hada, M. Ehara, K. Toyota, R. Fukuda, J. Hasegawa, M. Ishida, T. Nakajima, Y. Honda, O. Kitao, H. Nakai, T. Vreven, K. Throssell, J. A. Montgomery, Jr., J. E. Peralta, F. Ogliaro, M. Bearpark, J. J. Heyd, E. Brothers, K. N. Kudin, V. N. Staroverov, T. Keith, R. Kobayashi, J. Normand, K. Raghavachari, A. Rendell, J. C. Burant, S. S. Iyengar, J. Tomasi, M. Cossi, J. M. Millam, M. Klene, C. Adamo, R. Cammi, J. W. Ochterski, R. L. Martin, K. Morokuma, O. Farkas, J. B. Foresman and D. J. Fox, Gaussian 09, Revision D.01, Gaussian, Inc., Wallingford CT, 2016 Search PubMed.
- A. D. Becke, J. Chem. Phys., 1993, 98, 5648–5652 CrossRef CAS.
- P. J. Stephens, F. J. Devlin, C. F. Chabalowski and M. J. Frisch, J. Phys. Chem., 1994, 98, 11623–11627 CrossRef CAS.
- E. Runge and E. K. U. Gross, Phys. Rev. Lett., 1984, 52, 997–1000 CrossRef CAS.
- E. K. U. Gross and W. Kohn, Adv. Quantum Chem., 1990, 21, 255–291 CrossRef CAS.
- C. Jamorski, M. E. Casida and D. R. Salahub, J. Chem. Phys., 1996, 104, 5134–5147 CrossRef CAS.
- M. Petersilka, U. J. Gossmann and E. K. U. Gross, Phys. Rev. Lett., 1996, 76, 1212–1215 CrossRef CAS PubMed.
- M. E. Casida, C. Jamorski, K. C. Casida and D. R. Salahub, J. Chem. Phys., 1998, 108, 4439–4449 CrossRef CAS.
- T. Yanai, D. P. Tew and N. C. Handy, Chem. Phys. Lett., 2004, 393, 51–57 CrossRef CAS.
- F. Weigend and R. Ahlrichs, Phys. Chem. Chem. Phys., 2005, 7, 3297–3305 RSC.
- E. Cancès, B. Mennucci and J. Tomasi, J. Chem. Phys., 1997, 107, 3032–3041 CrossRef.
- J. Tomasi, B. Mennucci and R. Cammi, Chem. Rev., 2005, 105, 2999–3093 CrossRef CAS PubMed.
- G. Scalmani and M. J. Frisch, J. Chem. Phys., 2010, 132, 114110 CrossRef PubMed.
- J. Klimeš, D. R. Bowler and A. Michaelides, J. Phys.: Condens. Matter, 2010, 22, 022201 CrossRef PubMed.
- M. Dion, H. Rydberg, E. Schröder, D. C. Langreth and B. I. Lundqvist, Phys. Rev. Lett., 2004, 92, 246401 CrossRef CAS PubMed.
- M. Dion, H. Rydberg, E. Schröder, D. C. Langreth and B. I. Lundqvist, Phys. Rev. Lett., 2005, 95, 109902 CrossRef.
- G. Román-Pérez and J. M. Soler, Phys. Rev. Lett., 2009, 103, 096102 CrossRef PubMed.
- J. Klimeš, D. R. Bowler and A. Michaelides, Phys. Rev. B: Condens. Matter Mater. Phys., 2011, 83, 195131 CrossRef.
- H. J. Monkhorst and J. D. Pack, Phys. Rev. B: Solid State, 1976, 13, 5188–5192 CrossRef.
- G. Kresse and J. Furthmüller, Phys. Rev. B: Condens. Matter Mater. Phys., 1996, 54, 11169–11186 CrossRef CAS.
- G. Kresse and J. Furthmüller, Comput. Mater. Sci., 1996, 6, 15–50 CrossRef CAS.
- D. B. Asay and S. H. Kim, J. Phys. Chem. B, 2005, 109, 16760–16763 CrossRef CAS PubMed.
- K. A. Walters, Y. J. Kim and J. T. Hupp, Inorg. Chem., 2002, 41, 2909–2919 CrossRef CAS.
- L. V. Slipchenko and M. S. Gordon, J. Phys. Chem. A, 2009, 113, 2092–2102 CrossRef CAS PubMed.
Footnote |
| † Electronic supplementary information (ESI) available: Assessment on functional and basis set dependence in TDDFT calculation (Table S1); detailed results of the excited state calculations (Table S2); molecular orbitals of the models (Fig. S1); molecular structure of the BPy-PMO-pore-wall model (Fig. S2); cell parameters and Cartesian coordinates of the BPy-PMO-pore-wall model (Table S3); results of population analyses of the ground and MLCT excited states of Re(bpy)(CO)3Cl (Table S4); molecular structure of ReBPH (Fig. S3). See DOI: 10.1039/c8nj06277c |
| This journal is © The Royal Society of Chemistry and the Centre National de la Recherche Scientifique 2019 |


