
High-efficiency transfer of fingerprints from various surfaces using nanofibrillated cellulose†
Yang
Liu‡
a,
Keying
Long‡
a,
Hanbing
Mi
a,
Ruitao
Cha
 *a and
Xingyu
Jiang
*abc
*a and
Xingyu
Jiang
*abc
aBeijing Engineering Research Center for BioNanotechnology and CAS Key Lab for Biological Effects of Nanomaterials and Nanosafety, CAS Center for Excellence in Nanoscience, National Center for NanoScience and Technology, 11 Beiyitiao, ZhongGuanCun, Beijing 100190, P. R. China. E-mail: chart@nanoctr.cn; xingyujiang@nanoctr.cn
bDepartment of Biomedical Engineering, Southern University of Science and Technology, No. 1088 Xueyuan Road, Nanshan District, Shenzhen, Guangdong 518055, P. R. China
cUniversity of Chinese Academy of Sciences, 19A Yuquan Road, Shijingshan District, Beijing 100049, P. R. China
First published on 1st March 2019
Abstract
Fingerprint identification, initially developed as physical evidence for personal identification at crime scenes, has become extraordinarily useful in many fields, such as passwords for computers and smartphones, codes for security clearance and so forth. But the development of fingerprints is often plagued by the real environment and un-uniform nature of most substrates, which lead to the partial or complete absence of information. A particular bottleneck in these applications is latent fingerprint (LFP) visualization on rough surfaces. In this report, we developed a fluorescent nanofibrillated cellulose/carbon dot (NFC/CD) paper to address the high-efficiency transfer and detection of LFPs on different substrates simultaneously. We can transfer most of the feature points from rough surfaces onto the NFC/CD paper, whereas we can extract few feature points from a rubber substrate using cyanoacrylate fuming and staining with super-paramagnetic iron oxide nanoparticles. The NFC/CD paper has great potential in the fields of image analysis, packaging, smartphones, entrance clearance, personal identification, and mobile payments.
Conceptual insightsIn this report, we developed a fluorescent nanofibrillated cellulose/carbon dot (NFC/CD) paper to address the high-efficiency transfer and detection of latent fingerprints on different substrates, particularly rough ones. Compared to existing papers published in this field (Angew. Chem., Int. Ed., 2014, 53, 1616–1620; Angew. Chem., Int. Ed., 2014, 53, 9822–9826; ACS Nano, 2015, 9, 12344–12348; Nat. Commun., 2014, 5, 3736–3746; Adv. Mater., 2015, 27, 7293–7298), our approach is the only one that can extract fingerprint features from rough surfaces using the NFC/CD paper, whereas we can extract few feature points from a rubber substrate using existing approaches, such as cyanoacrylate fuming or staining with super-paramagnetic iron oxide nanoparticles. Up to 60% of the features on the rubber substrate can be transferred. Our approach thus has great potential in the fields of image analysis, packaging, smartphones, entrance clearance, personal identification, and mobile payments. |
Introduction
Since the 19th century, fingerprints have been used as one of the most important means for personal identification because of their specificity and stability.1 We can directly observe certain fingerprints if the fingers are contaminated with specific substances, such as blood, paint, or ink. Fingerprints that are found at crime scenes and invisible to the naked eye are typically called latent fingerprints (LFPs).2 Researchers have developed forensic fingerprint enhancement techniques in the last few decades, such as cyanoacrylate fuming, dusting with black powder, the ninhydrin method, iodine treatment, and the silver nitrate method, to make LFPs visible.3–7 During the past few years, tremendous efforts have improved the sensitivity of identification. For instance, infrared spectroscopy,8 ultraviolet reflection,9 fluorescence spectroscopy,10 Raman spectroscopy,11 mass spectrometry,12 vacuum metal deposition,13 electrochemiluminescence and photoluminescence techniques integrated with LFP identification for smooth surfaces (glass, plastic, and metal) have led to great results.14–16 Recently, carbon dots as a new class of optical markers were used for mapping latent fingerprints,17 owing to their strong fluorescence, tunable photoluminescent properties, good photostability, high resistance to photobleaching, controllable diameter, and straightforward synthesis, when compared with other fluorescent dyes and nanoparticles.18–35 Nevertheless, fingerprints, which play a very vital role in forensic investigation, are difficult to develop from substrates such as rubber and cloth using traditional methods.36 To date, the development of new media has become an urgent requirement for transfer and detection of LFPs.In this study, we chose nanofibrillated cellulose (NFC) as a support material to prepare a fluorescent nanofibrillated cellulose/carbon dot (NFC/CD) paper by synthesizing fluorescent CDs on the surface of the NFC through microwave treatment to address the high-efficiency transfer and detection of LFPs on different substrates simultaneously (Scheme 1). As a support material, NFC exhibits large surface area, porous properties, tunable surface chemistry, and high mechanical strength, making it a good candidate for integration with CDs through electrostatic interaction to synthesize functional composite paper with combined advantages of NFC and CDs.37–42 For the synthesis of CDs, we used citric acid (CA) as a main carbon source and 1,2-ethylenediamine (EDA) as a source for nitrogen doping. We evaluated the efficiency of LFP transfer and detection by feature point extraction and similarity analysis.
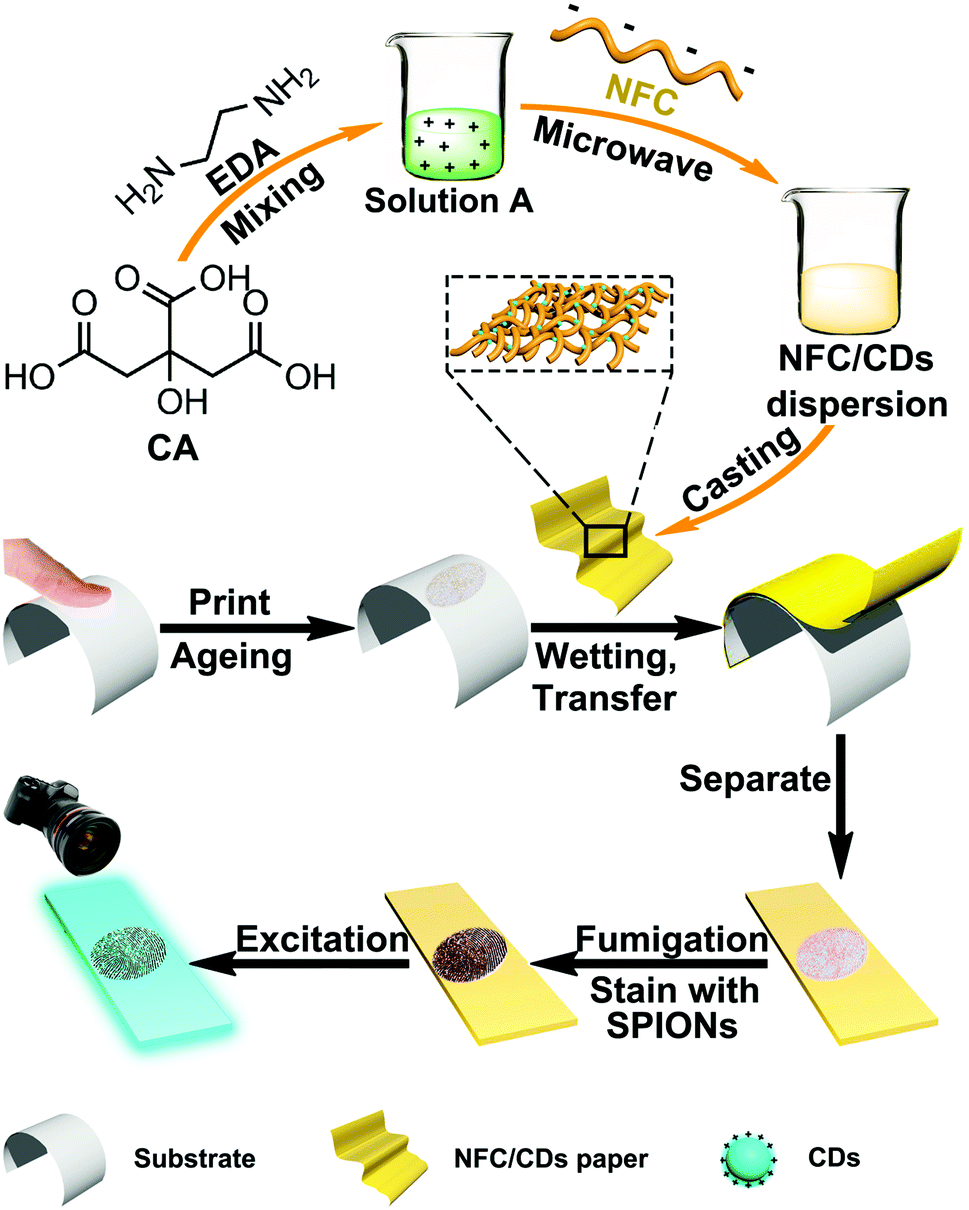 | ||
| Scheme 1 The preparation process of a fluorescent NFC/CD paper and transfer and detection of LFPs through the NFC/CD paper. | ||
Results and discussion
We confirmed the chemical structure of CDs by FT-IR spectroscopy. For CA, the absorption peak at 1755 cm−1 corresponds to the C![[double bond, length as m-dash]](https://www.rsc.org/images/entities/char_e001.gif) O stretching vibrations of the carboxyl group (Fig. 1a). For CDs, the peaks at 3410, 1630, and 1160 cm−1 are the characteristic peaks of O–H, N–H, and C–O–C stretching vibrations.24 A new peak at 1488 cm−1 is ascribed to the bending vibration of –CH3. All the absorption peaks indicate that we successfully synthesized CDs.
O stretching vibrations of the carboxyl group (Fig. 1a). For CDs, the peaks at 3410, 1630, and 1160 cm−1 are the characteristic peaks of O–H, N–H, and C–O–C stretching vibrations.24 A new peak at 1488 cm−1 is ascribed to the bending vibration of –CH3. All the absorption peaks indicate that we successfully synthesized CDs.
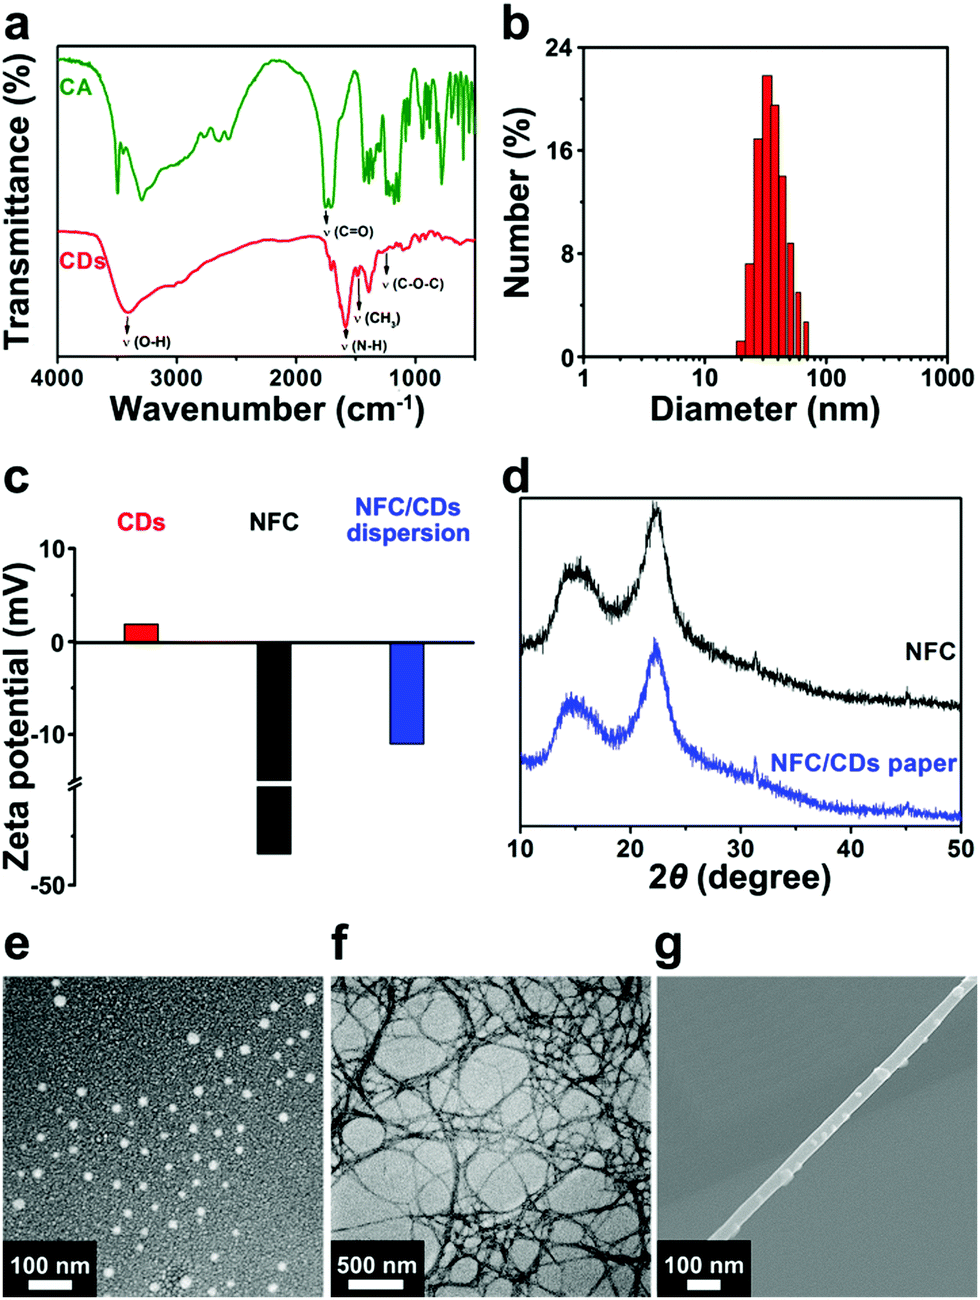 | ||
| Fig. 1 Structures and morphologies of the CDs, NFC/CD dispersion, and NFC/CD paper. (a) FT-IR spectra of CA and the CDs. (b) The diameters of the CDs. (c) The zeta potentials of the CDs, NFC, and NFC/CD dispersion. (d) XRD spectra of the NFC and NFC/CD paper. (e) SEM image of the CDs. (f) TEM image of the NFC. (g) SEM image of the NFC/CDs. | ||
The diameters of the CDs range from 20 to 50 nm (Fig. 1b). The surface potential of the NFC changes from −46.8 mV to −11 mV after being modified with CDs (1.87 mV) (Fig. 1c), which demonstrates that CDs were successfully attached to the surface of the NFC.
We investigated the crystallinities of the NFC and NFC/CD paper using XRD analysis (Fig. 1d). The characteristic peaks that appeared at 16.3° and 22.5° are attributed to the crystal phase of typical cellulose I.43 We observe no significant distinction between the NFC and NFC/CD paper, implying that the NFC maintains its typical cellulose structure after microwave treatment. It means that the carbon for CDs comes from the modified CA rather than the NFC.
We can clearly observe CDs as regular spherical particles with a narrow diameter distribution of 20–30 nm (Fig. 1e). NFC exhibits an obvious filamentous structure (Fig. 1f).38 A number of CDs are well attached to the surface of the NFC (Fig. 1g), because the large specific surface area of the NFC offers a contact area to support CDs. Positively charged tertiary amino groups in CDs could combine with negatively charged carboxyl groups in the NFC by electrostatic interaction, which facilitates the attachment of CDs on the surface of the NFC.44
The synthesized CDs have a longer fluorescence lifetime of 15.58 ns and a high fluorescent quantum yield of 11.8% at an excitation wavelength of 360 nm, which are consistent with previously reported values.28 In the NFC/CD paper, a large amount of nitrogen is evenly distributed on the surface of the NFC (Fig. S1c, ESI†). After microwave treatment, the nitrogen content on the surface of the NFC increases from 0.23% to 7.95% (Fig. S1, ESI†). These data demonstrate that we successfully synthesized N-doped CDs on the surface of the NFC.
We investigated the fluorescence properties of the NFC/CD dispersion, CDs, and NFC using UV-Vis absorption and fluorescence (FL) emission spectra (Fig. 2). There are two characteristic absorption peaks located at 237 nm and 350 nm in the UV-Vis absorption spectrum of CDs (Fig. 2a),23 which are attributed to the π–π* transitions of sp2-hybridized carbon and the n–π* transitions at the edge of the carbon lattice.25 The UV-Vis spectrum of the NFC does not show an obvious absorption peak from 220 to 450 nm. For the NFC/CD dispersion, we can observe two marked absorption peaks, which are consistent with the characteristic absorption peaks of CDs. The blue-shift of the CDs’ peak might be attributed to the change in the local electrostatic field induced by a larger amount of negative charge of the carboxyl groups on the surface of the NFC.45
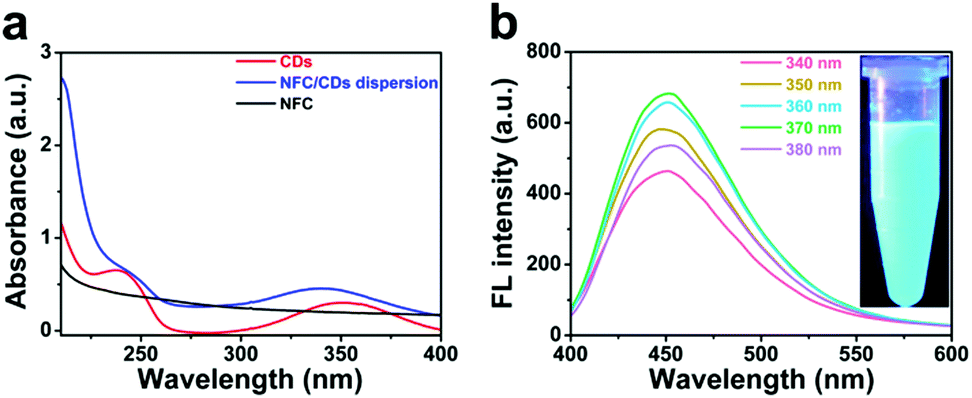 | ||
| Fig. 2 The fluorescence properties of the dispersion. (a) The UV-Vis absorption spectra of the CDs, NFC/CD dispersion, and NFC. (b) FL emission spectra of the NFC/CD dispersion at different excitation wavelengths from 340 to 380 nm. Inset: The fluorescence image of the NFC/CDs dispersion. | ||
We studied the fluorescence properties of the NFC/CD dispersion at gradually increasing excitation wavelengths. Upon excitation of the NFC/CD dispersion with an excitation wavelength below 400 nm, we observed strong blue photoluminescence centered at an emission wavelength of about 450 nm, which can be assigned to the n–π* transitions at the CDs’ edges (Fig. 2b).29 The NFC/CD dispersion shows bright blue emission under 360 nm UV light excitation on account of the typical excitation-dependent photoluminescence behavior of CDs on the surface of the NFC.18 The FL intensities of the NFC/CD dispersion at different excitation wavelengths from 410 to 480 nm are shown in Fig. S2 (ESI†). Similar to the results previously reported, the emission peak red-shifts from 460 to 525 nm with excitation wavelengths greater than 400 nm.35
In order to compare the fluorescence properties of NFC/CD paper and office paper fabricated with a fluorescent brightener, we captured fluorescence images of the NFC/CD paper and office paper under 360 nm UV light excitation (Fig. S3, ESI†). The NFC/CD paper shows brighter blue fluorescence than the office paper. We also evaluated the dimensional stability of the NFC/CD paper by measuring the stress–strain curve of the NFC/CD paper (Fig. S4, ESI†). The maximum tensile stress of the NFC/CD paper can be up to 82.89 MPa and the maximum strain is only 2.32%. The dimensional stability of the NFC/CD paper is superior to that of the office paper.46,47
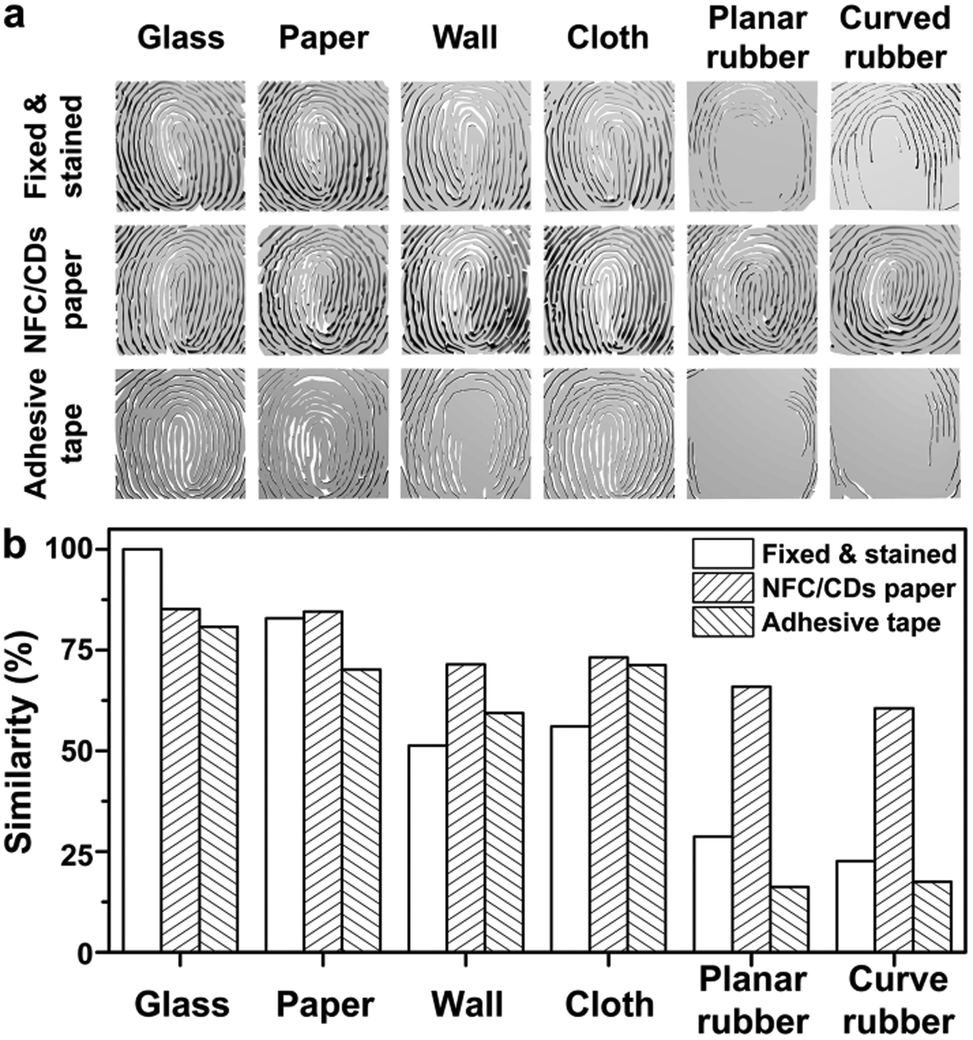
We tested the efficiency of fingerprint transfer using the NFC/CD paper compared with cyanoacrylate fuming and dusting with black powder methods, which are the common forensic fingerprint enhancement techniques to make LFPs visible at forensic scenes.3,4 After fixing with cyanoacrylate fumes and staining with super-paramagnetic iron oxide nanoparticles (SPIONs), we can observe clearly the majority of ridgelines on the glass, paper, wall, and cloth substrates, while the patterns of fingerprints are blurry on the rubber substrate (Fig. 3). Until now, few fingerprint transfer techniques have been developed that can be used on rough surfaces, which are defined as substrates with profiles ±100 μm. On rough surfaces, powder lacks selectivity adhering to LFPs and the substrate, causing low contrast and poor quality in imaging.48 To solve this problem, we chose the NFC/CD paper with remarkable fluorescence properties as the transfer medium to obtain transferred fingerprints from different substrates. After pretreatment, we successfully transferred the ridgelines of LFPs through the NFC/CD paper from different substrates, especially from a rubber substrate, which would provide useful evidence for individual identification (Fig. 3 and Fig. S5, ESI†). The excellent fluorescence properties of CDs at an excitation wavelength of 360 nm can provide fluorescence signals to enhance the contrast of fingerprint features and the background so that the detection sensitivity of fingerprints can be improved.
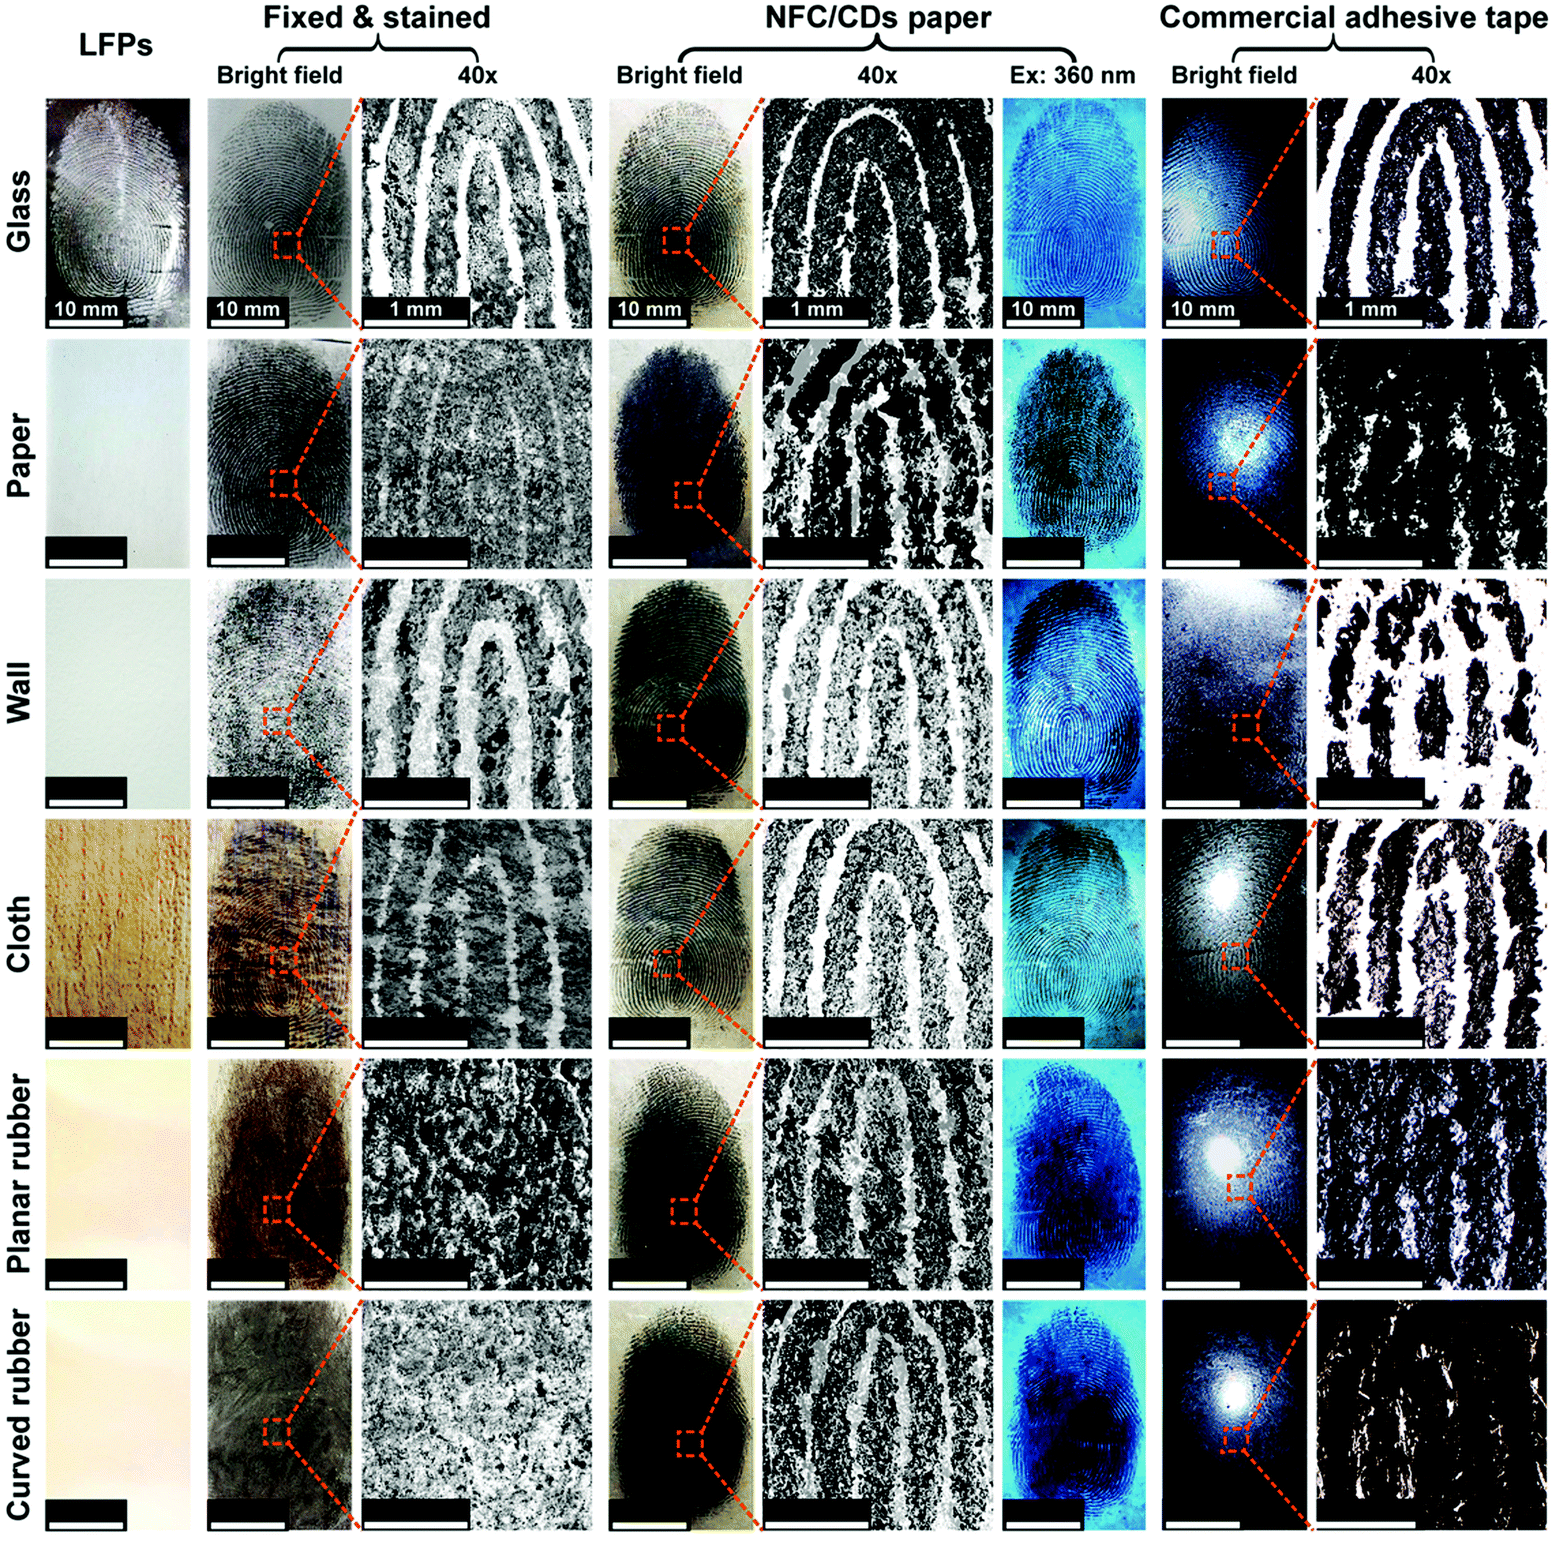 | ||
| Fig. 3 The images of fingerprints obtained from glass, paper, wall, cloth, planar rubber, and curved rubber substrates through three different methods: directly fixed with cyanoacrylate fumes and stained with SPIONs, the NFC/CD paper transfer method, and the tape-lift method. The first column shows LFP images. The second and third columns show fingerprint images obtained directly after fixing with cyanoacrylate fumes and staining with SPIONs. The fourth to sixth columns show fingerprint images transferred onto the NFC/CD paper. The seventh and eighth columns show fingerprint images transferred onto the tape-lift method (commercial adhesive tape). The scale bars in columns 1, 2, 4, 6, and 7 are 10 mm. The scale bars in columns 3, 5, and 8 are 1 mm. | ||
In order to meet the standards of the International Fingerprint Research Group (IFRG), which serve as guidelines for the assessment of fingerprint detection techniques, we transferred LFPs from paper substrates after different aging times, and detected them using our method, which suggested that our transfer method can transfer and detect successfully LFPs with a few residuals after 21 days aging time, and is of high sensitivity and high reliability in a practical application (Fig. S10a, ESI†). Subsequently, we also successfully transferred LFPs of different donors from paper substrates using the NFC/CD paper. We can observe clear images of transferred fingerprints under 360 nm UV light excitation, which indicates the feasibility of our transfer method (Fig. S10b, ESI†).
A mechanism for the fingerprint transfer and detection is illustrated in Scheme 2. LFP residues (principally eccrine sweat49,50 and sebaceous secretions4) can adhere to the NFC/CD paper through a capillary effect, a hydrophilic effect, and a non-specific adsorption effect.51–54 We fixed the transferred fingerprint by cyanoacrylate fuming after separating. The residues of the transferred fingerprint would react with cyanoacrylate to form polycyanoacrylate through anion polymerization.55 Cyanoacrylate fuming is good for post-staining, and effectively eliminates pseudo-information.56 To enhance a cyanoacrylate fumed fingerprint, we chose SPIONs to stain the cyanoacrylate fumed fingerprint. The adhesion of SPIONs to the cyanoacrylate fumed fingerprint is caused by the following: (1) electrostatic interaction (the zeta potentials of polycyanoacrylate and SPIONs are −1.99 mV and 4.36 mV (Table S1, ESI†)) and (2) a non-specific adsorption effect.
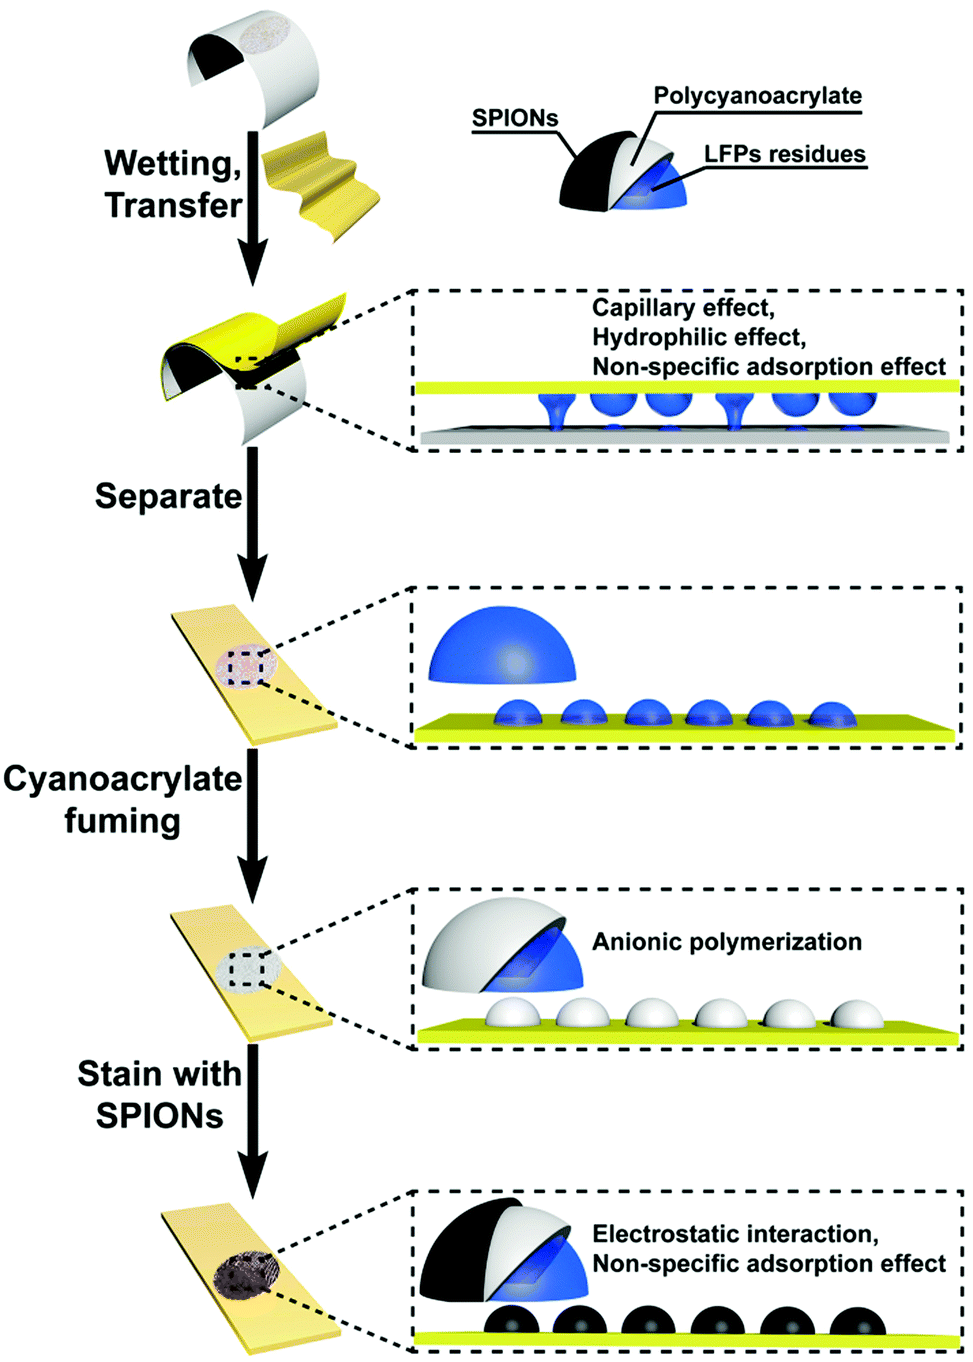 | ||
| Scheme 2 Schematic for the mechanism of fingerprint transfer and detection. | ||
We evaluated the sensitivity of the NFC/CD paper through the analysis of the transfer effect in sweat pores. The sweat pore, as a Level 3 feature, has the property of being random, which depends on the environment during the human developmental process, and can be very different between even identical twins.57 We can observe clearly a number of sweat pores at 40× magnification (Fig. S5 and S6, ESI†). The size distribution of sweat pores ranges from 34 to 42 μm, which is determined by counting the LFPs on the glass directly (Fig. S7, ESI†). The size distribution of sweat pores transferred onto the NFC/CD paper ranges from 21 to 46 μm (Fig. S5 and S6, ESI†). The real sizes of the sweat pores on the finger range from 46 to 57 μm (Fig. S8, ESI†). The shrinkage of a portion of pore sizes may be attributed to the fixed and stained processes in which the powder might fill into the sweat pores and affect the visible surface area of the pores. The pore size, which depends on the type of method applied to LFP enhancement, is not reproducible in different prints of the same finger and on the same surface.58 However, the distribution of sweat pores of transferred fingerprints is consistent with that of the real finger. Thus, we can realize the transfer of sweat pores from different substrates using the NFC/CD paper.
We converted the images of fingerprints into a three-dimensional (3D) model for comparison of feature points. The 3D model can effectively eliminate the interference of the background signal and enhance the contrast effect remarkably (Fig. 4a). The extraction of feature points is a significant part for fingerprint pattern matching.57 We used the fingerprint model which was obtained directly from a glass substrate after fixing with cyanoacrylate fumes and staining with SPIONs as control for the extraction and comparison of feature points.
 | ||
| Fig. 4 Numerical simulation of fingerprints obtained from glass, paper, wall, cloth, planar rubber, and curved rubber substrates through three different methods: directly fixed with cyanoacrylate fumes and stained with SPIONs, the NFC/CD paper transfer method, and the tape-lift method. (a) The 3D models established by 3D Max software. (b) The analysis of similarities between the fingerprint obtained directly from the glass substrate after fixing and staining and the fingerprints through the three different methods from the different substrates. | ||
In the process of fingerprint analysis, Level 2 features, such as endpoints, bifurcations, and eye structures, have sufficient discriminating power to establish the individuality of fingerprints.59 The endpoint is where a ridgeline ends. The bifurcation is where one ridgeline splits into two ridgelines. The eye structure is a closed, elliptical ridgeline.
From the transferred fingerprint model of the glass substrate (Fig. S9, ESI†), we successfully extracted the endpoint (point 2′), the bifurcations (points 3′, 4′, 5′, 6′, 8′, and 9′), and the eye structures (points 1′ and 7′). At the same time, we also collected similar feature points on the transferred fingerprint models of the rough surfaces: for example, the endpoint (point 2′), the bifurcations (points 3′, 4′, 5′, 6′, and 8′), and the eye structures (points 1′ and 7′) on the paper model; the endpoint (point 2′), the bifurcations (points 4′, 6′, and 8′), and the eye structures (points 1′ and 7′) on the wall model; the endpoint (point 2′), the bifurcations (points 3′, 4′, 6′, and 8′), and the eye structures (points 1′ and 7′) on the cloth model; the endpoint (point 2′), the bifurcations (points 3′, 4′, 6′, 8′, and 9′), and the eye structure (point 1′) on the planar rubber model; and the endpoint (point 2′), the bifurcations (points 3′, 4′, and 6′), and the eye structures (points 1′ and 7′) on the curved rubber model.
Compared with the transferred fingerprint method, the details of the planar rubber and curved rubber models obtained after fixing and staining have disappeared, and there are no obvious feature points matching the glass model obtained after fixing and staining, which is also in line with the results of the previous fingerprint images (Fig. 3). Even in the paper and cloth models obtained after fixing and staining, some feature points are also missing compared to the transferred fingerprint models of the paper and cloth substrates. Thus, the transfer method has great advantages in fingerprint detection on rough surfaces, and the feature points will be used as effective evidence for personal identification.15
Quantitative assessment of the similarity of fingerprints is a very important process in forensics. In general, it is difficult to obtain effective fingerprint information from a rubber substrate by the traditional methods.
We set up matrixes of fingerprints obtained through three different methods and calculated the similarity values between the fingerprint obtained from the glass substrate after fixing and staining and the other fingerprints by using the cosine theorem (Fig. 4b). The similarity values between the fingerprint obtained from the glass substrate after fixing and staining and the fingerprints transferred onto the NFC/CD paper from the glass and paper substrates reach up to 80%, and for those from the planar and curved rubber substrates they are also more than 60%. There are only 28.70% and 22.62% similarities between the fingerprint from the glass substrate and those from the planar and curved rubber substrates obtained directly after fixing with cyanoacrylate fumes and staining with SPIONs. Compared with the traditional fingerprint enhancement techniques, our method will be effective for high-efficiency fingerprint detection.
Transfer techniques that can detect LFPs, including the tape-lift method, the transfer gelatin film method, and the transfer paper method, have increasingly become useful for forensic investigation.60–62 In order to verify the practicability of the NFC/CD paper, we directly transferred LFPs by the tape-lift method (commercial adhesive tape), and compared the efficiencies of transfer between the tape-lift method and our method through the analysis of ridgelines, sweat pores, and feature points of the transferred fingerprints and by comparing the similarities between the fingerprint obtained directly from the glass substrate after fixing and staining and the transferred fingerprints from the different substrates (Fig. 3 and 4 and Fig. S5, S9, ESI†). For the glass, paper, and cloth substrates using the tape-lift method, we can observe clearly the major ridgelines of the fingerprint images transferred onto the commercial adhesive tape, but the major ridgelines of the fingerprint images transferred from the wall and planar and curved rubber substrates are difficult to distinguish (Fig. 3). At 40× magnification, the image quality of the fingerprint transferred onto the commercial adhesive tape from the paper substrate is lower than that transferred onto the NFC/CD paper, owing to the strong adhesivity of the commercial adhesive tape, which can also remove the fibers of the paper to reduce the image quality. The size distribution of sweat pores transferred onto the commercial adhesive tape ranges from 25 to 47 μm, which is consistent with that transferred onto the NFC/CD paper (Fig. S5, ESI†). For the 3D models using the tape-lift method (Fig. S9, ESI†), we extracted a lot of feature points (endpoint (point 2′), bifurcations (points 3′, 4′, 5′, 6′, and 8′), and eye structures (points 1′ and 7′)) from the glass and cloth substrates, some feature points (bifurcations (points 4′, 5′, and 8′) and eye structure (point 7′)) from the paper substrate, and almost none from the wall and planar and curved rubber substrates. By analyzing the similarity values between the transferred fingerprints and the fingerprint obtained from the glass substrate after fixing and staining, it is found that all similarities of the fingerprint images transferred onto the commercial adhesive tape are lower than the corresponding similarities of the fingerprint images transferred onto the NFC/CD paper (Fig. 4b). All similarities of the fingerprint images transferred onto the NFC/CD paper are more than 60%, but the similarities of the fingerprint images transferred onto the commercial adhesive tape from the planar and curved rubber substrates are less than 20%. All the above results show that the transfer effect of the NFC/CD paper is better than that of the commercial adhesive tape, and the NFC/CD paper is feasible, effective, and all-purpose.
Conclusions
In this study, we used a fluorescent NFC/CD paper for the transfer and detection of fingerprints. The NFC/CD paper can improve the contrast, sensitivity, and accuracy in the detection process due to its excellent photoluminescence performance. The details of the fingerprint pattern, such as ridgelines, sweat pores, and feature points, were retained successfully. We can transfer most of the feature points from rough surfaces onto the NFC/CD paper; in contrast, we cannot extract any feature point from a rubber substrate without transfer. The similarity between the fingerprint obtained from a glass substrate after fixing and staining and the transferred fingerprints from the rough surfaces is more than 60%, while there are only 28.70% and 22.62% similarities without transfer. The NFC/CD paper can realize the high-efficiency detection of LFPs without relying on the environment of substrates. Combined with the advantages of nanofibrillated cellulose-based paper (i.e., high mechanical strength, good flexibility, good optical properties, and good wettability), the NFC/CD paper with excellent fluorescence has great potential in the fields of image analysis, packaging, smartphones, entrance clearance, personal identification, and mobile payments.Conflicts of interest
There are no conflicts to declare.Acknowledgements
We thank the National Natural Science Foundation of China (21875050, 21535001, 81730051, 21761142006, 81671784, 21505027), the Chinese Academy of Sciences (QYZDJ-SSW-SLH039, 121D11KYSB20170026) and the National Key R&D Program of China (2017YFA0205901) for financial support.Notes and references
- R. Leggett, E. E. Lee-Smith, S. M. Jickells and D. A. Russell, Angew. Chem., Int. Ed., 2007, 46, 4100–4103 CrossRef CAS PubMed.
- P. Hazarika and D. A. Russell, Angew. Chem., Int. Ed., 2012, 51, 3524–3531 CrossRef CAS PubMed.
- E. H. Holder, L. O. Robinson and J. H. Laub, The Fingerprint Sourcebook, National Institute of Justice Journal, 2014 Search PubMed.
- H. C. Lee, R. E. Gaensslen and R. Ramotowski, Lee and Gaensslen's advances in fingerprint technology, CRC Press, 2012 Search PubMed.
- P. F. Kelly, R. S. King, S. M. Bleay and T. O. Daniel, Forensic Sci. Int., 2012, 217, e27–e30 CrossRef CAS PubMed.
- F. M. Kerr, A. D. Westland and F. Haque, Forensic Sci. Int., 1981, 18, 209–214 CrossRef CAS.
- International Fingerprint Research Group (IFRG), Journal of Forensic Identification, 2014, 64, 174–200.
- E. Sonnex, M. J. Almond and J. W. Bond, J. Forensic Sci., 2016, 61, 1100–1106 CrossRef CAS PubMed.
- A. Khuu, S. Chadwick, X. Spindler, R. Lam, S. Moret and C. Roux, Forensic Sci. Int., 2016, 263, 126–131 CrossRef CAS PubMed.
- R. S. King, P. M. Hallett and D. Foster, Forensic Sci. Int., 2016, 262, e28–e33 CrossRef CAS PubMed.
- W. Song, Z. Mao, X. Liu, Y. Lu, Z. Li, B. Zhao and L. Lu, Nanoscale, 2012, 4, 2333–2338 RSC.
- Z. Zhou and R. N. Zare, Anal. Chem., 2017, 89, 1369–1372 CrossRef CAS PubMed.
- J. Fraser, P. Deacon, S. Bleay and D. H. Bremner, Sci. Justice, 2014, 54, 133–140 CrossRef PubMed.
- L. Xu, Z. Zhou, C. Zhang, Y. He and B. Su, Chem. Commun., 2014, 50, 9097–9100 RSC.
- J. Tan, L. Xu, T. Li, B. Su and J. Wu, Angew. Chem., Int. Ed., 2014, 53, 9822–9826 CrossRef CAS PubMed.
- J. Wang, T. Wei, X. Li, B. Zhang, J. Wang, C. Huang and Q. Yuan, Angew. Chem., Int. Ed., 2014, 53, 1616–1620 CrossRef CAS PubMed.
- Q. Lou, S. Qu, P. Jing, W. Ji, D. Li, J. Cao, H. Zhang, L. Liu, J. Zhao and D. Shen, Adv. Mater., 2015, 27, 1389–1394 CrossRef CAS PubMed.
- B. P. Qi, L. Bao, Z. L. Zhang and D. W. Pang, ACS Appl. Mater. Interfaces, 2016, 8, 28372–28382 CrossRef CAS PubMed.
- S. N. Baker and G. A. Baker, Angew. Chem., Int. Ed., 2010, 49, 6726–6744 CrossRef CAS PubMed.
- J. Li, Y. Liu, R. Cha, B. Ran, K. Mou, H. Wang, Q. Xie, J. Sun and X. Jiang, RSC Adv., 2016, 6, 14329–14334 RSC.
- S. Zhu, Y. Song, J. Shao, X. Zhao and B. Yang, Angew. Chem., Int. Ed., 2015, 54, 14626–14637 CrossRef CAS PubMed.
- S. Zhu, Q. Meng, L. Wang, J. Zhang, Y. Song, H. Jin, K. Zhang, H. Sun, H. Wang and B. Yang, Angew. Chem., Int. Ed., 2013, 52, 3953–3957 CrossRef CAS PubMed.
- Y. Guo, Z. Wang, H. Shao and X. Jiang, Carbon, 2013, 52, 583–589 CrossRef CAS.
- Y. Zhang, L. Hu, Y. Sun, C. Zhu, R. Li, N. Liu, H. Huang, Y. Liu, C. Huang and Z. Kang, RSC Adv., 2016, 6, 59956–59960 RSC.
- M. Sudolská, M. Dubecký, S. Sarkar, C. J. Reckmeier, R. Zbořil, A. L. Rogach and M. Otyepka, J. Phys. Chem. C, 2015, 119, 13369–13373 CrossRef.
- J. Schneider, C. J. Reckmeier, Y. Xiong, M. von Seckendorff, A. S. Susha, P. Kasák and A. L. Rogach, J. Phys. Chem. C, 2017, 121, 2014–2022 CrossRef CAS.
- C. Jiang, H. Wu, X. Song, X. Ma, J. Wang and M. Tan, Talanta, 2014, 127, 68–74 CrossRef CAS PubMed.
- Q. Xiao, Y. Liang, F. Zhu, S. Lu and S. Huang, Microchim. Acta, 2017, 184, 2429–2438 CrossRef CAS.
- Q. Fang, Y. Dong, Y. Chen, C. H. Lu, Y. Chi, H. H. Yang and T. Yu, Carbon, 2017, 118, 319–326 CrossRef CAS.
- M. L. Liu, L. Yang, R. S. Li, B. B. Chen, H. Liu and C. Z. Huang, Green Chem., 2017, 19, 3611–3617 RSC.
- Z. X. Liu, B. B. Chen, M. L. Liu, H. Y. Zou and C. Z. Huang, Green Chem., 2017, 19, 1494–1498 RSC.
- S. Lu, G. Xiao, L. Sui, T. Feng, X. Yong, S. Zhu, B. Li, Z. Liu, B. Zou, M. Jin, J. S. Tse, H. Yan and B. Yang, Angew. Chem., Int. Ed., 2017, 56, 6187–6191 CrossRef CAS PubMed.
- L. Pan, S. Sun, A. Zhang, K. Jiang, L. Zhang, C. Dong, Q. Huang, A. Wu and H. Lin, Adv. Mater., 2015, 27, 7782–7787 CrossRef CAS PubMed.
- S. Tao, S. Lu, Y. Geng, S. Zhu, R. Sat, Y. Song, T. Feng, W. Xu and B. Yang, Angew. Chem., Int. Ed., 2018, 57, 2393–2398 CrossRef CAS PubMed.
- L. Cheng, Y. Li, X. Zhai, B. Xu, Z. Cao and W. Liu, ACS Appl. Mater. Interfaces, 2014, 6, 20487–20497 CrossRef CAS PubMed.
- R. Yang and J. Lian, Forensic Sci. Int., 2014, 242, 123–126 CrossRef CAS PubMed.
- L. Dai, Z. Long, Y. Zhao, B. Wang and J. Chen, Cellulose, 2016, 23, 2989–2999 CrossRef CAS.
- L. Dai, Z. Long, X. H. Ren, H. B. Deng, H. He and W. Liu, J. Appl. Polym. Sci., 2014, 131, 547–557 Search PubMed.
- N. M. L. Hansen, T. O. J. Blomfeldt, M. S. Hedenqvist and D. V. Plackett, Cellulose, 2012, 19, 2015–2031 CrossRef CAS.
- C. D. Simao, J. S. Reparaz, M. R. Wagner, B. Graczykowski, M. Kreuzer, Y. B. Ruiz-Blanco, Y. Garcia, J. M. Malho, A. R. Goni, J. Ahopelto and C. M. Sotomayor Torres, Carbohydr. Polym., 2015, 126, 40–46 CrossRef CAS PubMed.
- K. Mou, J. Li, Y. Wang, R. Cha and X. Jiang, J. Mater. Chem. B, 2017, 5, 7876–7884 RSC.
- L. Dai, Z. Long, J. Chen, X. An, D. Cheng, A. Khan and Y. Ni, ACS Appl. Mater. Interfaces, 2017, 9, 5477–5485 CrossRef CAS PubMed.
- Q. Lu, W. Lin, L. Tang, S. Wang, X. Chen and B. Huang, J. Mater. Sci., 2015, 50, 611–619 CrossRef CAS.
- S. Wang, J. Sun, Y. Jia, L. Yang, N. Wang, Y. Xianyu, W. Chen, X. Li, R. Cha and X. Jiang, Biomacromolecules, 2016, 17, 2472–2478 CrossRef CAS PubMed.
- W. Wang, G. K. Liu, H. S. Cho, Y. Guo, D. Shi, J. Lian and R. C. Ewing, Chem. Phys. Lett., 2009, 469, 149–152 CrossRef CAS.
- C. Zhang, R. Cha, L. Yang, K. Mou and X. Jiang, Carbohydr. Polym., 2018, 184, 30–36 CrossRef CAS PubMed.
- C. Aulin, G. Salazar-Alvarez and T. Lindstrom, Nanoscale, 2012, 4, 6622–6628 RSC.
- B. J. Jones, R. Downham and V. G. Sears, Surf. Interface Anal., 2010, 42, 438–442 CrossRef CAS.
- R. S. Croxton, M. G. Baron, D. Butler, T. Kent and V. G. Sears, Forensic Sci. Int., 2010, 199, 93–102 CrossRef CAS PubMed.
- S. Cadd, M. Islam, P. Manson and S. Bleay, Sci. Justice, 2015, 55, 219–238 CrossRef PubMed.
- Y. Zhang, T. Ren and J. He, ACS Appl. Mater. Interfaces, 2018, 10, 11343–11349 CrossRef CAS PubMed.
- D. M. Cate, J. A. Adkins, J. Mettakoonpitak and C. S. Henry, Anal. Chem., 2015, 87, 19–41 CrossRef CAS PubMed.
- K. Yamada, T. G. Henares, K. Suzuki and D. Citterio, Angew. Chem., Int. Ed., 2015, 54, 5294–5310 CrossRef CAS PubMed.
- J. R. Choi, R. Tang, S. Wang, W. A. Wan Abas, B. Pingguan-Murphy and F. Xu, Biosens. Bioelectron., 2015, 74, 427–439 CrossRef CAS PubMed.
- G. S. Bumbrah, Egypt. J. Forensic Sci., 2017, 7, 4 CrossRef PubMed.
- C. Nixon, M. J. Almond, J. V. Baum and J. W. Bond, J. Forensic Sci., 2013, 58, 508–512 CrossRef CAS PubMed.
- Q. Zhao, D. Zhang, L. Zhang and N. Luo, Pattern Recogn., 2010, 43, 1050–1061 CrossRef.
- A. R. Roddy and J. D. Stosz, Proc. IEEE, 1997, 85, 1390–1421 CrossRef.
- A. K. Jain, Y. Chen and M. Demirkus, IEEE Trans. Pattern Anal., 2007, 29, 15–27 Search PubMed.
- M. J. West and M. J. Went, Forensic Sci. Int., 2008, 174, 1–5 CrossRef CAS PubMed.
- D. T. Plaza, J. L. Mealy, J. N. Lane, M. N. Parsons, A. S. Bathrick and D. P. Slack, J. Forensic Sci., 2016, 61, 485–488 CrossRef CAS PubMed.
- J. Kopka, M. Leder, S. M. Jaureguiberry, G. Brem and G. O. Boselli, J. Forensic Sci., 2011, 56, 1235–1240 CrossRef CAS PubMed.
Footnotes |
| † Electronic supplementary information (ESI) available: Experimental procedures and characterization data. See DOI: 10.1039/c8nh00494c |
| ‡ These authors contributed equally to this article. |
| This journal is © The Royal Society of Chemistry 2019 |