
NIR light-activated upconversion semiconductor photocatalysts
Qingyong
Tian†
ab,
Weijing
Yao†
a,
Wei
Wu
 *ac and
Changzhong
Jiang
a
*ac and
Changzhong
Jiang
a
aSchool of Printing and Packaging and School of Physics and Technology, Wuhan University, Wuhan 430072, P. R. China. E-mail: weiwu@whu.edu.cn; Fax: +86-27-68778433; Tel: +86-27-68778529
bCollege of Materials Science & Engineering, Zhengzhou University, Zhengzhou 450052, P. R. China
cSuzhou Research Institute of Wuhan University, Suzhou 215000, P. R. China
First published on 13th August 2018
Abstract
Harvesting of near infrared (NIR) light in the abundant and environmentally friendly solar spectrum is particularly significant to enhance the utilization rate of the cleanest energy on earth. Appreciating the unique nonlinear optical properties of upconversion materials for converting low-energy incident light into high-energy radiation, they become the most promising candidates for fabricating NIR light-active photocatalytic systems by integrating with semiconductors. The present review summarizes recent NIR light-active photocatalytic systems based on a sequence of NaYF4-based, fluoride-based, oxide-based and Ln3+ ion-doped semiconductor-based photocatalysts for degradation of organic molecules. In addition, we provide an in-depth analysis of various photocatalytic mechanisms and enhancement effects for efficient photo-redox performance of different upconversion semiconductor photocatalysts. We envision that this review can inspire multidisciplinary research interest in rational design and fabrication of efficient full-spectrum active (UV-visible-NIR) photocatalytic systems and their wider applications in solar energy conversion.
 Qingyong Tian | Qingyong Tian received his BS degree at Hubei University in 2013. He is currently pursuing a PhD degree under the supervision of Prof. Changzhong Jiang and Prof. Wei Wu in the School of Physics and Technology at Wuhan University. His research focuses on the design and synthesis of multifunctional nanostructured materials for applications in photocatalysts and advanced energy devices. |
 Weijing Yao | Weijing Yao received her BS in 2015 from Inner Mongolia Agricultural University. She is currently pursuing a PhD degree under the supervision of Prof. Wei Wu in the School of Printing and Packaging at Wuhan University. Her research involves the design and synthesis of upconversion materials for anti-counterfeiting applications. |
 Wei Wu | Wei Wu received his PhD in 2011 from the Department of Physics, Wuhan University, China. He then joined the group of Prof. Daiwen Pang at Wuhan University (2011) and Prof. V. A. L. Roy at City University of Hong Kong (2014) as a postdoctoral fellow. Now he is a full professor and Director of Laboratory of Printable Functional Nanomaterials and Printed Electronics, School of Printing and Packaging, Wuhan University. He has published over 80 papers, which have received over 3000 citations. He is also the topical editor of Frontiers in Materials. His research interests include the synthesis and application of functional nanomaterials, printed electronics and intelligent packaging. |
 Changzhong Jiang | Chang Zhong Jiang received his BS in 1983 from Huazhong University of Science and Technology and MS in 1990 from Wuhan University. He obtained his PhD in 1999 from Université Claude Bernard Lyon 1, France. He has been a full professor in the Department of Physics, Wuhan University since 2001, and he is also the Director of Center for Ion Beam Application, Wuhan University. He has published, as an author and co-author, more than 100 publications in various reputed international journals, such as Physical Review Letters, Nano Letters, ACS Nano, and Advanced Materials. His research interests include the synthesis and application of low-dimension nanomaterials, magnetic materials and ion beam modification of materials. |
1. Introduction
Currently, steadily worsening environmental pollution is an overwhelming global crisis that threatens the health of human beings and sustainable development of natural ecosystems. To solve these urgent issues, the exploitation of green and environmentally friendly technologies for alternative energy conversion and environmental remediation is proven to be an imperative requirement.1 Among the various approaches, photocatalysis is valuable for environmental protection and remediation of contaminants as it can efficiency utilize the solar spectrum or artificial light sources, and thus lead to virtually unlimited energy source all over the world.2–5 Especially, semiconductor-based photocatalysts such as TiO2, ZnO, SnO2, etc., have been widely applied in photodegradation and photo-oxidization of hazardous organic molecules.6–9 The initial explanation of n-type TiO2 electrode in 1972 by Fujishima and Honda (Honda–Fujishima effect) was a significant milestone for semiconductor photocatalysis.10 And the first description of TiO2 suspension for the photodegradation of polychlorinated biphenyl and cyanide by Cary and Bard in 1980 opened a new gate for TiO2-based semiconductors for the elimination of environmental pollution.11,12 TiO2 possesses the advantages of cost-effectiveness and pollution-free and sustainable development and has been widely investigated in recent decades. However, the wide bandgap of TiO2 (>3.0 eV) has been a major limitation for efficient utilization of solar photons.13–15 The light absorption threshold is confined in the ultraviolet (UV) region (300–400 nm), which only accounts for 5% of the full spectrum. Therefore, the losses in solar conversion efficiency have resulted in under-utilization of visible (43%, 400–700 nm) and NIR light (52%, 700–2500 nm). Narrow bandgap semiconductors, such as CdS, Fe2O3, g-C3N4, etc., could broaden the absorption threshold to the visible region and demonstrate efficient photocatalytic performance.16,17 NIR-light-active semiconductors with narrower bandgap could further absorb NIR light, while the lower-lying conduction band (CB) and higher-lying valence band (VB) present fairly inert photodecomposition or photo-oxidization abilities to organic dyes. Carbon quantum dots (CQDs) with both up- and down-converted photoluminescence (PL) and photoinduced electron transfer ability could give rise to intense absorption of NIR light.18,19 The surface plasmon resonance (SPR) peaks of noble-metal plasmonic nanoparticles can be red-shifted to the NIR region by rational adjustment of sizes, morphologies and alloying compositions.20,21 Their tunable optical characteristics make CQDs and noble-metal plasmonic nanoparticles alternative co-catalysts to harvest NIR photons and enhance the NIR-induced photocatalytic performance. However, the inherent photocorrosion susceptibility and high processing cost make them far from practical propositions. Therefore, much effort should be made to introduce NIR light into semiconductor-based photocatalyst systems.22,23One increasingly appealing and practical approach is coupling photocatalytic semiconductors with nonlinear optical materials that could utilize the abundant NIR light in photocatalysis, to improve the utilization of solar energy, and finally enhance the photoreactions.24,25 Of especial note are the anti-Stokes luminescence mechanism-based upconversion materials, with the unique property to sequentially absorb two or multiple low-energy photons and radiate out specific types of photons with shorter wavelength, which are considered as potentially efficient candidates for exploitation of NIR excitation. Lanthanide ion (Ln3+)-doped upconversion materials with abundant f-orbital configurations have narrow fluorescence emission bands via intra-4f (4fn–4fn) or 4f–5d (4fn–4fn−15d) orbital transitions.26,27 The involved symmetries of inner electronic quantum states would yield metastable energy levels with long lifetimes that favor the incidence of successive populations in the energized states of Ln3+ ions. Under NIR laser irradiation, the pump photons in the ground state of sensitizer ions will be sequentially excited to the excited states of activator ions. Then, the population will relax non-radiatively or radiatively to the ground state of activator ions to achieve the upconversion emissions. The perfect shielding effect of outer 5s and 5p shells of Ln3+ prevents the influence of surrounding environment on electronic transitions, resulting in perfect physical and chemical stability against photobleaching and photochemical degradation. Doping with different Ln3+ ions in an inorganic substrate will induce designable upconversion emissions, from the UV, passing through the entire visible and extending to the NIR region under irradiation.28–30Fig. 1 presents the occupation of Ln3+ ion-doped upconversion materials with large absorption cross section for converting the NIR light in the solar spectrum into visible light. The main adsorption centers of the Ln3+ ions, i.e., Nd3+, Yb3+, Ho3+ and Er3+, are located at 808 (Nd3+: 4I9/2–4F5/2), 980 (Yb3+: 2F7/2–2F5/2), 1160 (Ho3+: 5I8–5I6) and 1530 (Er3+: 4I15/2–4I13/2) nm, respectively.31 These ions will act as sensitizers that absorb the centered NIR photons and emit UV or visible photons through multiple photon absorption or energy transfer processes. For instance, tunable emissions varying from blue to red colors can be realized by fine-tuning the concentration of sensitizer Yb3+ ions and changing the doped activator Tm3+ and Er3+ ions.32 The spectral power from the normalized air mass (AM) 1.5 spectrum yield is nearly 25 W m−2 ranging from 1480 to 1580 nm when Er3+ acts as the activator.33 It will be extremely attractive to combine upconversion materials as frequency conversion elements with UV- or visible-active semiconductor photocatalysts to further harvest solar energy in a broader spectral range, and thus promoting the utilization of solar energy efficiently.
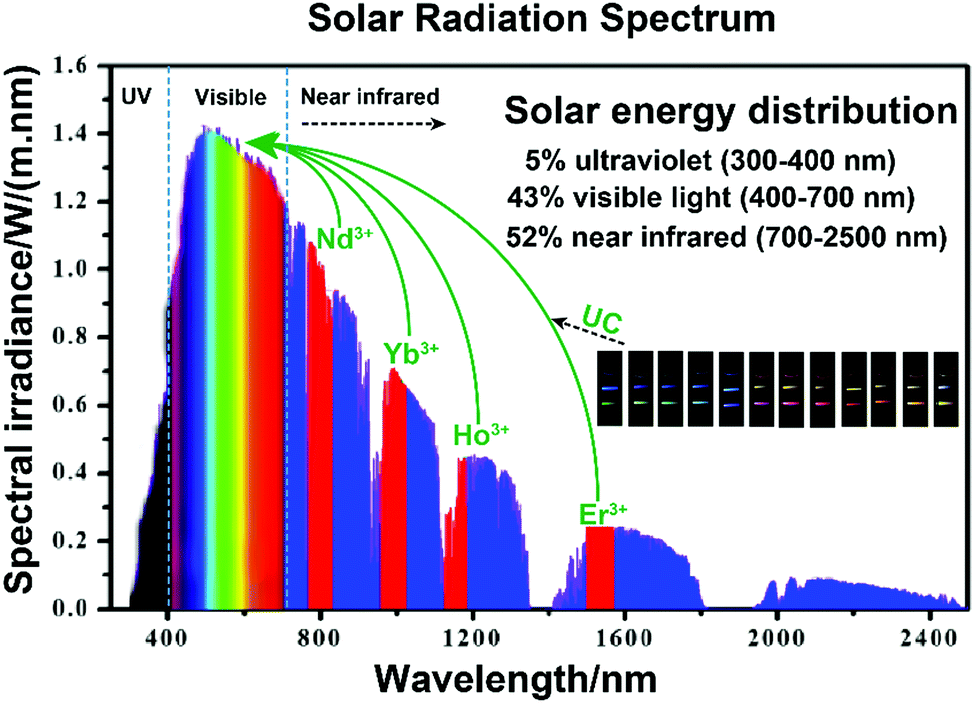 | ||
| Fig. 1 The schematic conversion processing of NIR light into visible light via Ln3+ ions, referring to standard AM 1.5 solar radiation spectrum, and the tunable emissions of upconversion materials. | ||
2. The Ln3+ ion-doped upconversion mechanism
The upconversion emissions are based on the transition of 4f electronic configurations between rare earth (RE) ions (Sc, Y and La are technically d-shield elements).34 Each kind of RE ion has its definite energy level positions, and the upconversion processes between different RE ions are different from each other, while all of them represent similar property of chemical elements attributed to the dominant trivalent oxidation state. The characteristic energy level positions of different Ln3+ ions are illustrated in Fig. 2, which was well defined by experimental measurement by Dieke (Dieke diagram) and Carnall et al.31,35 The energy level positions give detailed illustration of absorption and excitation spectra of Ln3+ ion-doped upconversion materials with distinguishable spectroscopic fingerprints. The upconversion process has been recognized to be grouped into three stages: excited state absorption (ESA), energy transfer (ET), and phonon avalanche (PA).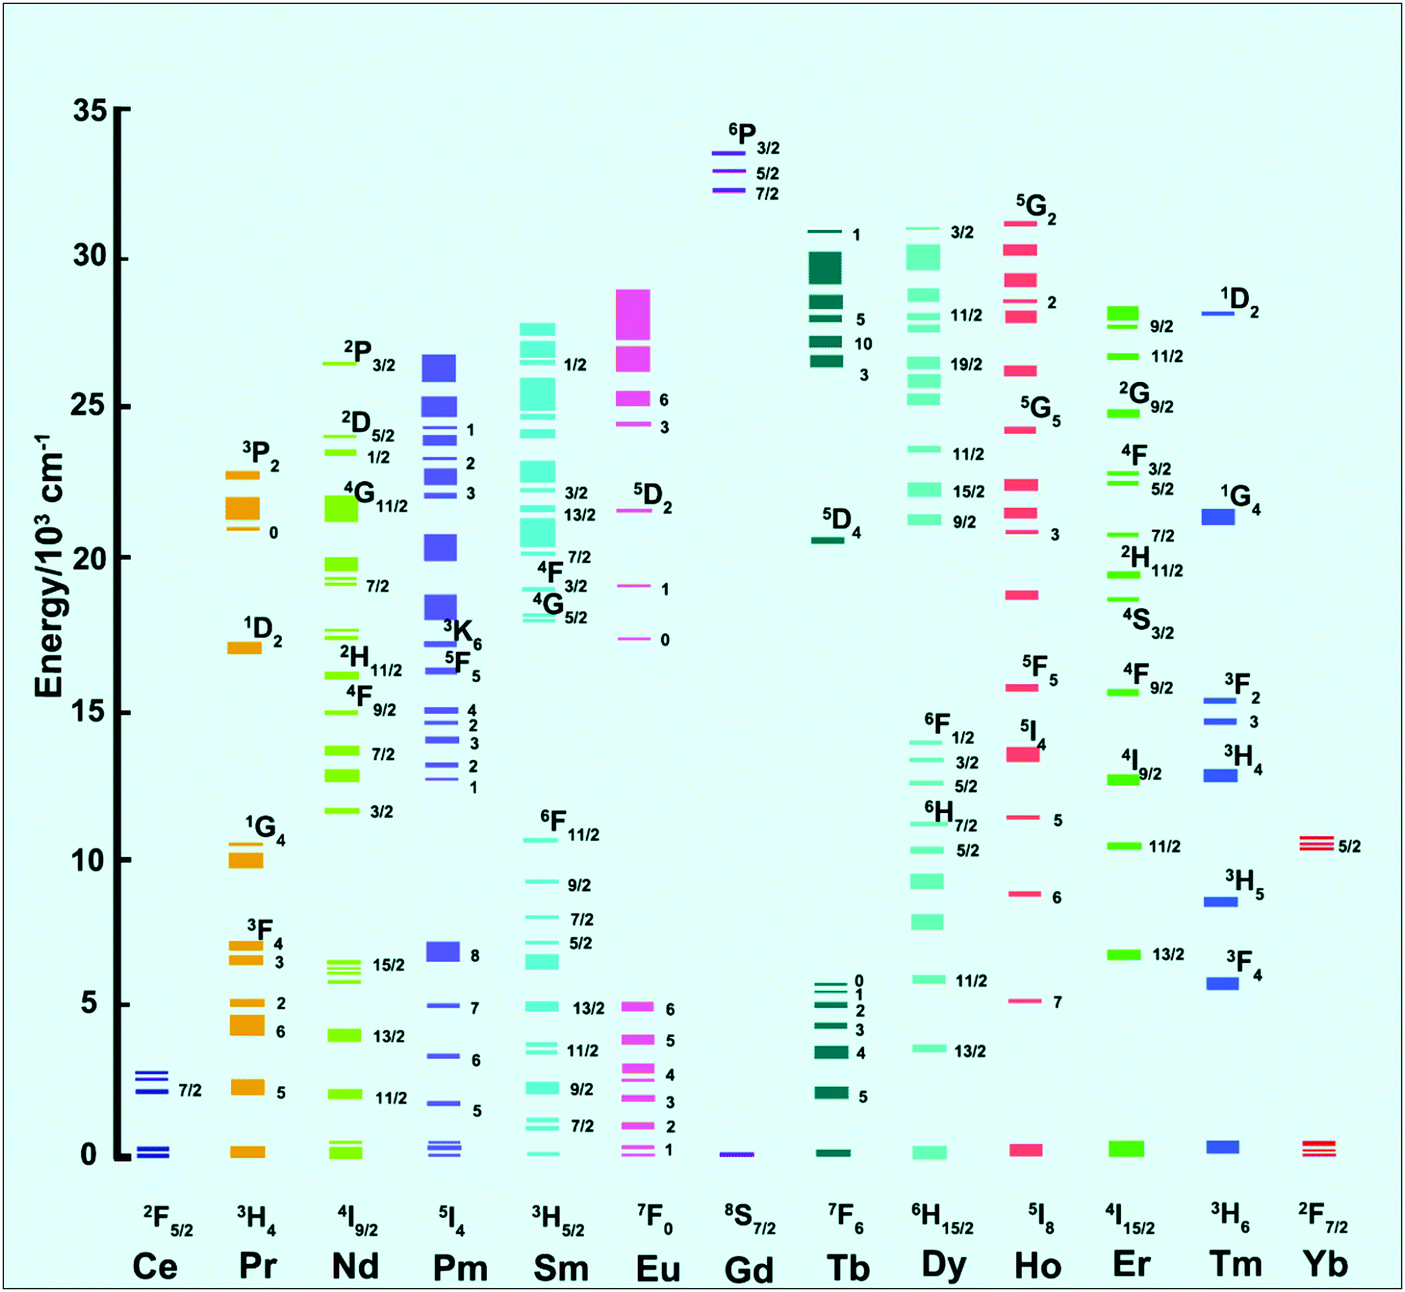 | ||
| Fig. 2 Characteristic energy level positions of a sequence of Ln3+ ions. | ||
2.1 Excited state absorption (ESA)
ESA is the basic process of upconversion luminescence first proposed by Bloembergen et al. in 1959.36 The mechanism is that one type of Ln3+ ion is excited from the ground state (GS) to an excited state with high energy level through sequential two- or multiphoton absorption. Typically, as illustrated in Fig. 3a, the Ln3+ ion absorbed one photon hv1 and is promoted from GS to intermediate metastable (electronic) state (E1). Because of the long relaxation time of metastable energy level, the excited ions will stay or decay between the intra-band for a long time. And then, if another energy-matched photon matches the energy interval between E1 and upper excited state E2, the ions at state E1 will absorb the photon energy and populate the state E2, achieving successive absorption of two photons. Three or more multiphoton absorption processes will be deduced by analogy. Finally, the excited ions relax non-radiatively or radiatively to the GS, inducing the upconversion emissions. Additionally, supposing the incident photons are sequentially trapped by individual Ln3+ ions, then the upconversion efficiency of the ESA process is independent of the Ln3+ doping concentration. The usual doping concentration of Ln3+ ions is less than 1%.37 Under continuous excitation, the intensity of upconversion luminescence (Iuc) is proportional to excitation power (Iex):| Iem ∝ (Iex)n | (1) |
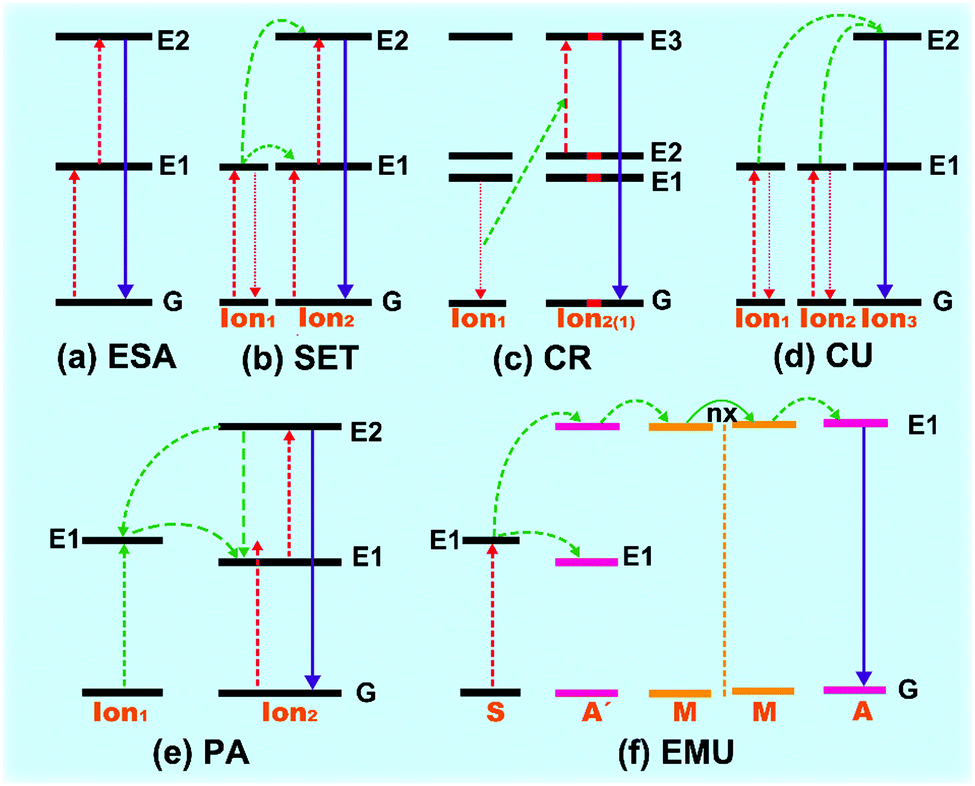 | ||
| Fig. 3 Principal diagram for the upconversion processes of Ln3+-doped crystals. (a) ESA, (b) SET, (c) CR, (d) CU, (e) PA and (f) EMU. The red, green, and purple lines stand for photon excitation, energy transfer, and emission processes, respectively. | ||
2.2 Energy transfer upconversion (ETU)
The ETU process generally occurs between two types of ions (donor and acceptor) in close proximity via dipole–dipole interaction. High concentration of dopants is required in ETU process-dominated upconversion materials, as the dopant content determines the distance between the proximal ions. ETU can be classified into three categories based on diverse energy transfer types: successive energy transfer (SET), cross relaxation (CR) and cooperative upconversion (CU).2.3 Phonon avalanche (PA)
The PA process was proposed firstly from an investigation of the upconversion spectrum of Pr3+-doped lanthanum chloride (LaCl3) host by Chivian.38 The PA process is an unconventional looping process of ESA and CR, which contains four procedures of energy transfer (Fig. 3e). (I) The Ion2 initially emerges to the intermediate level (E1) by GS energy transition. (II) This is followed by energy transfer by ESA or ETU process to populate the higher excited energy level (E2) where the upconversion luminescence occurred. And then (III) a CR process occurred among activated Ion2 and proximal ground-state Ion1, causing two populations in the metastable state E1. (IV) Finally, the looping process readily populates and exponentially increases the population of excited state E2 through ESA process, invoking intense upconversion radiation like an avalanche process. The PA process is highly dependent on the pump intensity, which should be higher than the threshold value of metastable energy level.39In addition, with the rapid development of core–shell nanostructured upconversion materials, a new energy migration-mediated upconversion (EMU) mechanism was proposed recently (Fig. 3f).40,41 This involves successive energy transfer from the sensitizers (S) to accumulators (A′) and migrators (M), and trapped by activators (A), finally inducing the upconversion process.
3. The Ln3+ ion-doped upconversion materials
The upconversion efficiency of Ln3+ ion-doped materials is reliant on the crystal structures, local site symmetry, crystal field strength, and phonon energy of the host matrixes. It will be a key factor to choose appropriate host matrixes to achieve favorable optical performance of upconversion materials with high upconversion luminescence efficiency. Currently, the majority of upconversion materials are doped with Ln3+ ions into appropriate dielectric host matrix. The doped Ln3+ ions are randomly distributed in the cation sites, which are offered by the ordered array of host matrixes.42 The host matrixes generally do not constitute the exciting energy levels but will provide suitable crystal field for the doped Ln3+ ions that enables corresponding emissions. Host matrixes with low phonon energy are preferred for effective upconversion luminescence, because multi-phonon supported non-radiative relaxations between the nearest spaced energy levels can be minimized, thus greatly prolonging the lifetime of intermediate levels. The non-radiative relaxation probability (Wp) induced by multi-phonon relaxation is expressed as:43,44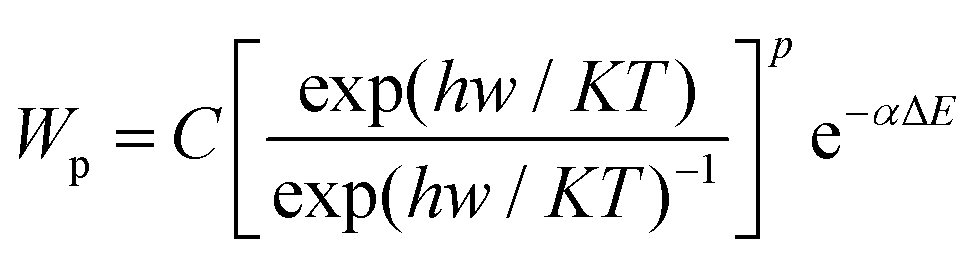 | (2) |
| Host matrix | Phonon energy (cm−1) | Host matrix | Phonon energy (cm−1) |
|---|---|---|---|
| Fluorides | ∼355 | Silicates | ∼1000 |
| Chlorides | ∼260 | Borates | ∼1100 |
| Iodides | ∼144 | Phosphates | ∼1300 |
| Bromides | ∼172 | Bismuthates | ∼1192 |
| Oxides | ∼600 |
In the following section, the effectiveness of commonly investigated upconversion materials with different host matrixes that are applied in the field of photocatalysis, including a sequence of NaYF4-based, fluoride-based, oxide-based and Ln3+ ion-doped semiconductor-based photocatalysts, is discussed in detail.
4. The upconversion semiconductor-based photocatalysts
4.1 The mechanism of upconversion semiconductor-based photocatalysts
The proposed photocatalytic mechanism of semiconductor-based upconversion photocatalysts is illustrated in Fig. 4. The upconversion materials serve as the frequency conversion element and harvest two or multiple NIR light photons and then convert them into UV or visible light photons via an efficient fluorescent resonance energy transfer (FRET) process. Subsequently, the converted photons can be re-absorbed by the surrounding semiconductors and inject the electrons from VB to CB of semiconductors, thereby increasing the yield of photoinduced carriers. The direct energy migration between the combination of UC materials and semiconductors under NIR light irradiation could extend the utilization of the solar spectrum and promote the photocatalytic efficiency.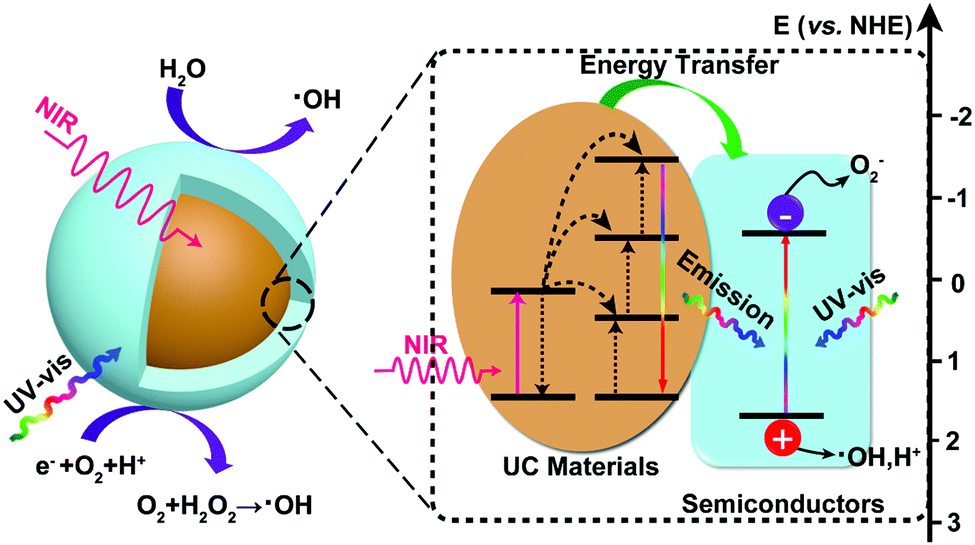 | ||
| Fig. 4 The proposed photocatalytic enhancement mechanism for semiconductor-based upconversion photocatalysts. | ||
4.2 The NaYF4-based upconversion photocatalysts
RE ion-doped sodium fluoride matrix contains two different types of crystal phases, including cubic and hexagonal phases (Fig. 5a and b). In the cubic phase, the host F− ions form a high-symmetry cubic crystal structure, with Na+ and RE3+ ions randomly occupying the cation sites. Comparatively, the Na+ and RE3+ ions are selectively occupying the two types of relatively low-symmetry cation sites that are contained in regular crystal sublattices of F− ions in hexagonal NaYF4.42 Generally, host crystal lattices with low site symmetry of doping lanthanoids are preferable for upconversion luminescence over their higher symmetry counterparts, because low-symmetry lattices ordinarily have a crystal field with lots of uneven components surrounding the doping ions. The uneven components strengthen the electronic coupling among 4f electronic orbits and their higher electronic configuration and subsequently promote 4f–4f transition possibilities of the doping ions.48 The density functional theory (DFT)-calculated charge densities for cubic and hexagonal NaREF4 crystals are presented in Fig. 5c and d. In the hexagonal phase, the Ln3+ dopants increase the asymmetry distribution and improve the charge transfer, resulting in an enhancement of polarizability and formation energy. Therefore, hexagonal phase NaREF4 nanocrystals exhibited an order of magnitude augmentation in upconversion efficiency when compared with cubic phase.49 Especially, the hexagonal phase NaYF4, having the advantages of wide energy bandgap (∼8 eV)50 and a very low phonon energy (∼360 cm−1 ≈ 45 meV),51,52 has been considered as one of the most efficient upconversion host matrixes for decades. And most photocatalysts have been combined with hexagonal phase NaYF4 to achieve efficient NIR-active photocatalytic systems.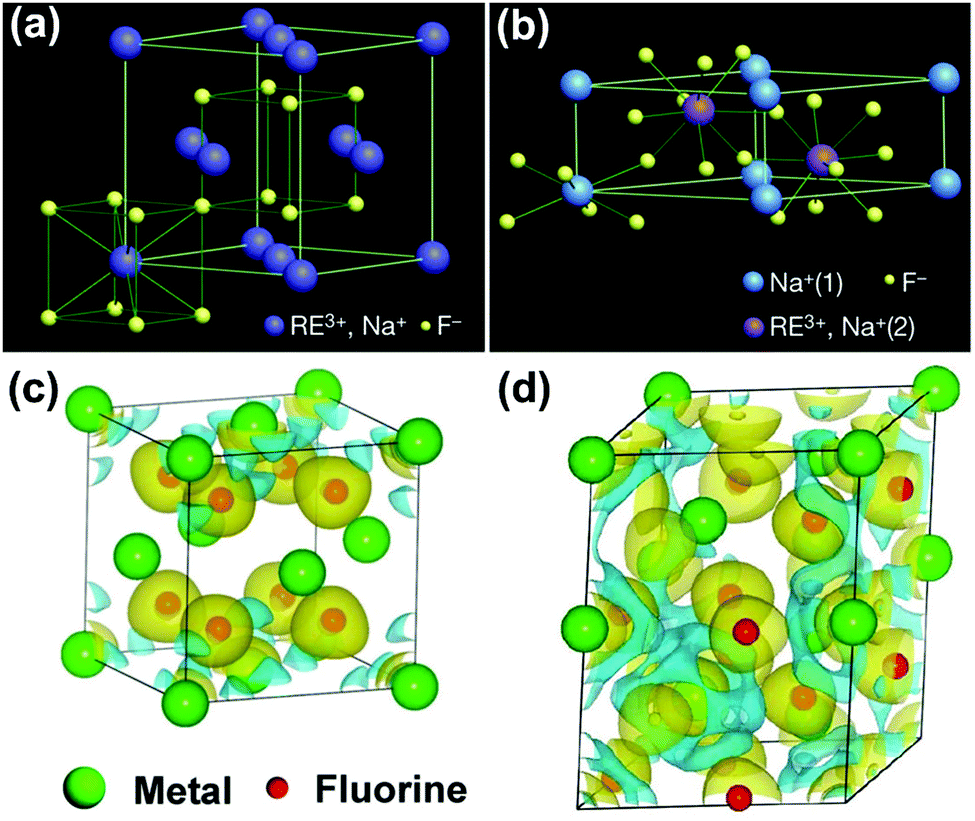 | ||
| Fig. 5 (a) Cubic and (b) hexagonal type crystal phases of Ln3+-doped NaYF4 and DFT-calculated charge density for (c) cubic and (d) hexagonal NaYF4. (Reproduced with permission.42 Copyright 2010, Springer Nature.) | ||
The photodegradation performance of NaYF4-based semiconductor photocatalysts is presented in Table 2. As mentioned above, TiO2 attracts extensive interest as a photocatalyst because the numerous advantages like abundance, chemical stability, environmental friendliness, and high photocatalytic activities. Incorporating upconversion materials with TiO2 will extend the absorption edge up to the NIR region and finally achieve higher photocatalytic efficiency.53–57 For example, core–shell NaYF4:Yb,Tm@TiO2 nanoparticles show excellent activities under both UV and NIR irradiation for photodegradation of RhB dyes.55 And the photocatalytic activities of NaYF4:Yb,Tm@TiO2 nanoparticles vary with the sizes of the NaYF4 core (Fig. 6a–d), the optimum core size being about 50 nm, which is beneficial to the photocatalytic performance of the TiO2 shell. In addition, the size-dependent upconversion mechanism of NaYF4:Yb3+,Er3+ nanoparticles has been experimentally and theoretically demonstrated, confirming the competition process between the upconversion population and non-radiative relaxation.58 Another group further synthesized shell thickness-controllable NaYF4@TiO2 core–shell composites by varying the ratio of Yb3+,Tm3+ co-doped NaYF4 microrods and Ti precursors (Fig. 6e–h), proving that optimum shell thickness is beneficial to the photocatalytic performance.57 As displayed in Fig. 6i, when a thin TiO2 shell is coated, only a small part of the UV radiation would be captured by the TiO2 layer and most of it will be scattered and wasted. On the contrary, a thick TiO2 shell will greatly inhibit the upconverted emissions penetrating to the external surface and largely increase the recombination possibilities of photogenerated carriers, which is also detrimental to photocatalytic performance. Furthermore, other upconversion material–semiconductor composite photocatalytic systems are rationally designed. For example, NaYF4:Yb/Tm–BiOCl,59 NaYF4:Yb/Er–MoS2,60 NaYF4:Yb/Tm–g-C3N4,61,62 NaYF4:Yb/Tm–CdS,63,64 NaYF4:Yb/Er–CdSe,65 NaYF4:Yb/Tm–ZnO,66,67 and NaYF4:Yb/Tm-MOFs68 have been designed and constructed as NIR-responsive photocatalysts. Ternary heterogeneous materials are also developed and applied as highly efficient UV-visible-NIR full-spectra active photocatalysts.69,70
| Photocatalyst (mg) | Light source | Pollutanta (concentration, mg L−1/volume, mL) | Degradation ratio/time (h) | Ref. |
|---|---|---|---|---|
| a MB represents methylene blue; RhB represents Rhodamine B; MO represents methyl orange; R6G represents Rhodamine 6G. | ||||
| NaYF4:Yb/Tm@TiO2 (0.5) | 980 nm laser (10 W cm−2) | MB (15/0.5) | 65%/14 | 53 |
| NaYF4:Yb/Tm@TiO2 (20) | 980 nm laser (0.5 A) | RhB (10−5 M/10) | 22%/1 (83%/6) | 54 |
| ARC lamp (69920) | Phenol (10−5 M/50) | 17%/1 (53%/6) | ||
| NaYF4:Yb,Tm@TiO2 (7) | 50 W Xe lamp | RhB (5 × 10⁻⁵ M/50) | 100%/0.5 | 55 |
| NaYF4:Yb/Tm@TiO2 | 1 W 980 nm laser | MB (20/0.5) | 68%/24 | 56 |
| MO (15/0.5) | 69%/24 | |||
| RhB (10/0.5) | 76%/76 | |||
| NaYF4:Yb/Tm@TiO2 (10) | 1.5 W 980 nm laser | MB (5/1) | 90%/12 | 57 |
| NaYF4:Yb/Tm–BiOCl (20) | 300 W Xe lamp, λ > 780 nm | RhB (10/50) | 100%/2.7 | 59 |
| MB (10/50) | 58%/2.7 | |||
| MoS2–NaYF4:Yb/Er (20) | 980 nm laser | RhB (25/10) | 61%/12 | 60 |
| NaYF4:Yb/Tm/g-C3N4 (1) | 1 W 980 nm laser | MB (15/0.5) | 83%/6 | 61 |
| 300 W Xe lamp | 89%/1.5 | |||
| NaYF4:Yb/Tm/g-C3N4 (10) | 1 W 980 nm laser | RhB (10/100) | 22%/7 | 62 |
| 50 W Xe lamp | 80%/1.75 | |||
| NaYF4:Yb/Tm–CdS (20) | 2 W 976 nm laser | RhB (10/10) | 13%/3 | 63 |
| (40) | 300 W Tu lamp | (50/20) | 72%/2.5 | |
| NaYF4:Yb/Tm@C@CdS (10) | 50 W Xe lamp | RhB (10−5 M/50) | 92%/1.2 | 64 |
| MB (10−5 M/50) | 95%/1.2 | |||
| NaYF4:Yb/Er–CdSe (0.5) | 2 W 1560 nm laser | MB (15/0.5) | 65%/30 | 65 |
| 2 W 980 nm laser | 75%/30 | |||
| NaYF4:Yb/Tm–ZnO (0.5) | 2 W 980 nm laser | RhB (20/0.5) | 65%/30 | 66 |
| NaYF4:Yb/Tm@SiO2–ZnO (50) | 980 nm laser (50 mW cm−2) | RhB (10/50) | 17%/7 | 67 |
| 50 W Xe lamp | 89%/1.7 | |||
| NaYF4:Yb/Tm/MOFs (20) | Xe lamp (100 mW cm−2) | RhB (10/50) | 85%/1.5 | 68 |
| NaYF4:Yb/Tm@TiO2/RGO (5) | 2 W 980 nm laser | MB (10/5) | 81.1%/12 (90%/1) | 69 |
| 300 W Xe lamp | MO (15/5) | 45.9%/12 (90%/1) | ||
| Phenol (20/5) | 29.8%/12 (61%/1) | |||
| NaYF4:Yb/Er@TiO2–Ag6Si2O7 (5) | 2 W 980 nm laser | MB (10/10) | 45%/5 | 70 |
| 300 W Xe lamp | 100%/2 min | |||
| NaYF4@TiO2–Au (10) | 8 W UV lamps | MO (20/100) | 95%/1 | 71 |
| 300 W Xe lamp (λ > 420 nm) | 83%/8 | |||
| 2 W 980 nm laser | 80%/20 | |||
| 150 W solar simulator | 80%/2 | |||
| NaYF4:Yb/Tm@SnO2/Ag (5) | 2 W 980 nm laser | RhB (10/10) | 100%/5 | 72 |
| 300 W Xe lamp | 100%/0.17 | |||
| NaYF4:Yb/Tm@TiO2/Ag | 50 W Xe lamp | R6G (10−5 M/50) | 96%/2 | 73 |
| NaGdF4:Yb/Er–mTiO2 | AM 1.5 solar light | RhB | 99%/0.8 | 77 |
| NaGdF4:Er/Yb@BiFeO3 (20) | 980 nm laser (80 mW mm−2) | MO (10/20) | 55%/3.5 | 78 |
| 500 W Xe lamp (λ > 420 nm) | 80%/15 | |||
| NaLuF4:Gd,Yb,Tm@SiO2@TiO2:Mo | 500 W Xe lamp | RhB (20/50) | 100%/3.5 | 79 |
| 980 nm laser | 90%/3.5 | |||
| NaGdF4:Yb:Er/Ag/TiO2 (8) | 1.5 W 980 nm laser | RhB (5/5) | 40%/18 | 80 |
| (40) | 500 W UV-vis light | (40/40) | 97%/0.5 | |
| NaYF4:Yb/Tm@NaYF4/TiO2 (10) | 8 W 980 nm laser | RhB (1.43/5) | 41%/6 | 85 |
| 250 W Xe lamp | 73%/0.42 | |||
| NaYF4:Tm/Yb@Yb/Nd@N–TiO2 | Xe lamp (100 mW cm−2) | RhB (10−5 M/50) | 96%/1.5 | 86 |
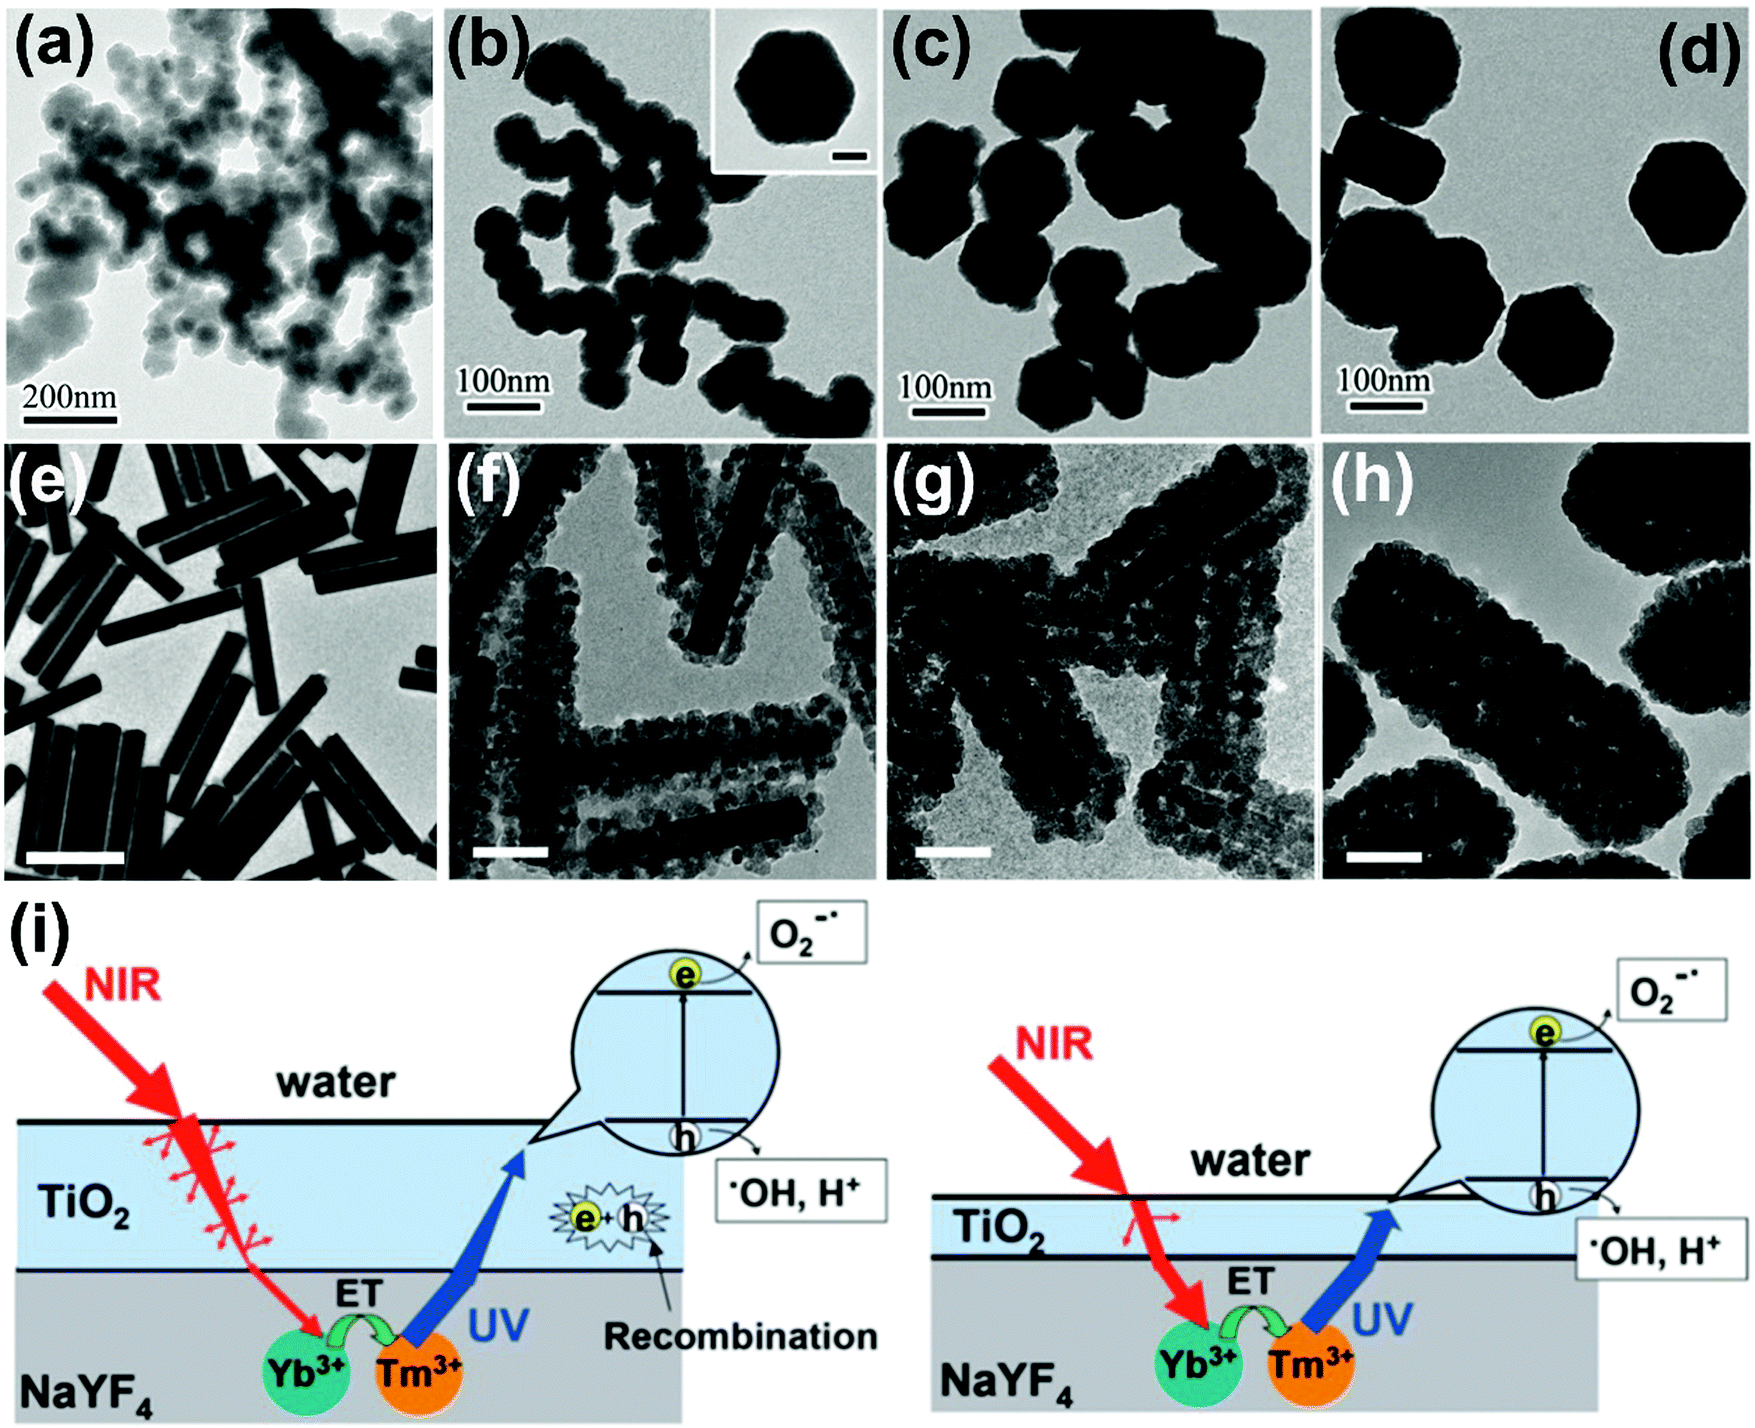 | ||
| Fig. 6 TEM images of NaYF4:Yb,Tm nanoplates of different sizes: (a) 30 nm, (b) 50 nm, (c) 100 nm, (d) 130 nm covered with amorphous TiO2 shell. (Reproduced with permission.55 Copyright 2014, Royal Society of Chemistry.) TEM images of (e) NaYF4:Yb3+,Tm3+ microrods and (f–h) NaYF4:Yb3+,Tm3+@TiO2 composites with different thickness of TiO2 shell (scale bars: (e) 1 μm, (f–h) 100 nm). (Reproduced with permission.57 Copyright 2013, Royal Society of Chemistry.) (i) The effect of various TiO2 shells on photocatalytic mechanisms (left: thick shell; right: moderate shell). (Reproduced with permission.57 Copyright 2013, Royal Society of Chemistry.) | ||
Unfortunately, upconversion nanomaterials always suffer the drawbacks of low quantum yields and intense luminescence quenching, mainly resulting from the comparatively insensitive extinction coefficients of lanthanide dopants.27 Innovative methods have been investigated for enhancing the upconversion intensity in lanthanide-doped nanocrystals, including surface plasmon coupling, surface passivation, energy transfer modulation, etc.27 Especially, the surface plasmon coupling of noble metals with upconversion material–semiconductor system presents fascinating NIR-driven photocatalytic performance.71–74 Surface plasmon coupling of noble metals with upconversion materials improves the upconversion luminescence from three aspects as follows: (1) enhancing the absorption of the sensitizer through electric-field coupling, (2) improving the radiative decay rate of the activator, and (3) increasing energy transfer from the sensitizer to the activator, as displayed in Fig. 7a. The SPR-induced local electric field could enhance the photon flux and affect the radiative decay rates of the activators, thereby leading to enhanced upconversion luminescence and high quantum yield.75,76 In our previous work, finite-difference time-domain analysis (FDTD) was used to stimulate the electromagnetic field intensity of upconversion and plasmonic enhanced photocatalysts under each of UV, visible and NIR light irradiation (Fig. 7b–e). The SPR effect of Ag nanoparticles leads to higher photocarrier yield and improves the efficient transfer of photocarriers and energy, resulting in quintupled enhancement of photocatalytic efficiency.72 The plasmon and upconversion enhanced broadband photocatalysts NYF@TiO2–Au are synthesized with significantly superior photocatalytic performance to the commercial P25 TiO2.71Fig. 7f illustrates the NIR-active photocatalytic mechanism. Under NIR light irradiation, Er3+ and Tm3+ co-doped NaYF4 excites UV and visible emissions, which overlap with the intrinsic light absorption of TiO2 and SPR band of Au nanoparticles. The excited UV emissions will assist the TiO2 to generate reductive electrons and highly oxidative holes. The excited visible emissions will interact with the SPR effect of Au nanoparticles to facilitate the transfer of hot electrons to nearby TiO2 layer and minimize the electron–hole recombination. Finally, the broadband, effective nanohybrid photocatalyst improves the efficient electron and energy transfer among constituent components that leads to excellent photocatalytic activity. However, the direct contact of noble metal nanoparticles with upconversion materials is prejudicial to the fluorescence efficiency, because direct electron transfer or FRET occurs.27 For boosting the fluorescence emissions, a minimum distance between them should be maintained of at least 5 nm, which is propitious for decreasing the non-radiative processes and increasing the radiative decay rate.76
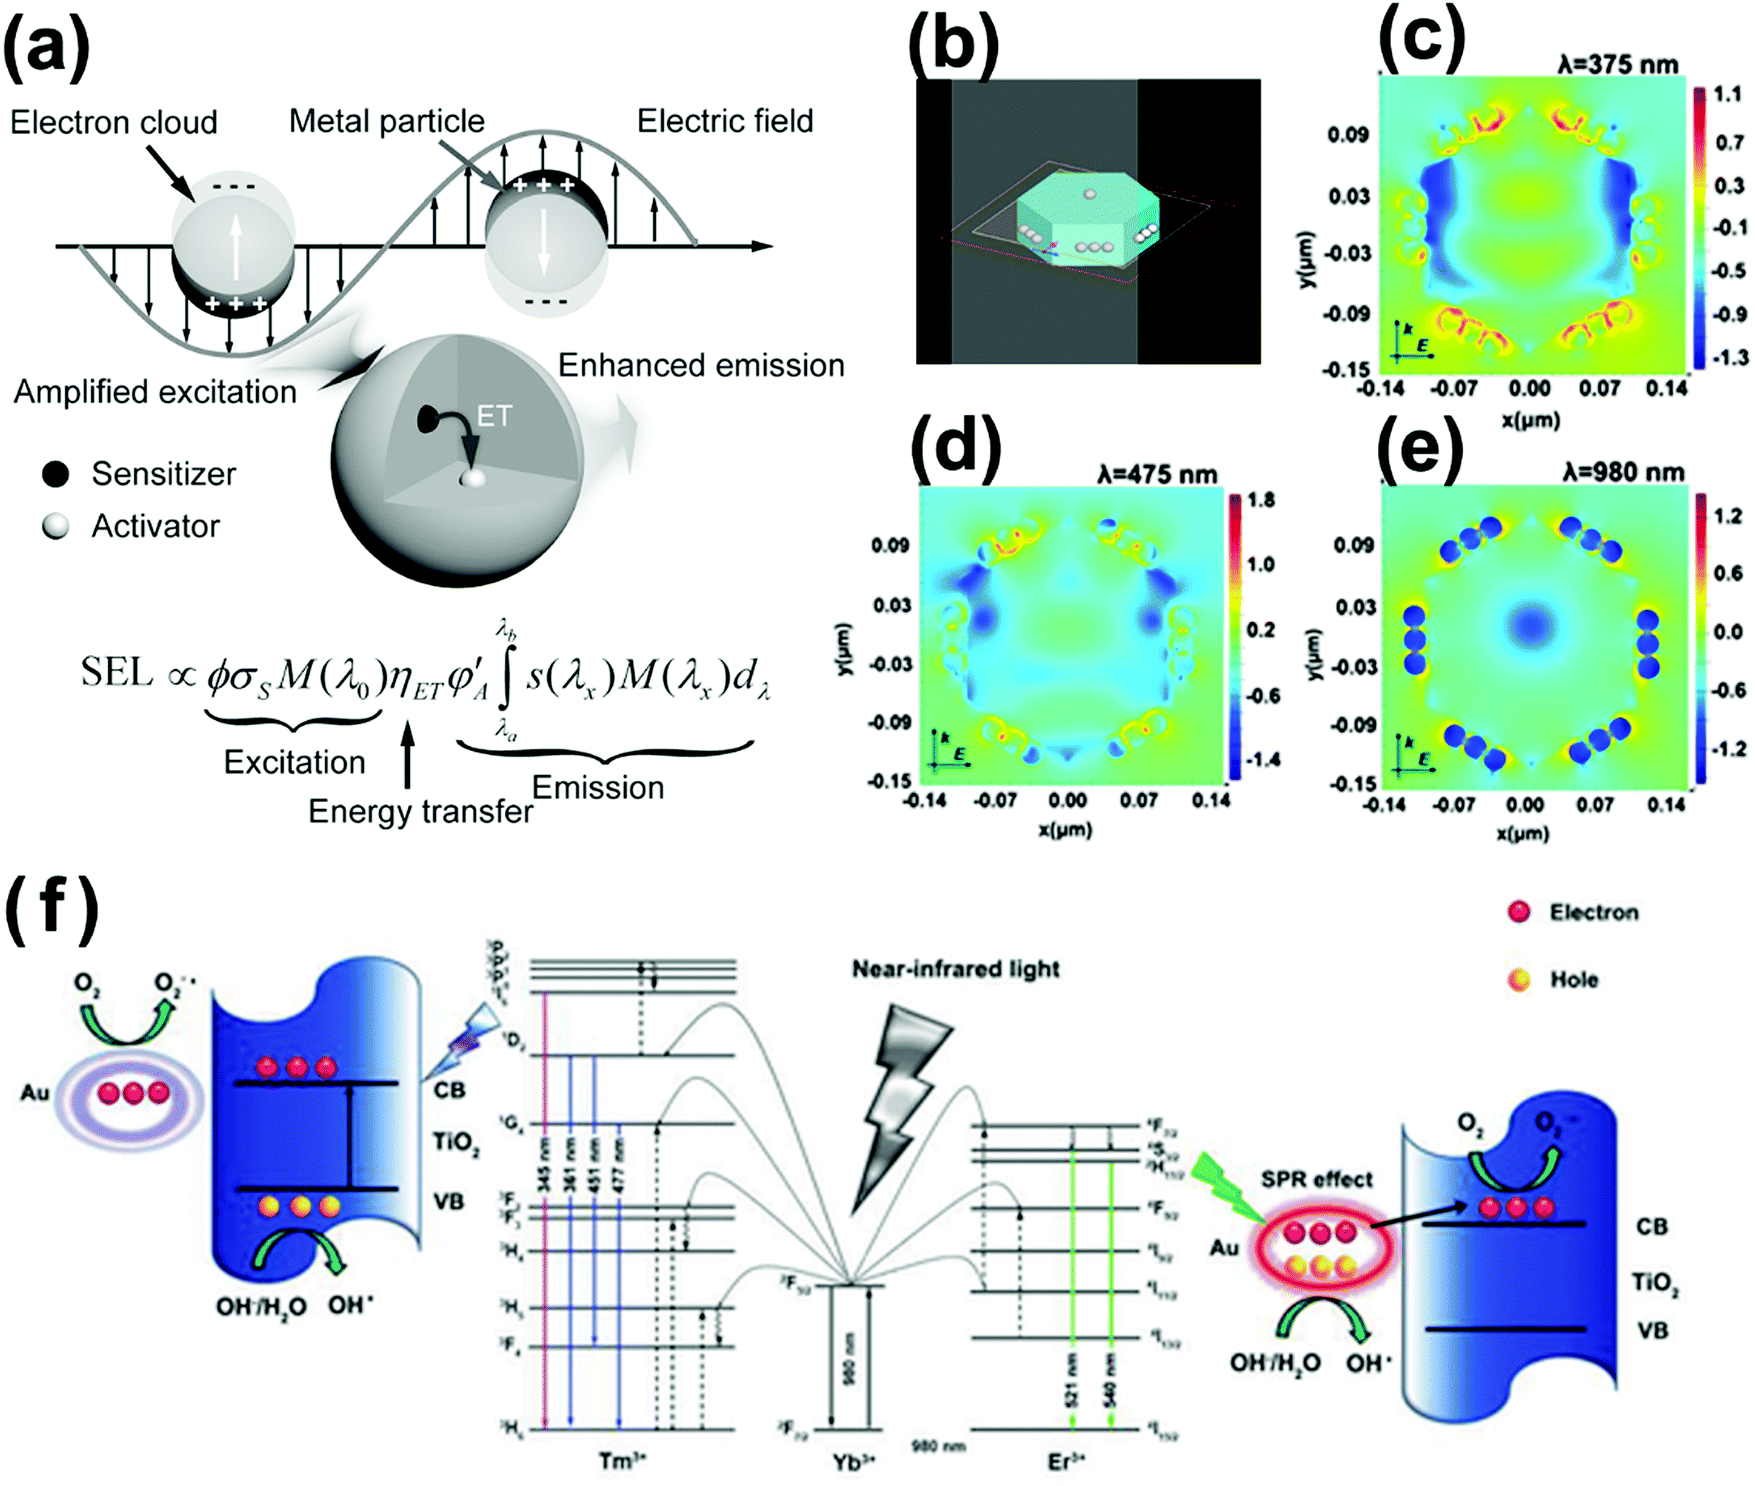 | ||
| Fig. 7 (a) Plausible mechanism for plasmonic enhancement of upconversion emissions. (Reproduced with permission.27 Copyright 2014, John Wiley and Sons.) (b–e) FDTD-calculated local electric field enhancement for NaYF4@SnO2@Ag nanoparticles at different incident wavelengths of 375, 475 and 980 nm. (Reproduced with permission.72 Copyright 2017, American Chemical Society.) (f) Schematic photocatalytic mechanism of NYF@TiO2–Au under NIR excitation. (Reproduced with permission.71 Copyright 2015, John Wiley and Sons.) | ||
Other Ln3+ ion-doped sodium fluoride-based phosphors such as NaGdF4 and NaLuF4 also have been investigated as promising frequency conversion candidates for NIR photocatalysts.77–80 For example, β-NaLuF4 and tetragonal-phase LiLuF4 are reported as novel host matrixes that may show higher yields of upconversion efficiency than β-NaYF4,81–83 ascribed to the distinctive electronic states at the top valence band of Lu3+ ions and the smaller lattice-cell volume counterparts.
Besides, to construct core–shell structural upconversion nanocrystals through epitaxial growth of small lattice-mismatched layers is excepted as a fascinating approach for improving the upconversion features, by reducing the non-radiative decay losses. The outer layers would confine the doping ions in the interior core crystals and thus inhibit the surface energy loss, resulting in improved upconversion yields. For example, excellent upconversion efficiency improvements of about 7- and 79-fold were realized after epitaxial coating of NaYF4 shell on the NaYF4:Yb,Er(Tm) core, respectively.84 Attributed to valid surface passivation, Huang et al. achieved record high upconversion quantum yield of 7.6% for LiLuF4:Yb,Tm@LiLuF4 core/shell upconversion nanoparticles.81 Until now, there are only two studies applied to the core/shell structured NaYF4:Yb/Tm@NaYF4 and NaYF4:Tm/Yb@Yb/Nd luminescent cores as energy transducers that combine with TiO2 semiconductor for environmental purification.85,86 Therefore, there are still bright prospects for development of core/shell upconversion nanoparticles for photocatalytic application.
4.3 The fluoride-based upconversion photocatalysts
Because of the closely arranged energy gaps of Ln3+ ions, host matrixes with low photonic energy are needed to overcome the non-radiative loss between the excited levels for realizing sensitive fluorescent transitions. Yttrium fluoride (YF3) takes advantage of low vibration energy (∼355 cm−1) that could reduce the quenching of electron transitions within the 4f shell, and has been selected as an appropriate candidate for matrix materials.25 A model of the orthorhombic YF3 structure is displayed in Fig. 8a, where the Ln3+ ions will mainly occupy the interstitial sites of YF3 crystals at low doping concentration and substitute the sites of Y3+ ions at high doping concentration.87,88 Various trivalent lanthanide ion-doped YF3 crystals with micro- and nanostructural morphologies (Fig. 8b–h) have been synthesized with hydrothermal process, reverse micelle method, thermal decomposition method, micro-emulsion method and microwave method by alternatively parameterizing the reaction conditions.89–93 Additionally, the sizes, morphologies and phases could be manipulated for colorful emitting luminescence properties of Ln3+ ion-doped YF3 nanocrystals which could act as frequency conversion elements for wide application in NIR-driven photocatalysis.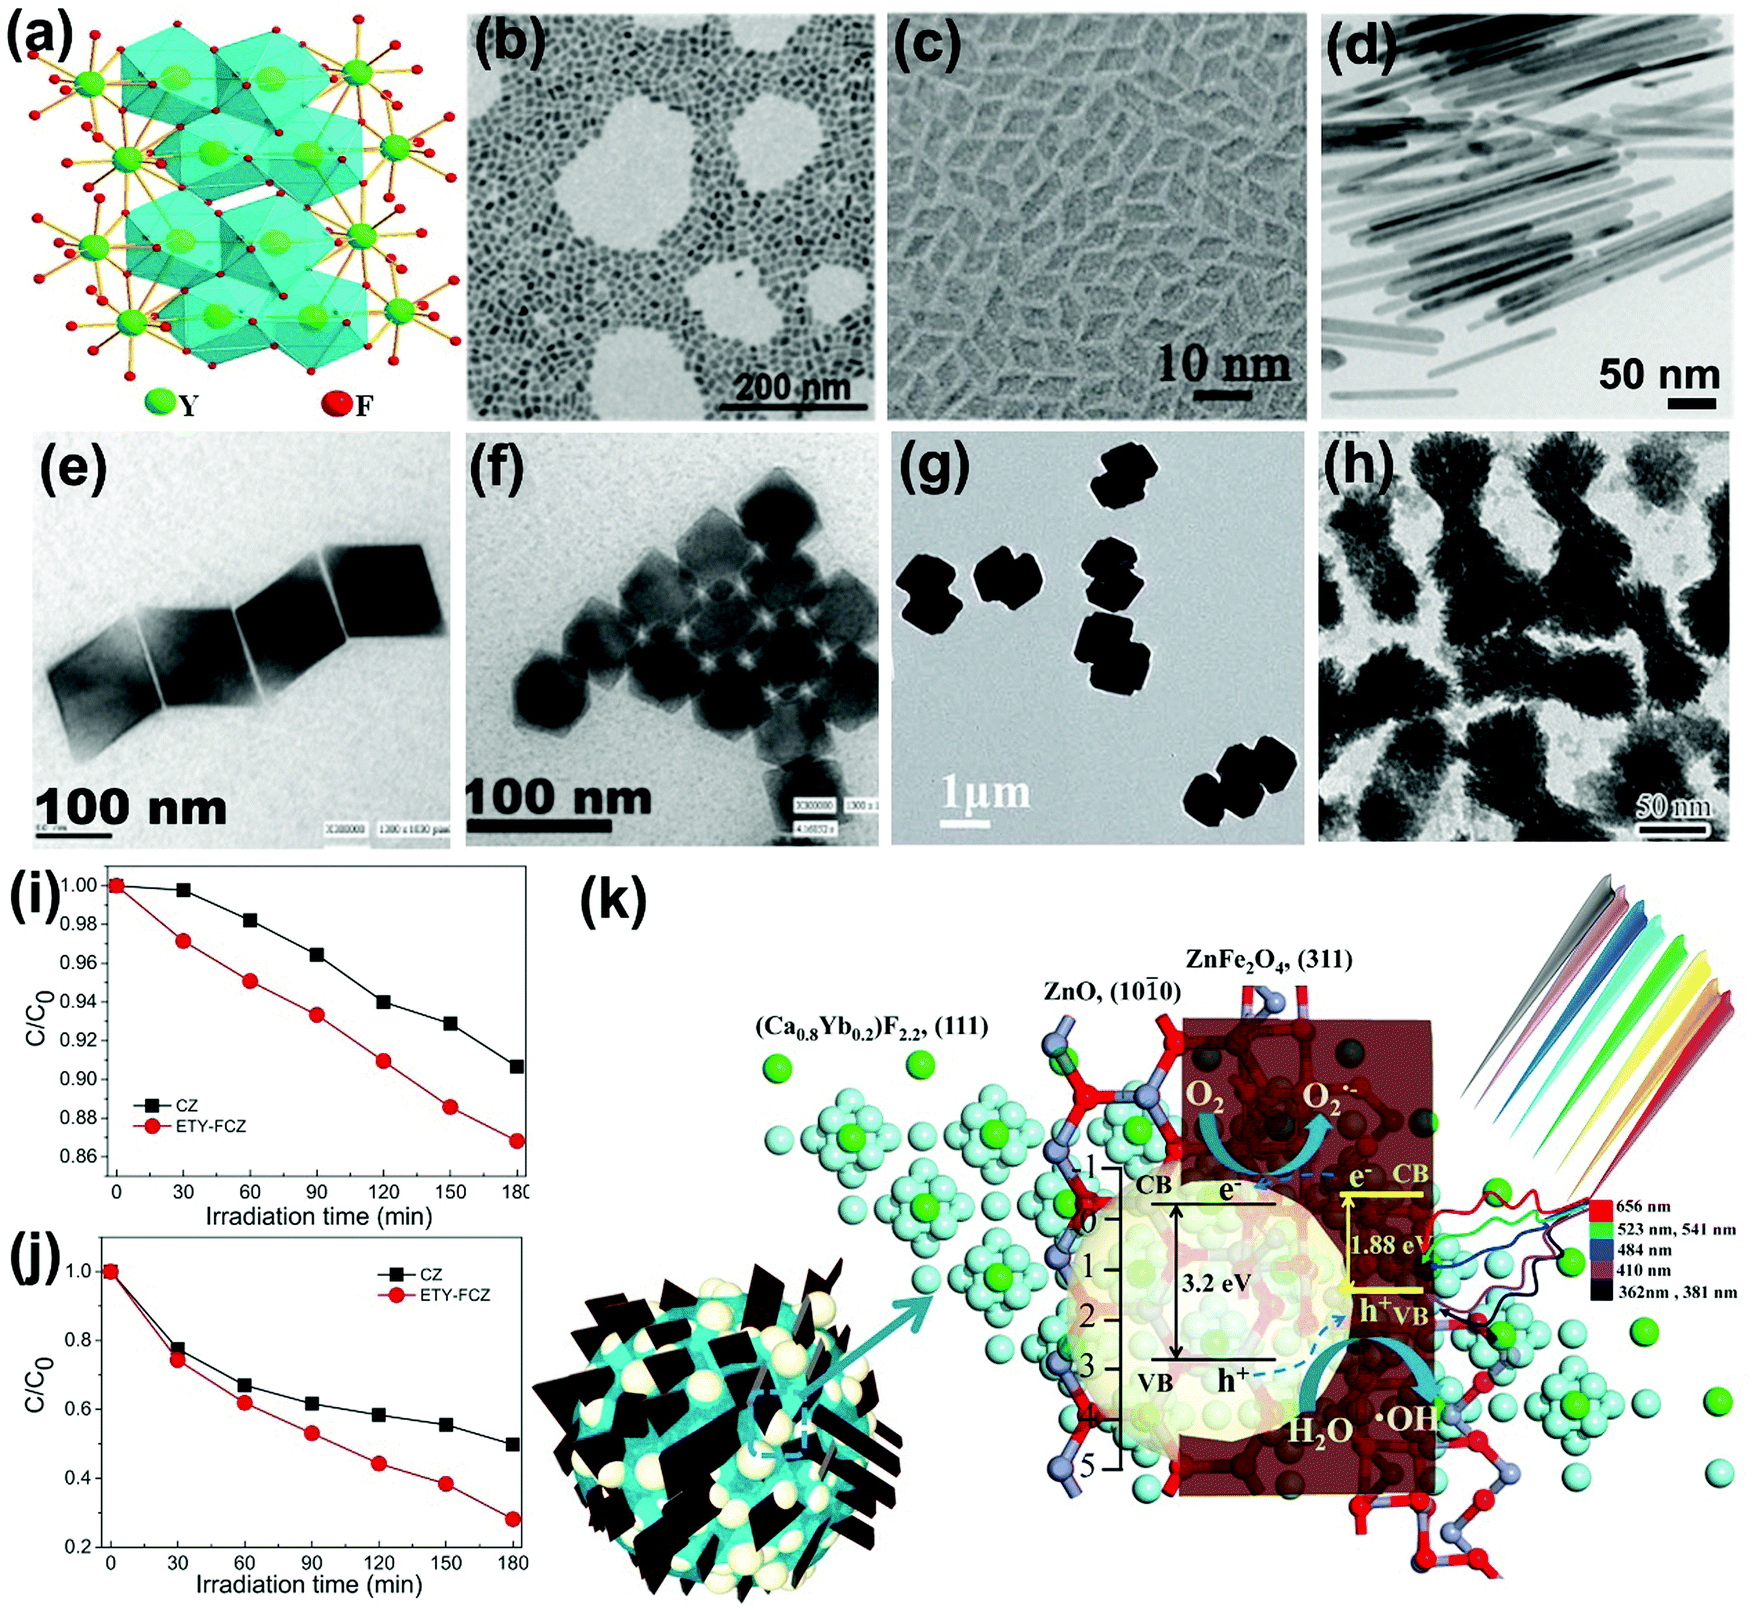 | ||
| Fig. 8 (a) Schematic representation of orthorhombic structure. (Reproduced with permission.87 Copyright 2017, American Chemical Society.) Typical YF3 morphologies of (b) nanospheres (reproduced with permission;88 copyright 2014, Royal Society of Chemistry), (c) rhombic shapes (reproduced with permission;89 copyright 2014, Royal Society of Chemistry), (d) nanorods (reproduced with permission;91 copyright 2017, American Chemical Society), (e) quadrilateral-shaped particles (reproduced with permission;90 copyright 2005, American Chemical Society), (f) hexagonal particles (reproduced with permission;90 copyright 2005, American Chemical Society), (g) dumbbell-shaped particles (reproduced with permission;92 copyright 2017, Royal Society of Chemistry) and (h) peanut-like nanocrystals (reproduced with permission;95 copyright 2013, Elsevier BV). The photocatalytic performances of as-fabricated NIR-driven photocatalyst ETY-FCZ for degradation of (i) SA and (j) MO, and (k) the proposed photocatalytic mechanism (reproduced with permission;104 copyright 2015, Elsevier BV). | ||
Also, Ln3+ ion-doped fluoride nanocrystals are coupled with conventional semiconductors to fabricate NIR-active photocatalysts.94 For instance, peanut-like YF3:Yb3+,Tm3+ nanocrystals with high specific surface were coated with uniform TiO2 shell, expanding the light utilization threshold to the NIR region.95 Bi3+ ions were further doped in YF3 by substituting Y3+ ions to tailor the energy transfer process between Yb3+ with Er3+/Tm3+. The Bi3+ ions possessing larger ionic radius will increase the cell volume of matrixes and adjust the crystal field symmetry, therefore prolonging the lifetimes of the metastable energy states by changing their wave functions, and finally enhancing the upconversion emissions.96,97 Additionally, the vacancies and point defects in Ln3+ ion-doped calcium fluoride (CaF2) matrix will induce charge compensation effects, thus increasing the energy transfer rates and the upconversion probability.98,99 The non-toxic, stable, abundant and nonhygroscopic features of CaF2 have received increasing attention in fabrication of NIR-driven photocatalysts.100–105 For example, by integrating Er3+/Tm3+/Yb3+ tri-doped CaF2 nanocrystal with magnetic ZnFe2O4 and ZnO, a multi-component and multi-functional NIR photocatalyst, ETY-FCZ, was fabricated.104 The ETY-FCZ presents continuous degradation of salicylic acid (SA) (Fig. 8i) and MO (Fig. 8j) with 71.9% and 43.73% removal rates when exposed to visible-NIR light irradiation for 180 min, respectively. Fig. 8k presents the proposed photocatalytic mechanism of the ETY-FCZ system, where the upconversion emitted UV-visible photons boosted the generation rates of electron–hole pairs of the ZnO–ZnFe2O4 heterostructures. Examples of fluoride-based upconversion photocatalysts based on the recent literature are presented in Table 3.
| Photocatalyst (mg) | Light source | Pollutants (concentration, mg L−1/volume, mL) | Degradation ratio/time (min) | Ref. |
|---|---|---|---|---|
| YF3:Yb,Tm/TiO2 (0.5) | 1.5 W 980 nm laser | MB (15/0.5) | 70%/1800 | 94 |
| YF3:Yb,Tm@TiO2 (20) | 50 W Xe lamp | MO (50/20) | 85%/70 | 95 |
| NaY(WO4)2/TiO2/YF3:Yb,Tm (20) | 1000 W mercury lamp | MO (10/20) | 100%/60 | 96 |
| SA (10/20) | 90%/60 | |||
| CaF2:Er,Yb@TiO2 (50) | 500 W Xe lamp (720 nm < λ < 1 100 nm) | MB (10/50) | 60%/720 | 100 |
| MO (10/50) | 32%/720 | |||
| BiVO4/CaF2:Er,Tm,Yb (0.5) | 980 nm laser (10 W cm−2) | MB (15/0.5) | 75%/420 | 101 |
| CaWO4@(TiO2/CaF2:Er/Tm/Yb) (20) | 980 nm laser (2 A) | MO (10/20) | 20.29%/180 | 102 |
| 1000 W mercury lamp (λ ≥ 780 nm) | 46.57%/180 | |||
| CaWO4@(TiO2/CaF2:Er/Tm/Yb) (20) | 980 nm laser (2 A) | MO (10/20) | 20.29%/180 | 103 |
| 1000 W mercury lamp | 99.02%/60 | |||
| CaF2:Er/Tm/Yb@ZnFe2O4/ZnO (20) | 1000 W mercury lamp (λ ≥ 400 nm) | MO (10/20) | 71.9%/180 | 104 |
| SA (10/20) | 43.73%/180 | |||
| CaF2:Yb@BiVO4 (20) | 980 nm laser (2 A) | MO (10/10) | 10%/360 | 105 |
| 1000 W mercury lamp | 41%/180 |
4.4 The RE sesquioxide-based upconversion photocatalysts
Although the phonon energy of RE sesquioxide materials (Y2O3, Gd2O3, Lu2O3, La2O3, etc.) is high, their excellent chemical/thermal stability makes them promising luminescence matrix candidates. Y2O3 is regarded as the best sesquioxide matrix for lanthanoids with smallest phonon energy (∼380 cm−1) among other metallic oxides and similar ionic radius (90 pm) to lanthanide elements. The ionic radii of Ln3+ are listed in Table 4, where the ionic radii (assuming six-coordination) reduce from 106.1 pm for La3+ ions to 84.8 pm for Lu3+ ions accompanied with an increase of atomic number. The similar ionic radii of Ln3+ ions to host cations will hinder the generation of crystal defects and lattice stress, and thus facilitating the upconversion efficiency.106 More importantly, the distance of interacting ions (D) dominates the electric dipole–dipole energy transfer efficiency (P) between sensitizer and activator ions, which follows the relationship:107 | (3) |
| Element | Tb | Dy | Ho | Er | Tm | Yb | Lu | — |
|---|---|---|---|---|---|---|---|---|
| Atomic number | 65 | 66 | 67 | 68 | 69 | 70 | 71 | — |
| Ionic radius (10−12 m, pm) | 92.3 | 91.2 | 90.1 | 88.1 | 86.9 | 85.8 | 84.8 | — |
| Hosts | Y2O3 | Gd2O3 | Lu2O3 | La2O3 |
|---|---|---|---|---|
| a Assuming six-coordination. | ||||
| Phonon energy (cm−1) | ∼380 | ∼600 | ∼618 | ∼400 |
| Bandgap (eV) | 5.6 | 5.4 | 6 | 5.5 |
| Ionic radiusa (10−12 m, pm) | 90 | 93.8 | 84.8 | 106.1 |
| Crystal system | Cubic | Cubic | Cubic | Hexagonal |
| Space group |
Ia![[3 with combining macron]](https://www.rsc.org/images/entities/char_0033_0304.gif) (206) (206) |
Ia (206) |
Ia (206) |
Pm1 (164) |
| Lattice parameters | a = b = c = 10.6073 Å | a = b = c = 10.8012 Å | a = b = c = 10.3946 Å | a = b = 3.9198 Å |
| c = 6.1139 Å | ||||
| α = β = γ = 90° | α = β = γ = 90° | α = β = γ = 90° | α = β = 90°, γ = 120° | |
| Nearest RE distance (Å) | 3.52 (Y1–Y2) | 3.59 (Gd1–Gd2) | 3.44 (Lu1–Lu2) | 3.83 (La–La) |
| 3.53 (Y2–Y2) | 3.61 (Gd2–Gd2) | 3.46 (Lu2–Lu2) | ||
Schematic illustrations of RE sesquioxide unit cells modeled according to the structural parameters in Table 5 are shown in Fig. 9.108–110 The nanocrystalline systems of RE2O3 (RE = Y, Gd, Lu) prefer the formation of cubic structure with space group of Ia3 (No. 206) (Fig. 9a and b), while La2O3 is predisposed to unconventional hexagonal phase with space group of P3m1 (No. 164) (Fig. 9c and d). Theoretically, the polymorphism of RE sesquioxides with lighter atoms (La–Sm) generally means that they adopt the hexagonal structure and the heavier atoms (Ho–Lu) prefer the cubic, whereas the intermediate atoms (Sm–Dy) can be stabilized in both cubic and monoclinic structures (Fig. 9e).108 The lighter Ln3+ ions with larger ionic radii prefer the formation of hexagonal crystals in virtue of higher electron cloud distortion induced by increased dipole polarizability.42 The results will offer us reasonable guidance for accommodating appropriate Ln3+ dopants in morphological construction engineering.
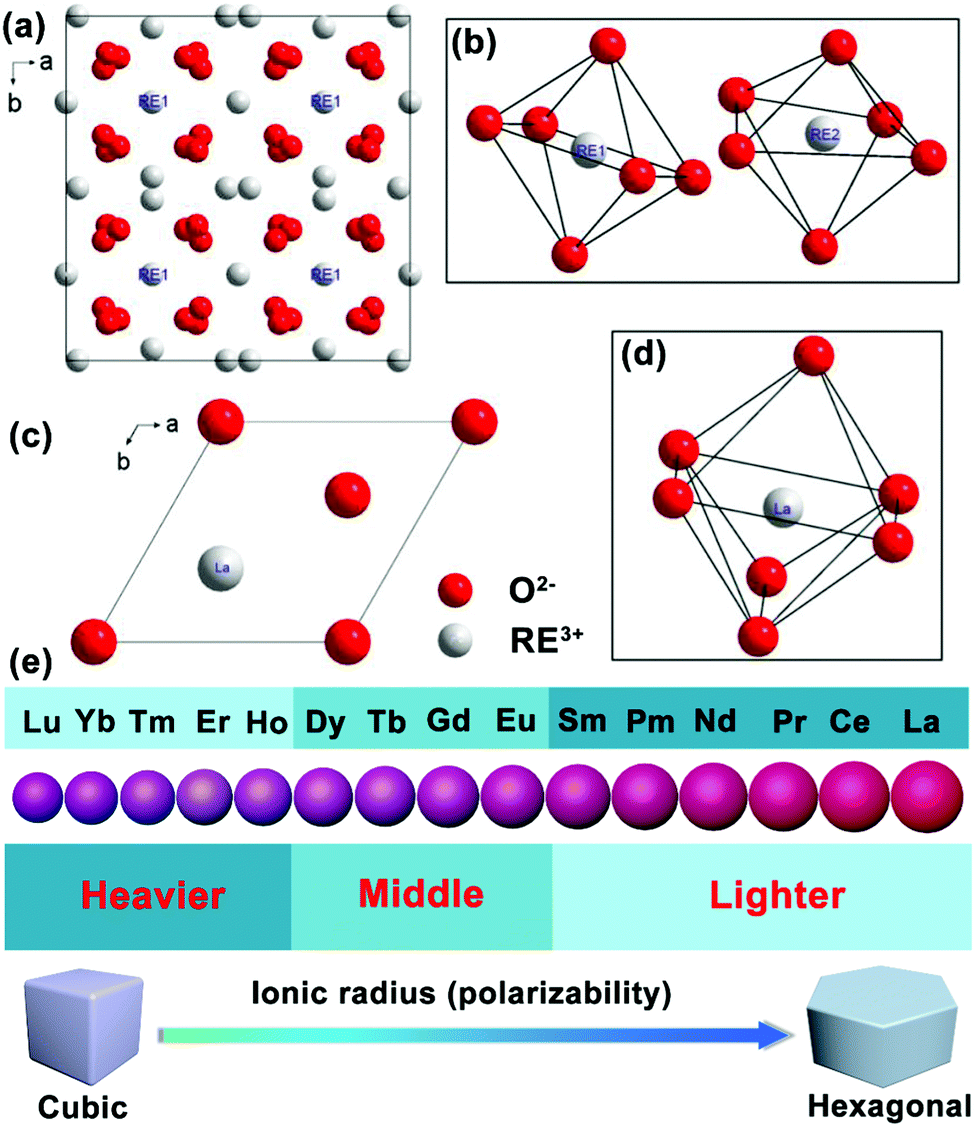 | ||
| Fig. 9 Schematic illustration of the unit cell projected on a–b plane and the RE coordination polyhedra: (a and b) RE2O3 (RE = Y, Gd, Lu), (c and d) La2O3 (reproduced with permission;108 copyright 2018, Elsevier BV). (e) Ionic radius (or polarizability) induced phase transition from cubic to hexagonal of Ln3+ ion-doped upconversion crystals. | ||
RE sesquioxide nanocrystals incorporated with semiconductors were employed for synthesis of photocatalysts for environmental cleaning and energy conversion.111–116 For example, the Yb3+,Tm3+ co-doped Y2O3 upconversion luminescence agent was composited with TiO2 and showed higher infrared-to-UV photocatalytic activity than non-doped TiO2 under irradiation of solar light.114 Another chain-like Er/Tm/Yb/Y2O3 composite demonstrated higher upconversion luminescent intensity than flake-like Er/Tm/Yb/Y2O3 upconversion nanoparticles, leading to better photocatalytic performance for degradation of MB dyes when coupling with 3C-SiC nanocrystals.113 Furthermore, the Gd3+ ions with magnetic properties are used to fabricate optically and magnetically active bifunctional materials for advanced multifunctional photocatalysts.112,117
4.5 The Ln3+ ion-doped upconversion photocatalysts
In recent years, the doping of ions into a semiconductor matrix, including non-metal ions (P3−, S2−, Cl−, etc.) and metal ions (Zn2+, Cu2+, Fe3+, etc.), has become popular and a prime motivation to extend the optical absorption threshold, or trap the photogenerated electrons by induced oxygen vacancy and/or surface defect, finally improving the photoactivities.4,9,118,119 Similarly, the current strategies of doping with Ln3+ ions into semiconductors such as TiO2, ZnO, BiVO4, etc., have proved to be an interesting and not yet fully explored highway for optimizing the photocatalytic performance.120–128 As displayed in Fig. 10, 4f orbital electronic states of Ln3+ ions bring the sub-bandgap levels that settled down below the conduction band edge of semiconductors. The electrons will populate the inserted electronic states of Ln3+ ions instead of intrinsic conduction band edge of semiconductors, thus narrowing the bandgap energy of photocatalysts and extending the optical absorption threshold.129,130 For example, the bandgap energy values of B-BiVO4 with different doping concentrations of Eu3+ ions varied from 0 to 1.0% were calculated by using the Kubelka–Munk function. The bandgaps were tailored from 2.36 eV to 2.26 eV by raising the dopant dosage of Eu3+ ions, inducing approximately nine times higher photocatalytic activity (0.8 Eu–B-BiVO4) compared with pure BiVO4.131 | ||
| Fig. 10 Photocatalytic mechanism of Ln3+-doped semiconductor photocatalysts. | ||
Additionally, the lanthanides are well known for being capable of forming complexes with a variety of Lewis bases, like amines, aldehydes, alcohols, and thiols, taking advantage of their functional groups and the f-orbitals of the lanthanoids.34,132 Meanwhile, the substitution of high valence state ions (such as Ti4+) with trivalent Ln3+ ions will break the charge balance, which may be compensated by negative functional groups of dyes.133 This is desirable to increase the adsorption capacity of organic dyes with photocatalysts due to the negative functional group, therefore lying good preparatory foundations for subsequent photocatalytic reactions.134 For example, three-fold higher adsorption constants k were achieved in Pr3+/Eu3+ ion-doped TiO2 photocatalysts that were analyzed according to Langmuir's theory.135 The Ln3+ sites can act as electron acceptors to trap the photogenerated electrons and minimize undesired electron–hole recombination, where the trapped electrons are capable of combining with oxygen to form superoxide radicals for photooxidation of adsorbed organics. Especially, for Gd3+ ions with special half-filled electronic configuration of 7f-electrons, it is easier to transfer the trapped electrons to the interfacial adsorbed oxygen.130,136
It is well known that doping of Ln3+ ions will improve the photocatalytic performance of semiconductors by regulating the band energy and promoting the separation of carriers. Meanwhile, the loading concentration and type of Ln3+ dopant ions are also important parameters that affect the photocatalytic performance. High dopant dosage will increase the surface barrier of the semiconductors and decrease the space charge region. A large electric field is beneficial for promoting the separation of photoinduced carriers. But if the doping concentration is too high, the space charge region will become narrow that substantially reduces the penetration depth of light into semiconductors, and hence greatly increases the recombination possibilities of photoinduced carriers.130,137 Moreover, owing to the generally large ionic radii of Ln3+ ions (Table 4), for example, larger than Ti4+ (∼68 pm), small and isolated clusters of lanthanide oxide will form and cover the surface of semiconductors at high doping concentration, which will aggregate as carrier capture centers, thus deactivating the photocatalytic activity.138 Therefore, there must be an optimum concentration level of dopants to balance the thickness of the space charge layer substantially equivalent to the light penetration depth. For instance, La3+ ion-doped TiO2 at a concentration of 0.5% was proved to possess the most efficient photodegradation rate for MO counterparts.139 And Dy3+-doped ZnO nanoparticles with a doping concentration of 3% were found to endow the highest decolorization efficiency of C. I. Acid Red 17 under visible light irradiation.140
In the activator ion (i.e., Tm3+, Er3+) and sensitizer ion (i.e., Yb3+, Nd3+) co-doped semiconductor system, the sensitizer will accept the NIR photons and transfer the energy to the nearest activator ions for emitting UV-visible photons by the upconversion process. As mentioned above, the upconverted photons favor the donation to the valence band of semiconductor followed by oxidative hole (h+) generation by extraction of a reductive electron, thus boosting the yield of photocarriers and improving the photocatalytic efficiency.141,142
5. Outlooks and perspectives
In summary, the synthesis of upconversion materials with effective quantum yields and fabrication of upconversion-based semiconductor photocatalysts are considerable challenges. Despite the significant developments in this direction, there are several tough challenges associated with upconversion materials that limit their applications in basic sciences, including lower upconversion yields and confined excitation wavelengths. However, the reported highest upconversion efficiency is 3.0 ± 0.3% for Yb3+,Er3+ co-doped bulk NaYF4 materials.143 Nevertheless, the micro- or nanomaterials possess lower upconversion efficiency than bulk materials because of the synergistic effect of surface state defects induced by the small particle sizes and adhering water reducing the optical efficiency. Therefore, much effort is required to design and develop high-efficiency upconversion materials. To achieve this purpose, the first method is to select host materials with low phonon energy, which prefer to decrease multi-phonon relaxation between closely spaced energy levels, thus generating more effective upconversion. The host materials provide a surrounding crystalline field for Ln3+ ions but do not determine the emissions. The type of lanthanide dopant and doping concentration are vital for tailoring the upconverted luminescence. In addition, the SPR effect of noble metals is proved theoretically and experimentally to boost the upconversion luminescence by enhancing the absorption of the sensitizer through electric-field coupling, improving the radiative decay rate of the activator, and increasing energy transfer from the sensitizer to the activator. The intrinsic features of SPR are greatly beneficial to the photocatalytic performance of semiconductor photocatalysts by boosting the yield of photogenerated electron/hole pairs and promoting their effective separation. In addition, the SPR of noble metal nanoparticles could effectively promote the efficiency of upconversion materials. Interestingly, researchers have recently discovered localized surface plasmon resonances (LSPRs) in heavily doped semiconductor nanoparticles, quantum dots and amorphous two-dimensional nanomaterials.144–146 The occurrence of LSPR originates from collective oscillations of excess free carriers, the concentration of which (1019–1021 cm−3) can be regulated by adjusting stoichiometric ratios, vacancy or doping concentrations, phase structures, etc.147 Therefore, the LSPR-induced electric field in semiconductors provides a powerful strategy to enhance the upconversion efficiency. More importantly, the unique interactions based on the process of plasmonic energy transfer will further improve the NIR light-active photocatalytic performance.148,149 The marriage of upconversion with semiconductor LSPR could be a novel frontier in fundamental investigations and practical solar energy conversion applications.Also, epitaxial growth of a shell with small lattice mismatch around a core can reduce non-radiative decay losses of the surface fluorescence, which would offer a useful way to improve the fluorescence intensity of upconversion crystals. In a core–shell structure, the dopant RE ions are incorporated into the interior core layer of particles. The shell layer can effectively suppress energy loss on the crystal surface, resulting in higher luminescence efficiency. These attractive features of core–shell structures make them suitable candidates for photocatalytic application.
The preceding discussion is concentrated entirely on Yb3+ ion (absorption cross section ≈10−20 cm2)-sensitized upconversion materials with the photo-absorption band centered at 980 nm. By paying attention to the drawbacks of confined excitation wavelength, innovative strategies that incorporate replaceable sensitizers have been proposed for tuning the excitation wavelengths of upconversion crystals. Nd3+ is ideal as an alternative sensitizer since it has a one order of magnitude larger absorption cross section (≈10−19 cm2) at ≈800 nm than Yb3+ at ≈980 nm.27 Benefiting from the unique features of deep tissue penetration depth and low photothermal effect of ≈800 nm light (first NIR window), the Nd3+-sensitized upconversion nanoparticles have attracted considerable interdisciplinary attention in biosensing, bioimaging, drug delivery, therapy, and three-dimensional displays.150 Unfortunately, there is no literature focusing on the Nd3+-sensitized upconversion materials as energy conversion elements that are composited with semiconductor photocatalysts, for further utilizing solar light centered at 800 nm. The emergence of Nd3+-sensitized upconversion nanoparticles would open other possible avenues of future works on upconversion semiconductor-based photocatalytic systems. We anticipate new breakthroughs in the construction of novel and highly efficient NIR-light-activated photocatalysts.
At present, almost all the considered NIR light-active photocatalytic systems are applied in organic dye degradation. It will be of significant importance to exploit potential effective photocatalysts for solving the challenges faced by the community of upconversion-based materials for their more efficient and wider applications to energy production and storage such as water splitting, CO2 conversion, etc.151,152
Author contributions
All authors contributed during the preparation of the manuscript. All authors have given approval to the final version of the manuscript.Conflicts of interest
The authors declare that they have no competing interests.Acknowledgements
This work was supported by the NSFC (51471121), Hubei Provincial Natural Science Foundation (2014CFB261), Basic Research Plan Program of Shenzhen City (JCYJ20160517104459444), Natural Science Foundation of Jiangsu Province (BK20160383) and Wuhan University.References
- H. Tong, S. Ouyang, Y. Bi, N. Umezawa, M. Oshikiri and J. Ye, Adv. Mater., 2012, 24, 229–251 CrossRef CAS PubMed.
- W. Wu, J. Changzhong and V. A. Roy, Nanoscale, 2015, 7, 38–58 RSC.
- Z. Wu, S. Yang and W. Wu, Nanoscale, 2016, 8, 1237–1259 RSC.
- J. Liu, Z. Wu, Q. Tian, W. Wu and X. Xiao, CrystEngComm, 2016, 18, 6303–6326 RSC.
- C. Chen, W. Ma and J. Zhao, Chem. Soc. Rev., 2010, 39, 4206–4219 RSC.
- L. Sun, W. Wu, S. Yang, J. Zhou, M. Hong, X. Xiao, F. Ren and C. Jiang, ACS Appl. Mater. Interfaces, 2014, 6, 1113–1124 CrossRef CAS PubMed.
- Q. Tian, W. Wu, L. Sun, S. Yang, M. Lei, J. Zhou, Y. Liu, X. Xiao, F. Ren, C. Jiang and V. A. L. Roy, ACS Appl. Mater. Interfaces, 2014, 6, 13088–13097 CrossRef CAS PubMed.
- W. Wu, S. Zhang, X. Xiao, J. Zhou, F. Ren, L. Sun and C. Jiang, ACS Appl. Mater. Interfaces, 2012, 4, 3602–3609 CrossRef CAS PubMed.
- J. Liu, S. Yang, W. Wu, Q. Tian, S. Cui, Z. Dai, F. Ren, X. Xiao and C. Jiang, ACS Sustainable Chem. Eng., 2015, 3, 2975–2984 CrossRef CAS.
- A. Fujishima and K. Honda, Nature, 1972, 238, 37–38 CrossRef CAS PubMed.
- J. H. Carey, J. Lawrence and H. M. Tosine, Bull. Environ. Contam. Toxicol., 1976, 16, 697–701 CrossRef CAS PubMed.
- B. Kraeutler and A. J. Bard, J. Am. Chem. Soc., 1978, 100, 5985–5992 CrossRef CAS.
- G. L. Amy, L. Linsebigler and J. T. Yates, Jr., Chem. Rev., 1995, 95, 735–758 CrossRef.
- S. G. Kumar and L. G. Devi, J. Phys. Chem. A, 2011, 115, 13211–13241 CrossRef CAS PubMed.
- H. Park, Y. Park, W. Kim and W. Choi, J. Photochem. Photobiol., C, 2013, 15, 1–20 CrossRef CAS.
- Q. Tian, W. Wu, J. Liu, Z. Wu, W. Yao, J. Ding and C. Jiang, Dalton Trans., 2017, 46, 2770–2777 RSC.
- W. Wu, L. Sun, S. Yang, J. Zhou, M. Hong, X. Xiao, F. Ren and C. Jiang, ACS Appl. Mater. Interfaces, 2014, 6, 1113–1124 CrossRef PubMed.
- H. Li, Z. Kang, Y. Liu and S.-T. Lee, J. Mater. Chem., 2012, 22, 24230–24253 RSC.
- H. Li, R. Liu, S. Lian, Y. Liu, H. Huang and Z. Kang, Nanoscale, 2013, 5, 3289–3297 RSC.
- J. Wu, Z. Zhang, B. Liu, Y. Fang, L. Wang and B. Dong, Sol. RRL, 2018, 2, 1800039 CrossRef.
- M. Hu, J. Chen, Z.-Y. Li, L. Au, G. V. Hartland, X. Li, M. Marquez and Y. Xia, Chem. Soc. Rev., 2006, 35, 1084–1094 RSC.
- A. Kubacka, M. Fernandez-Garcia and G. Colon, Chem. Rev., 2012, 112, 1555–1614 CrossRef CAS PubMed.
- Z. Zhang and J. T. Yates, Jr., Chem. Rev., 2012, 112, 5520–5551 CrossRef CAS PubMed.
- W. Yang, X. Li, D. Chi, H. Zhang and X. Liu, Nanotechnology, 2014, 25, 482001 CrossRef PubMed.
- X. Liu, H. Chu, J. Li, L. Niu, C. Li, H. Li, L. Pan and C. Q. Sun, Catal. Sci. Technol., 2015, 5, 4727–4740 RSC.
- X. Li, F. Zhang and D. Zhao, Chem. Soc. Rev., 2015, 44, 1346–1378 RSC.
- S. Han, R. Deng, X. Xie and X. Liu, Angew. Chem., Int. Ed., 2014, 53, 11702–11715 CrossRef CAS PubMed.
- S. Gai, C. Li, P. Yang and J. Lin, Chem. Rev., 2014, 114, 2343–2389 CrossRef CAS PubMed.
- X. Yu, M. Li, M. Xie, L. Chen, Y. Li and Q. Wang, Nano Res., 2010, 3, 51–60 CrossRef CAS.
- X. Yu, L. Chen, M. Li, M. Xie, L. Zhou, Y. Li and Q. Wang, Adv. Mater., 2008, 20, 4118–4123 CrossRef CAS.
- S. V. Eliseeva and J. C. Bunzli, Chem. Soc. Rev., 2010, 39, 189–227 RSC.
- F. Wang and X. Liu, J. Am. Chem. Soc., 2008, 130, 5642–5643 CrossRef CAS PubMed.
- A. Shalav, B. S. Richards and M. A. Green, Sol. Energy Mater. Sol. Cells, 2007, 91, 829–842 CrossRef CAS.
- S. Bingham and W. A. Daoud, J. Mater. Chem., 2011, 21, 2041–2050 RSC.
- D. Chen, Y. Wang and M. Hong, Nano Energy, 2012, 1, 73–90 CrossRef CAS.
- N. Bloembergen, Phys. Rev. Lett., 1959, 2, 84–85 CrossRef CAS.
- X. Li, F. Zhang and D. Zhao, Nano Today, 2013, 8, 643–676 CrossRef CAS.
- J. S. Chivian, W. E. Case and D. D. Eden, Appl. Phys. Lett., 1979, 35, 124–125 CrossRef CAS.
- G. Chen, H. Qiu, P. N. Prasad and X. Chen, Chem. Rev., 2014, 114, 5161–5214 CrossRef CAS PubMed.
- F. Wang, R. Deng, J. Wang, Q. Wang, Y. Han, H. Zhu, X. Chen and X. Liu, Nat. Mater., 2011, 10, 968–973 CrossRef CAS PubMed.
- Q. Su, S. Han, X. Xie, H. Zhu, H. Chen, C.-K. Chen, R.-S. Liu, X. Chen, F. Wang and X. Liu, J. Am. Chem. Soc., 2012, 134, 20849–20857 CrossRef CAS PubMed.
- F. Wang, Y. Han, C. S. Lim, Y. Lu, J. Wang, J. Xu, H. Chen, C. Zhang, M. Hong and X. Liu, Nature, 2010, 463, 1061–1065 CrossRef CAS PubMed.
- K. K. Pukhov, F. Pelle and J. Heber, Mol. Phys., 2003, 101, 1001–1006 CrossRef CAS.
- C. B. Layne, W. H. Lowdermilk and M. J. Weber, Phys. Rev. B: Solid State, 1977, 16, 10–20 CrossRef CAS.
- X. Liu, M. Li, X. Wang, F. Huang, Y. Ma, J. Zhang, L. Hu and D. Chen, J. Lumin., 2014, 150, 40–45 CrossRef CAS.
- O. Ravi, S. J. Dhoble, B. Ramesh, G. Devarajulu, C. M. Reddy, K. Linganna, G. R. Reddy and B. D. P. Raju, J. Lumin., 2015, 164, 154–159 CrossRef CAS.
- Y. Jia, T.-Y. Sun, J.-H. Wang, H. Huang, P. Li, X.-F. Yu and P. K. Chu, CrystEngComm, 2014, 16, 6141–6148 RSC.
- W. Zheng, P. Huang, D. Tu, E. Ma, H. Zhu and X. Chen, Chem. Soc. Rev., 2015, 44, 1379–1415 RSC.
- G. S. Yi and G. M. Chow, Adv. Funct. Mater., 2006, 16, 2324–2329 CrossRef CAS.
- K. Chong, T. Hirai, T. Kawai, S. Hashimoto and N. Ohno, J. Lumin., 2007, 122–123, 149–151 CrossRef CAS.
- C. Li, Z. Quan, J. Yang, P. Yang and J. Lin, Inorg. Chem., 2007, 46, 6329–6337 CrossRef CAS PubMed.
- M. Haase and H. Schäfer, Angew. Chem., Int. Ed., 2011, 50, 5808–5829 CrossRef CAS PubMed.
- Y. Tang, W. Di, X. Zhai, R. Yang and W. Qin, ACS Catal., 2013, 3, 405–412 CrossRef CAS.
- W. Wang, M. Ding, C. Lu, Y. Ni and Z. Xu, Appl. Catal., B, 2014, 144, 379–385 CrossRef CAS.
- W. Su, M. Zheng, L. Li, K. Wang, R. Qiao, Y. Zhong, Y. Hu and Z. Li, J. Mater. Chem. A, 2014, 2, 13486–13491 RSC.
- D.-X. Xu, Z.-W. Lian, M.-L. Fu, B. Yuan, J.-W. Shi and H.-J. Cui, Appl. Catal., B, 2013, 142–143, 377–386 CrossRef CAS.
- Y. Zhang and Z. Hong, Nanoscale, 2013, 5, 8930–8933 RSC.
- X. Chen, Y. Zhu, D. Zhou, W. Xu, J. Zhu, G. Pan, Z. Yin, H. Wang, S. Cui and H. Song, J. Mater. Chem. C, 2017, 5, 2451–2458 RSC.
- L. Bai, W. Jiang, C. Gao, S. Zhong, L. Zhao, Z. Li and S. Bai, Nanoscale, 2016, 8, 19014–19024 RSC.
- M. Chatti, V. N. Adusumalli, S. Ganguli and V. Mahalingam, Dalton Trans., 2016, 45, 12384–12392 RSC.
- M. Z. Huang, B. Yuan, L. Dai and M. L. Fu, J. Colloid Interface Sci., 2015, 460, 264–272 CrossRef CAS PubMed.
- E. Cheng, W. Yin, S. Bai, R. Qiao, Y. Zhong and Z. Li, Mater. Lett., 2015, 146, 87–90 CrossRef CAS.
- C. Li, F. Wang, J. Zhu and J. C. Yu, Appl. Catal., B, 2010, 100, 433–439 CrossRef CAS.
- M. Tou, Y. Mei, S. Bai, Z. Luo, Y. Zhang and Z. Li, Nanoscale, 2016, 8, 553–562 RSC.
- X. Guo, C. Chen, D. Zhang, C. P. Tripp, S. Yin and W. Qin, RSC Adv., 2016, 6, 8127–8133 RSC.
- X. Guo, W. Song, C. Chen, W. Di and W. Qin, Phys. Chem. Chem. Phys., 2013, 15, 14681–14688 RSC.
- M. Tou, Z. Luo, S. Bai, F. Liu, Q. Chai, S. Li and Z. Li, Mater. Sci. Eng., C, 2017, 70, 1141–1148 CrossRef CAS PubMed.
- M. Li, Z. Zheng, Y. Zheng, C. Cui, C. Li and Z. Li, ACS Appl. Mater. Interfaces, 2017, 9, 2899–2905 CrossRef CAS PubMed.
- W. Wang, Y. Li, Z. Kang, F. Wang and J. C. Yu, Appl. Catal., B, 2016, 182, 184–192 CrossRef CAS.
- Q. Tian, W. Yao, Z. Wu, J. Liu, L. Liu, W. Wu and C. Jiang, J. Mater. Chem. A, 2017, 5, 23566–23576 RSC.
- Z. Xu, M. Quintanilla, F. Vetrone, A. O. Govorov, M. Chaker and D. Ma, Adv. Funct. Mater., 2015, 25, 2950–2960 CrossRef CAS.
- Q. Tian, W. Yao, W. Wu, J. Liu, Z. Wu, L. Liu, Z. Dai and C. Jiang, ACS Sustainable Chem. Eng., 2017, 5, 10889–10899 CrossRef CAS.
- Y. Ma, H. Liu, Z. Han, L. Yang and J. Liu, J. Mater. Chem. A, 2015, 3, 14642–14650 RSC.
- J. Wang, H. Huang, D. Zhang, M. Chen, Y. Zhang, X. Yu, L. Zhou and Q. Wang, Nano Res., 2015, 8, 2548–2561 CrossRef CAS.
- W. Deng, F. Xie, H. T. Baltar and E. M. Goldys, Phys. Chem. Chem. Phys., 2013, 15, 15695–15708 RSC.
- K. Aslan, I. Gryczynski, J. Malicka, E. Matveeva, J. R. Lakowicz and C. D. Geddes, Curr. Opin. Biotechnol., 2005, 16, 55–62 CrossRef CAS PubMed.
- P. Padhye, S. Sadhu, M. Malik and P. Poddar, RSC Adv., 2016, 6, 53504–53518 RSC.
- J. Zhang, Y. Huang, L. Jin, F. Rosei, F. Vetrone and J. P. Claverie, ACS Appl. Mater. Interfaces, 2017, 9, 8142–8150 CrossRef CAS PubMed.
- D. Yin, L. Zhang, X. Cao, J. Tang, W. Huang, Y. Han, Y. Liu, T. Zhang and M. Wu, RSC Adv., 2015, 5, 87251–87258 RSC.
- N. Prakash, D. Thangaraju, R. Karthikeyan, M. Arivanandhan, Y. Shimura and Y. Hayakawa, RSC Adv., 2016, 6, 80655–80665 RSC.
- P. Huang, W. Zheng, S. Zhou, D. Tu, Z. Chen, H. Zhu, R. Li, E. Ma, M. Huang and X. Chen, Angew. Chem., Int. Ed., 2014, 53, 1252–1257 CrossRef CAS PubMed.
- S. Zeng, J. Xiao, Q. Yang and J. Hao, J. Mater. Chem., 2012, 22, 9870–9874 RSC.
- L. Wang, M. Lan, Z. Liu, G. Qin, C. Wu, X. Wang, W. Qin, W. Huang and L. Huang, J. Mater. Chem. C, 2013, 1, 2485–2490 RSC.
- G.-S. Yi and G.-M. Chow, Chem. Mater., 2007, 19, 341–343 CrossRef CAS.
- F. Zhang, C.-L. Zhang, H.-Y. Peng, H.-P. Cong and H.-S. Qian, Part. Part. Syst. Charact., 2016, 33, 248–253 CrossRef CAS.
- K. Wang, W. Qincheng, F. Wang, S. Bai, S. Li and Z. Li, Inorg. Chem. Front., 2016, 3, 1190–1197 RSC.
- H. Guan, Y. Sheng, Y. Song, C. Xu, X. Zhou, K. Zheng, Z. Shi and H. Zou, J. Phys. Chem. C, 2017, 121, 23080–23095 CrossRef CAS.
- H. Li, Q. Huang, Y. Wang, K. Chen, J. Xie, Y. Pan, H. Su, X. Xie, L. Huang and W. Huang, J. Mater. Chem. C, 2017, 5, 6450–6456 RSC.
- Y. Zhu, W. Xu, S. Cui, M. Liu, C. Lu, H. Song and D.-H. Kim, J. Mater. Chem. C, 2016, 4, 331–339 RSC.
- J.-L. Lemyre and A. M. Ritcey, Chem. Mater., 2005, 17, 3040–3043 CrossRef CAS.
- G. Murali, R. K. Mishra, J. M. Lee, Y. C. Chae, J. Kim, Y. D. Suh, D.-k. Lim and S. H. Lee, Cryst. Growth Des., 2017, 17, 3055–3061 CrossRef CAS.
- G. Murali, S. Kaur, Y. C. Chae, M. Ramesh, J. Kim, Y. D. Suh, D.-K. Lim and S. H. Lee, RSC Adv., 2017, 7, 24255–24262 RSC.
- H. Qiu, G. Chen, R. Fan, L. Yang, C. Liu, S. Hao, M. J. Sailor, H. Agren, C. Yang and P. N. Prasad, Nanoscale, 2014, 6, 753–757 RSC.
- W. Qin, D. Zhang, D. Zhao, L. Wang and K. Zheng, Chem. Commun., 2010, 46, 2304–2306 RSC.
- Q.-L. Ye, X. Yang, C. Li and Z. Li, Mater. Lett., 2013, 106, 238–241 CrossRef CAS.
- S. Huang, Z. Lou, Z. Qi, N. Zhu and H. Yuan, Appl. Catal., B, 2015, 168–169, 313–321 CrossRef CAS.
- N. Niu, F. He, S. Gai, C. Li, X. Zhang, S. Huang and P. Yang, J. Mater. Chem., 2012, 22, 21613–21623 RSC.
- N.-N. Dong, M. Pedroni, F. Piccinelli, G. Conti, A. Sbarbati, J. E. Ramírez-Hernández, L. M. Maestro, M. C. Iglesias-dela Cruz, F. Sanz-Rodriguez, A. Juarranz, F. Chen, F. Vetrone, J. A. Capobianco, J. G. Solé, M. Bettinelli, D. Jaque and A. Speghini, ACS Nano, 2011, 5, 8665–8671 CrossRef CAS PubMed.
- I. Masahiko, G. Christelle, G. Yannick, L. Kheirreddine, F. Tsuguo and B. Georges, J. Phys.: Condens. Matter, 2004, 16, 1501–1521 CrossRef.
- S. Huang, L. Gu, C. Miao, Z. Lou, N. Zhu, H. Yuan and A. Shan, J. Mater. Chem. A, 2013, 1, 7874–7879 RSC.
- S. Huang, N. Zhu, Z. Lou, L. Gu, C. Miao, H. Yuan and A. Shan, Nanoscale, 2014, 6, 1362–1368 RSC.
- S. Huang, Z. Lou, A. Shan, N. Zhu, K. Feng and H. Yuan, J. Mater. Chem. A, 2014, 2, 16165–16174 RSC.
- S. Huang, Z. Lou, N. Zhu and H. Yuan, Catal. Commun., 2015, 61, 6–10 CrossRef CAS.
- S. Huang, H. Wang, N. Zhu, Z. Lou, L. Li, A. Shan and H. Yuan, Appl. Catal., B, 2016, 181, 456–464 CrossRef CAS.
- X. Liu, W. Di and W. Qin, Appl. Catal., B, 2017, 205, 158–164 CrossRef CAS.
- M. Haase and H. Schafer, Angew. Chem., Int. Ed., 2011, 50, 5808–5829 CrossRef CAS PubMed.
- D. L. Dexter, J. Chem. Phys., 1953, 21, 836–850 CrossRef CAS.
- J. Tang, Y. Zhang, J. Gou, Z. Ma, G. Li, Y. Man and N. Cheng, J. Alloys Compd., 2018, 740, 229–236 CrossRef CAS.
- S. Som and S. K. Sharma, J. Phys. D: Appl. Phys., 2012, 45, 415102 CrossRef.
- E. W. Barrera, M. C. Pujol, F. Diaz, S. B. Choi, F. Rotermund, K. H. Park, M. S. Jeong and C. Cascales, Nanotechnology, 2011, 22, 075205 CrossRef PubMed.
- Z. E. Liu, J. Wang, Y. Li, X. Hu, J. Yin, Y. Peng, Z. Li, Y. Li, B. Li and Q. Yuan, ACS Appl. Mater. Interfaces, 2015, 7, 19416–19423 CrossRef CAS PubMed.
- J. Leng, J. Chen, D. Wang, J.-X. Wang, Y. Pu and J.-F. Chen, Ind. Eng. Chem. Res., 2017, 56, 7977–7983 CrossRef CAS.
- L. Chen, F. He, C. Shi, C. He, E. Liu, L. Ma and N. Zhao, J. Alloys Compd., 2018, 740, 719–726 CrossRef CAS.
- T. Li, S. Liu, H. Zhang, E. Wang, L. Song and P. Wang, J. Mater. Sci., 2010, 46, 2882–2886 CrossRef.
- H. Zhou, S. Xu, D. Zhang, S. Chen and J. Deng, Nanoscale, 2017, 9, 3196–3205 RSC.
- D. Yin, F. Zhao, L. Zhang, X. Zhang, Y. Liu, T. Zhang, C. Wu, D. Chen and Z. Chen, RSC Adv., 2016, 6, 103795–103802 RSC.
- Y. Liu, D. Wang, J. Shi, Q. Peng and Y. Li, Angew. Chem., Int. Ed., 2013, 52, 4366–4369 CrossRef CAS PubMed.
- Z. Wu, S. Yang and W. Wu, CrystEngComm, 2016, 18, 2222–2238 RSC.
- S. Yang, B. Zhou, Z. Ding, H. Zheng, L. Huang, J. Pan, W. Wu and H. Zhang, J. Power Sources, 2015, 286, 124–129 CrossRef CAS.
- S. Obregon and G. Colon, Chem. Commun., 2012, 48, 7865–7867 RSC.
- L. Shan and Y. Liu, J. Mol. Catal. A: Chem., 2016, 416, 1–9 CrossRef CAS.
- S. Ganguli, C. Hazra, M. Chatti, T. Samanta and V. Mahalingam, Langmuir, 2016, 32, 247–253 CrossRef CAS PubMed.
- K. Fu, J. Huang, N. Yao, X. Xu and M. Wei, Ind. Eng. Chem. Res., 2015, 54, 659–665 CrossRef CAS.
- C. Regmi, Y. K. Kshetri, S. K. Ray, R. P. Pandey and S. W. Lee, Appl. Surf. Sci., 2017, 392, 61–70 CrossRef CAS.
- S. Obregon, S. W. Lee and G. Colon, Dalton Trans., 2014, 43, 311–316 RSC.
- P. M. Martins, V. Gomez, A. C. Lopes, C. J. Tavares, G. Botelho, S. Irusta and S. Lanceros-Mendez, J. Phys. Chem. C, 2014, 118, 27944–27953 CrossRef CAS.
- S. Huang, Y. Feng, L. Han, W. Fan, X. Zhao, Z. Lou, Z. Qi, B. Yu and N. Zhu, RSC Adv., 2014, 4, 61679–61686 RSC.
- M. Samadi, M. Zirak, A. Naseri, E. Khorashadizade and A. Z. Moshfegh, Thin Solid Films, 2016, 605, 2–19 CrossRef CAS.
- C. Wang, Y. Ao, P. Wang, J. Hou and J. Qian, Appl. Surf. Sci., 2010, 257, 227–231 CrossRef CAS.
- A.-W. Xu, Y. Gao and H.-Q. Liu, J. Catal., 2002, 207, 151–157 CrossRef CAS.
- M. Wang, Y. Che, C. Niu, M. Dang and D. Dong, J. Hazard. Mater., 2013, 262, 447–455 CrossRef CAS PubMed.
- K. T. Ranjit, I. Willner, S. H. Bossmann and A. M. Braun, Environ. Sci. Technol., 2001, 35, 1544–1549 CrossRef CAS PubMed.
- A. S. Weber, A. M. Grady and R. T. Koodali, Catal. Sci. Technol., 2012, 2, 683 RSC.
- Q. Tian, W. Wu, S. Yang, J. Liu, W. Yao, F. Ren and C. Jiang, Nanoscale Res. Lett., 2017, 12, 221 CrossRef PubMed.
- K. T. Ranjit, H. Cohen, I. Willner, S. Bossmann and A. M. Braun, J. Mater. Sci., 1999, 34, 5273–5280 CrossRef CAS.
- W. Choi, A. Termin and M. R. Hoffmann, J. Phys. Chem., 1994, 98, 13669–13679 CrossRef.
- K. M. Parida and N. Sahu, J. Mol. Catal. A: Chem., 2008, 287, 151–158 CrossRef CAS.
- J. Choi, H. Park and M. R. Hoffmann, J. Phys. Chem. C, 2010, 114, 783–792 CrossRef CAS.
- D. Xu, L. Feng and A. Lei, J. Colloid Interface Sci., 2009, 329, 395–403 CrossRef CAS PubMed.
- A. Khataee, R. Darvishi Cheshmeh Soltani, Y. Hanifehpour, M. Safarpour, H. Gholipour Ranjbar and S. W. Joo, Ind. Eng. Chem. Res., 2014, 53, 1924–1932 CrossRef CAS.
- K. Feng, S. Huang, Z. Lou, N. Zhu and H. Yuan, Dalton Trans., 2015, 44, 13681–13687 RSC.
- J. Méndez-Ramos, P. Acosta-Mora, J. C. Ruiz-Morales, M. Sierra, A. Redondas, E. Ruggiero, L. Salassa, M. E. Borges and P. Esparza, Opt. Mater., 2015, 41, 98–103 CrossRef.
- J. C. Boyer and F. C. van Veggel, Nanoscale, 2010, 2, 1417–1419 RSC.
- X. Liu and M. T. Swihart, Chem. Soc. Rev., 2014, 43, 3908–3920 RSC.
- W. Liu, Q. Xu, W. Cui, C. Zhu and Y. Qi, Angew. Chem., Int. Ed., 2017, 56, 1600–1604 CrossRef CAS PubMed.
- K. Manthiram and A. P. Alivisatos, J. Am. Chem. Soc., 2012, 134, 3995–3998 CrossRef CAS PubMed.
- A. Agrawal, S. H. Cho, O. Zandi, S. Ghosh, R. W. Johns and D. J. Milliron, Chem. Rev., 2018, 118, 3121–3207 CrossRef CAS PubMed.
- D. Zhou, D. Liu, W. Xu, Z. Yin, X. Chen, P. Zhou, S. Cui, Z. Chen and H. Song, ACS Nano, 2016, 10, 5169–5179 CrossRef CAS PubMed.
- Z. Zhang, Y. Liu, Y. Fang, B. Cao, J. Huang, K. Liu and B. Dong, Adv. Sci., 2018, 1800748 CrossRef PubMed.
- X. Xie, Z. Li, Y. Zhang, S. Guo, A. I. Pendharkar, M. Lu, L. Huang, W. Huang and G. Han, Small, 2017, 13, 1602843 CrossRef PubMed.
- Y. Chen, C. Lu, L. Tang, S. Wei, Y. Song and J. Wang, Sol. Energy Mater. Sol. Cells, 2016, 149, 128–136 CrossRef CAS.
- J. Hong, Z. S. Hong, X. Cheng, C. W. Bo, W. J. Chen, L. X. Feng and Q. J. Rong, Adv. Energy Mater., 2015, 5, 1401041 CrossRef.
Footnote |
| † Contributions are equal. |
| This journal is © The Royal Society of Chemistry 2019 |