
 Open Access Article
 This Open Access Article is licensed under a Creative Commons Attribution-Non Commercial 3.0 Unported Licence
Demonstration of the nanosize effect of carbon nanomaterials on the dehydrogenation temperature of ammonia borane†
Soon Hyeong
So
 a,
Jun Ho
Jang
b,
Sae Jin
Sung
a,
Seung Jae
Yang
c,
Ki Tae
Nam
b and
Chong Rae
Park
*a
a,
Jun Ho
Jang
b,
Sae Jin
Sung
a,
Seung Jae
Yang
c,
Ki Tae
Nam
b and
Chong Rae
Park
*a
aCarbon Nanomaterials Design Laboratory, Research Institute of Advanced Materials, Department of Materials Science and Engineering, Seoul National University, Seoul 08826, Republic of Korea
bDepartment of Materials Science and Engineering, Seoul National University, Seoul 08826, Republic of Korea
cAdvanced Nanohybrids Laboratory, Department of Chemical Engineering, Inha University, Incheon, 22212, Republic of Korea
First published on 14th October 2019
Abstract
Ammonia borane (AB, NH3BH3) is a highly promising hydrogen storage material, but its high dehydrogenation temperature hinders its wide use in practice. The infiltration of AB into the pores of porous materials can lower the dehydrogenation temperature by what is known as the nanoconfinement effect. Nonetheless, it is unclear as to whether this phenomenon stems from a catalytic effect or the nanosize effect. In this work, carbon nanomaterials with a uniform pore size and with inertness to AB were chosen as nanoscaffolds without catalytic sites to control the particle size of AB. It is proved experimentally that the dehydrogenation temperature of AB is inversely proportional to the reciprocal of the particle size, which means that the nanoconfinement effect can be caused solely by the nanosize effect without a catalytic effect.
Introduction
Hydrogen is expected to emerge as a next generation green energy source due to its high gravimetric energy density (120 MJ kg−1) and environmental friendliness.1,2 It is necessary to investigate hydrogen storage to apply hydrogen energy to on-board systems, considering the ultimate Department of Energy (D.O.E.) target (6.5 wt%).3,4 Ammonia borane (AB) is considered to be a strong hydrogen storage material candidate due to its good stability under ambient conditions and theoretically high gravimetric (19.6 wt%) and volumetric energy density (152 g l−1).5,6 Three steps of the H2 release of AB have been thermally analyzed.7| nNH3BH3 (s) → [NH2BH2]n (s) + nH2 (g) at T > 100 °C | (1) |
| [NH2BH2]n (s) → [NHBH]n + nH2 (g) at T > 120 °C | (2) |
| [NHBH]n (s) → [NB]n (s) + nH2 (g) at T > 500 °C | (3) |
However, there are barriers that may hinder the use of AB as a hydrogen storage material, such as its high dehydrogenation temperature and the generation of byproducts including ammonia (NH3), diborane (B2H6), and borazine (B3H6N3).8 To overcome high dehydrogenation temperature, numerous studies have been conducted. Strategies have included adding catalysts,9,10 dispersion in ionic liquids,11,12 or exploiting the nanoconfinement effect.13–16
The nanoconfinement effect on AB in mesoporous silica led to a lower dehydrogenation temperature, with a variety of porous materials subsequently developed, such as metal–organic frameworks (MOFs), carbon nanotubes (CNT), activated carbon, mesoporous silica, and mesoporous carbon, all of which have been studied in relation to nanoconfinement.13–16
This phenomenon is understood that thermodynamic property of AB, or H2 release temperature is changed by tuning AB particle size.17 It is similar to the particles size effect on melting and freezing of metals, which is described by the Gibbs–Thomson equation.
(ΔTm: melting point difference, σ: surface tension, ρ: solid density, d: particle size, and ΔHf: fusion enthalpy change).
Other researchers insist that active or catalytic sites in materials can lower the dehydrogenation temperature as opposed to the nanosize effect. They attribute this phenomenon to unsaturated coordinated metal sites in the MOF,18 metal ions dispersed on the surface of ZIF-8,13 the synergetic catalysis of CNTs and Pt nanoparticles,19 small molecules,20 and an acid–base reaction between functional groups on activated carbon.21 In other words, some researchers reported that the catalytic properties of the support material contribute to lowering of the dehydrogenation temperature of AB. The debate over the mechanism by which AB dehydrogenation temperature is lowered has not been settled. Therefore, verification of the nanosize effect of nanoscaffolds is essential.
To this end, this study aims to clarify the correlation between the particle size of AB and the H2 desorption temperature. Among porous materials, carbon nanomaterials have the advantages of lightness, high porosity, a high specific surface area, and inertness toward AB, implying the absence of catalytic sites. Herein, various carbon nanomaterials with different main pore sizes are used as nanoscaffolds of AB and it is experimentally observed that the maximum peak dehydrogenation temperature of AB into porous carbon is inversely proportional to the AB particle size. Bearing in mind the relationship between the particle size and the dehydrogenation temperature, it is considered that MOF derived carbon (MDC) can be an excellent candidate as a nanoscaffold due to its narrow pore size distribution (0.40 nm) with the lowest maximum H2 desorption peak temperature. The H2 release performance of AB infiltrated into MDC is measured.
Results and discussion
Experimental section
Sample characterization
Temperature-programmed desorption (TPD; ASAP2920; Micromeritics) mass spectroscopy (MS; HPR220; Hiden Analytical) was used to measure the dehydrogenation temperature. The temperature was raised from room temperature to 200 °C with a ramp rate of 2 °C min−1 under a He flow at 30 ml min−1. Powder X-ray diffraction (XRD) was conducted using a D8 Advance (Bruker) with Ni-filtered CuKα radiation (λ = 0.154184 nm). Nitrogen adsorption isotherms at 77 K up to 1 bar were recorded using a Micromeritics ASAP2020 to calculate the specific surface area based on the Brunauer–Emmett–Teller (BET) method and pore size distribution based on the Horvath–Kawazoe (H–K) method for slit pores and the Barrett, Joyner, and Halenda (BJH) method using the desorption curve. The gaseous products were quantitatively analyzed by gas chromatography (PerkinElmer, NARL8502 Model 4003) equipped with an active-carbon-packed column (6′ HayeSep N60/80 SF) and molecular sieve (9′ Mol Sieve 13X 45/60 SF) at 120 °C. 0.1 ml of the gas was injected into the gas chromatograph by using a syringe at the designated time manually. The molar proportion of the products was measured by using a thermal conductivity detector (TCD) and flame ionized detector (FID) equipped with a methanizer. The amount of gas was calculated by multiplying the numerical value measured previously and the quantity of the volume of the reactor (100 ml). A differential Scanning Calorimeter (DSC; Discovery DSC; TA instrument) was utilized to calculate the activation energy of the dehydrogenation reaction. The temperature was raised from room temperature to 200 °C with a ramp rate 2 °C min−1 under an Ar flow at 30 ml min−1.Characterization of carbon nanomaterials and composites
In order to exclude the possibility of a catalytic effect, inert carbon nanomaterials are utilized here as scaffolds. The reflectance values of MDC, AC, PC, and CB are measured by FT-IR. The spectra in Fig. 1 show no certain functional groups in the carbon nanomaterials.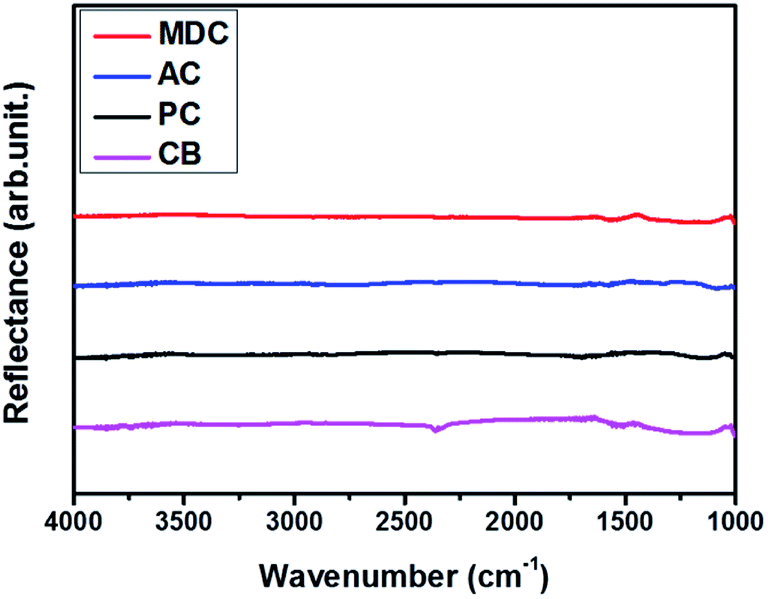 | ||
| Fig. 1 Analysis of chemical bonding of carbon nanomaterials. | ||
Fig. S1† presents the N2 isotherm at 77 K, used here to investigate the pore characteristics of each pristine sample. With a dramatic increase in the pore volume at low pressure and medium pressure levels respectively, MDC, AC, and PC are regarded as microporous materials and CB is considered to be a mesoporous material.22,23 The BET surface areas of the MDC, AC, PC, and CB materials are 2222 m2 g−1, 1093 m2 g−1, 2014 m2 g−1, and 73 m2 g−1, respectively, and the corresponding pore volumes are 2.49 cm3 g−1, 0.91 cm3 g−1, 0.96 cm3 g−1, and 0.23 cm3 g−1. The pore size distributions of MDC, AC, and PC are determined by applying the H–K method for a carbon-adsorbent surface and the slit pore geometry. And that of CB is calculated with the BJH method using desorption data, as this method is more suitable for a mesoporous structure. In Fig. 2(a) and (b), the pore volumes of MDC, AC, and PC below 2 nm increase considerably, while the pore volumes above 2 nm increase in CB, as surmised earlier. It is shown that the main pore sizes of MDC, AC, and PC are 0.40 nm, 0.44 nm, and 0.45 nm, which are in the micropore range, i.e., below 2 nm, whereas CB has a pore size of 2.17 nm, in the mesopore range (above 2 nm). For the accuracy confirmation of the value of pore size distribution, the measurements were repeated and the data are presented in Fig. S2,† which shows that the data presented here are reliable.
 | ||
| Fig. 2 Analysis of pore size distribution (a & b) by cumulative pore volume and (c & d) by differential pore volume. | ||
The structures of IRMOF-1, MDC, AB#MDC, AB, AC, AB#AC, PC, AB#PC, CB and AB#CB were investigated by XRD, with these data shown in Fig. 3. The change of the highly crystalline IRMOF-1 to amorphous carbon after a heat treatment was confirmed. The patterns of AB show sharp diffraction peaks at 23.6 (110) and 24.2 (101), as reported in earlier work,24 indicating that pristine AB exhibits a highly crystalline structure. In addition, no changes were noted in the XRD patterns of AB#MDC, AB#PC, and AB#AC in spite of the infiltration of AB, compared to the XRD patterns of the pristine samples. This indicates that AB impregnation does not affect the structures of innate carbon nanomaterials and that very fine AB amorphous powder is confined. Some may argue that no AB infiltrates into the carbon nanomaterials, as the XRD pattern of the carbon nanomaterials remains and AB diffraction is missed. However theoretically the infiltration of AB into the pores is possible due to the smaller size of AB (0.33 × 0.15 nm2)25 than the pores and due to the dramatic decrease in the N2 uptake quantity, which implies the blockage of the pores by the AB powder, as shown in Fig. S3 and Table S1.† Moreover, hydrogen desorption from AB#MDC, AB#AC, and AB#PC was detected as described later. On the other hand, the XRD pattern of AB#CB displays a sharp peak at a position identical to that in the pristine AB sample, which implies that the substantially large AB crystals are embedded in the CB. And it is notable that clear splitting of (110) and (101) peaks was observed in AB#CB in comparison with that in the pristine AB. This may be due to the smaller crystalline size relative to the bulk size and possible strain from the composites as reported by others.26,27
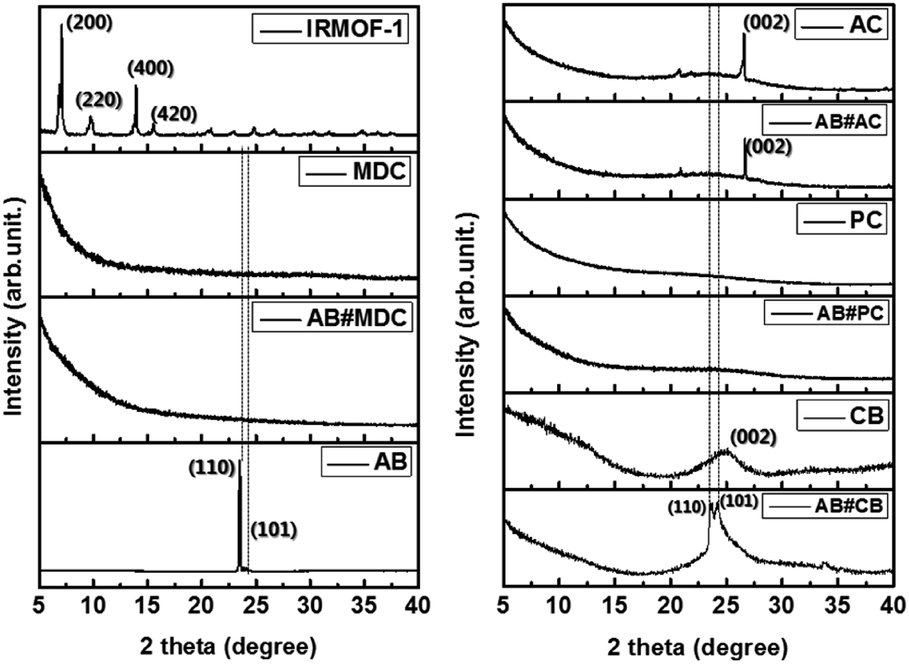 | ||
| Fig. 3 Structural analysis of materials: the change of crystallinity. | ||
The maxima H2 desorption temperatures from AB#MDC, AB#AC, AB#PC, AB#CB and pristine AB are obtained with TPD-MS and these data are plotted in Fig. 4.
 | ||
| Fig. 4 H2 desorption profile of AB#MDC (red), AB#AC (blue), AB#PC (black), AB#CB (pink), and pristine AB (orange). | ||
Maximum H2 desorption from AB#MDC, AB#AC, AB#PC, AB#CB, and pristine AB occurred at 72 °C, 75 °C, 73 °C, 96 °C and 104 °C, respectively. The lowering of the dehydrogenation temperature was clarified after the infiltration of AB into the carbon nanomaterials. Moreover, the lack of overlap between the H2 desorption temperature of the pristine AB and those of the composites signifies the absence of bulk pristine AB on the surface of the carbon nanomaterials.
To verify the nanosize effect, studying the effect of the AB particle size on the H2 desorption temperature is essential. The correlation between the particle size and the decomposition temperature agrees with the correlation between the pore sizes of carbon nanomaterials and the dehydrogenation temperature, as AB particles are confined in the pores of carbon nanomaterials at a certain size. With the pore size data of carbon nanomaterials, a good linear correlation between the reciprocal of particle size and dehydrogenation temperature at R2: 0.950 is confirmed, as shown in Fig. 5. This plot is more meaningful given the characteristics of microporous carbon (1.08 nm)14 and Cryogel with a controllable pore size (7 nm and 16 nm)26 studied by other researchers (violet) as considered here.
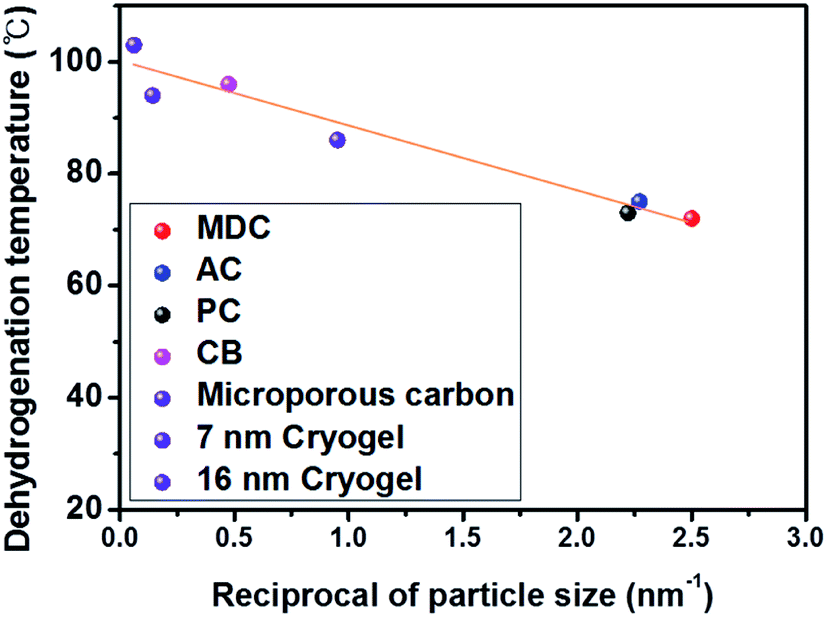 | ||
| Fig. 5 H2 desorption peak temperature vs. the reciprocal of the particle size of AB. | ||
Decomposition of the AB#MDC composite
MDC exhibits the lowest H2 desorption temperature, motivating us to obtain the exact quantity of released hydrogen. Considering that the temperature is 72 °C and the D.O.E. target temperature range is below 85 °C, heat treatments were conducted at 60 °C, 70 °C, and 80 °C. It is thought that a thermogravimetric analysis (TGA), used by other researchers, would not be adequate for obtaining the emitted H2 quantity here, as several types of unknown gases may evolve during the reaction. In fact, Moussa et al.21 conducted an additional experiment with a portable micro-chromatograph when obtaining the amount of H2 gas, demonstrating that TGA data included not only H2 but also NH3. Moreover Zhao et al.28 noted that the weight loss percent obtained by TGA exceeded the theoretical value of useable H2 and it was mentioned that unknown impurities other than H2 and NH3 were included in the data. Therefore, it is better to utilize gas chromatography to measure the separate quantity of evolved H2 precisely.Evolved gases from samples are detected after heat treatments at 60 °C, 70 °C, and 80 °C for 30 min. These values are calculated using the equation shown below.

At 60 °C, pristine AB exhibited no hydrogen evolution, as reported previously.29 Minimal increases in the quantity of the evolved H2, 2.8 × 10⁻² wt% at 70 °C and 3.3 × 10⁻² wt% at 80 °C, are shown in Table S2.† AB#MDC releases 3.6 wt% (0.6 equivalent H2), 5.7 wt% (0.9 equivalent H2), and 7.1 wt% (1.1 equivalent H2) from AB within 30 min at 60 °C, 70 °C, and 80 °C respectively. When the weight of both MDC and AB is considered, it can be said that amounts of 2.4 wt%, 3.8 wt%, and 4.7 wt% H2 are released within 30 min at 60 °C, 70 °C, and 80 °C respectively. The raw gas chromatography data for each sample are shown in Fig. 6, and the data needed to calculate the weight percent of the released H2 are also given in Table S2.† And the performances of the samples mentioned are visualized in Fig. 7. The performances of AB#MDC, contingent upon inclusion of the weight of MDC, are shown here.
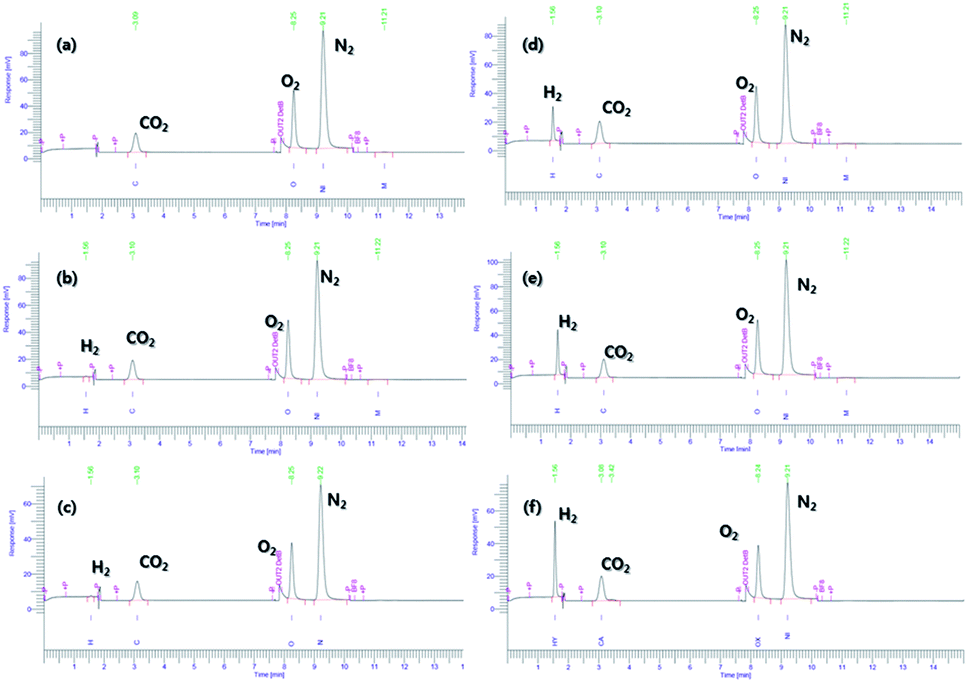 | ||
| Fig. 6 Gas chromatographic separation of H2 from pristine AB for 30 min at 60 °C (a), 70 °C (b), and 80 °C and (c) & AB#MDC for 30 min at 60 °C (d), 70 °C (e), and 80 °C (f). | ||
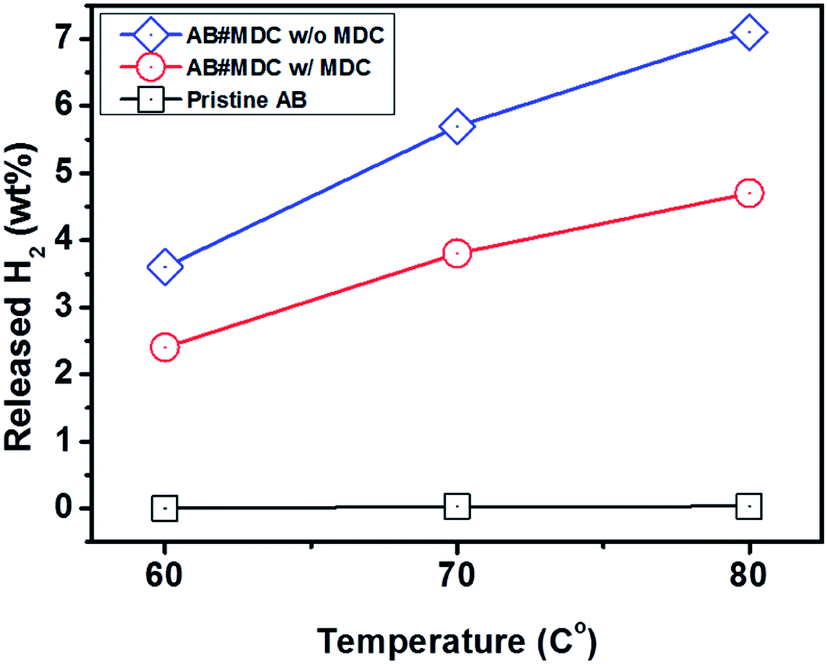 | ||
| Fig. 7 Hydrogen release performance of pristine AB and AB#MDC for 30 min at 60 °C, 70 °C, and 80 °C. | ||
In fact, when measuring the quantity of released H2, the samples cannot be dried at a high temperature under extreme vacuum conditions perfectly due to the loss of hydrogen gas. With regard to the likelihood of residual THF solvent, an additional experiment to test its effect on the H2 release outcome was done. The samples were prepared using the synthesis method of AB#MDC without MDC. They were heated to 60 °C, 70 °C, and 80 °C for 30 min and the evolved H2 quantities were measured with gas chromatography. The effect of the existence of THF on the performance was determined by measuring the increase in the amount of released H2 compared to that of pristine AB. Zimmerman et al.30 showed the deviation of the dehydrogenation of AB in THF from the dehydrogenation pathway in the gas phase via a computational study and demonstrated that the formation of the diammoniate of diborane contributes to the lower barrier of dehydrogenation. However, the degree of the increase of the amount is not much as presented in Table S3.†
To prove further that ammonia borane is infiltrated into carbon materials well, the analysis of the pore size of AB#MDC was conducted. After infiltration of AB into MDC, sharply decreasing pore volume of each pore size is confirmed in Fig. S4† and this fact supports the fact that the pore size can be regarded as the particle size of AB.
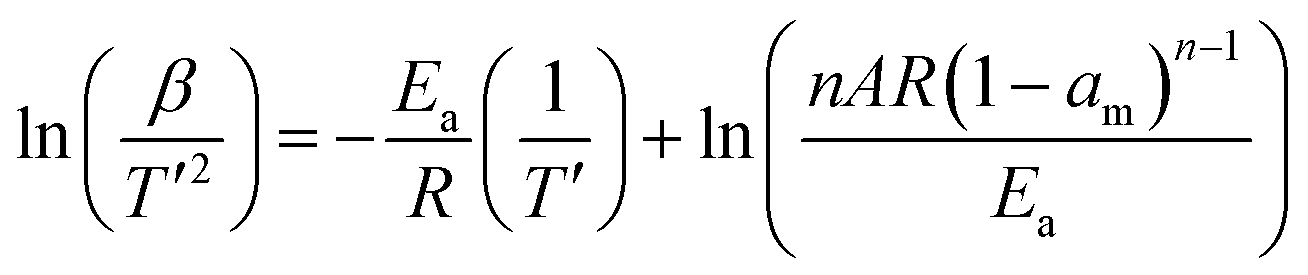
When referring to the lowering of the dehydrogenation temperature and faster kinetics, it is natural to evaluate the activation energy of the dehydrogenation reaction for AB#MDC and pristine AB. The activation energy was calculated by non-isothermal DSC measurement at different heating rates, based on the Kissinger equation used to analyze the reaction kinetics.31
 | ||
| Fig. 8 Kissinger plot of AB#MDC and pristine AB for calculating the activation energy of the H2 evolution reaction. | ||
The analysis of evolution of other gases, ammonia, diborane, and borazine, from AB#MDC is conducted with TPD-MS. The data are shown in Fig. S6.† Both diborane and borazine are not detected and ammonia is not suppressed as previous studies.
To analyze the difference in the composition of AB#MDC after thermolysis at 80 °C, the chemical bonding characteristics are investigated by FT-IR. NH stretching vibrations (3313 cm−1), BH stretching vibrations (2326 cm−1), NH3 asymmetric deformation (1599 cm−1), NH3 symmetric deformation (1376 cm−1), BH3 deformation (1158 cm−1), and NBH rocking (1059 cm−1)24,32 are detected in AB#MDC before thermolysis as shown in Fig. 9. NH stretching vibrations (3313 cm−1), BH stretching vibrations (2324 cm−1), NH3 asymmetric deformation (1601 cm−1), NH3 symmetric deformation (1375 cm−1), BH3 deformation (1157 cm−1), and NBH rocking (1061 cm−1) in the FT-IR data of pristine AB are also confirmed. Considering that the wavenumbers of each maximum peak are nearly identical, it can be concluded that the AB bonding characteristics remain after infiltration. The FT-IR data of AB#MDC after thermolysis at 80 °C indicate that the peaks substantially disappear. It is understood that the release of H2 from N and B causes the NH and BH bonds to break.
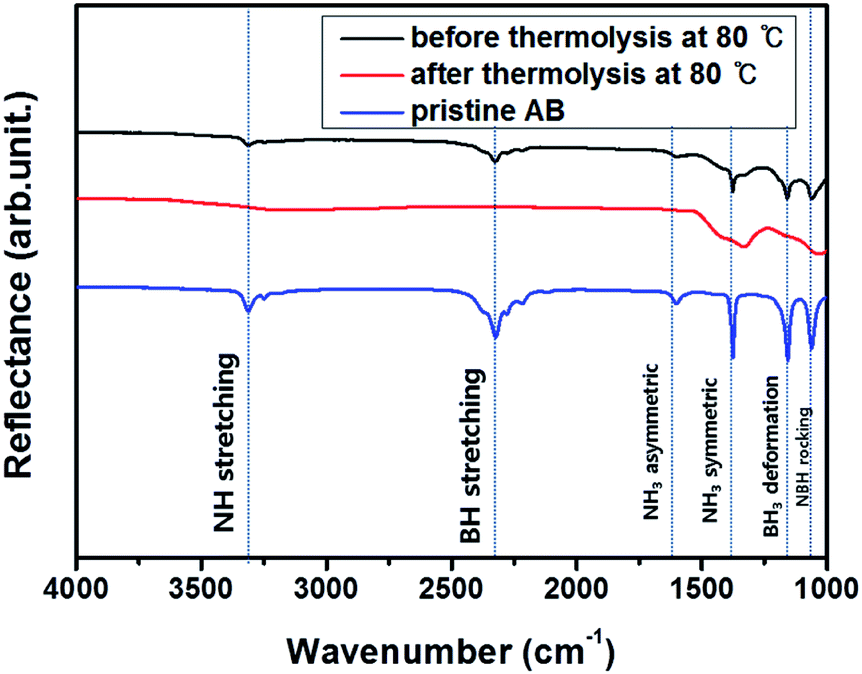 | ||
| Fig. 9 Chemical analysis of AB#MDC before thermolysis (black) and after thermolysis (red), and pristine AB (blue). | ||
The results of earlier work which attempted to lower the temperature during AB dehydrogenation by means of a nanoconfinement effect are examined. The data from these experiments are presented in Table S4† under the same experimental conditions as ours. It should be noted that the released H2 wt% based on the weight of whole materials is the practical value as used here, while other researchers include the weight of only pristine AB when calculating the weight percent of released H2. Diverse materials were assessed as nanoscaffolds for the nanoconfinement effect as shown Fig. 10. It is found that our sample shows high performance compared to the others.
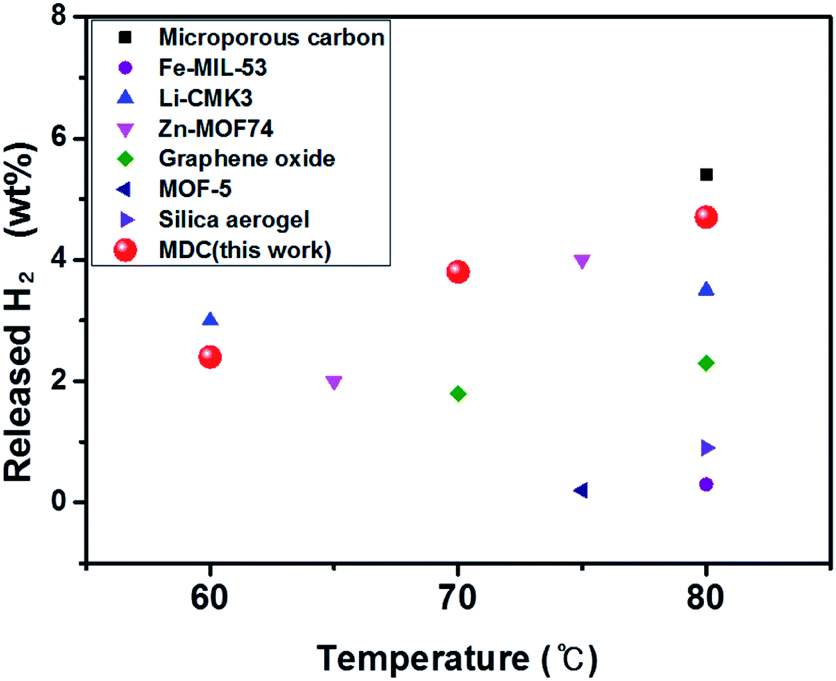 | ||
| Fig. 10 Comparison of the performances of AB infiltrated porous materials below 80 °C, which were obtained in this work and precedent research. | ||
Conclusions
This work proves the nanosize effect given the result of a linear correlation between the reciprocal of the particle size of AB and the maximum H2 desorption temperature. The AB particle size is controlled by confinement into the pores of diverse carbon nanomaterials. Well confined AB in carbon nanomaterials is identified by an analysis of the crystallinity and the desorption profile. MDC has the smallest pore size (0.40 nm) and the lowest decomposition peak (72 °C) without catalysts, as displayed in the AB#MDC sample here. In view of the results of our work, MDC can be considered as an excellent nanoscaffold capable of high H2 emission performance (4.7 wt%) in AB#MDC. This report is expected to help clarify the mechanism of dehydrogenation of ammonia borane and further work is required to reach much higher H2 release performance under mild conditions by considering other variables that affect the performance other than the nanosize effect.Conflicts of interest
There are no conflicts to declare.Acknowledgements
This research was supported by a grant from the Korea Institute of Science and Technology Open Research Program (Grant No. 2E29552), by the Creative Materials Discovery Program through the National Research Foundation of Korea (NRF) funded by the Ministry of Science and ICT (NRF-2017M3D1A1039377), and by the Hydrogen Energy Innovation Technology Development Business through NRF funded by the Ministry of Science and ICT (NRF-2019M3E6A1065218). The authors are thankful to The Research Institute of Energy and Resources, Seoul National University.References
- H. T. Hwang and A. Varma, Curr. Opin. Chem. Eng., 2014, 5, 42–48 CrossRef.
- D. Zhao, D. Yuan and H. C. Zhou, Energy Environ. Sci., 2008, 1, 222–235 RSC.
- S. U. Rather, Int. J. Hydrogen Energy, 2019, 44, 325–331 CrossRef CAS.
- S. Seenithurai and J. D. Chai, Sci. Rep., 2018, 8, 13538 CrossRef PubMed.
- S. Akbayrak and S. Özkar, Int. J. Hydrogen Energy, 2018, 43, 18592–18606 CrossRef CAS.
- C. Wang, D. Sun, X. Yu, X. Zhang, Z. Lu, X. Wang, J. Zhao, L. Li and X. Yang, Inorg. Chem. Front., 2018, 5, 2038–2044 RSC.
- M. G. Hu, R. A. Geanangel and W. W. Wendlandt, Thermochim. Acta, 1978, 23, 249–255 CrossRef CAS.
- Q. Lai, K. F. Aguey-Zinsou and U. B. Demirci, Int. J. Hydrogen Energy, 2018, 43, 14498–14506 CrossRef CAS.
- L. Li, X. Yao, C. Sun, A. Du, L. Cheng, Z. Zhu, C. Yu, J. Zou, S. C. Smith, P. Wang, H. M. Cheng, R. L. Frost and G. Q. Lu, Adv. Funct. Mater., 2009, 19, 265–271 CrossRef CAS.
- C. Han, P. Meng, E. R. Waclawik, C. Zhang, X. H. Li, H. Yang, M. Antonietti and J. Xu, Angew. Chem., Int. Ed., 2018, 57, 14857–14861 CrossRef CAS PubMed.
- M. E. Bluhm, M. G. Bradley, R. Butterick III, U. Kusari and L. G. Sneddon, J. Am. Chem. Soc., 2006, 128, 7748–7749 CrossRef CAS PubMed.
- J. W. Makepeace, T. He, C. Weidenthaler, T. R. Jensen, F. Chang, T. Vegge, P. Ngene, Y. Kojima, P. E. de Jongh, P. Chen and W. I. F. David, Int. J. Hydrogen Energy, 2019, 44, 7746–7767 CrossRef CAS.
- G. Srinivas, W. Travis, J. Ford, H. Wu, Z. X. Guo and T. Yildirim, J. Mater. Chem. A, 2013, 1, 4167–4172 RSC.
- Z. Yang, D. Zhou, B. Chen, Z. Liu, Q. Xia, Y. Zhu and Y. Xia, J. Mater. Chem. A, 2017, 5, 15395–15400 RSC.
- Z. Li, W. Liu, H. Yang, T. Sun, K. Liu, Z. Wang and C. Niu, RSC Adv., 2015, 5, 10746–10750 RSC.
- M. Rueda, L. M. Sanz-Moral, J. J. Segovia and Á. Martín, Microporous Mesoporous Mater., 2017, 237, 189–200 CrossRef CAS.
- M. A. Wahab, H. Zhao and X. D. Yao, Front. Chem. Sci. Eng., 2012, 6, 27–33 CrossRef CAS.
- S. Gadipelli, J. Ford, W. Zhou, H. Wu, T. J. Udovic and T. Yildirim, Chem.–Eur. J., 2011, 17, 6043–6047 CrossRef CAS PubMed.
- S. F. Li, Y. H. Guo, W. W. Sun, D. L. Sun and X. B. Yu, J. Phys. Chem. C, 2010, 114, 21885–21890 CrossRef CAS.
- C. Huang, Y. Huang, C. Liu, Y. Yu and B. Zhang, Angew. Chem., Int. Ed., 2019, 58, 12014–12017 CrossRef CAS PubMed.
- G. Moussa, S. Bernard, U. B. Demirci, R. Chiriac and P. Miele, Int. J. Hydrogen Energy, 2012, 37, 13437–13445 CrossRef CAS.
- S. J. Yang, H. Jung, T. Kim, J. H. Im and C. R. Park, Int. J. Hydrogen Energy, 2012, 37, 5777–5783 CrossRef CAS.
- S. J. Yang, T. Kim, J. H. Im, Y. S. Kim, K. Lee, H. Jung and C. R. Park, Chem. Mater., 2012, 24, 464–470 CrossRef CAS.
- A. S. Nathanson, A. R. Ploszajski, M. Billing, J. P. Cook, D. W. K. Jenkins, T. F. Headen, Z. Kurban, A. Lovell and S. M. Bennington, J. Mater. Chem. A, 2015, 3, 3683–3691 RSC.
- W. T. Klooster, T. F. Koetzle, P. E. M. Siegbahn, T. B. Richardson and R. H. Crabtree, J. Am. Chem. Soc., 1999, 121, 6337–6343 CrossRef CAS.
- S. Sepehri, B. B. Garcia and G. Cao, J. Mater. Chem., 2008, 18, 4034–4037 RSC.
- B. Palosz, S. Stel'makh, E. Grzanka, S. Gierlotka, R. Pielaszek, U. Bismayer, S. Werner and W. Palosz, J. Phys.: Condens. Matter, 2004, 16, S353–S377 CrossRef CAS.
- J. Zhao, J. Shi, X. Zhang, F. Cheng, J. Liang, Z. Tao and J. Chen, Adv. Mater., 2010, 22, 394–397 CrossRef CAS PubMed.
- S. D. Rassat, C. L. Aardahl, T. Autrey and R. S. Smith, Energy Fuels, 2010, 24, 2596–2606 CrossRef CAS.
- P. M. Zimmerman, Z. Zhang and C. B. Musgrave, J. Phys. Chem. Lett., 2011, 2, 276–281 CrossRef CAS.
- H. E. Kissinger, Anal. Chem., 1957, 29, 1702–1706 CrossRef CAS.
- J. Zhang, Y. Zhao, D. L. Akins and J. W. Lee, J. Phys. Chem. C, 2011, 115, 8386–8392 CrossRef CAS.
Footnote |
| † Electronic supplementary information (ESI) available: N2 isotherms at 77 K, DSC runs, pore volume and SSA data, and comparison of the performances. See DOI: 10.1039/c9na00501c |
| This journal is © The Royal Society of Chemistry 2019 |