
 Open Access Article
 This Open Access Article is licensed under a Creative Commons Attribution-Non Commercial 3.0 Unported Licence
Rapid synthesis of defective and composition-controlled metal chalcogenide nanosheets by supercritical hydrothermal processing†
Yuta
Nakayasu
*a,
Siobhan
Bradley
b,
Hiroaki
Kobayashi
a,
Keiichiro
Nayuki
c,
Yoshikazu
Sasaki
c,
Takaaki
Tomai
 a,
Thomas
Nann
d and
Itaru
Honma
*a
a,
Thomas
Nann
d and
Itaru
Honma
*a
aIMRAM, Tohoku University, 2-1-1 Katahira, Aoba-ku, Sendai, Miyagi 980-8577, Japan. E-mail: nakayasu@tohoku.ac.jp; itaru.homma.e8@tohoku.ac.jp; Fax: +81 22(217)5828; Tel: +81 22(217)5816
bARC Centre of Excellence in Exciton Science, School of Chemistry, The University of Melbourne, Parkville, Victoria 3010, Australia
cField Solution Division, JEOL Ltd., Tokyo 196-0022, Japan
dSchool of Mathematical and Physical Sciences, The University of Newcastle, Callaghan, NSW 2308, Australia
First published on 13th August 2019
Abstract
This study presents a simple one-pot synthesis method to achieve few-layered and defective Mo(S,Se)2 and (Mo,W)S2 by using supercritical water with organic reducing agents from simple and less-toxic precursors. This synthesis process is expected to be suitable for preparing other various kinds of TMD solid solutions.
Two-dimensional transition metal dichalcogenides (TMDs), such as MoS2, MoSe2, WS2, NbS2, and TaS2, are attracting much attention as energy-related materials for electrode catalysts, battery electrodes, and field effect transistors.1,2 In particular, TMD materials are expected to be promising hydrogen evolution reaction (HER) catalysts.3,4 In 2H-MoS2 and 2H-WS2, the HER activity increases with increasing ratio of edges to the total volume,5,6 and the S-vacancies also contribute significantly to the electrocatalytic properties of MoS2.7 In addition, high HER activities have been demonstrated with few-layered TMDs with composition control.8–10 Generally, solid-solutions of alloys such as Mo(S,Se)2 and (Mo,W)S2 are synthesized by a chemical vapor deposition (CVD) process11,12 and a physical vapor deposition (PVD) process.13,14 CVD and PVD processes can produce large single crystal domains and continuous films of TMD solid solutions, while, they are not suitable for mass production of edge-rich structured materials.
Materials synthesis based on the use of supercritical fluids (SCFs) has various advantages, such as the dispersibility owing to its natural convection and the fast reaction rate due to the high diffusion rate of solute.15–17 Our group previously fabricated Cu2ZnSnS4−xSex thin films for the absorbing layer of solar cells18 and synthesized few-layered and defect-rich MoS2−xSex (ref. 19) as an HER catalyst using metal oxides as metal sources, pure sulfur and selenium or selenium oxide as chalcogen sources, and supercritical ethanol (scEtOH) as a solvent. scEtOH has a high reductive power and plays a critical role in reducing metal oxides. This method is easy for mass production of solid solutions owing to the short reaction time and is henceforth referred to as the SCF sulfurization and selenization (chalcogenization) process.
The hydrothermal process is a well-known materials synthesis process using water as a solvent at high-temperature and high-pressure. Previously, synthesis of MoS2 nanosheets for the HER was demonstrated using the hydrothermal process from MoO3 and thiourea precursors.20 This study proved that metal phases and semiconductor phases of MoS2 can be synthesized depending on temperature. However, this process requires a long reaction time (12 h) for synthesizing MoS2.
In this study, we developed a process using supercritical water (SCW) instead of scEtOH under reductive and acidic conditions to achieve simple rapid synthesis of few-layered and defect-rich TMD solid solutions with high yield. This study focused on the synthesis of MoSe2, MoS2, WS2, Mo(S,Se)2, and (Mo,W)S2 nanosheets from MoO3, WO3, pure sulfur, and selenium at 400 °C for 30–60 min. We achieved the synthesis of TMDs using metal oxides and pure chalcogen sources under supercritical hydrothermal conditions.
The composition of Mo(S,Se)2 was controlled by changing the molar ratio of the S and Se sources, while that of (Mo,W)S2 was controlled by changing the molar ratio of the MoO3 and WO3 sources. To achieve the reductive and acidic conditions in SCW, ascorbic acid with a redox potential of 0.390 V (vs. SHE) as a reducing agent dissolved in water was employed for MoS2, Mo(S,Se)2, and MoSe2. On the other hand, since the reduction reaction from tungsten trioxide to tungsten dioxide has a lower reduction potential than that of molybdenum trioxide, formic acid with a redox potential of −0.199 V (vs. SHE) dissolved in water was used for synthesizing WS2 and (Mo,W)S2. Detailed experimental methods are presented in the ESI.†
We analyzed the products using X-ray photoelectron spectroscopy (XPS) and the results are shown in Table S2.† All products showed almost stoichiometric compositions. After ball milling mixtures of MoO3 and WO3, the Mo![[thin space (1/6-em)]](https://www.rsc.org/images/entities/char_2009.gif) :W ratio was around 0.5:0.5, and this ratio did not change significantly after SCF sulfurization. The hexavalent Mo and W peaks had a very low intensity. Hence, it was concluded that the reduction process by ascorbic acid and formic acid had progressed sufficiently during processing. Other elemental composition analyses are shown in the ESI.†
:W ratio was around 0.5:0.5, and this ratio did not change significantly after SCF sulfurization. The hexavalent Mo and W peaks had a very low intensity. Hence, it was concluded that the reduction process by ascorbic acid and formic acid had progressed sufficiently during processing. Other elemental composition analyses are shown in the ESI.†
The results of detailed materials characterization of the MoSe2, Mo(S,Se)2, and MoS2 are shown in Fig. 1(a–c). As shown in the X-ray diffraction (XRD) patterns in Fig. 1(a), after SCF chalcogenization of the MoO3 precursors, only broad peaks corresponding to MoSe2, Mo(S,Se)2, and MoS2, i.e., (100), (103), and (110), were observed. The diffraction patterns were very similar to those of the bulk materials,18 except that the (002) peak, which is related to stacked layers, was not observed for our samples (indicating that they were composed of a small number of layers). In fact, the formation of few-layered MoS2 and a high monolayer content in the synthesized MoSe2 were verified from the Raman spectrum shown in Fig. S2.† The XRD peaks of Mo(S,Se)2 were located between the ones of MoS2 and MoSe2, attributed to the variation of the lattice constant as a result of the substitution of S atoms by larger Se atoms, demonstrating their mixing at the atomic level.
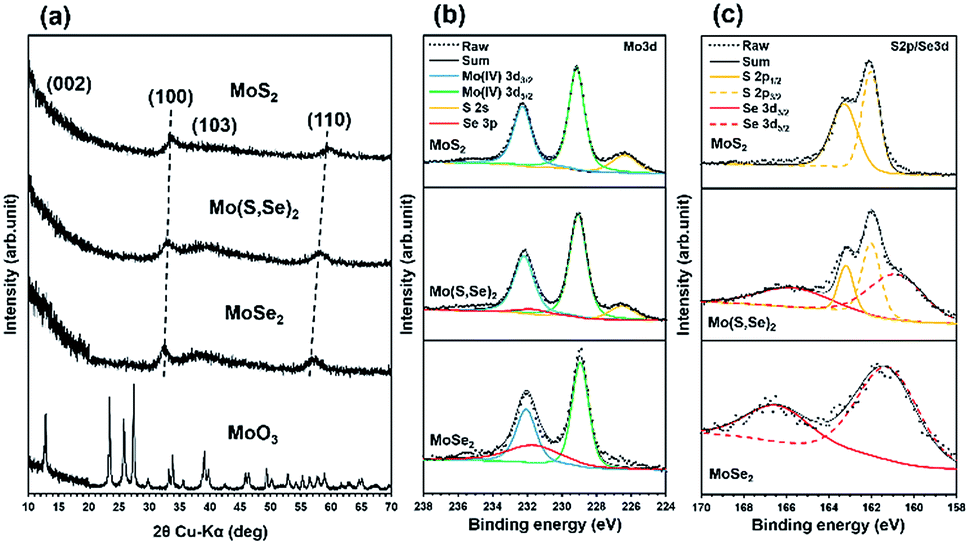 | ||
| Fig. 1 The materials characterization of synthesized MoSe2, Mo(S,Se)2, and MoS2. (a) XRD patterns, (b) XPS spectra of Mo 3d, and (c) XPS spectra of S 2p/Se 3d. | ||
Fig. 1(b) shows the peaks for Mo 3d, S 2s, and Se 3p from high-resolution XPS spectra of MoSe2, Mo(S,Se)2, and MoS2. The binding energies were calibrated using the C 1s peak. Based on the valence states, the trigonal prismatic 2H phase was identified from the XPS spectra.18 Tetravalent Mo 3d5/2 and Mo 3d3/2 peaks were observed at ∼229 eV and ∼232 eV, respectively. It was confirmed that the peak intensity of S 2s increased after sulfur addition. Fig. 1(c) shows the peaks for S 2p and Se 3d from the products. For Mo(S,Se)2, both peaks derived from sulfur and selenium were observed.
Results of the materials characterization of (Mo,W)S2 and WS2 are shown in Fig. 2(a–c). All spectra of MoS2 are the same as those shown in Fig. 1(a–c). The XRD patterns of (Mo,W)S2, WS2, and metal oxide precursors are shown in Fig. 2(a). After SCF sulfurization for the precursors, peaks due to the metal oxide precursors were not detected and only broad peaks corresponding to (Mo,W)S2 and WS2, i.e., (002), (100), (103), and (110), were observed. The (002) peak suggesting thicker stacking structures was observed for (Mo,W)S2 and WS2. In addition, the XRD pattern of (Mo,W)S2 showed peak broadening due to be interstitial distortion in the planar direction due to mixing of Mo and W. The broadening tendency was shown in a previous report.10 The peak positions for (Mo,W)S2 were very similar to those for MoS2 and WS2.
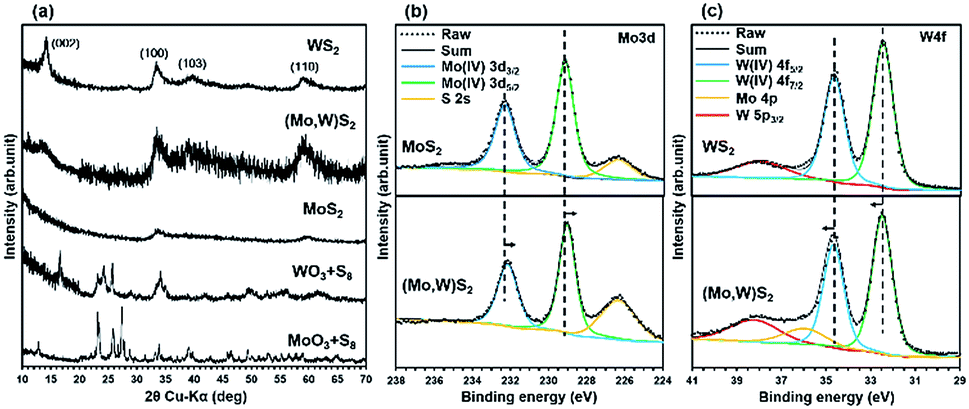 | ||
| Fig. 2 The materials characterization of synthesized MoS2, (Mo,W)S2, and WS2. (a) XRD patterns compared to the respective precursor sources. XPS spectra of (b) Mo 3d for (Mo,W)S2 and MoS2 and (c) W 4f for (Mo,W)S2 and WS2. | ||
Fig. 2(b and c) show XPS spectra of Mo 3d and W 4f in the synthesized (Mo,W)S2 nanosheets. For comparison, we also measured the XPS spectra of MoS2 and WS2 synthesized by SCF sulfurization. As for both samples, the trigonal prismatic 2H phase was identified. The core levels of Mo 3d3/2 at 232.1 eV and Mo 3d5/2 at 228.9 eV from the (Mo,W)S2 sample showed slightly lower binding energies than those of the synthesized MoS2, while W 4f5/2 (at 34.7 eV) and W 4f7/2 (at 32.5 eV) from (Mo,W)S2 had slightly higher binding energies than those in the synthesized WS2. In previous reports,12,21 a similar peak shift was confirmed. The observed shifts in Mo 3d and W 4f core levels indicate changes in the composition by the incorporation of W in (Mo,W)S2. This phenomenon was expected as the electron affinity of W (0.816 eV)22 is larger than that of Mo (0.747 eV).23 Hence, the monotonic shifts in the core levels of Mo 3d and W 4f suggest that the W atoms were randomly substituted for Mo in the 2D crystal lattice of MoS2 without any phase separation. Further results of characterization of the solid solutions using EXAFS analyses are shown in Fig. S3 and S4.†
Transmission electron microscopy (TEM) images of MoSe2, Mo(S,Se)2, MoS2, (Mo,W)S2, and WS2 after SCF chalcogenization of precursor sources are shown in Fig. 3(a–e). Flower-like edge-exposed structures composed of nanosheets (1–5 layers) with diameters of 50–200 nm were observed for MoSe2, Mo(S,Se)2, and MoS2 synthesized under supercritical hydrothermal conditions with ascorbic acid. Although similar flower-like structures were synthesized using a supercritical ethanol process in our previous work,18 in this study, we successfully synthesized thinner layer MoSe2, Mo(S,Se)2, and MoS2 using a supercritical hydrothermal process. In contrast, (Mo,W)S2 and WS2 synthesized using formic acid had plate-like structures, which was attributed to the different reducing agent. With ascorbic acid as a reducing agent, the dispersed acid molecules prevented aggregation of the chalcogenide layers due to its large molecular size, while formic acid has a smaller molecular size, and the chalcogenide layers were aggregated and restacked. It can be seen that WS2 has a larger basal area and thickness than (Mo,W)S2, suggesting that distortion of the basal plane occurs due to the difference in atomic radii between Mo and W, and crystal growth did not proceed in the uniform plane direction.
 | ||
| Fig. 3 TEM images of synthesized (a) MoSe2, (b) Mo(S,Se)2, (c) MoS2, (d) (Mo,W)S2 and (e) WS2. HAADF-STEM images and line scans along the atomic rows of (f) Mo(S,Se)2 and (g) (Mo,W)S2. | ||
The High-Angle Annular Dark Field Scanning TEM (HAADF-STEM) images of Mo(S,Se)2 and (Mo,W)S2 are shown in Fig. 3(f) and (g), respectively. From the image of the monolayer region according to Fig. 3(f) and (g), we analyzed the atomic distribution in the sheet. In both cases, the trigonal prismatic 1H phase was predominantly observed, with a defective structure. The chalcogen sites in 1H-MoS2 overlap with each other vertically, and when observed from the Z axis direction with respect to the plane, it is possible to obtain the signal strength of chalcogen elements for two sites. Generally, the contrast of the HAADF image is approximately proportional to the atomic number to the power of 1.7,24 which was consistent with the following combinations with contrast increasing in the order of S + defect (111), S + S (223), Se + defect (401), S + Se (513), Mo (575), Se + Se (803), and W (1506), where the numbers refer to the sum of the atomic number to the power of 1.7. In Fig. 3(f) for Mo(S,Se)2, the bright areas were attributed to Mo atoms, and the center of the triangle composed of neighboring Mo atoms should be the position of chalcogen atoms. The brightness should be higher for the combinations with Se compared to S + S. Hence, yellow dots show Se + defect, S + Se or Se + Se sites. In Fig. 3(g), since W has a high atomic number (and hence, contrast), it is easy to differentiate W from Mo (darker areas) and thus the blue dots represent the tungsten sites. From the both HADDF-STEM images, the formation of solid solutions in which each element was well dispersed was confirmed. It seems that sulfur, selenium, molybdenum oxide, and tungsten oxide were uniformly mixed due to the high solubility and dispersibility of SCW, and the reaction progressed uniformly.
To verify the effect of solid-solution formation, the electrocatalytic HER activity of five different samples was evaluated considering the onset potential, overpotential, and Tafel slope, where lower values of all of these parameters indicate better HER performance. Here, the adjustment in hydrogen adsorption free energy (ΔGH) by composition control is a key factor determining the function of HER catalysts, where ΔGH = 0 is the optimum value as the HER proceeds via a series of hydrogen adsorption and desorption steps on the surface of the catalyst.25 It was proposed that the edges of Mo(S,Se)2 and (Mo,W)S2 can have intermediate ΔGH values between 60 meV for MoS2 and about −40 meV for MoSe2 and WS2.26 Indeed, it has been previously reported that MoS2−xSex25 and Mo1−xWxS226 have HER properties higher than pure MoS2, MoSe2, and WS2 by the solid solutions. Therefore, controlling the relative composition enables optimization of ΔGH to near 0 and hence, improves the HER performance according to the Sabatier plot for the HER.
Fig. 4(a–d) show current–potential (I–V) curves from linear sweep voltammetry (LSV) tests and the corresponding Tafel plots. Synthesized pure MoS2, MoSe2 and WS2 showed a lower overpotential and Tafel slope, respectively than those of each bulk one.27,28 This can be attributed to the fact that synthesized MoS2, WS2 and MoSe2 have more edges than bulk ones as shown in Fig. 1 and the result of EXAFS (see ESI†). At the early LSV cycle, Mo(S,Se)2 and (Mo,W)S2 showed a smaller onset potential (∼90 mV) and overpotential (222 mV) at 10 mA cm−2 than synthesized pure MoS2, MoSe2, and WS2. It is proposed that controlling the relative composition of S and Se for Mo(S,Se)2, and Mo and W for (Mo,W)S2 shifted ΔGH toward 0, resulting in a smaller overpotential. In addition, the Tafel slopes were in the range of 70–95 mV dec−1 at the early cycle. MoSe2 should have a lower ΔGH value than those of MoS2 and Mo(S,Se)2, where hydrogen tended to adsorb on the surface. After turning a long LSV cycle, although a decrease in the Tafel slope was confirmed, the onset potential and overpotential of (Mo,W)S2 showed a slight increase, suggesting some decrease in HER activity. Meanwhile, a decrease in the onset potential (80 mV), overpotential (198 mV at 10 mA cm−2), and Tafel slope (66 mV dec−1) of Mo(S,Se)2 was observed with increasing cycle number. It is hypothesized that the improved HER activity of Mo(S,Se)2 compared to the control samples was due to dissolved amorphous Se (see ESI†) in the test cell. These results show that, by forming solid solutions, the electrocatalytic HER performance was improved compared with pure samples. On the other hand, the HER performance is somewhat inferior to that of the Pt/C electrode with the highest HER activity27 and Mo(S,Se)2 and (Mo,W)S2 synthesized by solvothermal or hydrothermal processing in previous reports shown in Table S4.† However, there are advantages to our process in synthesis reaction time (<60 min) and process simplicity (one-pot, simple and less-toxic precursors). In this study, although the HER activities of synthesized Mo(S,Se)2 and (Mo,W)S2 did not reach those of Pt/C and the state of the art electrodes, by properly controlling the ratio of Mo, W, S, Se and other elements such as Ta, Nb, Co and Pt, it is possible to obtain higher HER activity approaching that of Pt/C.
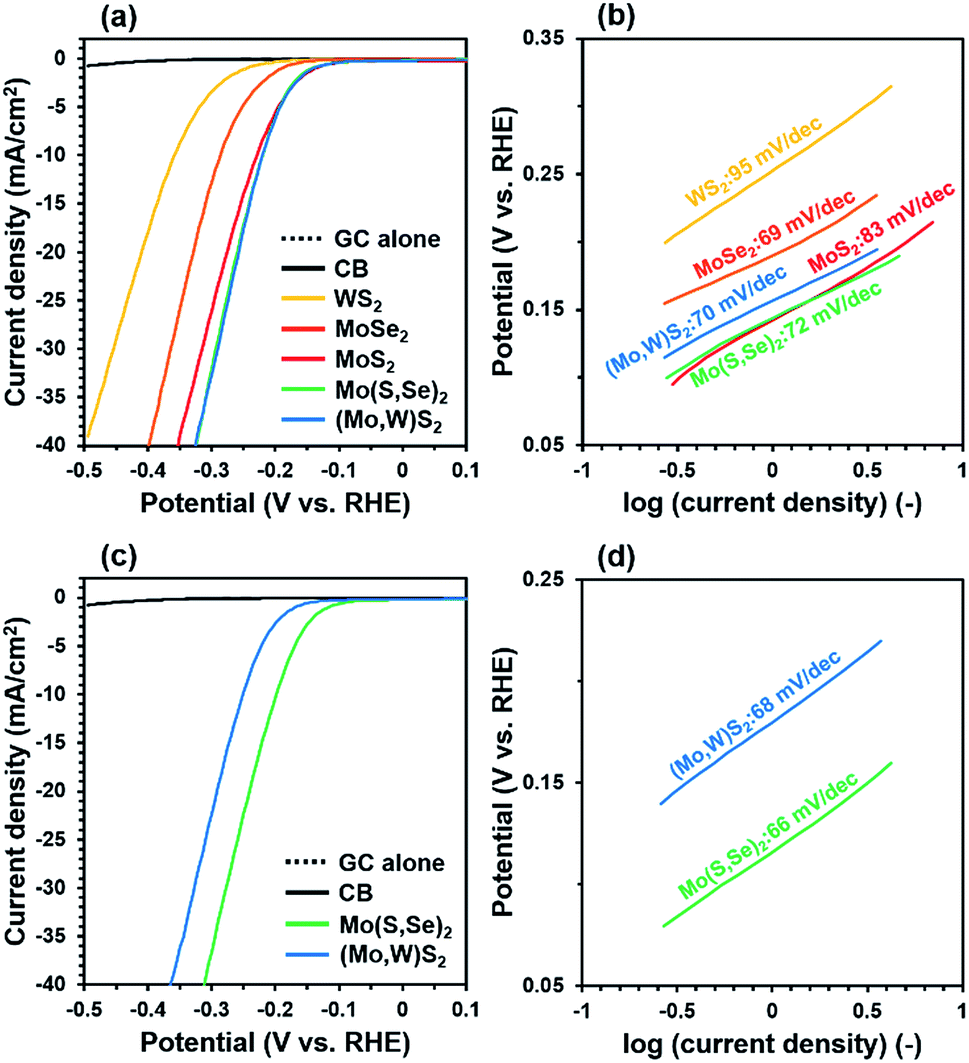 | ||
| Fig. 4 (a) Current–potential curves at 10 mV s−1 for the 3rd cycle, and (b) Tafel plots of the I–V data at 5 mV s−1 for the 4th cycle for all synthesized samples. (c) Current–potential curves at 10 mV s−1 for the 224th cycle and (d) Tafel plots of the I–V data at 5 mV s−1 for the 225th cycle for Mo(S,Se)2 and (Mo,W)S2. | ||
Conclusions
In summary, the proposed synthesis process successfully produced defective and composition-controlled Mo(S,Se)2 and (Mo,W)S2 nanosheets from MoO3, WO3, and pure sulfur and selenium precursors at 400 °C for 30–60 min. This process has a shorter reaction time and is simpler than other TMD synthesis processes and does not use highly toxic precursors such as hydrogen sulfide or thiourea as sulfur and selenium sources. Moreover, the synthesized Mo(S,Se)2 and (Mo,W)S2 nanosheets showed higher HER activity than synthesized MoS2, WS2, and MoSe2. The SCW hydrothermal synthesis process is expected to be suitable for preparing various kinds of chalcogenide nanosheet solid solutions, and is considered a simple process that has less environmental impact than the existing methods due to the use of water as a solvent.Conflicts of interest
There are no conflicts of interest to declare.References
- X. Huang, Z. Zeng and H. Zhang, Chem. Soc. Rev., 2013, 42, 1934–1946 RSC.
- C. N. R. Rao, K. Gopalakrishnan and U. Maitra, ACS Appl. Mater. Interfaces, 2015, 7, 7809–7832 CrossRef CAS PubMed.
- B. Hinnemann, P. G. Moses, J. Bonde, K. P. Jørgensen, J. H. Nielsen, S. Horch, I. Chorkendorff and J. K. Nørskov, J. Am. Chem. Soc., 2005, 127, 5308–5309 CrossRef CAS PubMed.
- Y. Liu, J. Wu, K. P. Hackenberg, J. Zhang, Y. M. Wang, Y. Yang, K. Keyshar, J. Gu, T. Ogitsu, R. Vajtai, J. Lou, P. M. Ajayan, B. C. Wood and B. I. Yakobson, Nat. Energy, 2017, 2, 17127 CrossRef CAS.
- T. F. Jaramillo, K. P. Jørgensen, J. Bonde, J. H. Nielsen, S. Horch and I. Chorkendorff, Science, 2007, 317(5834), 100–102 CrossRef CAS PubMed.
- D. Y. Chung, S. K. Park, Y. H. Chung, S. H. Yu, D. H. Lim, N. Jung, H. C. Ham, H. Y. Park, Y. Piao, S. J. Yoo and Y. E. Sung, Nanoscale, 2014, 6, 2131–2136 RSC.
- Y. Yin, J. Han, Y. Zhang, X. Zhang, P. Xu, Q. Yuan, L. Samad, X. Wang, Y. Wang, Z. Zhang, P. Zhang, X. Cao, B. Song and S. Jin, J. Am. Chem. Soc., 2016, 138, 7965–7972 CrossRef CAS PubMed.
- Y. Yu, S. Y. Huang, Y. Li, S. N. Steinmann, W. Yang and L. Cao, Nano Lett., 2014, 14(2), 553–558 CrossRef CAS PubMed.
- Q. Gong, L. Cheng, C. Liu, M. Zhang, Q. Feng, H. Ye, M. Zeng, L. Xie, Z. Liu and Y. Li, ACS Catal., 2015, 5, 2213–2219 CrossRef CAS.
- Q. He, Y. Wan, H. Jiang, C. Wu, Z. Sun, S. Chen, Y. Zhou, H. Chen, D. Liu and Y. A. Haleem, Nano Res., 2018, 11, 1687–1698 CrossRef CAS.
- J. Mann, Q. Ma, P. M. Odenthal, M. Isarraraz, D. Le, E. Preciado, D. Barroso, K. Yamaguchi, G. Von Son Palacio, A. Nguyen, T. Tran, M. Wurch, A. Nguyen, V. Klee, S. Bobek, D. Sun, T. F. Heinz, T. S. Rahman, R. Kawakami and L. Bartels, Adv. Mater., 2014, 26, 1399–1404 CrossRef CAS PubMed.
- H. Liu, K. K. A. Antwi, S. Chua and D. Chi, Nanoscale, 2014, 6, 624–629 RSC.
- Q. Feng, Y. Zhu, J. Hong, M. Zhang, W. Duan, N. Mao, J. Wu, H. Xu, F. Dong, F. Lin, C. Jin, C. Wang, J. Zhang and L. Xie, Adv. Mater., 2014, 26, 2648–2653 CrossRef CAS PubMed.
- Q. Feng, N. Mao, J. Wu, H. Xu, C. Wang, J. Zhang and L. Xie, ACS Nano, 2015, 9(7), 7450–7455 CrossRef CAS PubMed.
- P. G. Debenedetti, Ph.D. thesis, Massachusetts Institute of Technology, USA, 1984.
- S. Saito, J. Supercrit. Fluids, 1995, 8, 177–204 CrossRef CAS.
- C. Aymonier, G. Philippot, A. Eriguible and S. Marre, J. Supercrit. Fluids, 2018, 134, 184–196 CrossRef CAS.
- Y. Nakayasu, T. Tomai, N. Oka and I. Honma, Appl. Phys. Express, 2015, 021201 CrossRef.
- Y. Nakayasu, Y. Yasui, R. Taniki, K. Oizumi, H. Kobayashi, N. Nagamura, T. Tomai and I. Honma, ACS Sustain. Chem. Eng., 2018, 6(9), 11502–11510 CrossRef CAS.
- X. Geng, W. Sun, W. Wu, B. Chen, A. Al-Hilo, M. Benamara, H. Zhu, F. Watanabe, J. Chui and T. Chen, Nat. Commun., 2016, 7, 10672 CrossRef CAS PubMed.
- Z. Wang, P. Liu, Y. Ito, S. Ning, Y. Tan, T. Fujita, A. Hirata and M. Chen, Sci. Rep., 2016, 6, 21536 CrossRef CAS PubMed.
- A. O. Lindahl, P. Andersson, C. Diehl, O. Forstner, P. Klason and D. Hanstorp, Eur. Phys. J. D, 2010, 60, 219–222 CrossRef CAS.
- R. C. Bilodeau, M. Scheer and H. K. Haugen, J. Phys. B: At., Mol. Opt. Phys., 1998, 31, 3885–3891 CrossRef CAS.
- P. M. Voyles, D. A. Muller, J. L. Grazul, P. H. Citrin and H. J. L. Gossmann, Nature, 2002, 416, 826–829 CrossRef CAS PubMed.
- J. Greeley, T. F. Jaramillo, J. Bonde, I. Chorkendorff and J. K. Nørskov, Nat. Mater., 2006, 5(11), 909–913 CrossRef CAS PubMed.
- C. Tsai, K. Chan, F. Abild-Pedersen and J. K. Nørskov, Phys. Chem. Chem. Phys., 2014, 16, 13156–13164 RSC.
- V. Kiran, D. Mukherjee, R. N. Jenjeti and S. Sampath, Nanoscale, 2014, 6, 12856–12863 RSC.
- L. Cheng, W. Huang, Q. Gong, C. Liu, Z. Liu, Y. Li and H. Dai, Angew. Chem., Int. Ed., 2014, 53, 7860–7863 CrossRef CAS PubMed.
Footnote |
| † Electronic supplementary information (ESI) available. See DOI: 10.1039/c9na00435a |
| This journal is © The Royal Society of Chemistry 2019 |