
 Open Access Article
 This Open Access Article is licensed under a Creative Commons Attribution-Non Commercial 3.0 Unported Licence
Water distribution at the electrified interface of deep eutectic solvents†
Mesfin Haile
Mamme
 *ab,
Samuel L. C.
Moors
b,
El Amine
Mernissi Cherigui
a,
Herman
Terryn
a,
Johan
Deconinck
c,
Jon
Ustarroz‡
*a and
Frank
De Proft‡
b
*ab,
Samuel L. C.
Moors
b,
El Amine
Mernissi Cherigui
a,
Herman
Terryn
a,
Johan
Deconinck
c,
Jon
Ustarroz‡
*a and
Frank
De Proft‡
b
aVrije Universiteit Brussel (VUB), Research Group Electrochemical and Surface Engineering (SURF), Pleinlaan 2, 1050 Brussels, Belgium. E-mail: mmamme@vub.be; mesfin.mekdi@gmail.com; jon.ustarroz@vub.be
bVrije Universiteit Brussel (VUB), Eenheid Algemene Chemie (ALGC), Pleinlaan 2, 1050 Brussels, Belgium
cVrije Universiteit Brussel (VUB), Department of Electrical Engineering and Energy Technology (ETEC), Pleinlaan 2, 1050 Brussels, Belgium
First published on 4th July 2019
Abstract
Deep eutectic solvents (DESs) are a new class of solvents with wider potential window than that of water and high electrochemical stability, making them potential candidates for a wide range of electrochemical systems. However, due to the hygroscopic nature of DESs, the presence of latent water is unavoidable. Therefore, understanding the interfacial structure and the electrosorption and distribution of residual water at the electrified interface is of great importance for the use of these solvents in electrochemical systems. Using atomistic molecular dynamics, we explore the electrosorption and distribution of different amounts of water in 1![[thin space (1/6-em)]](https://www.rsc.org/images/entities/char_2009.gif) :2 choline chloride–urea DES (Reline) at the electrified graphene interface. We found that both the water distribution and the interfacial structure are sensitive to the electrification of the graphene electrode. As a result, it is found that for moderately charged electrodes, water shows a preferential asymmetric adsorption in the vicinity of the positively charged electrode, partly due to strong intermolecular interactions with anions through hydrogen bonds. In contrast, for highly charged electrodes, water adsorbs at both electrodes due to a strongly enhanced external electrostatic interaction between the electrodes and the water dipoles.
:2 choline chloride–urea DES (Reline) at the electrified graphene interface. We found that both the water distribution and the interfacial structure are sensitive to the electrification of the graphene electrode. As a result, it is found that for moderately charged electrodes, water shows a preferential asymmetric adsorption in the vicinity of the positively charged electrode, partly due to strong intermolecular interactions with anions through hydrogen bonds. In contrast, for highly charged electrodes, water adsorbs at both electrodes due to a strongly enhanced external electrostatic interaction between the electrodes and the water dipoles.
1 Introduction
Room temperature ionic liquids (RTILs) have attracted considerable attention as a new class of solvents that offer a number of advantages compared to traditional aqueous and organic media. The typical advantages of RTILs over traditional solvents are, in general, wide electrochemical potential windows which enable a wide operating voltage; low vapor pressure; high thermal stability; and their ability to dissolve a wide range of organic, inorganic and organometallic compounds that would not be simultaneously soluble in traditional solvents. However, despite their interesting physico-chemical properties, using RTILs at the industrial scale has a number of drawbacks, the most significant of which is the high cost, and also low biodegradability, low moisture tolerance and (for some) their toxicity.1–3In this context, deep eutectic solvents (DESs) are a more sustainable and low-cost alternative to RTILs.4–8 DESs are considered as RTIL analogues, and share some of their features while overcoming some of their drawbacks. DESs are composed of a mixture of at least two components: a hydrogen bond donor (HBD, such as urea, glycerol and ethylene glycol) and a hydrogen bond acceptor (HBA, such as choline chloride) in a eutectic molar ratio. As such, they have a melting point lower than their individual components. Although the potential window of DESs is considerably smaller, these solvents offer several advantages over RTILs. They can be prepared from sustainable and inexpensive materials with less demanding preparation methods (no purification is required) and they are non-toxic.4–6,9,10 Due to these compelling unusual physico-chemical properties, DESs have been increasingly used in a vast number of applications with success, including solvent extraction,11,12 biodiesel production,13 organic synthesis,5,10,14,15 lubrication,5 nanoporous carbon synthesis,16,17 fuel treatment,10,11,18 gas capture19–21 and DNA stabilization.22,23 Besides, they have also been extensively used as solvents for many electrochemical purposes such as electrodeposition,24–29 energy conversion,30 energy storage,31–34etc.4,31,35,36
Extensive experimental and computational studies have been dedicated to rationalize the correlation between melting point depression and the hydrogen bond strength and its influence on the thermo-physical properties of DESs, with special emphasis on 1:2 choline chloride–urea (Reline).4–9,35,37–39 Thus, it has been proposed that the DES mixture melting point depression depends on the lattice energies of the DESs, the anion–HBD interaction, and the change in entropy due to formation of the liquid phase.9 Following this, Perkins et al.40 provided the first molecular structural insights using infrared spectroscopy (IR) experiments and molecular dynamics (MD) simulations. They found a higher number of HBDs (i.e., urea molecules) around the anions (i.e., chloride ions) than around the cations (i.e., choline ions). Their simulation results were in good agreement with IR spectroscopy experimental results. The same problem was studied by Su et al.37 using MD simulations. Their results revealed that the addition of urea leads to a significant disruption of the electrostatic interaction between the choline and chloride, resulting in urea–chloride interactions being predominant. More recently, a number of similar computational and experimental studies have been reported and reviewed.10,15,41–48
Nonetheless, bringing these solvents from moisture controlled laboratory experiments to practical industrial applications is a big challenge due to their hygroscopic nature. The presence of water in DESs is almost inevitable and impossible to eliminate.6,7,24,49,50 The presence of latent water in DESs has a significant impact on the physico-chemical properties of DESs including the structure, dynamics, electrochemical window and melting point.7,8 Because of this, a number of experimental and computational studies have been dedicated to the investigation of the influence of water on the physico-chemical properties of DESs, with special emphasis on Reline.4,6–8 It has been reported that the presence of small amounts of water influences the bulk structure and dynamics of Reline.7,8 At lower water concentrations (less than 5 wt%), the water molecules preferentially hydrate chloride ions by the weakening of the strong hydrogen bond between chloride and urea and enhancing urea–urea interaction. In contrast, at higher water fractions (more than 5 wt%), all species are solvated by water molecules. This leads to drastic changes in the structure of Reline, viscosity and self-diffusion of choline cations, chloride anions and urea molecules.6 This was also confirmed by an ab initio molecular dynamics study.39 On the other hand, more recently, it has been shown that the presence of small amounts of residual or intentionally added water in Reline could be beneficial for controlling the size, shape and distribution of deposited nanoparticles.5,24,26,29,49,51,52 Also, in a carbon dioxide gas capture experiment, it has been shown that the solubility of carbon dioxide in a mixed water–Reline solvent is strongly dependent on the amount of water, and that increasing the amount of water leads to a decrease in carbon dioxide solubility.37
Despite a number of studies of bulk water–DES mixtures, the effect of residual water on the electrified interface in DESs has not been studied yet. Just recently, when the present work was completed, Hammond et al.53 reported the influence of high concentrations of water (10–50 wt%) on the electrical double layer structure formation of DESs at a platinum electrode using contact mode atomic force microscopy (AFM). Alternatively, studying the electrosorption of residual water as a function of water content and surface polarization at a molecular scale has great practical implications for electrodeposition, energy conversion, energy storage and other electrochemical processes. Even though it has been previously reported that having small amounts of latent/intentionally added water is beneficial for some applications,24,49,54 the effect on the electrified DES–electrode interface can be anticipated to be quite complex. Since water is a polar molecule, it should interact with the electrified electrode. This may lead to preferential adsorption/desorption of water in/from the vicinity of the electrode–DES interfacial region.
In practice, electrosorption of water has both positive and negative impacts. On the positive side, for the synthesis of nanomaterials, the size and shape of the nanoparticles can be tuned by varying the amount of water in DESs.4,24,26,49 In addition, the electrochemical behavior of DESs can be further tuned according to the application of interest by mixing DESs and water at a certain ratio.7,8,24,49,54 In contrast, if water molecules accumulate close to the electrode surface, at high electrode surface polarization, electrolysis of water can take place, producing hydroxide ions (OH−) and hydrogen gas (H2) at the cathode and oxygen (O2) at the anode.26,29 The presence of OH−, generated by water splitting, at the electrode–electrolyte interface could lead to the chemical breakdown of DESs,26,29,55 which compromises the electrochemical potential window. Recently, this has been confirmed experimentally using combined electrochemical and surface analysis techniques.56,57 On the other hand, in closed electrochemical systems, such as batteries and supercapacitors, high surface polarization leads to electrolysis of water in the vicinity of the electrode surface which results in formation of hydrogen and oxygen gas. Because of the gas formation, the internal pressure increases and the active site/pores of the electrode surface are blocked by the gas bubbles. All of this leads to current leakage, decrease in capacity and irreversible processes.31
In this work, we have scrutinized for the first time the electrochemical interfacial structure and electrosorption of latent water from 1:2 choline chloride–urea (Reline) onto a charged and uncharged graphene surface, at a molecular level, using atomistic molecular dynamics simulation. In this systematic study, we focused on the influence of surface charge polarization on the spatial distribution of latent water in the electrified Reline–graphene system. The simulations reveal that the water distribution and electrosorption are sensitive to electrification. More interestingly, water shows preferential asymmetric adsorption at moderately charged surfaces. These findings provide a significant benchmark for better control, design and further optimization of a variety of electrochemical systems that employ DESs as solvents.
2 Methods
Atomistic molecular dynamics simulations were carried out to study the influence and distribution of latent water in electrified 1:2 choline chloride–urea DES using the GROMACS 5.1.2 software package. The system setup is shown in Fig. 1. Periodic boundary conditions are applied in the Y and Z dimensions. There is no periodicity in the direction perpendicular to the graphene electrode. We adopt parallel graphene sheets (4.55 nm × 4.31 nm) as positive and negative electrodes. The graphene atomic positions are frozen throughout the simulations. The system studied consists of 500 choline cations (Ch+), 500 chloride anions (Cl−) and 1000 urea (URE) molecules, mixed with different amounts of water molecules (1 wt%, 3 wt% and 10 wt%). The distance between graphene sheets is fixed to 9.37–10.3 nm, depending on the amount of water in the system (1 wt%, 9.37 nm; 3 wt%, 9.52 nm; and 10 wt%, 10.3 nm). The force field parameters for Reline species, which were taken from the SwissParam web server,58 are derived from the Merck Molecular Force Field (MMFF) and have been validated and used to predict the physico-chemical properties of mixed water–Reline with high accuracy, when compared with experiments.7 Water was simulated with the 3-site SPC/E water model.7 The Lennard-Jones (LJ) parameters used for the graphene carbon atoms are σc = 3.55 × 10⁻¹ nm and εc = 2.9288 × 10⁻¹ kJ mol−1.
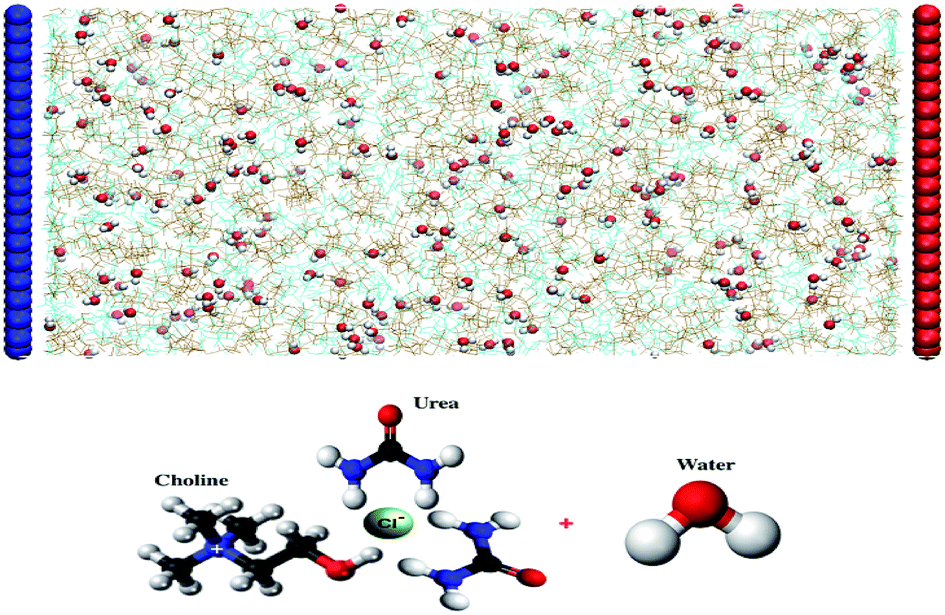 | ||
| Fig. 1 System setup: simulated graphene electrified humid Reline deep eutectic solvent along the x direction. The graphene electrodes were separated by 9.37 nm for 1 wt%, 9.52 nm for 3 wt% and 10.3 nm for 10 wt% water content in Reline. Water molecules are represented as red-white spheres (red, oxygen; white, hydrogen) and all other molecules and ions are represented by colored lines (choline, ochre; chloride, tan; and urea, cyan). The blue-colored electrode is negatively charged and the red-colored electrode is positively charged. | ||
To determine the simulation domain size for the interfacial calculation, we first performed an energy minimization followed by a 200 ns isothermal–isobaric (NPT) and a canonical (NVT) equilibration for each bulk Reline–water mixture at a temperature of 300 K (maintained with a V-rescale thermostat) and a pressure of 1 bar (maintained with a Parrinello–Rahman barostat). Once the final density of the system was reached, the resulting configuration was sandwiched between graphene electrodes and used for an additional 100 ns NVT equilibration, followed by 300 ns production runs. In all simulations, 1 fs time steps were adopted. Here it is important to note that, since Reline is highly viscous, much longer simulation times than usual7,37 are necessary to obtain reliable results.
Long range electrostatic interactions were computed with the Particle Mesh Ewald summation (PME) method59 using an FFT grid spacing of 0.16 nm and a fourth order interpolation. A cutoff of 1.0 nm was used for the short-range Lennard-Jones and Coulomb interactions. The simulation results were analyzed with GROMACS analysis tools and Visual Molecular Dynamics (VMD).60 Note that, number density calculations were performed using the center-of-mass of the respective species.
3 Results and discussion
Electrochemical fingerprints of water
An important question is whether the interfacial structure and electrosorption of water is affected by the presence of a different humidity percentage in DESs and the change in surface polarization (equivalent to electrode potential) of the graphene electrode. First, we evaluate the amount of water in the vicinity of the graphene electrode by integrating and normalizing the number density of water molecules within the region of 0 to 3.5 Å (Fig. 2). We set these dimensions for the vicinity of the surface considering that the van der Waals radius of graphene carbon and water are ∼1.8 Å and ∼1.7 Å, respectively. Such a region is henceforth referred to as the “interfacial region”. Fig. 2 shows the averaged (a) and the normalized (b) number density of latent water adsorbed in the interfacial region as a function of surface polarization for different amounts of water (1 wt%, 3 wt% and 10 wt%). In all considered cases, regardless of the water concentrations, there is a clear tendency for the adsorbed water to increase in the interfacial region for large surface polarization. Fig. 2(b) shows that in the interfacial region of an uncharged graphene electrode, the amount of water is the same as that in the bulk section. For the moderately negatively charged graphene electrode, the water molecules are depleted compared to the bulk, regardless of the amount of the latent water in the solution. Besides, a further increase in surface charge density of the negatively charged electrode (σ < −0.16 C m−2) leads to an increase in water adsorption. This is mainly due to the enhancement of the electrostatic interaction between the charged graphene electrode and the water molecules. On the other hand, for a positively charged graphene electrode, enrichment of water molecules in the interfacial region also occurs for low polarization. This implies that water molecules are preferentially adsorbed asymmetrically on the positively rather than on the negatively charged graphene electrode. In addition, from Fig. 2(a) it can be seen that the number of adsorbed water molecules at the interface at −0.32 C m2 is higher than that at +0.32 C m2. This is mainly related to the less sensitive nature of the choline cation for an increase in negative polarization (see ESI Fig. S1†) and the structural rearrangement of both molecules (URE and H2O) to a more packed conformation (mixed parallel and perpendicular alignment). This allows more free spaces for the accumulation of more water molecules in the vicinity of the negatively charged surface, when compared to the positively charged side, which features a more compact conformation (flat alignment). This is further discussed below. | ||
| Fig. 2 Electrosorption of water on graphene. The averaged (a) and normalized (b) number density of adsorbed water in the interfacial region as a function of surface charge density. The amount of residual water molecules in bulk Reline is 1 wt%, 3 wt% and 10 wt%. The interfacial region is taken to be 3.5 Å from the graphene surface. | ||
To get a better understanding of the preferential adsorption and distribution of water in the vicinity of the electrode interface, we closely examined the details of the electrochemical double layer structure (EDLS) and intermolecular interactions for the case of a 3 wt% humidity. For simplicity, choline is denoted as Ch+, urea as URE, chloride as Cl−, water as H2O and graphene electrode as GRE. Fig. 3 shows the normalized number density of all species (a–d) and the snapshots of the residual water distribution (e–h), which are computed along the x-axis perpendicular to the graphene electrode with different surface charge polarizations (σ = 0 C m−2 to ±0.32 C m−2). In the snapshots, the water molecules are represented by white-red spheres and other molecules, cations and anions are represented by colored lines. Fig. 4 shows the evolutions of the intermolecular interaction between each Reline species with the graphene electrode (URE–GRE, black bar; Ch+–GRE, red bar; Cl−–GRE, green bar; and H2O–GRE, blue bar) as a function of surface charge density.
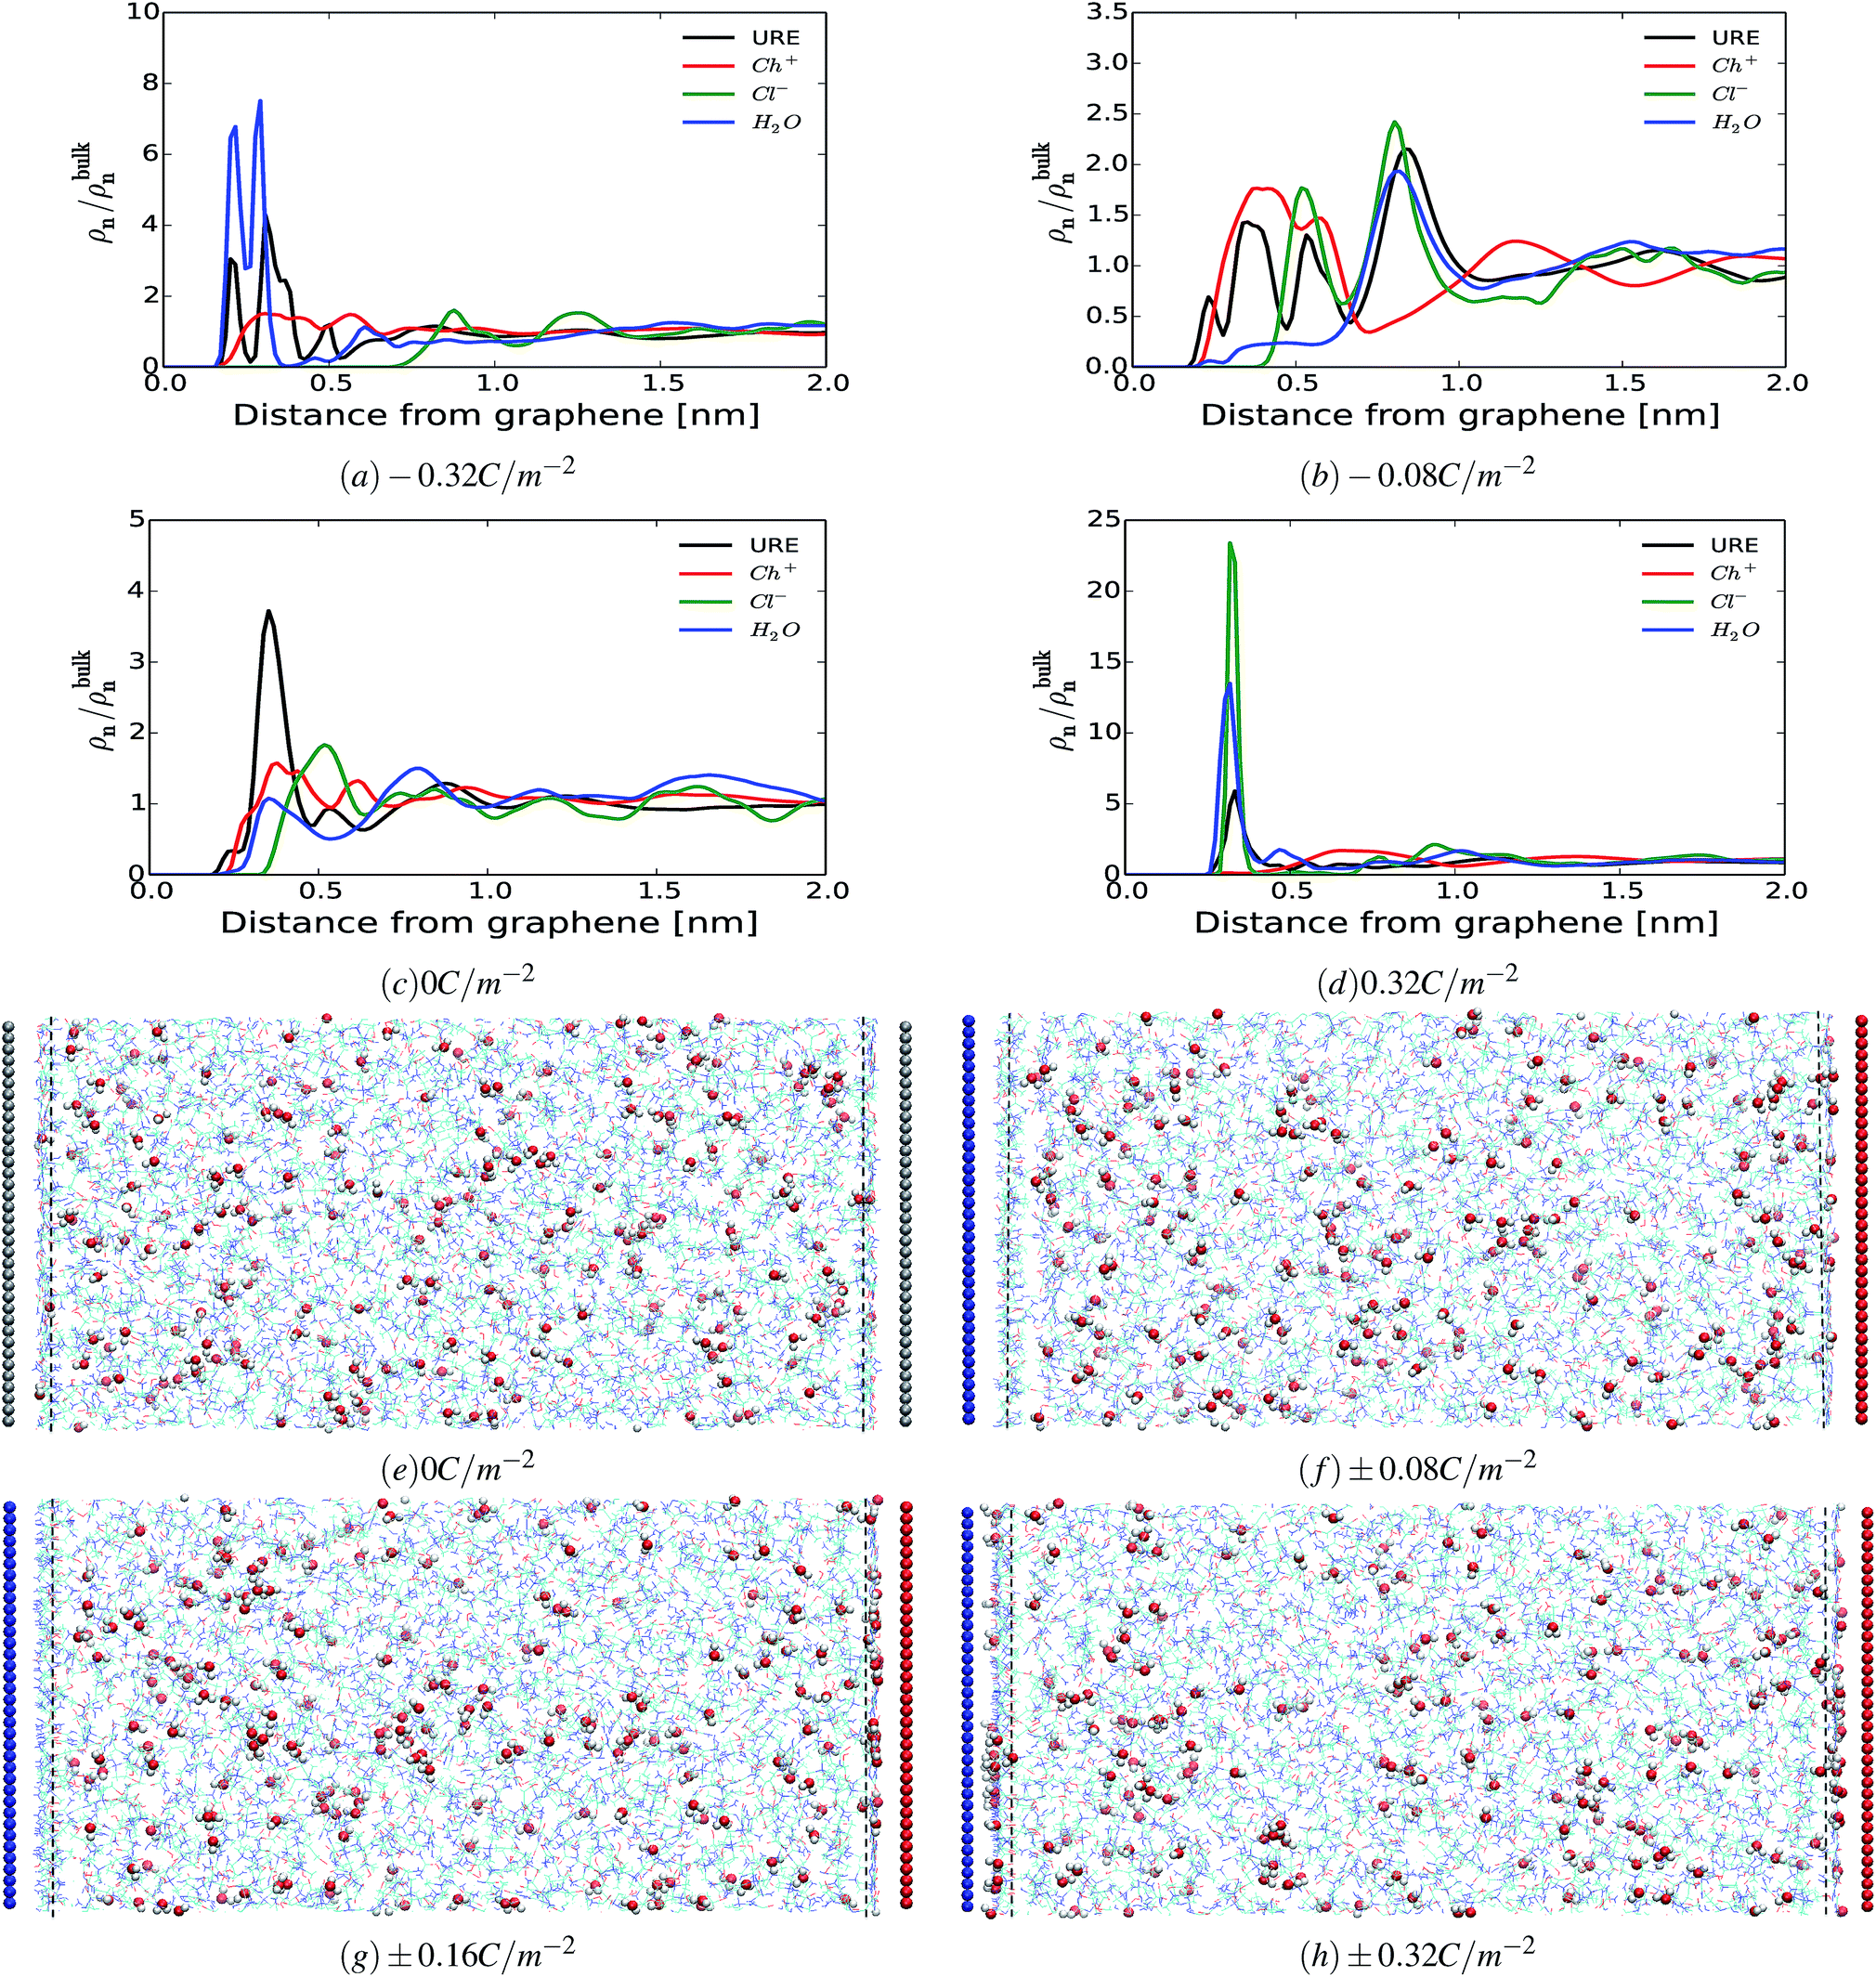 | ||
| Fig. 3 Electrical double layer structure. The normalized number density profiles of all species (urea, URE; choline, Ch+; chloride, Cl−; and water, H2O) as a function of the distance from the electrodes for different surface charge densities (a–d) for 3% wt H2O. Snapshots of the water molecule distribution (e–h). The uncharged electrode is colored grey, whereas negatively and positively charged electrodes are colored blue and red, respectively. Water molecules are represented as red-white spheres (red, oxygen; white, hydrogen) and all other molecules and ions are represented by colored lines. The vertical black dashed line marks the distance 3.5 Å from the electrode surface. | ||
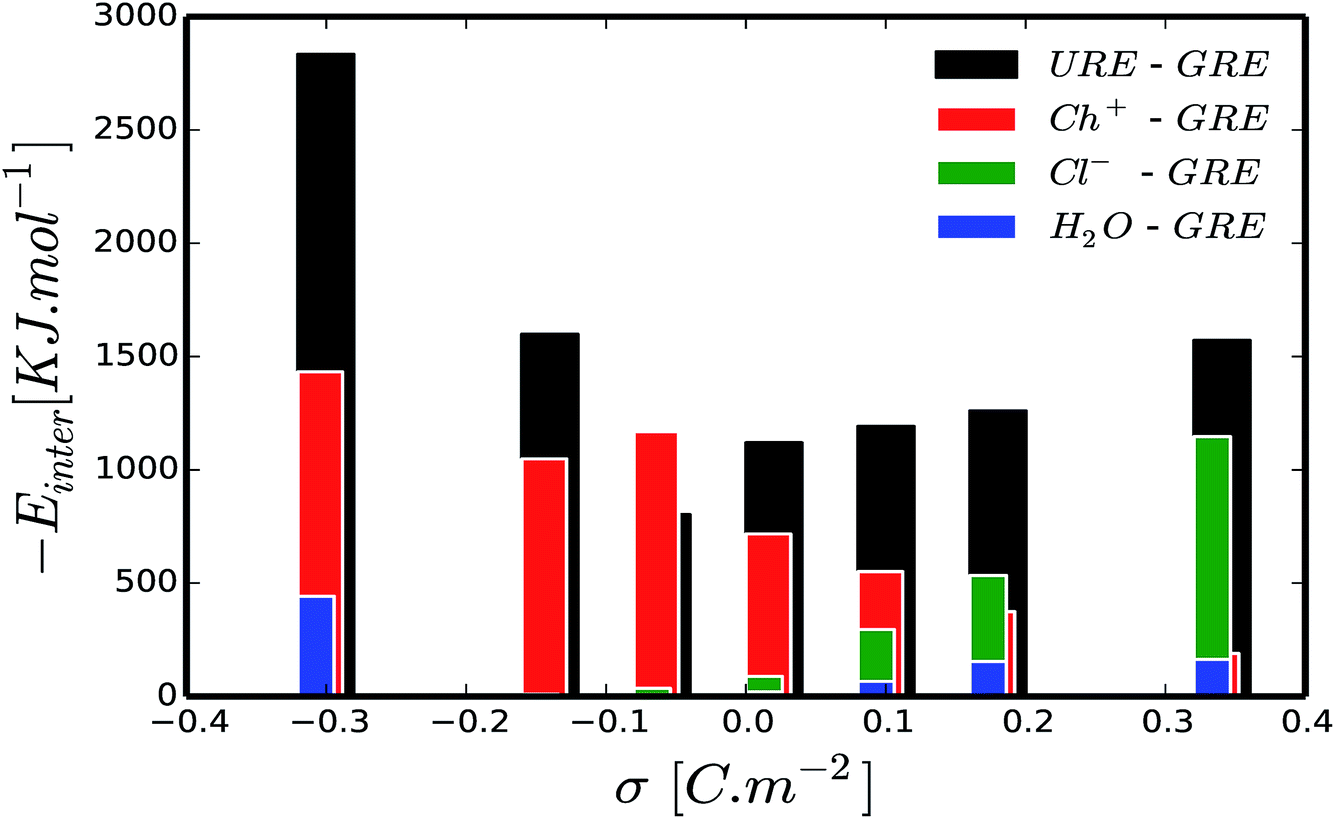 | ||
| Fig. 4 Influence of surface polarization on intermolecular interaction energy: intermolecular interactions between urea and graphene (URE–GRE, black bar), choline and graphene (Ch+–GRE, red bar), chloride and graphene (Cl−–GRE, green bar) and water and graphene (H2O–GRE, blue bar) as a function surface charge density. | ||
From Fig. 3(a–d), it can be seen that in all cases, the number density shows strong oscillations close to the graphene electrode. These oscillations gradually disappear at a distance of about 2 nm from the electrode. Similar oscillations occur at the interface with RTILs,61,62 where multiple alternating (cations and anions) layers are formed. However, the interfacial structure of the humid Reline in particular and DESs in general is substantially different from that of a dilute solution (a compact layer followed by a diffuse layer)63–65 and that of RTILs (overscreening or crowding).61,62 As noted in our previous work,66 the interfacial structure of dry Reline (0 wt% H2O) DES on the graphene electrode is characterized by a mixed structure of two components (urea and either chloride or choline) followed by a mixed charged clustered layer of the three components (clusters of either urea with more chloride than choline or urea with more choline than chloride) regardless of the surface polarization.
From Fig. 3, it is clearly seen that the interfacial structure of humidified Reline varies as a function of surface charge density. In the absence of surface charge (Fig. 3(c), σ = 0 C m−2), the interfacial region is composed of choline cations (Ch+, red curve) and urea molecules (URE, black curve) with a smaller contribution from water molecules (H2O, blue curve), which is a mixed charged clustered layer.66 This can be mainly explained by the strength of the intermolecular interactions between humidified Reline species and their affinity with the graphene electrode. Fig. 4 shows that for an uncharged electrode, the URE–GRE and Ch+–GRE interactions are dominant, whereas H2O–GRE interactions are remarkably weaker. This is mainly due to the hydrophobic nature of the graphene electrode. As a result, water slightly accumulates preferentially outside the interfacial region (lower density region) rather than in the interfacial region (higher density region) (see Fig. 3(c)).
For a moderately negatively charged electrode, Fig. 3(b, f and g), water is completely depleted from the interfacial region, which corresponds to the region in between the blue electrode and the nearby vertical black broken line in Fig. 3(f and g). The interfacial region is mainly composed of choline cations (Ch+, red curve) and urea molecules (URE, black curve) (see also ESI Fig. S1†), which is a mixed layer structure. Here it is important to note that, from the number density, Fig. 3(b), we observe a preferential accumulation of water outside the interfacial region at a distance around 8.1 Å, which corresponds with an accumulation of urea (black curve) and chloride (green curve). This is due to the strong local intermolecular interaction between these species and water molecules, as shown in ESI Fig. S3.† Fig. S3† shows the average local intermolecular interactions of water (H2O) with each Reline species (URE, Ch+ and Cl−). The results show strong local intermolecular interaction between H2O and Cl− (green bar), followed by H2O and URE, regardless of the surface polarization. This is an important finding for cathodic electrochemical processes such as electroplating because at a moderate surface charge (moderate potential) water is not present in the vicinity of the electrode; hence, material deposition proceeds with a high cathodic efficiency and in the absence of water reduction. This will allow us to control the thickness and the morphology of the deposited layers precisely.57
At a highly negatively charged surface (Fig. 3(a and h), σ = −0.32 C m−2), the number density profile as well as the water distribution close to the interface follows a completely different trend. The water molecules (H2O, blue curve) preferably accumulate in the interfacial layer, followed by urea molecules (URE, black curve) and choline cations (Ch+, red curve). However, the intermolecular interaction with the electrode surface (Fig. 4) shows a slightly different trend: the interaction is highly dominated by URE–GRE (black bar), followed by Ch+–GRE (red bar) and H2O–GRE (blue bar). This presumable contradiction is cleared up by re-emphasizing the fact that the number density is normalized according to the density of the cations/anions/molecules in the bulk of the humid Reline. Hence, an increase in the number of water molecules, which are a minority in the humid Reline compared to urea (URE) and choline (Ch+), will have a more pronounced effect on the normalized number density profile compared to the one of urea (URE) or choline (Ch+). Here it is also important to mention that prior studies of electrodeposition of nickel from Reline DES with different amounts of water (≤10 wt%) showed the adsorption and electrolysis of water are remarkable at high cathodic potentials (E ≤ −0.9 V vs. Ag QRE).56
Alternatively, at the positively charged electrode, the interfacial region starts accommodating water even at a lower surface charge and further increasing the electrode charge leads to the accumulations of a higher amount of water molecules in the interfacial region. This is shown in Fig. 3(d) and (f–h) (i.e., the region between the red electrode and the nearby vertical black dashed line). The interfacial region is mainly composed of chloride anions (Cl−), urea (URE) and water molecules (H2O), a mixed charged clustered layer.66 This is mainly due to the synergistic effect of the intermolecular (hydrogen bonding: URE–Cl− and H2O–Cl−) and the electrostatic interactions with the polarized electrode surface.
Further, we also investigated the local charge density as a function of distance from the electrode surface for different surface polarizations. Fig. 5(a–c) show the local charge density profiles of urea (red curve), choline (black curve) and chloride (green curve) and the normalized number density of water (blue dashed curve) as a function of distance from the electrode surface. Fig. 5(a–c) show that water adsorption peaks (blue dashed curve) are strongly correlated with local excess charge regions (the maxima of the absolute value of the local charge density, |ρe|). This implies that there are strong local electrostatic interactions, specifically ion–dipole and dipole–dipole interactions. Since, water is a dipolar molecule, its local electrostatic interaction with ions is quite strong, and specifically, the H2O–Cl− interaction is stronger than that of H2O–Ch+ (see ESI Fig. S3†). This implies that water molecules are preferentially adsorbed on the positively charged electrode following chloride anions rather than on the negatively charged electrode where choline cations accumulate. This argument is well in line with the simulated normalized number density of water molecules and chloride anions for different surface charge densities as a function of distance from the electrode surface, shown in ESI Fig. S2.† Fig. S2† shows that increasing the negative surface polarization up to −0.16 C m−2 results in a positive shift (shifting away from the electrode surface) of both chloride and water accumulation. On the other hand, increasing the positive surface charge leads to accumulation of both chloride and water in the interfacial region. This can also explained by the intermolecular interactions (Fig. 4). For positively and moderately negatively polarized surfaces, the evolution of the H2O–GRE interaction strictly follows the trend of Cl−–GRE interaction. Alternatively, at a highly negatively charged electrode (σ < −0.16 C m−2) the water molecules no longer follow the chloride anions. This is related to the strong electrostatic interaction between charged graphene and the water dipole, which is enhanced by increasing the surface polarization (see Fig. 3(a and h) and 4). It is also important to note that Ch+–GRE and URE–GRE interactions follow different trends. The Ch+–GRE interaction increases monotonically from +0.32 C m−2 to −0.32 C m−2, which is expected and can be explained by an increase of the electrostatic interaction between the choline cation and the negatively charged graphene. In contrast, the URE–GRE interaction first decreases, following the Cl–GRE interaction from +0.32 C m−2 to −0.08 C m−2, and then increases with stronger negative polarization. This can be explained by the fact that at moderate polarization, the local intermolecular interaction between urea molecule and the other species (URE–Ch+, URE–Cl− and URE–H2O) becomes predominant, whereas for a high surface polarization the local intermolecular predominance is overtaken by the strongly enhanced external electrostatic interaction between the urea dipole and graphene.66
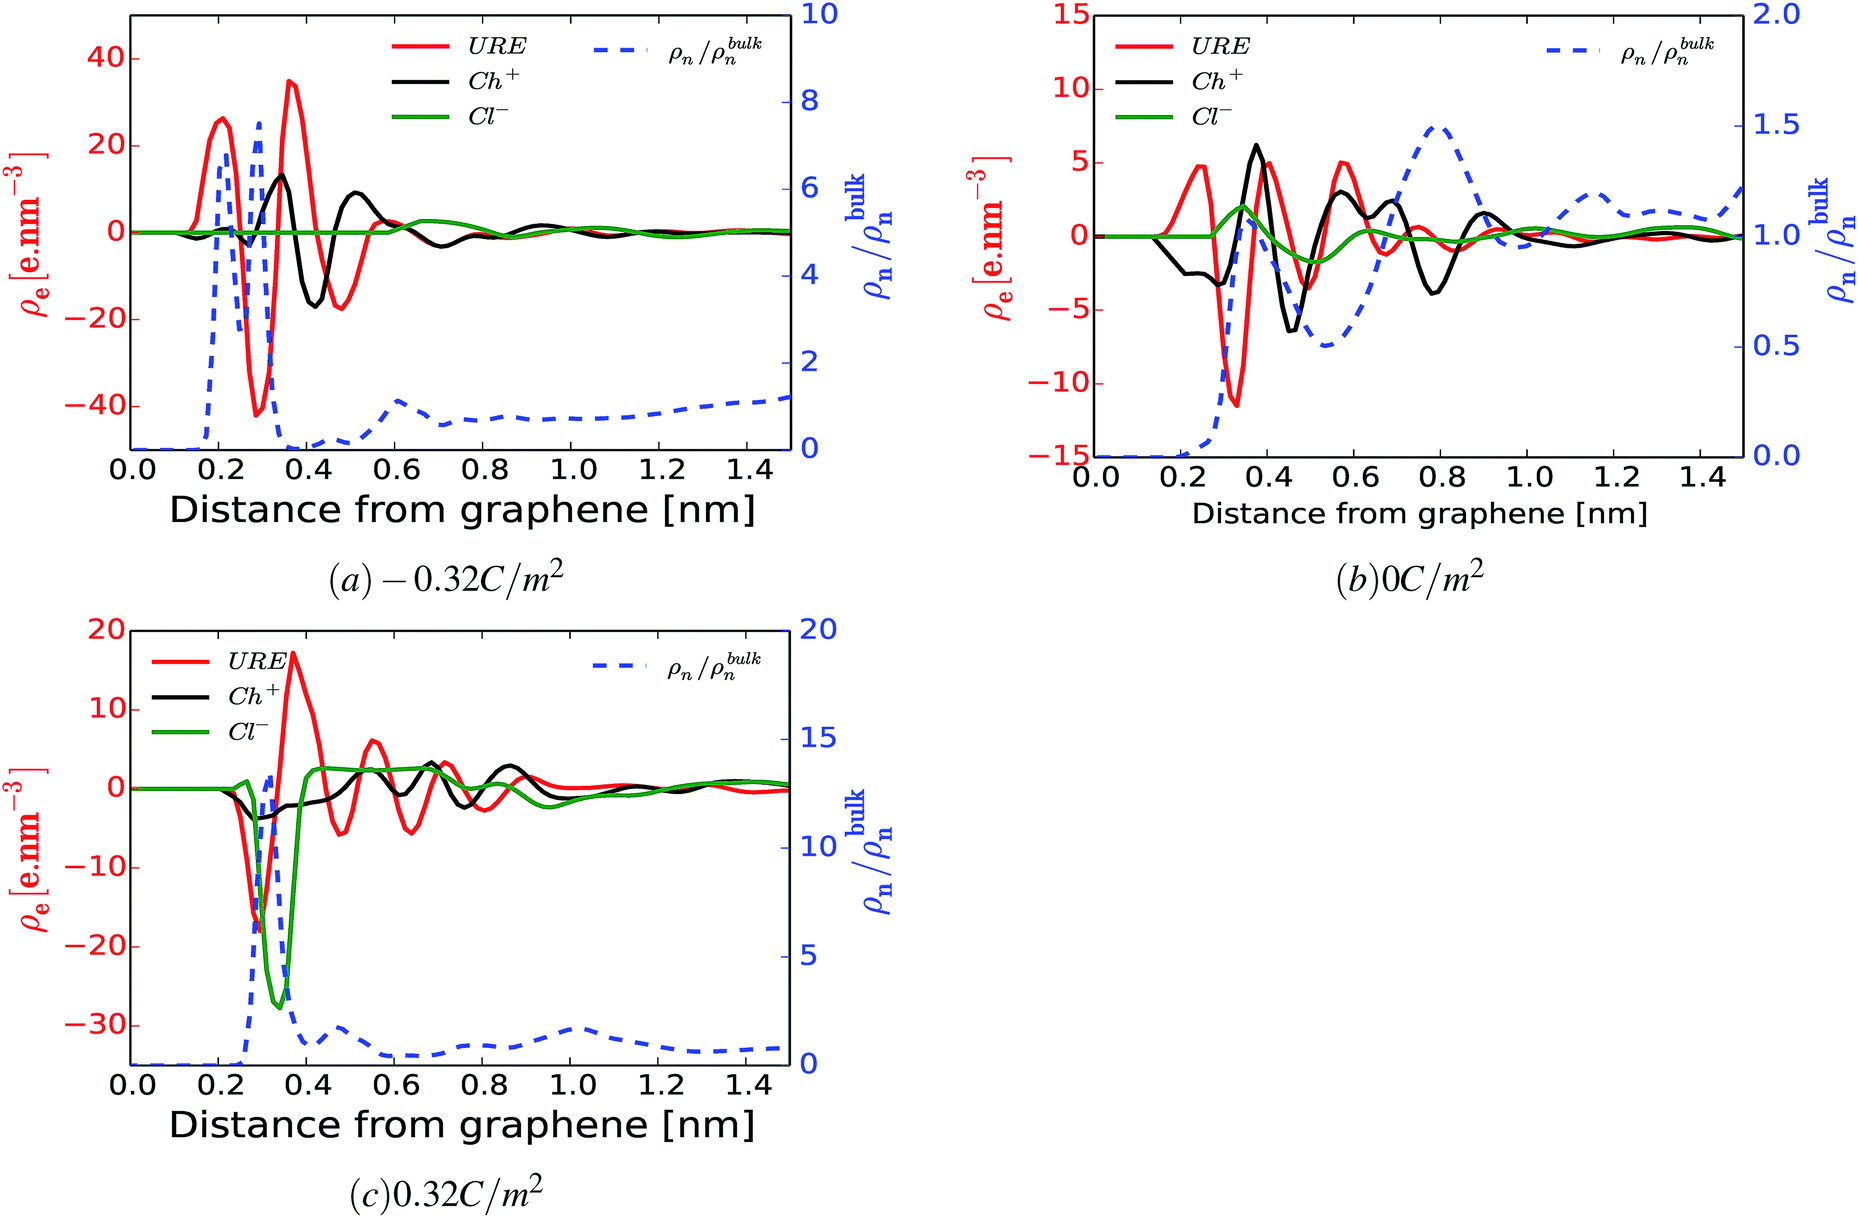 | ||
| Fig. 5 Correlation between electrosorption of water and local interactions. The local space charge density profile of URE, Ch+ and Cl− (ρe, left axis) and the normalized number density of water molecules (ρn/ρbulkn, right axis) for surface charge densities −0.32 C m−2 (a), 0 C m−2 (b) and 0.32 C m−2 (c) as a function of distance from the graphene electrode. | ||
Interdependency of the electric field distribution and preferential adsorption of water
It is well known that the electric potential oscillates in the EDLS region due to the overscreening phenomena and gradually damps out as a function of distance from the electrode surface. This results in the oscillation of the electric field. Since the water molecule is polar with a high dipole moment, it will experience a net force due to a nonuniform electric field. If we consider water as a point dipole oriented in the direction of the electric field, then, the net force experienced by the water molecule in the interfacial region can be written as: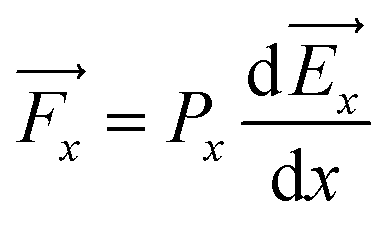 | (1) |
![[F with combining right harpoon above (vector)]](https://www.rsc.org/images/entities/i_char_0046_20d1.gif) x is the net force on the dipole, Px is the dipole moment and
x is the net force on the dipole, Px is the dipole moment and ![[E with combining right harpoon above (vector)]](https://www.rsc.org/images/entities/i_char_0045_20d1.gif) x is the average electric field perpendicular to the charged/uncharged graphene electrode. Hence, in the electrical double layer region, the water molecule will move toward the direction where the magnitude of the electric field (|x|) increases and will accumulate at the position where the net force is zero
x is the average electric field perpendicular to the charged/uncharged graphene electrode. Hence, in the electrical double layer region, the water molecule will move toward the direction where the magnitude of the electric field (|x|) increases and will accumulate at the position where the net force is zero  . Thus, the water molecules are preferentially accumulated in positions that satisfy the extrema of the electric field (i.e., local minima/maxima and global minimum/maximum). Hereafter, we refer to the local minimum and maximum as metastable positions and absolute minimum and maximum as stable positions.
To support the above arguments we calculated the average electric field perpendicular to the surface of the electrode as a function of distance. Fig. 6 shows the averaged electric field (red curve) and the normalized number density of water (blue dashed curve) as a function of distance from the surface of the electrode for a surface charge of −0.32 C m−2 (a), 0 C m−2 (b) and 0.32 C m−2 (c). Even though this model does not consider the finite size of water dipoles, it nevertheless provides a good correlation between the preferential adsorbed water peaks and the metastable and stable positions of the averaged electric field. However, in some cases this correspondence does not hold. For instance, for the uncharged electrode, Fig. 6(b), one could have anticipated that there would be an accumulation of water molecules at the electrically stable position, x = 5.2 Å. However, at this position water is depleted whereas the highest accumulation of water was found at x = 7.8 Å. This can be due to two reasons. First, at lower surface charge densities, the local intermolecular interactions between water molecules and the surrounding Reline species are predominant, as shown in Fig. 3–5 and ESI Fig. S2.† Second, since there exists another polar molecule (i.e., urea) in the system, there will be competition between H2O and URE to accumulate at the metastable and stable positions. On top of this, it is also important to note that, since the water molecule is not a point dipole, exact correspondences between the water accumulation peak and stable and metastable positions are not expected.
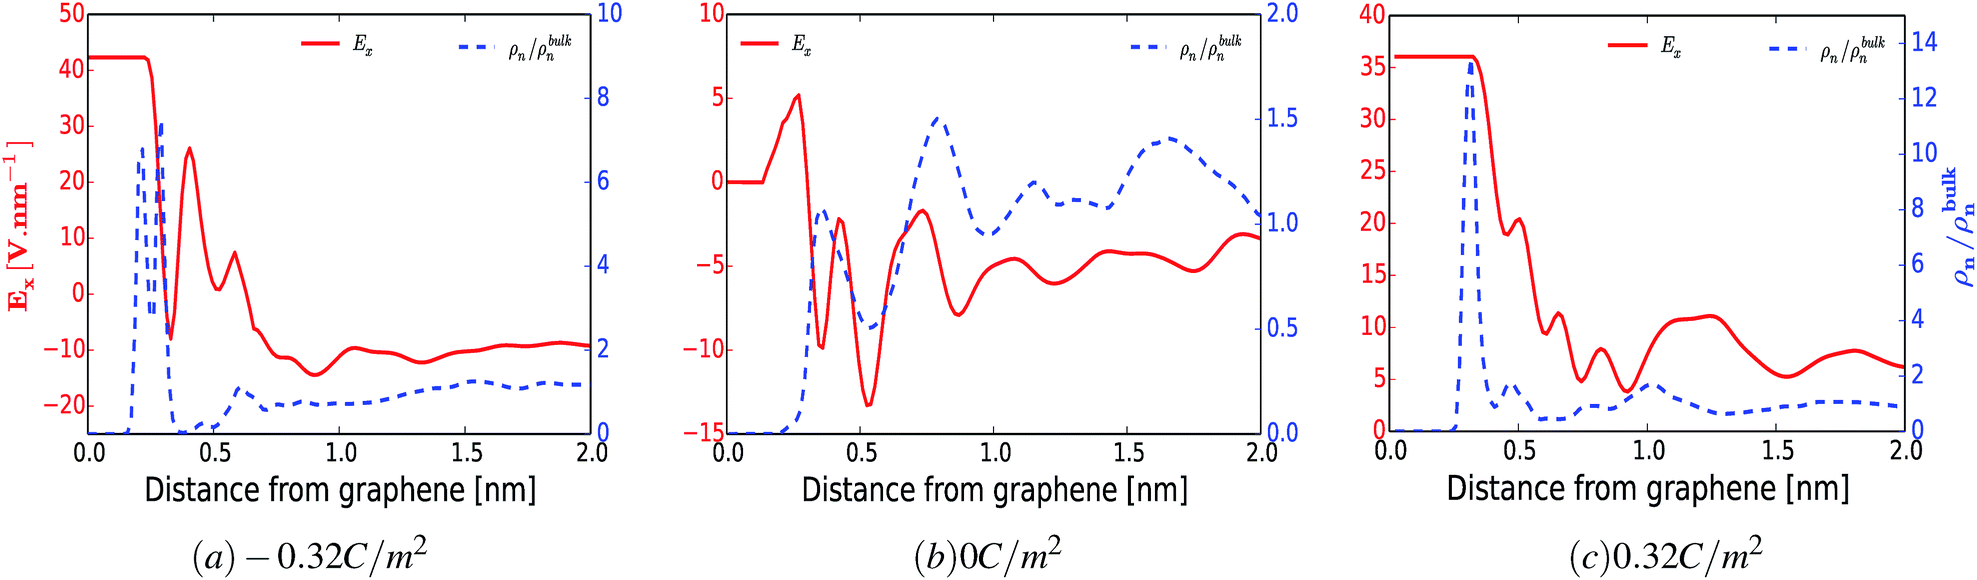 | ||
| Fig. 6 Contributions of the electric field for preferential electrosorption of water. The evolutions of electric field (Ex, left axis) and normalized number density of water (ρn/ρbulkn, right axis) as a function of distance from the electrode surface for (a) −0.32 C m−2, (b) 0 C m−2 and (c) 0.32 C m−2. | ||
The other interesting point is that at the interfacial region, where the electric field is not homogeneous, both polar molecules (i.e., urea and water) exhibit distinct orientations (see Fig. 7(a–c)). Fig. 7(a–c) show the orientational arrangement of urea (left column) and water (right column) molecules in the vicinity of the electrode surface for a surface charge density of −0.32 C m−2 (a), 0 C m−2 (b) and 0.32 C m−2 (c). To explain the orientation of the two polar molecules in the vicinity of the electrode surface, we used the following definitions: “perpendicular” and “parallel” refer to the direction of the dipole with respect to the electrode surface, whereas “flat” refers to the orientation where all the atoms are nearly at the same distance from the electrode surface. On the uncharged electrode, Fig. 7(b), there is no a preferential orientation of any of the molecules; instead, both are oriented randomly. However, when the electrode is charged negatively/positively both polar molecules show a preferential orientation. At the negatively charged electrode (blue electrode), Fig. 7(a), both urea and water molecules are aligned in a mixture of perpendicular (i.e., the dipole moments of both molecules point toward the bulk of the solvent, and the  vector (a vector from the carbon to oxygen) of urea and the H–O–H plane of water are perpendicular to the graphene surface) and parallel arrangements (i.e., the
  vector of urea and one of the
  vectors of water are oriented parallel to the electrode surface). This is also confirmed by the evolution of the normalized number density at the highly negatively charged surface (σ = −0.32 C m−2), Fig. 3(a), where the number density of both polar molecules (URE and H2O) exhibits two peaks in the first layer. The first peak corresponds to a perpendicular configuration and the second peak corresponds to a parallel orientation. The mixed orientation can be explained by competition between the electrostatic repulsion (between the negatively charged carbon and partially negatively charged atoms of urea and water) and van der Waals interactions. On the other hand, near the positively charged electrode (red electrode), Fig. 7(c), both molecules lay nearly flat on the surface of the electrode (i.e., all the atoms are nearly at the same distance from the electrode surface). This orientation can be explained by two synergistic interactions: firstly, the electrostatic interaction between the positively charged electrode and the partially negatively charged atoms of both the molecules (oxygen of urea and water) and secondly, the strong hydrogen bonding of both molecules with the chloride anions adsorbed in the vicinity of the positively charged electrode. Overall, these results (Fig. 2–7) underscore the importance of in-depth investigation of the interfacial structure of humidified DESs for optimizing the performance of various electrochemical devices. Therefore, by varying the electrode potential (equivalent to surface charge density) and changing the anion/cation type, it is possible to tailor the interfacial structure, the amount of water in the interface and therefore the electrochemical process that take place at the electrode–electrolyte interface.
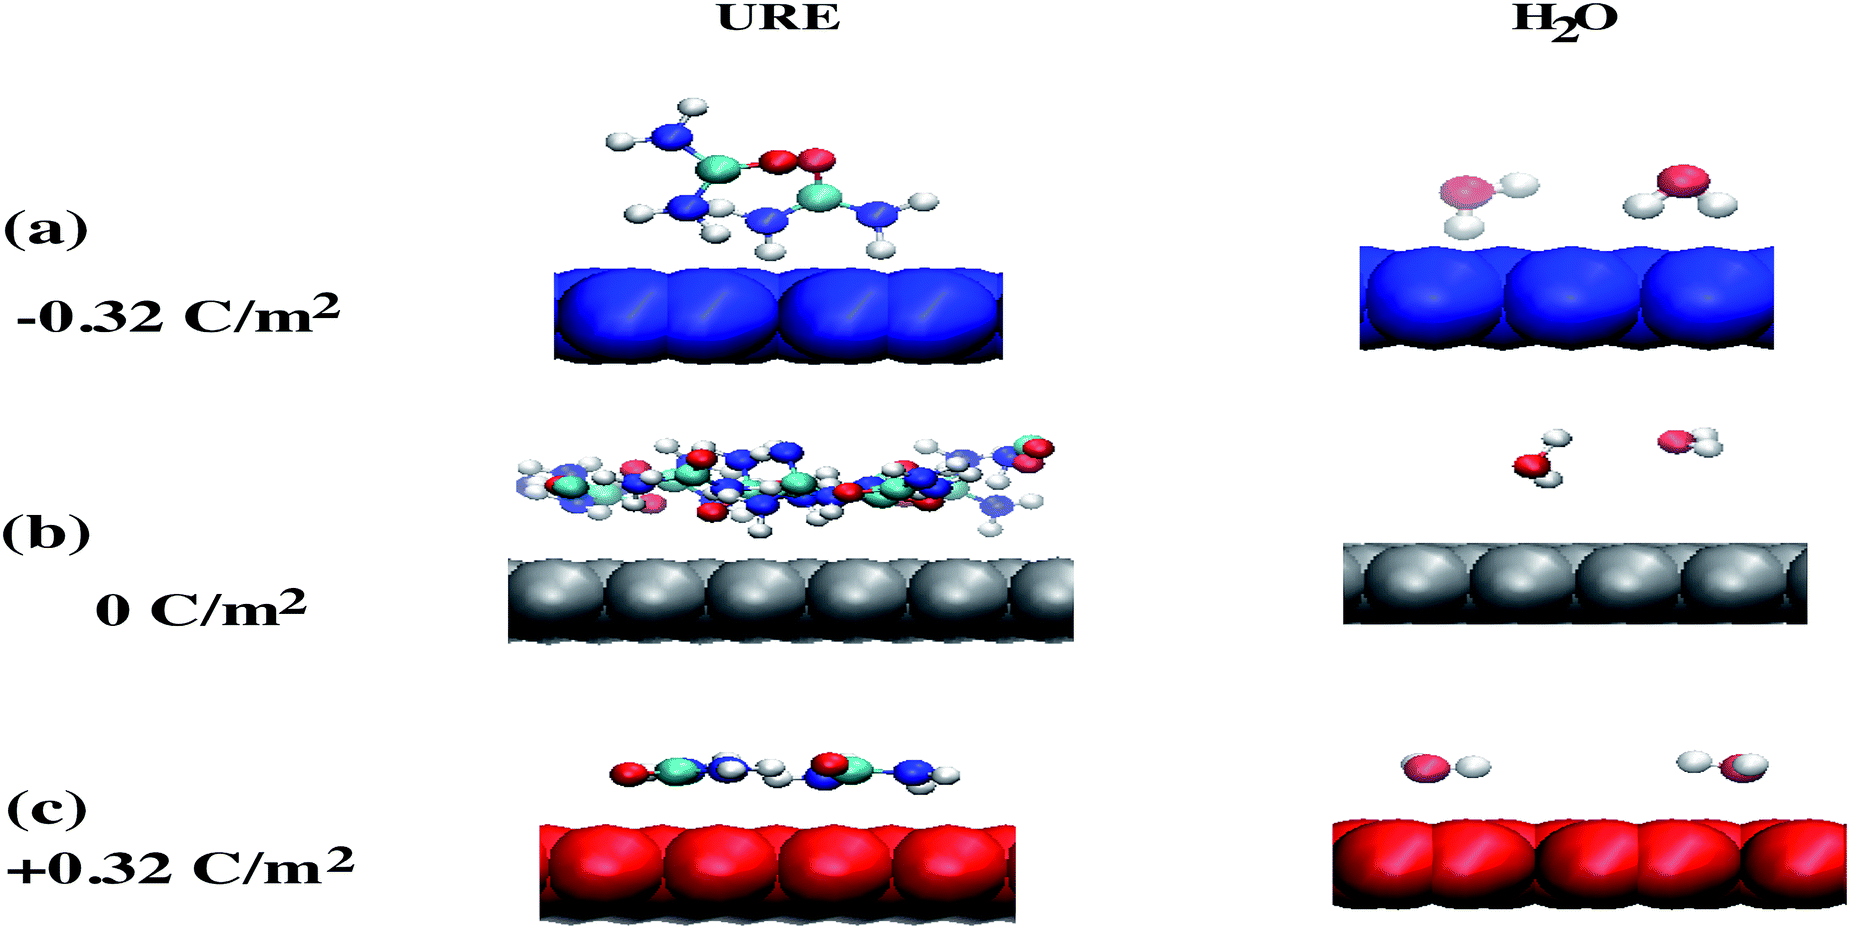 | ||
| Fig. 7 Orientation of urea and water molecules near the electrode surface: a snapshot of the final orientation of urea and water molecules in the vicinity of the electrode surface for different surface polarizations −0.32 C m−2 (a), 0 C m−2 (b) and +0.32 C m−2 (c) for the 3 wt% system. The uncharged electrode is colored grey, whereas negatively and positively charged electrodes are colored blue and red, respectively. The color coding of the atoms of urea and water is: white, hydrogen; cyan, carbon; blue, nitrogen; and red, oxygen. | ||
4 Conclusions
In conclusion, with the growing demand for DESs as solvents for electrochemical processes and due to their hygroscopicity, fundamental understanding of water electrosorption in the DESs–electrode interface is indispensable. In this study, using atomistic molecular dynamics, we have investigated the electrosorption of water in a graphene confined 1:2 choline chloride–urea (Reline) system across a wide range of surface polarizations. The use of such an approach allows investigating all the possible interactions in the bulk (intramolecular and intermolecular interactions) as well as at the interface (intermolecular and external electrostatic interactions). The simulation results show that the interfacial structure and the distribution of water are sensitive to the electrode surface polarization. The water electrosorption is mainly dependent on two factors: the local intermolecular interactions with Reline species and electrostatic interaction with the charged or uncharged graphene electrode. For the uncharged surface, the interfacial region is composed of both Reline species (choline cations and urea molecules) and residual water molecules: the electrosorption of water is mainly related to the strong intermolecular interaction with urea and chloride. For a moderate charge, the water molecules are depleted from the negatively charged electrode and accumulated in the vicinity of the positively charged electrode, due to the preferential hydration of chloride anions. In contrast, for the highly charged graphene surface, water accumulates at both electrodes. This is linked with the strong correlation between the nonhomogeneous electric field in the vicinity of the graphene electrode and the water dipole, which results in the accumulation of water at a position where the electric field displays maximum or minimum 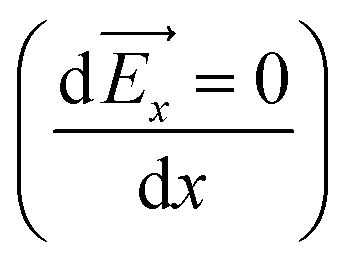 . Hence, a further increase in surface polarization leads to further increase in water in the interfacial region, which implies that the electrostatic interactions are predominant. In addition, both water and urea molecules show distinct orientation on the graphene electrode upon charging: mixed perpendicular and parallel orientations on a negatively charged electrode and a flat orientation on a positively charged electrode. These findings are important to predict and control the amount of water at the vicinity of the interfacial region and to optimize the performance of DESs for a wide variety of electrochemical systems.
Conflicts of interest
There are no conflicts to declare.Acknowledgements
M. H. Mamme and E. A. M. Cherigui acknowledges funding from the Fonds Wetenschappelijk Onderzoek in Flanders (FWO, project G019014N). J. Ustarroz acknowledges funding from the Fonds Wetenschappelijk Onderzoek in Flanders (FWO, postdoctoral grant 12I7816N). F. De Proft and S. L. C Moors acknowledge Strategic Research Program funding from the VUB. F. De Proft also acknowledges the Francqui foundation for a position as “Francqui research professor”.References
- K. S. Egorova and V. P. Ananikov, ChemSusChem, 2014, 7, 336–360 CrossRef CAS.
- E. Liwarska-Bizukojc, C. Maton and C. V. Stevens, Biodegradation, 2015, 26, 453–463 CrossRef CAS.
- D. Zhao, Y. Liao and Z. Zhang, Clean: Soil, Air, Water, 2007, 35, 42–48 CAS.
- L. I. Tomé, V. Baião, W. da Silva and C. M. Brett, Mater. Today, 2018, 10, 30–50 Search PubMed.
- E. L. Smith, A. P. Abbott and K. S. Ryder, Chem. Rev., 2014, 114, 11060–11082 CrossRef CAS.
- O. S. Hammond, D. T. Bowron and K. J. Edler, Angew. Chem., Int. Ed., 2017, 56, 9782–9785 CrossRef CAS.
- D. Shah and F. S. Mjalli, Phys. Chem. Chem. Phys., 2014, 16, 23900–23907 RSC.
- T. Zhekenov, N. Toksanbayev, Z. Kazakbayeva, D. Shah and F. S. Mjalli, Fluid Phase Equilib., 2017, 441, 43–48 CrossRef CAS.
- A. P. Abbott, D. Boothby, G. Capper, D. L. Davies and R. K. Rasheed, J. Am. Chem. Soc., 2004, 126, 9142–9147 CrossRef CAS.
- Q. Zhang, K. De Oliveira Vigier, S. Royer and F. Jérôme, Chem. Soc. Rev., 2012, 41, 7108 RSC.
- H. Zhao, G. A. Baker, D. V. Wagle, S. Ravula and Q. Zhang, ACS Sustainable Chem. Eng., 2016, 4, 4771–4780 CrossRef CAS.
- H. Passos, D. J. P. Tavares, A. M. Ferreira, M. G. Freire and J. A. P. Coutinho, ACS Sustainable Chem. Eng., 2016, 4, 2881–2886 CrossRef CAS.
- H. Zhao and G. A. Baker, J. Chem. Technol. Biotechnol., 2013, 88, 3–12 CrossRef CAS.
- N. Azizi, E. Batebi, S. Bagherpour and H. Ghafuri, RSC Adv., 2012, 2, 2289 RSC.
- B. Singh, H. Lobo and G. Shankarling, Catal. Lett., 2011, 141, 178–182 CrossRef CAS.
- M. C. Gutiérrez, D. Carriazo, C. O. Ania, J. B. Parra, M. L. Ferrer and F. Monte, Energy Environ. Sci., 2011, 4, 3535–3544 RSC.
- M. C. Gutiérrez, D. Carriazo, A. Tamayo, R. Jiménez, F. Picó, J. M. Rojo, M. L. Ferrer and F. del Monte, Chem.–Eur. J., 2011, 17, 10533–10537 CrossRef PubMed.
- W. Zhu, C. Wang, H. Li, P. Wu, S. Xun, W. Jiang, Z. Chen, Z. Zhao and H. Li, Green Chem., 2015, 17, 2464–2472 RSC.
- L. L. Sze, S. Pandey, S. Ravula, S. Pandey, H. Zhao, G. A. Baker and S. N. Baker, ACS Sustainable Chem. Eng., 2014, 2, 2117–2123 CrossRef CAS.
- M. Francisco, A. van den Bruinhorst, L. F. Zubeir, C. J. Peters and M. C. Kroon, Fluid Phase Equilib., 2013, 340, 77–84 CrossRef CAS.
- T. J. Trivedi, J. H. Lee, H. J. Lee, Y. K. Jeong and J. W. Choi, Green Chem., 2016, 18, 2834–2842 RSC.
- I. Mamajanov, A. Engelhart, H. Bean and N. Hud, Angew. Chem., Int. Ed., 2010, 49, 6310–6314 CrossRef CAS.
- D. Mondal, M. Sharma, C. Mukesh, V. Gupta and K. Prasad, Chem. Commun., 2013, 49, 9606 RSC.
- C. Du, B. Zhao, X.-B. Chen, N. Birbilis and H. Yang, Sci. Rep., 2016, 6, 29225 CrossRef CAS.
- A. H. Whitehead, M. Pölzler and B. Gollas, J. Electrochem. Soc., 2010, 157, D328–D334 CrossRef CAS.
- E. A. Mernissi Cherigui, K. Sentosun, P. Bouckenooge, H. Vanrompay, S. Bals, H. Terryn and J. Ustarroz, J. Phys. Chem. C, 2017, 121, 9337–9347 CrossRef CAS.
- P. Sebastián, M. I. Giannotti, E. Gómez and J. M. Feliu, ACS Appl. Energy Mater., 2018, 1, 1016–1028 CrossRef.
- L. Wei, B. Lu, M. Sun, N. Tian, Z. Zhou, B. Xu, X. Zhao and S. Sun, Nano Res., 2016, 9, 3547–3557 CrossRef CAS.
- J. Aldana-González, M. Romero-Romo, J. Robles-Peralta, P. Morales-Gil, E. Palacios-González, M. Ramírez-Silva, J. Mostany and M. Palomar-Pardavé, Electrochim. Acta, 2018, 276, 417–423 CrossRef.
- H.-R. Jhong, D. S.-H. Wong, C.-C. Wan, Y.-Y. Wang and T.-C. Wei, Electrochem. Commun., 2009, 11, 209–211 CrossRef CAS.
- M. H. Chakrabarti, F. S. Mjalli, I. M. AlNashef, M. A. Hashim, M. A. Hussain, L. Bahadori and C. T. J. Low, Renewable Sustainable Energy Rev., 2014, 30, 254–270 CrossRef CAS.
- D. Lloyd, T. Vainikka and K. Kontturi, Electrochim. Acta, 2013, 100, 18–23 CrossRef CAS.
- Y.-J. Ju, C.-H. Lien, K.-H. Chang, C.-C. Hu and D. S.-H. Wong, J. Chin. Chem. Soc., 2012, 59, 1280–1287 CrossRef CAS.
- D. Lloyd, T. Vainikka, L. Murtomäki, K. Kontturi and E. Ahlberg, Electrochim. Acta, 2011, 56, 4942–4948 CrossRef CAS.
- A. P. Abbott, G. Capper, K. J. McKenzie and K. S. Ryder, Electrochim. Acta, 2006, 51, 4420–4425 CrossRef CAS.
- J. A. Hammons and J. Ilavsky, Electrochim. Acta, 2017, 228, 462–473 CrossRef CAS.
- W. C. Su, D. S. H. Wong and M. H. Li, J. Chem. Eng. Data, 2009, 54, 1951–1955 CrossRef CAS.
- O. Ciocirlan, O. Iulian and O. Croitoru, et al. , Rev. Chim., 2010, 61, 721–723 CAS.
- E. O. Fetisov, D. B. Harwood, I.-F. W. Kuo, S. E. Warrag, M. C. Kroon, C. J. Peters and J. I. Siepmann, J. Phys. Chem. B, 2018, 122, 1245–1254 CrossRef CAS.
- S. L. Perkins, P. Painter and C. M. Colina, J. Phys. Chem. B, 2013, 117, 10250–10260 CrossRef CAS.
- R. Stefanovic, M. Ludwig, G. B. Webber, R. Atkin and A. J. Page, Phys. Chem. Chem. Phys., 2017, 19, 3297–3306 RSC.
- S. Zahn, B. Kirchner and D. Mollenhauer, ChemPhysChem, 2016, 17, 3354–3358 CrossRef CAS.
- G. García, M. Atilhan and S. Aparicio, Chem. Phys. Lett., 2015, 634, 151–155 CrossRef.
- D. V. Wagle, G. A. Baker and E. Mamontov, J. Phys. Chem. Lett., 2015, 6, 2924–2928 CrossRef CAS.
- D. V. Wagle, C. A. Deakyne and G. A. Baker, J. Phys. Chem. B, 2016, 120, 6739–6746 CrossRef CAS.
- S. Zahn, Phys. Chem. Chem. Phys., 2017, 19, 4041–4047 RSC.
- D. Wagle, L. Adhikari and G. Baker, Fluid Phase Equilib., 2017, 448, 50–58 CrossRef CAS.
- C. R. Ashworth, R. P. Matthews, T. Welton and P. A. Hunt, Phys. Chem. Chem. Phys., 2016, 18, 18145–18160 RSC.
- C. Du, H. Yang, X.-B. Chen, L. Wang, H. Dong, Y. Ning, Y. Lai, J. Jia and B. Zhao, J. Mater. Sci., 2018, 53, 10758–10771 CrossRef CAS.
- M. Forsyth, P. C. Howlett, A. E. Somers, D. R. MacFarlane and A. Basile, npj Mater. Degrad., 2017, 1, 18 CrossRef.
- H.-G. Liao, Y.-X. Jiang, Z.-Y. Zhou, S.-P. Chen and S.-G. Sun, Angew. Chem., 2008, 120, 9240–9243 CrossRef.
- A. P. Abbott and K. J. McKenzie, Phys. Chem. Chem. Phys., 2006, 8, 4265–4279 RSC.
- O. S. Hammond, H. Li, C. Westermann, A. Y. Al-Murshedi, F. Endres, A. P. Abbott, G. G. Warr, K. J. Edler and R. Atkin, Nanoscale Horiz., 2019, 4, 158–168 RSC.
- Y. Dai, G.-J. Witkamp, R. Verpoorte and Y. H. Choi, Food Chem., 2015, 187, 14–19 CrossRef CAS PubMed.
- F. P. McCullough, Flexible carbon fiber electrode with low modulus and high electrical conductivity, battery employing the carbon fiber electrode, and method of manufacture, US Pat. 5,532,083, 1996.
- E. A. Mernissi Cherigui, K. Sentosun, M. H. Mamme, M. Lukaczynska, S. Bals, H. Terryn and J. Ustarroz, J. Phys. Chem. C, 2018, 112, 23129–23142 CrossRef.
- M. Lukaczynska, E. A. Mernissi Cherigui, K. Van Den, J. De Strycker, H. Terryn and J. Ustarroz, Electrochim. Acta, 2019, 319, 690–704 CrossRef CAS.
- V. Zoete, M. A. Cuendet, A. Grosdidier and O. Michielin, J. Comput. Chem., 2011, 32, 2359–2368 CrossRef CAS.
- T. Darden, D. York and L. Pedersen, J. Chem. Phys., 1993, 98, 10089–10092 CrossRef CAS.
- W. Humphrey, A. Dalke and K. Schulten, J. Mol. Graphics, 1996, 14, 33–38 CrossRef CAS.
- M. V. Fedorov and A. A. Kornyshev, Chem. Rev., 2014, 114, 2978–3036 CrossRef CAS PubMed.
- S. Baldelli, Acc. Chem. Res., 2008, 41, 421–431 CrossRef CAS.
- S. Lamperski, C. Outhwaite and L. Bhuiyan, J. Phys. Chem. B, 2010, 114, 3075 CrossRef CAS.
- D. C. Grahame, Chem. Rev., 1947, 41, 441–501 CrossRef CAS.
- G. Jiang, C. Cheng, D. Li and J. Z. Liu, Nano Res., 2016, 9, 174–186 CrossRef CAS.
- M. H. Mamme, S. Moors, H. Terryn, J. Deconinck, J. Ustarroz and F. De Proft, J. Phys. Chem. Lett., 2018, 9, 6296–6304 CrossRef CAS.
Footnotes |
| † Electronic supplementary information (ESI) available. See DOI: 10.1039/c9na00331b |
| ‡ These co-last authors contributed equally to this work. |
| This journal is © The Royal Society of Chemistry 2019 |