
 Open Access Article
 This Open Access Article is licensed under a
 Creative Commons Attribution 3.0 Unported Licence
Aqueous two-polymer phase extraction of single-wall carbon nanotubes using surfactants†
Jeffrey A.
Fagan
 *
*
Materials Science and Engineering Division, National Institute of Standards and Technology, Gaithersburg, MD, USA 20899. E-mail: Jeffrey.fagan@nist.gov
First published on 11th July 2019
Abstract
This review details the current state of the art in aqueous two-phase extraction (ATPE) based separations of surfactant dispersed single-wall carbon nanotubes by their chemical species, i.e., (n,m) structure, semiconducting or metallic nature, and enantiomeric handedness. Discussions of the factors affecting each separation, including workflow effects, variations of different surfactant and nanotube materials, and the underlying physical mechanism are presented. Lastly an outlook on the applications of ATPE at bench scale and implementation to larger scales is discussed, along with identification of research directions that could further support ATPE development.
Introduction
Single-wall carbon nanotubes (SWCNTs) are different from most engineered nanoparticles in that the length scale that primarily determines their confinement-driven properties is set by a distinct crystalline lattice structure for each nanotube species. These species, which are denoted by the (n,m) lattice vector that describes the orientation of the graphene lattice comprising the SWCNT and its diameter, each have unique optical, electrical, thermal and mechanical properties.1 However, despite significant and ongoing developments, synthetic methods demonstrated at commercial scale cannot yet synthesize single (n,m) population materials,2 but instead produce mixtures of many SWCNT (n,m)s together with impurity carbon forms and residual catalyst. To realize in macroscopic samples the distinct properties of these materials there has subsequently been a decade plus long set of efforts to both purify SWCNTs from non-SWCNT materials,3–5 and then to separate that material into subpopulations based on structural characteristics, e.g., diameter, (n,m), enantiomeric handedness, or electronic properties.Many techniques and separation schemes have been developed to sort heterogenous SWCNT (n,m) and impurity mixtures.4–6 For the removal of bulk impurities from SWCNT samples the most common methods are acid treatment for raw SWCNT soot and centrifugation for dispersed SWCNT populations. For subpopulation separations, such as by (n,m), or metallicity, which require prior individualization of the nanotubes and thus a processing step to generate a dispersion, a much more diverse set of methods has been applied including ultracentrifugation (both density gradient (DGU)7,8 and rate-zonal methods), electrophoresis,9 ion-exchange10 and gel chromatography,11–13 selective polymer dispersion-extraction in organic solvents14,15 and aqueous two-phase extraction (ATPE).16 Among the most recently invented and developed techniques, ATPE can be utilized for either bulk purification17 or selection of SWCNT subpopulations.18,19 In particular, this perspective is focused on the implementation of APTE that utilizes competition of one or more small molecule surfactant types for adsorption on the SWCNT surface to regulate partitioning between the two-phases of a single stage aqueous two-phase system; ATPE separations of SWCNTs driven by selective DNA sequences20,21 are a separate processing strategy that is not the primary focus of this contribution.
ATPE itself as a separation technique was invented and first developed by Albertsson22 in the 1950s for the separation of cellular components and biomolecules. In ATPE, two water-soluble polymers are mixed together in water at a sufficient concentration to drive a thermodynamic phase transition from a single homogenous solution into two phases. Commonly these two polymer phases will have different solution densities, which facilitates coalescence and spatial separation of both phases via oppositional sedimentation/creaming within (5 to 20) minutes on the bench or less than ≈ 2 min in a low speed centrifuge. The concentration of the polymers necessary to drive the phase transition depends on the chemical properties of each polymer as well as their molecular mass distributions,23 with both the critical point concentrations and phase boundaries well described for many common polymer A:polymer B systems in Albertsson's book22 describing the ATPE technique and its uses. For any set of polymer concentrations beyond the critical concentration line, at equilibrium, the mixture will separate into two phases having concentrations at the phase boundaries, one phase rich in polymer A (but with some B) and vice versa. The relative volumes of the two phases are determined by the slope of the “tie-line” connecting the two endpoint concentrations and the position of the initial, global, concentration along its length. Importantly, any initial composition of the two polymers along the same tie-line will generate identical compositions of the separated phases, varying only in the relative volume of each phase. The phase diagram for a representative 6 kDa polyethylene glycol (PEG):≈70 kDa dextran (DEX) ATPE system is shown in Fig. 1.
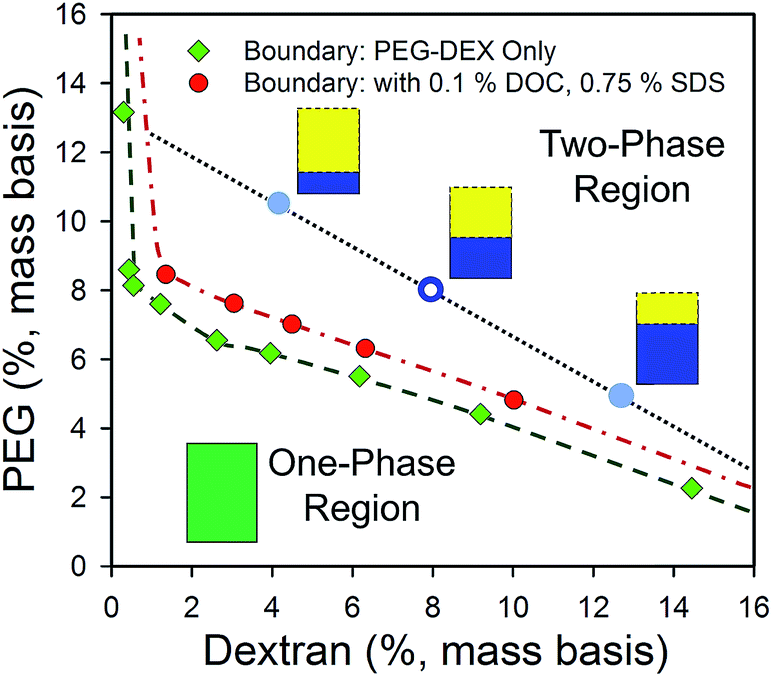 | ||
| Fig. 1 Phase diagram of a 6 kDa PEG and dextran 70 ATPE system in water determined by the cloud point method22 without (green diamond symbols) or in the presence of surfactants (red filled circles) at room temperature (≈21 °C). Compositions of PEG and DEX within the two-phase region, such as at the open blue circle, will at equilibrium form two phases at compositions located along the coexistence curve (dashed green eyeguide/dot-dash red eyeguide), and connected by a tie-line (black dotted eyeguide). In the PEG–dextran ATPE system the upper phase is PEG-rich phase, and the lower phase is dextran-rich. All initial compositions along a tie-line produce identical composition of the two phases, but at different volume ratios due to mass conservation (e.g. schematic volumes at the blue filled circles). The red circles report the coexistence curve, also called the binodal, of the polymers in the presence of 0.1% (mass basis) DOC and 0.75% (mass basis) SDS, which shifts the coexistence curve to slightly greater polymer mass fractions. Most conditions encountered in the use of surfactant-ATPE for SWCNTs will display similar coexistence curves. | ||
Selective partitioning of additional components, such as solutes or dispersed nanoparticles, occurs if those components have different chemical affinities for the two phases, such that their distribution across the separated polymer phases is not volumetric.24 This is the phenomenon enabling separation of SWCNTs by ATPE. We utilize different polymer and additive compositions such that the component SWCNTs to be separated in a mixed population have different affinities for the two phases. In the simplification that the partition coefficients for each component are independent, which is generally reasonable due to their dilute concentration relative to the polymers, the task is then to find the condition, or set of conditions, at which the initial population is best fractionated into the desired subpopulations.25
The most common implementation of ATPE for SWCNTs is to use surfactant concentrations to control the SWCNT partitioning between the two phases. The bile salt surfactants sodium deoxycholate (DOC) or sodium cholate (SC) are frequently competed with the alkyl chain structure surfactant sodium dodecyl sulfate (SDS) in a polyethylene glycol (PEG) and dextran (DEX) aqueous two-phase system to control this partitioning. In either case, coverage of the SWCNT sidewall by DOC or SC tends to partition SWCNTs into the bottom, dextran-rich phase, and coverage by SDS partition into the PEG-rich upper phase. Depending on the type of surfactants competed, (n,m) selection (SDS–DOC mostly, with (n,m) selection mainly but not exclusively through diameter selectivity), enantiomeric handedness enrichment, and separation of metallic from semiconducting as well as finer degrees of bandgap size (SDS–SC mostly), have been reported. Different strategies with respect to isolation of purified populations have also been reported; in my lab we tend to apply generalized processing workflows to make several separations with the goal to collect pure, or enriched populations of all (n,m) structures present. Other groups have reported optimized short step routes to isolate specific (n,m) structures,26–28 but with the typical cost for such simplification being that all other species are aggregated and discarded. Both strategies can be useful given time constraints and the easier adoption and dissemination of recipe methods, and will be described in more detail in the next section.
Beyond the most common applications of ATPE, it is also readily possible to use other surfactants, 3-component surfactant mixtures, different polymer two-phase systems, and/or many additional modulating chemicals. In our labs at NIST, and in other reports, screening has identified a number of alternative methods that can be applied with varying levels of success and utility. Development of new ATPE variations should also be expected given the relative newness of the method. Although some instances are noted below, the phase space of possible variation is too broad to describe all known or reported variants in this contribution.
Theory
Partition coefficients, Ki, are defined as the ratio of the concentration of component i in the top phase, cT,i, to the concentration of the same component in the bottom phase, cB,i. Assuming the partition coefficient of each (n,m) is independent of both that of other species and its own concentration,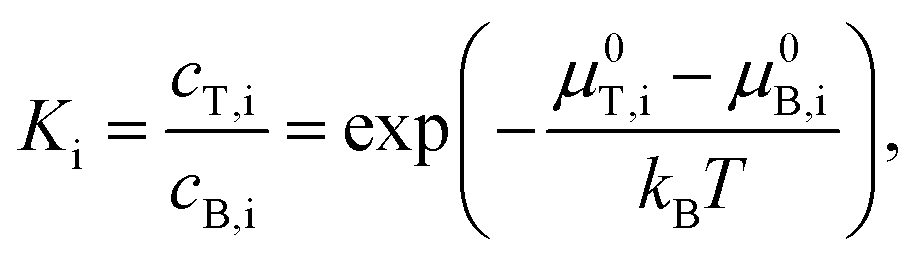 in which μ0T,i and μ0B,i are the standard chemical potentials of component i in the top and bottom phases, kB is the Boltzmann constant, and T is the absolute temperature.16 Thus, relatively small differences in chemical potential of different SWCNT (n,m)s in the two phases can lead to large differences in partitioning, especially if the difference of the top and bottom chemical potentials switches signs. The effectiveness of separation is then also affected by mass conservation, which require Vtotctot,i = VTcT,i + VBcB,i + VIcI,i, in which VT, VB, and VI are, respectively, the volumes of the top phase, bottom phase and the interface. This is worth remembering because large ratios in the volumes of the two polymer phases can constrain the effectiveness of separation of two (n,m) species if the partition coefficients are not reasonably different.
Whether the partitioning of the species reaches equilibrium before the two polymer phases spatially separate due to mass transfer limitations, i.e. can the SWCNTs distribute across the separating two-phase chemical gradient fast enough to reach their desired equilibrium distribution before the spatial separation of the coalescing polymer phases makes it impossible, also raises the issue of stage efficiency and the concept of theoretical plates of separation. From a practical standpoint, mass transfer effects tend to be biased against the transfer of (n,m)s from the phase the SWCNT is in to the other phase, i.e., against SWCNTs in the bottom phase partitioning into a top phase in a sequential ATPE step, so excepting applications such as chromatographic separation (vide infra), the analogy to separations such as distillation is not complete. However, the fact that non-achievement of equilibrium will also limit the realized separation should be remembered.
Discussion
The utility of the ATPE separation method as compared to other techniques previously used for SWCNT sorting is immense for several reasons. These include the high tunability of the separation, the rapid and efficient partitioning by spinodal decomposition of the phases, and the ease of accomplishing both separation of semiconducting from metallic SWCNTs and diameter separation in the same chemical system. Additional practical benefits are the need for no major equipment, low energy costs, the nontoxicity and low cost of the polymers, and much greater mass throughput than DGU or gel chromatography. Variations of this still developing technique have shown applicability across a broad range of SWCNT diameters with minimal adjustment, the capability to separate SWCNTs all the way to the enantiomer level, and even the ability to isolate DWCNT subpopulations.29 Here I highlight the strengths and primary variations for SWCNT processing.Overview: single and multistage separations
A key ability of ATPE for SWCNT sorting is the option of applying multiple stages of ATPE separation at different, but controlled, conditions to refine separations, and, if necessary, to switch between diameter and semiconducting–metallic separation to reach highly purified fractions in one process. In a single fractionation, i.e., a single stage, some SWCNTs will partition into the top phase, and some into the bottom phase, with the split controlled by the surfactant concentrations within the stage. For multistage separation, the resulting top and bottom phases are first physically separated from each other, usually by pipetting or decanting, and then new polymer and surfactant is added and mixed with the first phase such that another two-polymer phase separation will occur and further refine the fractionating SWCNT population. This is shown schematically in Fig. 2A. In our internal lingo, we successively add a label, T or B, for each stage to denominate the potentially geometrically increasing number of phases. To keep track of when the goal of the fractionation was semiconducting–metallic SWCNT separation the phases are alternatively labelled with a MT or MB, for respective transfer to the top phase (usually semiconducting enriched) or bottom phase (metallic enriched). For instance, a sub-population of SWCNTs that partitioned into the top phase in the first two stages, subjected to a semiconducting–metallic separation in the third stage with partition into the top phase, a normal partition into the bottom phase during the fourth stage, and then again into the top phase would be labelled TTMTBT. For samples that repetitively partition to the same phase across multiple sequential stages these labels are collapsed to save space, e.g. BBBBT becomes 4BT. I have attempted to avoid using imprecise terminology in this contribution, but terms such as “pushed down”, referring to transferring a subpopulation into a bottom phase or “pulled up”, i.e., transferring a subpopulation into an upper phase are commonly used by practitioners and may have slipped through.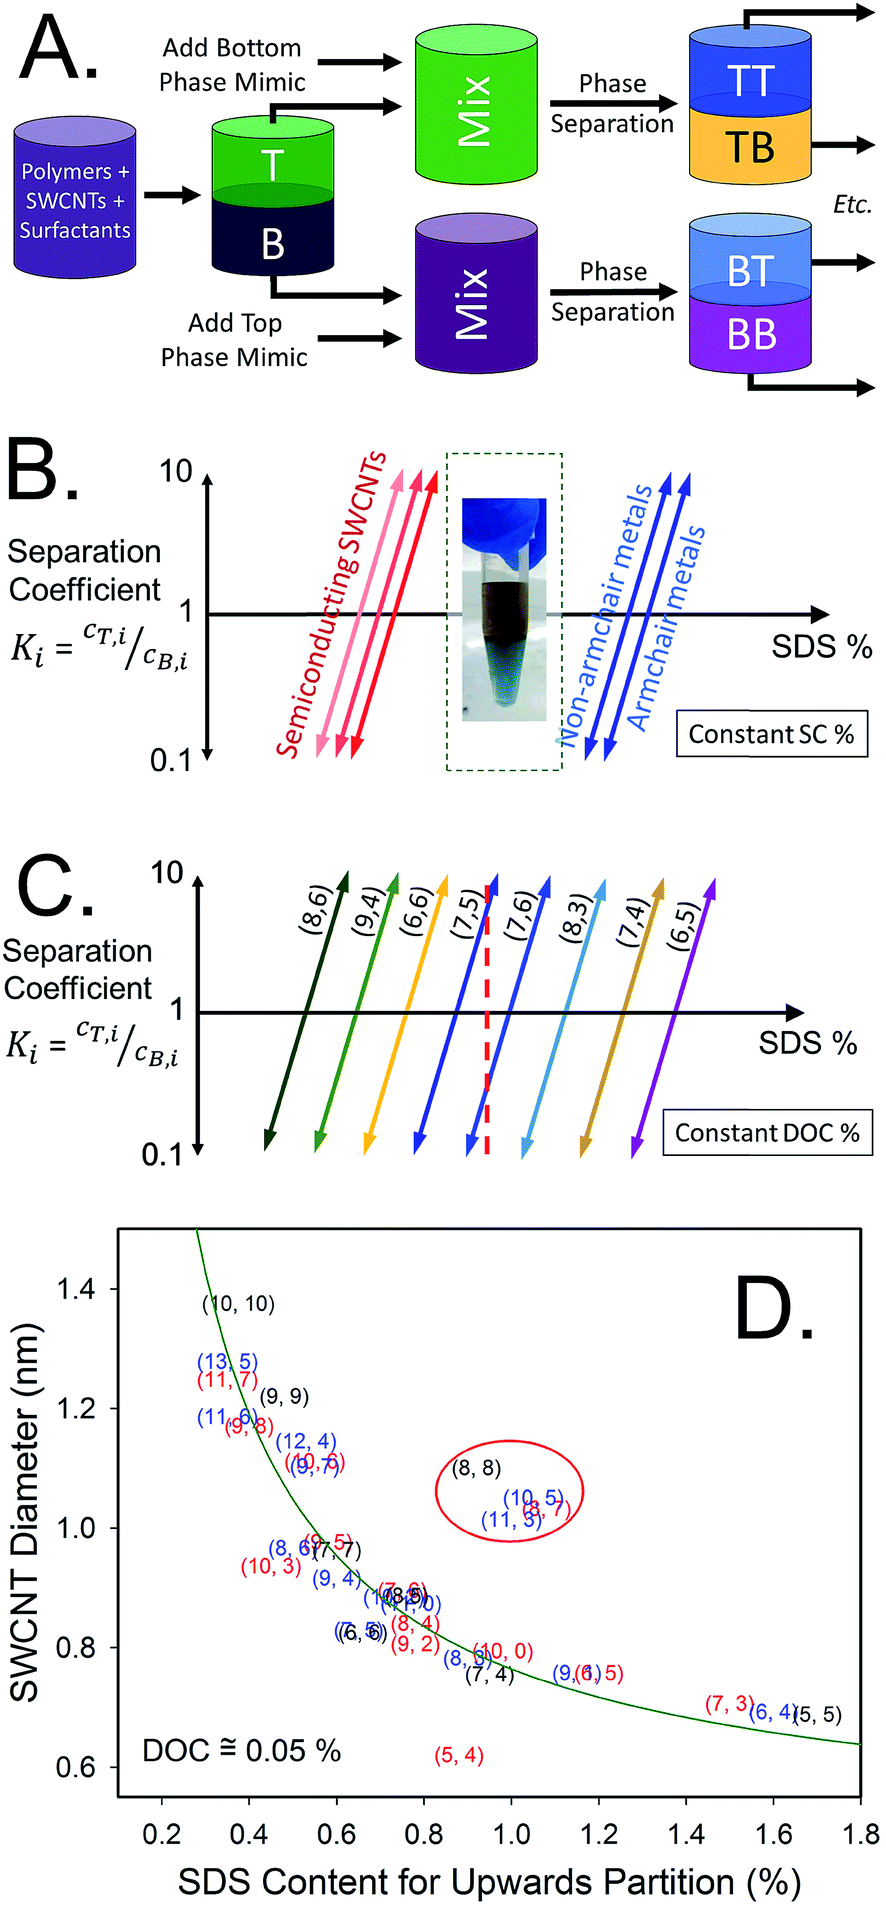 | ||
| Fig. 2 (A) Schematic of a multistage ATPE separation. (B) Schematic of the separation coefficient functionality for a semiconducting–metallic SWCNT separation at constant SC and oxidant (NaClO) concentration as a function of SDS addition. (C) Schematic of the separation coefficient functionality of different (n,m) SWCNTs for SDS/DOC competition separations as a function of SDS concentration for constant DOC. At the SDS concentration shown by the red (dashed) vertical line, approximately all of the (8,6), (9,4), (6,6) and most of the (7,5) would partition to the top phase, with the other shown species partitioning to the bottom phase. (D) Points showing the approximate SDS concentration required to partition the labelled species into the top phase of the PEG 6 kDa:DEX 70 ATPE system at ≈20 °C and a DOC concentration of 0.05%. The data quality was insufficient to discriminate enantiomers. Adapted from Fagan et al.,19ACS Nano, 2015, 9, 5377–5390. | ||
The governing factors for each stage of the separation can be viewed through the lens of the separation coefficient. Schematic figures for the separation coefficient for SDS/SC competition and SDS/DOC competition are shown in Fig. 2B and C respectively.
In the semiconducting–metallic separation schematic in Fig. 2B, there is a window of SDS concentrations, at the implied SC and oxidant concentrations, that allows for differential partitioning of the semiconducting and metallic subpopulations of the SWCNT dispersion. At low SDS concentration, all SWCNTs partition into the bottom phase (all Ki ≪ 1). With increased SDS concentration, first semiconducting SWCNTs will partition to the top phase (Ksemiconducting ≥ 1), followed by metallic SWCNTs at significantly greater SDS concentration. At SDS concentrations in between these two values, separation of the semiconducting and metallic SWCNTs will occur as indicated by the picture (Ksemiconducting ≫ 1, Kmetallic ≪ 1).
In the schematic of Fig. 2C, the competition of SDS and DOC for each SWCNT's surface instead produces a series of separation coefficient curves as a function of SDS concentration. Each SWCNT (n,m), and more precisely its (m,n) enantiomer as well, appears experimentally to have a different separation coefficient functionality. Performing an ATPE separation at any point along the SDS concentration vector in Fig. 2C, and imagining that the separation coefficients are all step functions, all of the SWCNT (n,m)s to the left of the SDS concentration chosen will partition into the top phase, and all the SWCNT (n,m)s to the right into the bottom phase. Empirically the separation coefficient functionality is not a step function, however, and for (n,m) structures with curves that overlap the chosen SDS concentration, those (n,m)s will distribute between both phases at equilibrium. The approximate partition points, where the separation coefficient equals 1, for each SWCNT species were first collated into a figure in Fagan et al.19 for selected species for which data was available. This figure is reproduced as Fig. 2D. In this approximate, and empirical, figure, it is clear that there is both a significant diameter trend with respect to the SDS concentration at which individual (n,m) species partition, but also that there is significant scatter from the trend on the basis of the specific structure. Better clarification of these values, and with greater species and enantiomer resolution, is a recommendation of this contribution.
With the governing ideas described, the application of different surfactant combinations for different separation schemes and workflows can be presented.
Purification
A simple but notable use of ATPE was reported by Subbaiyan et al.,17 which is to take advantage of the differential affinity of many impurities within a SWCNT dispersion for the alternate phase when the surfactant concentration is precisely controlled. They demonstrated that a single (or in practical application two) ATPE steps could accomplish similar purification of the initial dispersion as application of bulk centrifugation and worked for SWCNTs up to at least 20 μm in length. A diagram of their approach is presented as Fig. 3A. For DOC dispersed SWCNTs, their method removes many impurities to the top phase by reducing the DOC concentration to a level insufficient to hold impurities in the bottom phase, but that retains good dispersion and bottom phase affinity for individualized SWCNTs. After this step, in my lab we would add SDS and transfer the individualized SWCNTs to end in the preferred PEG phase (vide infra), which can additionally purify the SWCNTs, or one can proceed directly to additional separation steps. Although this is a promising approach, and potential very suitable for large scale applications of ATPE, we have not adopted this methodology in our labs, primarily for reasons of continuity with prior processing of SWCNT samples. However, issues such as jamming at high mass loading of SWCNTs (and associated non-SWCNT impurities in the unpurified dispersion), which can form a thin to thick interfacial-trapped gel layer and reduce the yield of good SWCNTs being able to segregate to their desired phase, and implementing a multistage process of the purification to reduce polymer consumption have yet to be addressed.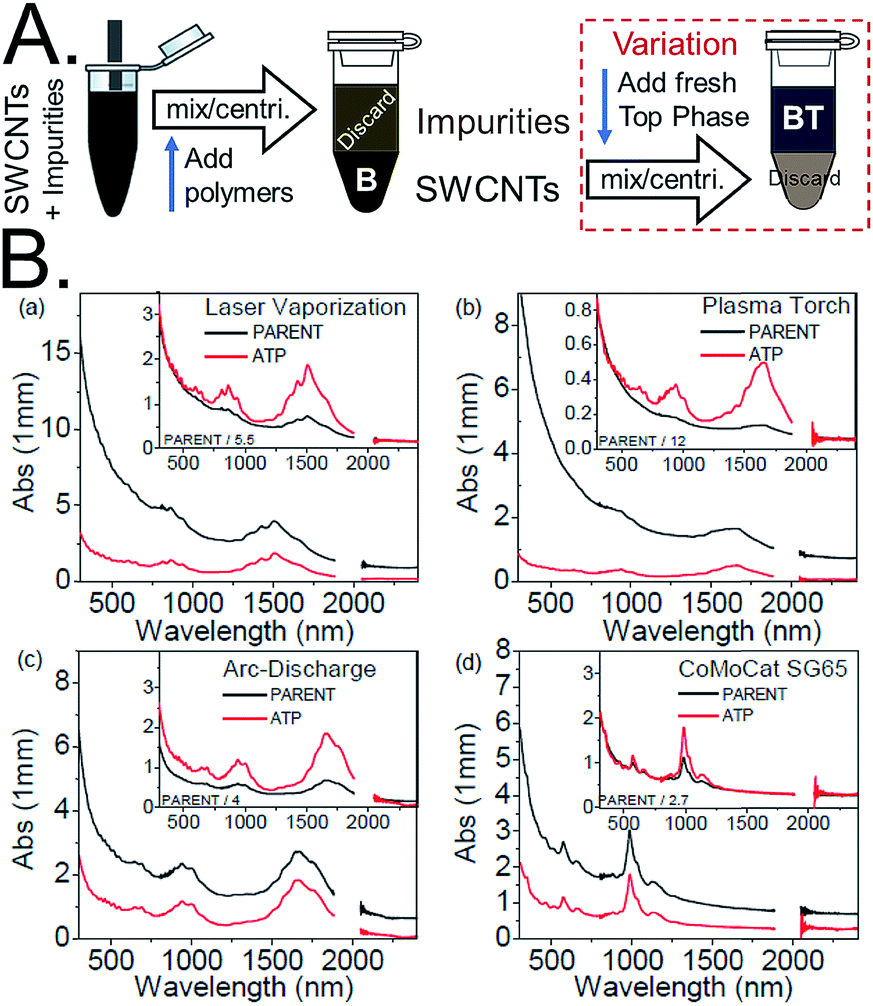 | ||
| Fig. 3 (A) Schematic of SWCNT dispersion purification by ATPE as described by Subbaiyan et al.,17 and with the variation of adding a second step to transfer the purified dispersion to a top phase for collection. For DOC dispersed SWCNT populations, the DOC concentration is reduced to a quantity that enables partition of many impurity types into the top phase, which can be discarded, while retaining the individualized SWCNTs in the bottom phase. In the variation including a second step, addition of SDS and reduction of the DOC concentration with addition of more top phase polymer, is specified to just at the condition needed to partition all SWCNT species to the top phase. Additional impurities will remain in the bottom phase if done correctly. (B) Figures from Subbaiyan et al.17 demonstrating the purification of SWCNT populations of several different average diameters that partition to the bottom phase relative to the original dispersion as shown by the reduction in absorbance that does not display the specific SWCNT optical transitions. Reprinted with permission from Springer Nature: Subbaiyan et al., Nano Res., 2015, 8(5), 1755–1769. Copyright 2014. | ||
In the absence of using highly purified SWCNTs as the ATPE input, however, this purification step can be very valuable, particularly in the isolation of metallic SWCNTs. Many impurities partition similarly to the metallic SWCNTs over the first few stages of the semiconducting–metallic SWCNT separation; removing the contaminants beforehand allows readier visual assessment of that separation.
Semiconducting from metallic SWCNT separation
The easiest application of ATPE is for the separation of highly enriched semiconducting SWCNT populations from the parent dispersion.16,30,31 In my lab this is performed by competing SC with SDS for the SWCNT surface in the ATPE system, most effectively while in the presence of an oxidizing compound such as sodium hypochlorite (NaClO). In the important report of Gui et al.,35 the authors showed that addition of a small quantity of such an oxidizing agent both vastly improved robustness of the semiconducting from metallic separation fidelity, by effectively setting the redox potential in the ATPE system rather than relying on the ambient level, and could also enable band gap selection, critically between true metallic armchair, (n,m = n), SWCNTs and the kBT level bandgap semi-metallic SWCNTs. Because a SWCNT's band gap is strongly related to its diameter, the optimal amount of SC, SDS and oxidant vary with the average diameter of the SWCNT population to be fractionated. Especially for nanotube populations including small diameter SWCNTs it is a good strategy to perform a single separation by diameter, as reported in the next section, before semiconducting–metallic separation to avoid “cross talk” between the two parameters in the separation results.A series of photographs are shown in Fig. 4A of an example semiconducting–metallic separation using electric arc synthesis, ≈1.5 nm average diameter, SWCNTs. In the first row of photographs, four identical vials containing 10 mL each of SWCNT dispersion are first subjected to two ATPE steps to reduce the concentration of DOC in the DOC-dispersed SWCNT sample and to add SC. In the third photograph, the SWCNT containing phase, marked PC#2 in the second photo, has been mixed with additional surfactant, polymers, and oxidant to reach the conditions at which semiconducting/metallic separation will occur. After centrifugation the semiconducting SWCNTs are primarily in the top phase, and the metallic SWCNTs in the bottom. The semiconducting SWCNTs are red-orange colored and the metallic SWCNTs are blue-green for this diameter mixture. In the second row of photos, extraction of additional semiconducting SWCNTs from the MB population and the separation of high purity semiconducting (MTBMT) and metallic (4MBT) populations are shown. Last in the row is a picture of aliquots of the populations in shorter pathlength vials (and after dilution) to show the color difference. As shown in the photos, the ATPE separation can be conducted at SWCNT concentrations over 0.5 mg mL−1. In such cases, a useful tip is to look through the thinner path length of the pipette during extraction to locate the interface. Additional guidance for achieving the best fidelity of separating the interface are described in detail in a later section.
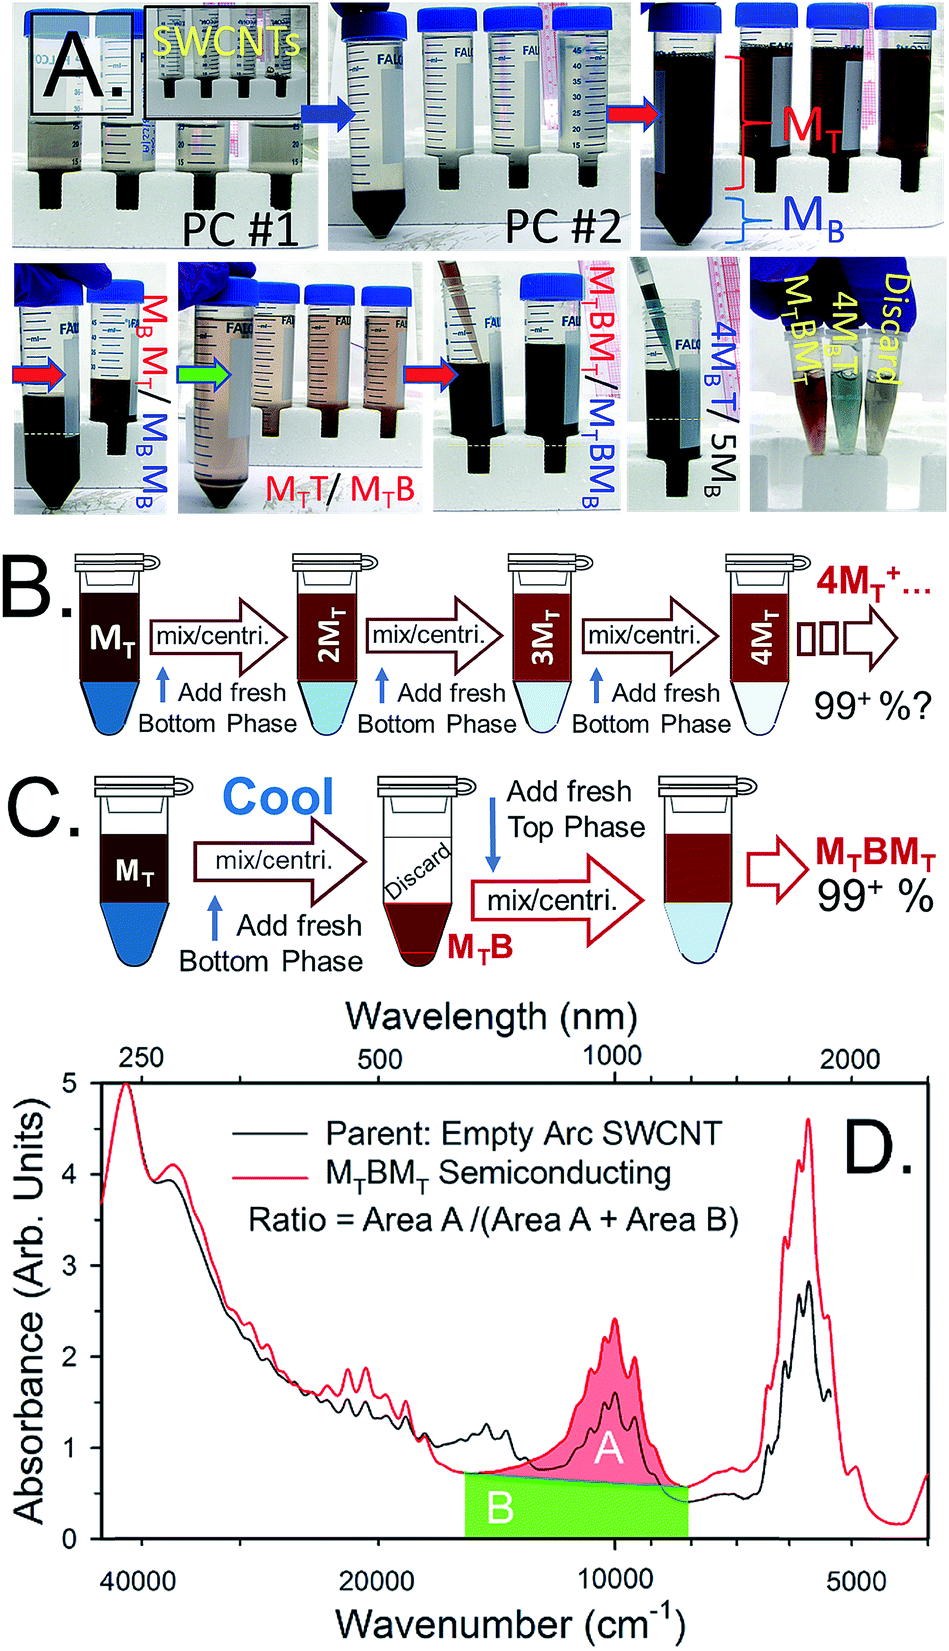 | ||
Fig. 4 (A) Photographs of water-filled electric arc synthesis SWCNTs being separated on the basis of semiconducting and metallic electrical properties from start to finish. The separation conditions for the semiconducting/metallic separation in the in the 3rd, 4th and 6th photos were 0.7% SDS, 0.9% SC and (4 to 5) μL mL−1 1/100th conc. NaClO. After separation, the red-orange-colored semiconducting SWCNTs primarily reside in the top phase, and the blue-green metallic SWCNTs primarily in the bottom phase. The photos are representative of the SWCNT concentration at which the separation is typically conducted in our labs. (B) A possible workflow for increasing semiconducting purity of the top fraction by repeatedly performing ATPE steps to remove contaminant metallic SWCNTs to fresh bottom phase. (C) A recommended replacement workflow in which a temperature change is used to shift all of the SWCNTs into a fresh bottom phase before application of a second, partitioning, ATPE step (back at room temperature). (D) Absorbance spectra of the semiconducting empty electric arc SWCNT synthesis SWCNTs separated as in (A) (red line) compared to the parent dispersion (black line). Absorbance features due to metallic SWCNT such as the peak features around ≈700 nm in the parent dispersion are near completely removed after the separation. The filled areas highlight the integrated regions of the absorbance spectra used for semiconducting purity assessment in literature methods.15 The ratio of A/(A + B) as measured over the shown wavenumber range (8110–15![[thin space (1/6-em)]](https://www.rsc.org/images/entities/char_2009.gif) 575) cm−1 is 0.426. 575) cm−1 is 0.426. | ||
Beyond the surfactant, oxidant, and polymer concentrations of the separation, the order and direction of the ATPE separation can also strongly affect the efficiency of the separation. In Fig. 4B and C two possible workflow diagrams are shown for the separation of a high purity semiconducting SWCNT sample. In general, the workflow in Fig. 4B of sequentially attempting to remove metallic SWCNTs from a semiconducting-enriched top phase over multiple ATPE steps16,30,32 is disfavored over the workflow of Fig. 4C even though high purity populations are eventually produced. This is due mostly to kinetic phenomena that prevent the achievement of true equilibrium redistribution of the SWCNTs at each ATPE step. In the workflow of Fig. 4B after the first separation one is essentially trying to remove a small fractional impurity (metallic SWCNTs) from a large volume, but non-achievement of equilibrium (and volumetric effects) tends to retain the contaminant metallics with the semiconducting SWCNTs. The workflow in Fig. 4C is thus favored because, after utilizing a temperature swing to transfer all SWCNTs back to the bottom phase (vide infra), both mass transfer factors and thermodynamic equilibrium will act to retain the metallic SWCNTs in the lower phase, resulting in a more rapid semiconducting purity enhancement.
Two notes on implementing either workflow. One, for the ATPE separation of semiconducting from metallic SWCNTs it is critical for the DOC concentration to be less than 0.02%. Otherwise a hybrid or diameter separation will occur. This is a reflection of the much stronger adsorption of DOC than SC onto the SWCNT-solution interface for most SWCNTs. Second, after addition of the oxidant and mixing of the vial it is heuristically valuable to wait 30 s to 1 min, remix, wait another 30 s and only then centrifuge. This leads to better fidelity of the partitioning of metallic SWCNTs to the bottom phase. A hypothesis for this observation is that the doping of the metallic SWCNTs is not instantaneous at the ATPE conditions described, but is sufficiently complete after the short wait. Waiting for brief additional amounts of time does not induce notable further changes to the separation.
Evaluation of semiconducting purity resulting from the ATPE separation can be done using the methods advanced by Finnie et al.15,33 based on a ratio of absorbance areas for wavelength ranges contributed primarily by semiconducting and metallic SWCNTs.34 Based on device work34 a ratio of 0.42 indicates at least 99.9% semiconducting purity. In the workflow of Fig. 4B16,30,32 very high purities are approached, but only after 6+ steps. Absorbance spectra for electric arc synthesis SWCNTs separated by the 2nd workflow are presented in Fig. 4D. The ratio calculated from the shown spectra is 0.426 for the semiconducting SWCNTs in the MTBMT phase. Essentially the semiconducting SWCNTs are all collected, at high purity, after three ATPE separation steps.
For metallic SWCNTs, the primary challenge to high purity populations is that oxidized semiconducting SWCNTs and most any remaining impurities partition to the bottom, DEX-rich, phase in the shown steps too. Problematically, simply immediately adding sufficient SDS to shift the desired metallic SWCNTs to the top will also shift some of the contaminants. Also, as discussed above, any factor preventing the ATPE separation from reaching equilibrium will have left some good semiconducting SWCNTs in with the metallic population. To address these factors an additional workflow is presented in Fig. 5A to achieve a high purity of metallic SWCNTs in the top phase.
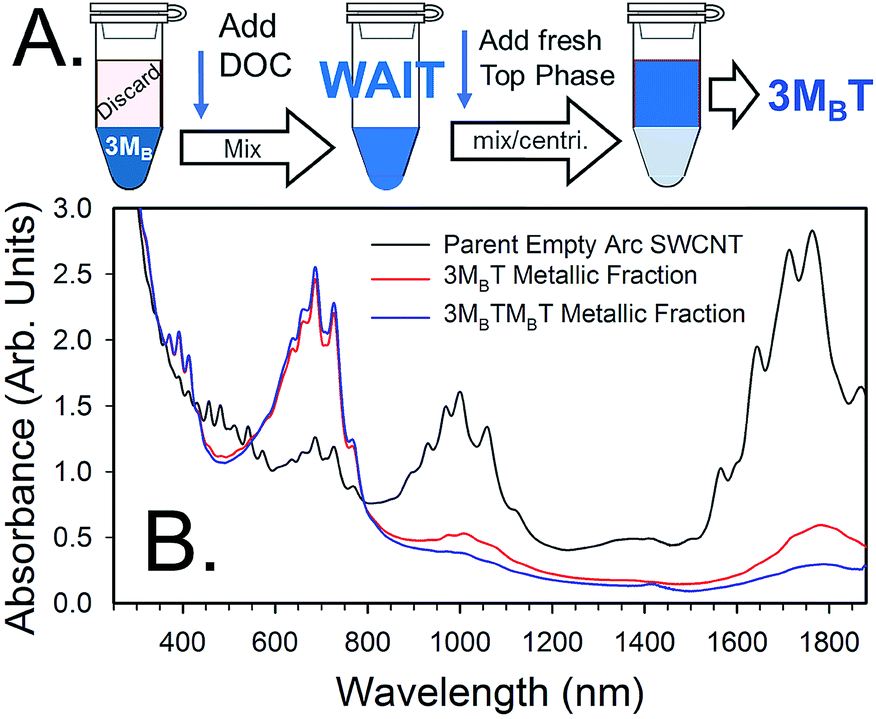 | ||
| Fig. 5 (A) Schematic of additional workflow of ATPE separations for producing high purity metallic SWCNT populations starting at the 3MB (i.e. MBMBMB) phase of Fig. 4. After separation of semiconducting SWCNTs to the top phase and their removal via pipetting, DOC is added to a concentration of 0.05% in the bottom phase and mixed. After a waiting period of 30 min to 1 h, fresh top phase mimic containing DOC and SDS at a concentration just sufficient to partition all (n,m) species to the top phase is added, mixed and ATPE performed. The last step may need to be repeated on the resultant bottom fraction to collect all of the desirable SWCNTs. (B) Scaled absorbance spectra of metallic-enriched empty arc SWCNTs separated in the manner of workflow in (A) compared to the parent dispersion. The workflow of (A) results in a purer metallic population than achieved without use of DOC; a repetition of the separation further increases metallic purity. Also shown is the effect of re-semiconducting–metallic sorting the DOC-transferred top fraction, followed by a repetition of the workflow. This results in an even greater metallic purity with little recovery loss of the metallic population. Spectra are scaled to an absorbance of A = 5 arb. units at the ≈240 nm peak for all samples. | ||
The key to this workflow in Fig. 5A is to counter the effects of the oxidizing agent (NaClO) on the ATPE separation with a two-pronged strategy. First, DOC is added to 0.05% in the solution, and second, waiting for 30 min to 1 h for the oxidant concentration to diminish. PEG is a weak reducing agent35 and will negate the oxidation potential of the NaClO over time; we also hypothesize that as the doping of the SWCNT surface decreases, the DOC forms a tighter surfactant layer on the SWCNT surface blocking re-oxidation. After the incubation period, a top phase with a lesser amount of SDS, but above that used for diameter selection (vide infra), will transfer the good metallic SWCNTs to the upper phase. To achieve extreme metallic enrichment in the final population a repetition of a single stage semiconducting/metallic separation followed by reapplication of the workflow in Fig. 5A may be necessary. Results of an example separation in the method of Fig. 5A are shown in Fig. 5B.
Lastly in this section, similar workflows to those shown above have also been shown to enable partitioning on the basis of the SWCNT bandgap in the SDS–SC ATPE system.35 Most usefully this can be applied for enriching true, armchair (n,m), metallic SWCNTs from the semi-metallic SWCNT species, but it can also be used to discriminate between species with similar partitioning behaviors in the SDS–DOC ATPE system. For either of these separations it is generally preferred to first transfer all the SWCNTs to the bottom phase by adding oxidant (NaClO). Then the oxidant concentration is slowly reduced via multiple remixes with the PEG phase. As discussed above, the PEG slowly reduces the oxidation potential in the solution, such that eventually larger bandgap, followed by smaller bandgap, SWCNTS partition to the upper phase. While starting from either the top phase and adding oxidant or starting from the bottom phase and remixing to reduce its strength, are possible, the slow decreases in oxidation allowed by remixing enables fine differentiation and extraction of the SWCNTs at each stage to the more easily physically removed PEG phase. Together these factors lead to a preference for the bottom phase start methodology. An example of this type of separation is reproduced from Gui et al.35 in Fig. 6.
 | ||
| Fig. 6 (Top) Schematic of band gap fractionation of a SWCNT sample by sequential ATPE separations at successively reduced oxidant concentrations. (Bottom) Photographs of separated fractions isolated from a small diameter SWCNT population. Adapted with permission from Gui et al., Nano Lett., 2015, 15, 1642–1646. Copyright 2015 American Chemical Society. | ||
Diameter and (n,m) separation
The second common implementation of ATPE is the competition of SDS and DOC to selectively partition SWCNTs on the basis of their structure. This selection is generally based on diameter, but with significant specific (n,m) scatter and exceptions to a strict diameter order. Described first in Fagan et al.,18 and expanded upon for larger diameter SWCNTs in Fagan et al.,19 the order of partition with SDS and DOC content has more recently also been found to be applicable to gel chromatography separations utilizing SDS and DOC implying a unified surface coverage competition mechanism common to both methods.13 Thermodynamic studies,36 and more detailed resolution of the surfactant competition driven extraction order37 are ongoing, but are complicated by spectral congestion and differences in behaviors due to enantiomeric effects.The mechanism driving the phase selection appears to be which surfactant primarily is adsorbed on the specific (n,m) SWCNT interface at any given set of SDS and DOC concentrations. For single surfactant coverage, SWCNTs coated with sufficient DOC partition to the DEX phase in our typical ATPE system, and SWCNTs coated with SDS partition to the PEG phase. A schematic of the mechanism hypothesis is shown in Fig. 7. In the figure, the SWCNTs primarily coated with DOC would have a difference in their chemical potential for insertion into the top versus bottom phase, μ0T,i − μ0B,i, greater than zero, which would lead to a partition coefficient < 1, and thus separation into the bottom phase. It is currently unclear how much comingled adsorption of both surfactants occurs, whether there are changes in fractional surface coverage that lead to direct contributions, rather than surfactant mediated contributions, from the nanotube sidewall, or what the slope of the changeover is from one surfactant to the other with increasing concentration of one component. A significant question is whether defects on the nanotubes broaden the range of this transition, and whether that factor has been accounted for in spectroscopic measurements of the exchange. These are current active areas of research by several groups, as well as a recommended direction for improving ATPE described in a later section.
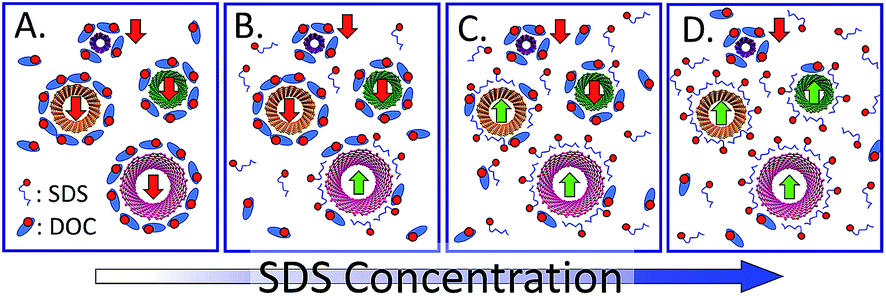 | ||
| Fig. 7 Simplified schematic of the hypothesized mechanism driving the selection of ATPE partition for each individual (n,m) species in the SDS–DOC competition ATPE system for a constant DOC concentration. (A) At low SDS concentration all SWCNT (n,m)s are covered primarily or entirely by DOC molecules, which would result in partition to the bottom phase (red arrows) in our PEG–DEX system. (B) and (C) At increasing SDS concentrations, SDS begins to comingle with, or outcompete, the DOC on the interface of some SWCNT (n,m)s; at sufficient SDS fraction these SWCNTs partition to the top phase (green arrows). The SDS concentration necessary for this for each (n,m) corresponds to the empirical critical point for that (n,m) shown in Fig. 2D. (D) At high SDS concentrations, (almost) all SWCNTs are coated with SDS, or a sufficient fraction of SDS to cause partitioning into the top phase. Note that the number of shown surfactant molecules in each box is not quantitative. However, from left to right the number of unbound DOC molecules remains constant while the number of SDS molecules increases dramatically to reflect equilibrium with the bulk volume beyond the schematic frame. It is possible that the amount and type(s) of polymer(s) affects the competition of the surfactants. | ||
The primary decision for diameter–structure multistage ATPE at each step of the processing is what concentration of SDS to apply. In Fig. 2C and D a schematic of the separation coefficient functionality for different (n,m) SWCNTs and the empirical conditions, ignoring enantiomer effects, at which each (n,m) reaches K(n,m),i = 1 were respectively shown. Using such information, one can choose an SDS concentration that will split some species into the top phase, and some species into the bottom phase, in an ATPE step. For the species denominated in the schematic of Fig. 2C, a good choice for a first ATPE step would be ≈0.72% SDS (at 20 °C, 0.05% DOC) corresponding approximately to the position of the vertical dashed line, which will partition such species as the (9,4), (6,6), and (7,5) into T, the top phase, and (7,6), (8,3) and (6,5) into B, the bottom phase. In the second stage of separation, bottom phase mimic containing 0.05% DOC, but no SDS, is added to T to reduce the total SDS concentration to ≈0.65%, resulting in (9,4) and (8,6) remaining in phase TT, and partitioning of the (6,6) and (7,5) to TB. Similarly, a high concentration SDS mimic top phase is added to B, to raise the overall SDS concentration to ≈0.8%, partitioning (upon mixing and phase separation) the (7,6) and other not shown species into the top phase BT, and leaving the (8,3), (6,5), etc. in the bottom phase BB. This process is then repeated with the goal to separate each (n,m) into an ATPE phase by itself, increasing the SDS concentration in a bottom phase, and decreasing it in a top phase to shift the SWCNT partitioning between each stage in the cascade. Alternatively, the DOC concentration can be increased (decreased) for the top (bottom) fraction while maintaining a constant SDS concentration, but in practice this is difficult to implement with fine enough control for generating subpopulations (as the concentration steps would be very small in terms of absolute DOC concentration). It is instead a technique best utilized only to shift all (n,m) species to the opposite phase.
An example of the results from a gradient process ATPE separation on an approximately 1.3 nm average diameter SWCNT population synthesized by the plasma torch (PT) method from Fagan et al.19 is shown in Fig. 8. Application of the gradient strategy is able to distinguish multiple single (n,m) species fractions despite the many SWCNT species present in the parent population. As discussed in greater detail below, the fractional quantity of each SWCNT species decreases in larger average diameter SWCNTs populations due to the greater number of (n,m)s over which the total mass is distributed. This factor, plus difficulties in judging the success of a partitioning step via visual inspection can make separating populations larger than ≈1.2 nm in average diameter challenging, but systematic fractionation will reveal population separation in spectroscopic measurements.
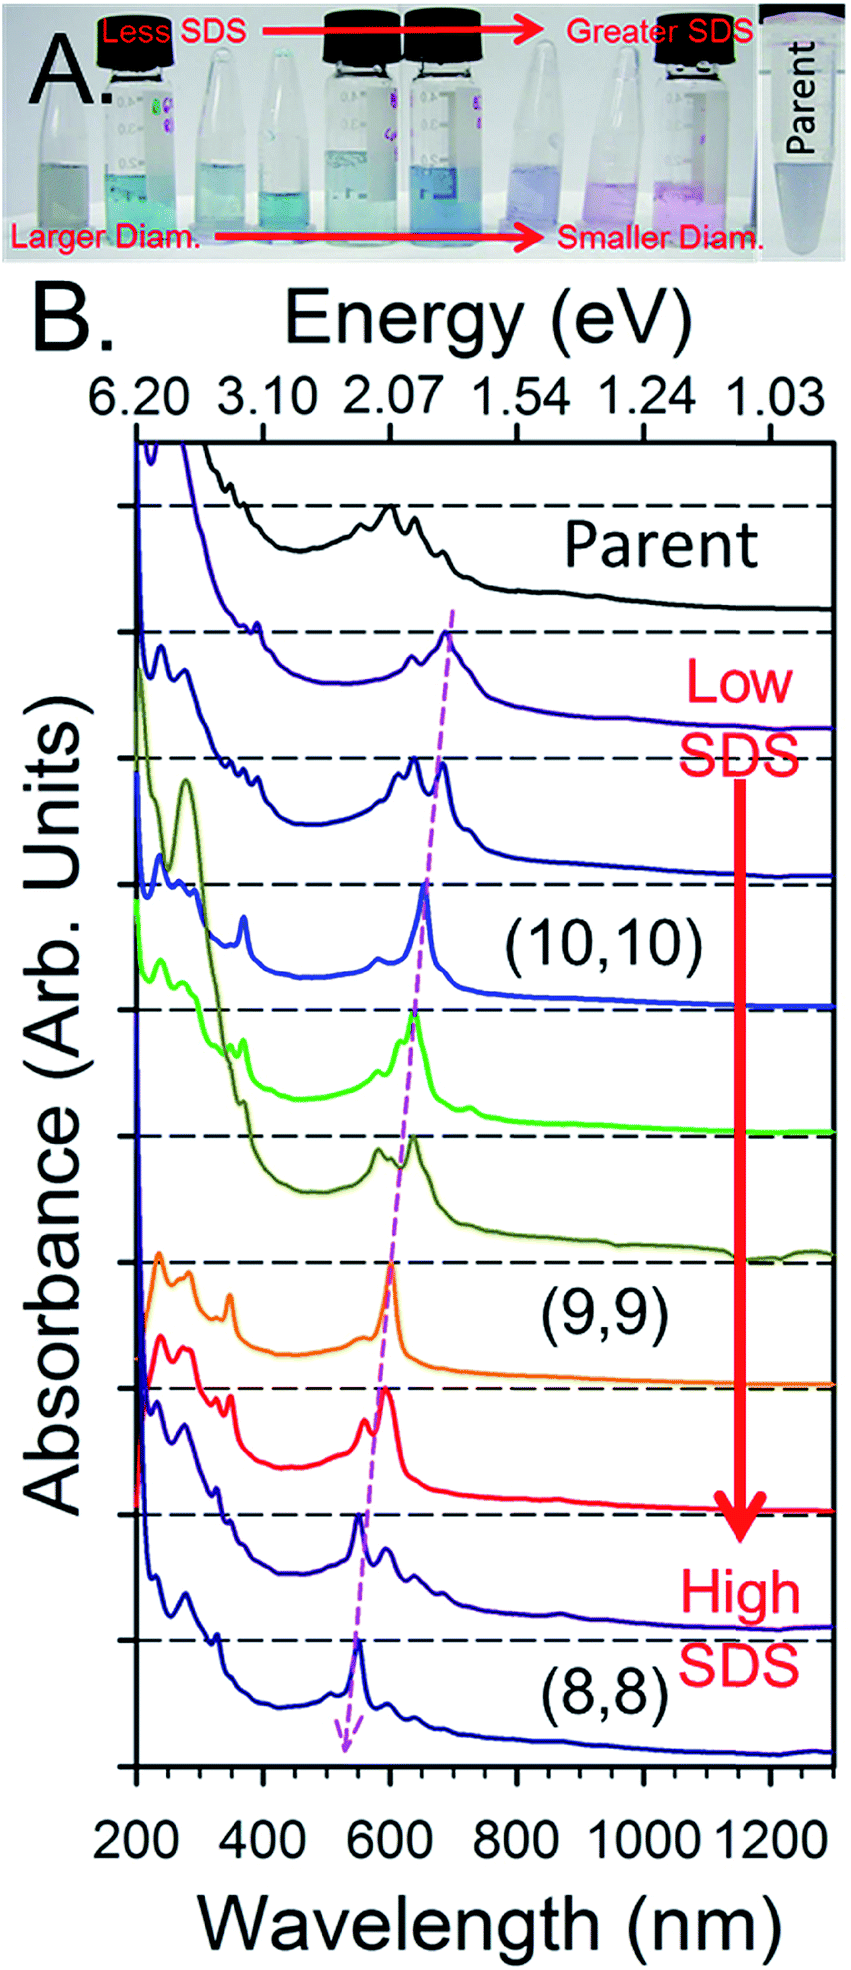 | ||
| Fig. 8 An example of fractions resulting from the gradient process ATPE separation of empty metallic PT SWCNTs adapted from Fagan et al.19 (A) Photographs of the SDS gradient ATPE separated diameter fractions in order from lowest SDS for extraction (left) to greatest SDS for extraction (right). (B) Absorbance spectra of the fractions SWCNT fractions in order of their appearance in the photograph in panel (A) (left most = penultimate top), the topmost spectrum is of the metallic parent dispersion shown in (A). The changes in the SWCNT species distribution from systematic ATPE separation are demonstrated by the changes in absorbance peak wavelengths, with specifically enriched armchair (n,m) species labelled. Adapted from Fagan et al.,19ACS Nano, 2015, 9, 5377–5390. | ||
As the multistage process is similar for all ATPE implementations, what differentiates this approach from other variants is that the implicit goal is to collect all (n,m) SWCNT species in different final fractions, rather than a focus on purifying one (n,m) component while disregarding the others. As stated above, both strategies have their place, with multistage (SDS gradient) separations taking more effort and time, but also reducing discarded material. The key benefits to this approach are flexibility in the process to compensate for differences in materials and goals of different laboratories including batch to batch variation in the chemicals used, local laboratory temperatures, the SWCNT source lot, and the desired (n,m) structure to be isolated.
Realistically time is not often available to purify and collect each species separately. In this case a hybrid approach is sometimes used. In this case only a few separation steps are performed in the typical gradient manner, resulting in four to six subpopulations. To all but one of these enough DOC is added to reach a 1% concentration, and only the final subpopulation is purified via a further multistage cascade for the target (n,m). If the properties of the starting SWCNT population are consistent with another experiment's, the other populations can be mixed with similar (n,m) distribution samples to increase the absolute SWCNT mass in such fractions before reintroduction to ATPE and additional separation. These concentrated subpopulations then enable isolation of (n,m)s present only in low concentration in the original parent dispersion.
The greatest level of discrimination amongst the SWCNT species is to the level of separating the two enantiomers, (n,m) and (m,n), of the chiral structures. For a number of species including (5,4), (6,5), (7,5), and (10,2), the differences in SDS concentration (for constant DOC concentration) needed to partition the two enantiomers are blatant, on the order of a 10–20% difference. For these species a multistage separation with a relatively small step SDS gradient will resolve two different SDS concentrations at which first one, then the other, enantiomer partitions, as monitored by the presence or absence of the very similar (n,m) and (m,n) optical transitions, from the bottom phase to the top phase. In contrast, for other species the differences are small enough to be unassignable to different enantiomers, or even discriminated at all. As with different (n,m) structures, whether two enantiomers are separated fully in a single ATPE stage will depend on how distinct are their separation conditions and the idealness of the achieved equilibrium. Whether separation of enantiomers is necessary may depend on the purpose for which the sample will be used. The tradeoff between the addition of complexity to the separation (that will be shared by other techniques reliant on the same mechanism) for more specific optical response will need to be evaluated on a case by case basis. Automated multistage gradient sorting is one route to generating better separated fractions, and the other is better identification of the surfactant conditions to perform optimal single stage, or repeated at a constant surfactant concentration, partitioning. Such conditions can be identified through measurements of relative binding affinities of surfactants,38 which is an area we highlight as a significant opportunity for improving ATPE in a later section.
Although many diverse modulating chemicals exist for changing the partition of SWCNTs in the ATPE system, the utility of acid addition is specifically notable because it can be accomplished through very small volume additions of concentrated acid, and because it is reasonably reversible through addition of base, with the minor effects of salt concentration increases the main limitation to full reversibility. Using reasonably optimized DOC and SDS concentrations, and adding specified volumes of 0.5 M HCl on the order of 0.1% of the total volume, the authors were able to demonstrate separation of 11 small diameter (n,m) species at purities consistent with Fagan et al.18 but in significantly fewer steps of ATPE. Reducing the number of steps is important as it results in simpler adoptability of the technique as well as less consumption of polymers and other chemicals. In addition, the authors report successful utilization of 3-surfactant mixtures of SDS, SC and DOC with the acid addition to optimize some separations, with their results implying that the acid addition more weekly affects the SC concentration than the DOC concentration. Whether this results from the larger concentrations of SC used, or the roughly four times greater solubility in water of cholic acid than deoxycholic acid41 is unclear, but raises the possibility of differential resolution of SC and DOC adsorbing SWCNT (n,m)s for enabling even finer resolution than purely SDS–DOC competition.
Considerations and perspectives on automation, scaled production and cost reduction
A significant benefit of the liquid–liquid nature of the ATPE separation method is its likely ability to be successfully scaled to increase mass throughput and to reduce costs. Due to the much higher SWCNT mass loadings at which ATPE can be conducted than gel chromatography or DGU, in our laboratories the initial dispersion and purification by sonication and centrifugation are the rate limiting step. Beyond this barrier, however, there are clear paths for improved scale processing and cost reduction.For semiconducting SWCNT production, the robust nature of the single step ATPE separation quality from the metallic nanotubes suggest the simple use of larger containers and centrifuges to reach multigram production scales using process flows similar to the batch model outlined above. At larger scales, counter current flow centrifugal contactors,43 small models of which process 60+ L h−1 flowrates, would allow continual processing (for estimation: 0.5 mg mL−1 × 60% yield × 60 L h−1 = 18 g h−1 semiconducting SWCNTs) for which application markets have not yet developed. Key technologies for cost reduction in either case would include cheap removal of the SWCNTS from the polymer and recovery for recycling of the polymer phases. In addition, reduction of DOC concentration during dispersion, perhaps by utilizing a SC/DOC mixture, while maintaining dispersion quality would greatly help.
For production of individual (n,m) SWCNT species samples, the greatest impediment is the low mass fraction of any given (n,m) in the original synthetic mixture. In small diameter cobalt–molybdenum catalyst (CoMoCat)44 or high-pressure CO disproportion (HiPco) synthesis type batches with average diameters < 1 nm to 1.1 nm the relatively small number of (n,m) combinations (≈20 and ≈40 respectively) makes the problem tractable, especially for high abundance species such as the (6,5). The combinatorial problem becomes very significant, however, for even mildly larger average diameter populations as there are more and more (n,m) combinations possible within a fixed range of diameter variation (for DWCNTs the situation is even more challenging).29 Fortunately, narrow groupings of (n,m) species are readily separable with only 2 to 3 separation steps, even for larger, >1.5 nm diameter SWCNTs, at bench scale by hand.19,45 These sub-populations should then succumb to sequential application of additional ATPE step if the partition coefficients vary by even 5% as in classical separations such as distillation. Unfortunately, these small steps, and difficulty in rapid assessment of progress, are tedious to perform in practice, leaving purification of large diameter species to heroic efforts. Improvements to SWCNT synthesis methods to generate reduced numbers of (n,m) structures in a soot would thus significantly ease isolation of the enhanced content species, and is an active area of research in the SWCNT community, but separations will still likely be required for many species for the foreseeable future.
Automation of diameter-separation ATPE using a surfactant gradient such as in a counter current chromatography instrument46,47 is one possible solution to this problem. An example of the chromatographic output for CoMoCat SWCNTs is reproduced from Zhang et al.46 in Fig. 9. In those initial experiments dramatic separation of small diameter SWCNTs was achieved with the equivalent of only a few equilibrium single stage fractionations. Minor improvements to both the machine and methodology should enable application of several hundred equivalent equilibrium steps of separation, which would imply baseline resolution of even minor (n,m) components. Acquisition and demonstration of an appropriate machine is of continuing interest.
 | ||
| Fig. 9 Absorbance spectra of sequential chromatographically-separated SWCNT populations using a CCC instrument. The emergence and disappearance of absorbance features is due to the differential partitioning of the different SWCNT species along an SDS % gradient starting from a low concentration at the bottom of the figure to high concentration near the top. Reprinted with permission from Zhang et al., Anal. Chem., 2014, 86, 3980–3984. Copyright 2014 American Chemical Society. | ||
For either scaled implementation, a simple cost accounting indicates that cost reductions through incorporation of bulk rather than research grade chemicals, and improvements to dispersion, including a reduction in the quantity of DOC used, hold the greatest potential for cost reduction when using an all surfactant strategy.
Complications ignored in the treatment of the two-phase system as described above
Thermodynamic equilibrium requires that the chemical potential of both phases be equal (if we assume equilibrium is reached), and broadly I have used the assumption above that the two-phase environments are defined primarily by the polymer chemical natures and MWs, with lesser roles played by polymer concentrations (shifting tie-lines) and temperature. I have also described the techniques under the assumption that the total SWCNT concentration, and of any specific (n,m), is too low to affect partitioning of the either the polymers or other components (including other SWCNTs) due to thermodynamic effects. This second is likely to be a good assumption from an equilibrium standpoint, as even 1 mg mL−1 SWCNTs is ≈0.1% mass concentration. However, such concentrations can be problematic due to mass transfer effects, in particular interfacial trapping, and reduced yields (if surfactant concentrations that induce or allow aggregation are encountered). The other assumption, namely that of little to no effect of each additive's concentration to the polymer phase equilibrium, is less viable for the addition of the surfactants and other modulators, such as salts, redox agents, and acids or bases. Heuristically, in most instances these additives do not appear to strongly affect the partitioning of the other additive components, i.e., the partition coefficient of each surfactant remains independent, but instead primarily affects factors such as the precise compositions of the polymers at the phase boundary as was shown in Fig. 1. However, measurements to support these assertions are limited, and greater understanding of the effects of additives on the partitioning of other non-SWCNT components could be useful. Some observations that do imply intercomponent interactions are that increases in the SDS content tend to shift the polymer phase coexistence curve towards greater mass fractions of both polymers, as in the shift of the surfactant free and with surfactant curves in the Fig. 1, and that DOC concentrations above ≈0.2% greatly increase the rate of two-phase separation. The latter implies an increase in the difference in chemical environment, as described by hydrophilicity–hydrophobicity, of the two-phases. Of course, SWCNTs are usually all in the dextran phase at such DOC % compositions.Another complication ignored above is the impact of SWCNT length on the separation. With regards to separability of SWCNTs of various lengths, it has been previously noted that the surfactant concentrations for which μ0T,i − μ0B,i = 0, and thus the partition coefficient is 1, are independent of the SWCNT length (neglecting end effects).6 SWCNT length, which might be expected to linearly amplify a per unit length chemical potential difference, may thus change the slope of the partition coefficient functionality, but will not affect the partition order of (n,m) species. The use of length separated populations for ATPE is thus beneficial, because a narrow length distribution will therefore yield a consistent and sharper slope to K(n,m) (SDS, DOC), but is not necessary.
Alternatively, as noted in Khripin et al.,16 each ATPE step could be used for, or lead to, length separation of a polydisperse SWCNT length population if μ0T,i and μ0B,i are proportional to the SWCNT surface area. In practice however, we rarely observe length distribution changes from our application of ATPE, or at least not to the potential for concern suggested by a linear scaling of the chemical potential difference. Evidence for this assertion comes from analytical ultracentrifugation results determining essentially unchanged length distributions of parent and ATPE sorted (n,m) enriched fractions.48 Several reasons for this empirical observation could be artifactual. Most likely our dispersion and pre-ATPE processing simply result in a length distribution narrow enough to not affect the partitioning mass balance within the resolution of surfactant concentration steps we specify during ATPE. Alternatively transport phenomenon might provide a counteracting bias to length selection from equilibrium thermodynamics. Another potential hypothesis is that the separation mechanism, especially for SDS–DOC sorting, results in a significant change of the chemical potential difference for each (n,m) SWCNT species at the critical concentration at which one surfactant replaces the other. This hypothesis would imply that all lengths of SWCNTs should be separable by ATPE at both similar surfactant concentrations and with sharp K(n,m) slopes. This is a testable hypothesis through the surfactant competition experiments suggested in the next section.
ATPE development opportunities
For all of the above discussion, ATPE of SWCNTs is still a developing field with significant opportunities for resolving both fundamental and applied research questions. Several of those questions, but by no means a full and complete list, are discussed below.In the case of SDS and DOC dispersions of SWCNTs, the wavelengths of each individual (n,m)'s optical transition are different due to solvatochromic effects. Because of this, the dominating adsorbate at any pair of SDS and DOC concentrations should be discernable directly from absorbance or fluorescence spectroscopy in the absence of the polymer. Such a strategy has been significantly used to investigate the replacement of DNA with various surfactants,49,50 but only in a more limited fashion for the competition of different surfactants. Essentially the surfactant concentration conditions at which the SWCNT optical properties shift from being reflective of coverage by one surfactant to the other would be identified as likely very similar to the partition coefficient = 1 point.
A primary reason for this is that in as-synthesized (n,m) population samples spectral observations are complicated by spectral congestion of many overlapping transitions from different (n,m)s and their enantiomers, as well as contributions from damaged or impure SWCNT populations. However, these complications will be dramatically reduced for single (or few) (n,m) separated fractions, and could be definitive, even in the absence of (n,m) from (m,n) resolution, of critical concentrations at which one surfactant is replaced by the other. Such measurements tracking the (different) peak positions for coverage by one surfactant versus the other via absorbance or fluorescence spectroscopy of few SWCNT populations have been reported against flavin mononucleotide (FMN) dispersants,38,51 but not systematically for small molecule surfactant pairs. Competition of DOC and SDS or other surfactant pair combinations on well sorted (n,m) populations should enable rapid screening of conditions that may lead to novel separation capabilities.
Such experiments may also realize answers to the questions raised above on the effects of defects on the partitioning, and the potential for direct nanotube sidewall contributions to the phase affinities. Another interesting experimental test beyond ATPE for the shifting surfactant coverages could be density gradient ultracentrifugation, as the change in surfactant layers will likely result in different buoyant densities of the dispersed SWCNT.52 Such results may thus enable fuller identification of separation conditions and predictability for separations such as those performed by Ghosh et al.8
Technical and practical considerations for surfactant-SWCNT ATPE at the bench scale
Over the last several years I have hosted many visitors on both short and long visits for demonstration and dissemination of the ATPE methods described above, as well as heard from many other research groups with questions when trying to implement the technology. Separation via ATPE of SWCNTs in expansion or replication of the work initiated at NIST has now been reported across multiple groups on several continents. To aid in even broader adoption of the technology there are many technical and practical considerations when implementing ATPE that also deserve discussion and that may aid in the development of better future separations. These considerations are presented below.In my preference, and by most metrics reported in the literature, ssDNA58 and DOC59,60 are the best available dispersants for mass yield of individualized SWCNTs via sonication in an aqueous environment. For DOC, Blanch et al.61 determined that peak SWCNT dispersion yields occurred for DOC concentrations between 1% and 2%. We have also found 45 min to 1 h of tip sonication at a nominal power of ≈0.9 W mL−1 to a cooled vessel to provide a reasonable optimization of conditions. Mass loading of SWCNTs is typically 1 mg mL−1, with yields, as monitored by fraction of absorbance retained, after 2 h of ≈38000G, G = 9.81 m s−2, in a rotor of k-factor62 = 769 (see Methods in the ESI†) on the order of 40–50% of the (non-SWCNT peak feature) absorbance for most SWCNT materials, although this can be up to ≈95% for some small diameter synthesis populations. As a reference, although the absolute concentration reachable in a SWCNT dispersion depends on the SWCNT length distribution, the maximum concentration while avoiding formation of separated SWCNT phases is ≈2 mg mL−1. Easily handled SWCNTs concentrations are typically below 1 mg mL−1. These parameters should not be viewed as prescriptive, but are offered as reference points that have yielded good results, and I note that even after almost 20 years, the evaluation of initial dispersion quality is an ongoing research topic.63,64 In fact, transferable optimization of dispersion, or research enabling equivalent dispersion yield and quality with less time or using a mixture of SC and DOC to reduce the absolute initial DOC content would be of great value for decreasing costs and improving mass throughput of ATPE separations.
A second factor that at least eases the use of ATPE for separations, and that may be a requirement for achieving high purity fractions with the largest diameter SWCNTs, is the use of alkane-filled SWCNTs65,66 or empty SWCNTs, i.e., SWCNTs with closed endcaps,67,68 rather than water-filled SWCNT populations. Such nanotubes have significantly narrower optical transitions than water-filled nanotubes, easing visual assessment of separations, and by virtue of only having one water-exposed surface, likely experience a less heterogeneous chemical environment in the aqueous dispersion. Note that the mass fractions of closed ended, i.e. potentially dispersed as empty, open-ended but pristine, and open ended and notably oxidized SWCNTs, which will have decreased optical feature size, in a SWCNT source depends on the details of both the synthesis method and any manufacturer applied purification. In our labs we also generally purify empty, water-filled and alkane-filled SWCNTs from remaining small bundles, slowly sedimenting impurities, and morphologically-defective SWCNTs via a rate-zonal centrifugation.69 This process does add a significant amount of effort, and results in loss of some valuable material, but also generally dramatically improves the SWCNT population purity and optical absorbance spectrum. Whether the fractional sample mass primarily eliminated in this step is mostly an intrinsic property of the SWCNT production method and soot morphology, or mainly due to non-optimal dispersion processing, is unknown, and an area of ongoing interest.
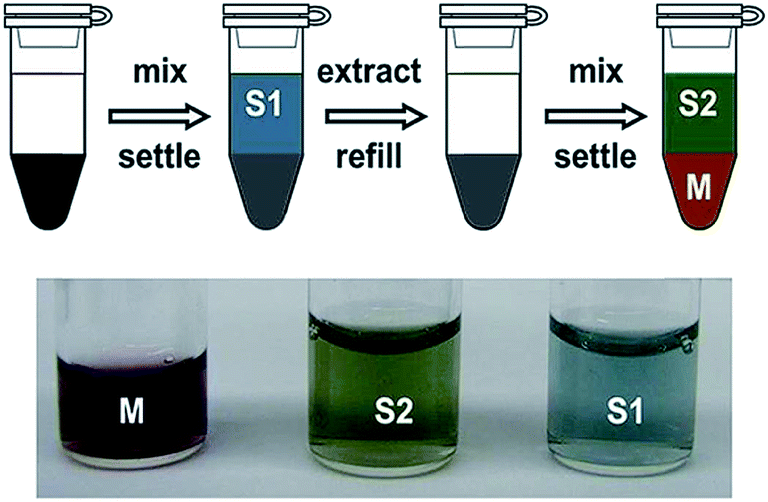
Both of the two effects are readily utilized to transfer dilute top phase fractions to the bottom phase through use of a chiller bath. In many cases, such as in the alternate semiconducting–metallic separation workflow given in Fig. 4B, it can be useful to transfer these fractions to a new bottom phase, but without significantly adjusting the surfactant concentrations. Frequently we finish top phase fractions by first chilling them to <10 °C with an addition of 5% to 10% bottom phase mimic to concentrate them in the bottom phase, and then rewarming to room temperature and adding ≈1/4 to 1/3rd volume of top phase mimic with a high SDS content. Overall the process thus results in an ≈40× concentration increase of the sample in the final PEG phase with minimal SWCNT mass loss. Concentration of dispersed particles by repartitioning is not a new development,22 but is elegantly accomplished through the temperature swing for SWCNTs. A schematic of this process is shown as Fig. 10.
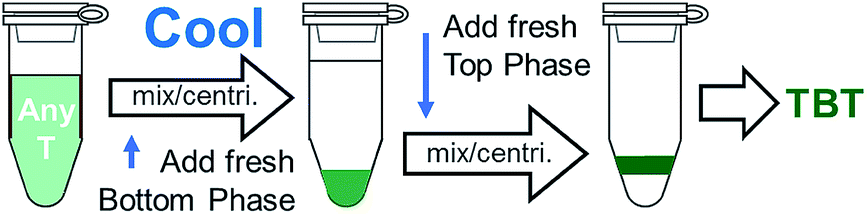 | ||
| Fig. 10 Schematic of the workflow to concentrate a dilute top phase fraction using a temperature swing. Cooling to <10 °C, and the addition of a small amount of bottom phase, results in partitioning of all SWCNTs to the bottom phase. Returning to room temperature, and adding a small volume of top phase, re-enables partitioning into the top phase. Large volumetric concentration can be achieved with minimal SWCNT mass loss via this method. | ||
Separately, minor chilling or heating can be used to shift the partition coefficient curves mildly to either transfer more of a desired species into a top phase, or to transfer an undesired species out. Because the partitioning is so sensitive, it is useful to monitor the lab temperature during the course of a multistage ATPE experiment. Normal temperature in our labs ranges from 19 °C to 22 °C depending on the room. Temperatures above 24 °C also are heuristically found to result in poor fidelity in separations, and an increased likelihood of aggregation and should be avoided. Heating may also result in the polymer:polymer phase coexistence boundary shifting such that the composition being utilized is in the single phase region, and thus no separation will occur.
Typically, nucleation will otherwise be encountered either when a separated top or bottom phase cools, as temperature reduction shifts the two-phase coexistence line such that the equilibrium content of the minor component is reduced (for PEG–DEX near room temperature), or when purposely chilling a top-phase fraction to concentrate a sample via repartitioning. In the first case addition of a small amount of water will prevent nucleation, and in the second case addition of sufficient primary bottom phase polymer to reach the spinodal window is advised (enough to raise the global mass concentration ≈ 1% is typically more than sufficient).
Another easily implemented methodology is the use of 1 mm pathlength cells for absorbance measurements. Except for extremely dilute samples, many absorbance spectrophotometers have very high precision near zero absorbance, and it can be particularly valuable to measure samples produced in ATPE in short pathlength cuvettes. In particular, in a 1 mm quartz cuvette, absorbance from water in the NIR between 700 nm and 1880 nm reaches a maximum value of only ≈1.4, well within the linear range of most instruments. This means that, with using a good reference spectrum, SWCNT absorbance features can be measured across this range without the need for D2O, and enabling spectroscopic access to optical transitions of (n,m)s that would otherwise be obscured by the absorbance of H2O. Additionally, the absolute contribution of scattering to the apparent absorbance is a function of pathlength, and so otherwise occluded short wavelength regions can also be accessible.
Conclusions
This capabilities of ATPE for SWCNT separations are powerful and multifaceted but can be confusing for the new practitioner. In this review I have sought to clarify differences between alternate separation strategies, elucidate reasons behind process decisions, and provide a foundation for better separations. In addition, the look forward identifies clear routes for both fundamental and applied research to improve the technique and to realize scaled utilization. I hope that these perspectives will advance the field and enable new applications from the ATPE method.Funding statement
This effort was funded through internal National Institute of Standard and Technology funding.Conflicts of interest
There are no conflicts of interest to declare.Acknowledgements
I thank M. Zheng for critical review and comments.References
- Carbon Nanotubes Synthesis, Structure, Properties, and Applications, ed. M. S. Dresselhaus, G. Dresselhaus and P. Avouris, Springer: Verlag, Berlin Heidelberg, Germany, 2001 Search PubMed.
- X. Wang, M. He and F. Ding, Chirality-Controlled Synthesis of Single-Walled Carbon Nanotubes—From Mechanistic Studies Toward Experimental Realization, Mater. Today, 2018, 21(8), 845–860 CrossRef CAS.
- B. Liu, F. Wu, H. Gui, M. Zheng and C. Zhou, Chirality-Controlled Synthesis and Applications of Single-Wall Carbon Nanotubes, ACS Nano, 2017, 11(1), 31–53 CrossRef CAS.
- A. S. R. Bati, L. Yu, M. Batmunkh and J. G. Shapter, Synthesis, Purification, Properties and Characterization of Sorted Single-Walled Carbon Nanotubes, Nanoscale, 2018, 10, 22087–22139 RSC.
- D. Janas, Towards Monochiral Carbon Nanotubes: A Review of Progress in the Sorting of Single-Walled Carbon Nanotubes, Mater. Chem. Front., 2018, 2, 36–63 RSC.
- M. Zheng, Sorting Carbon Nanotubes, Top. Curr. Chem., 2017, 375, 13–17 CrossRef.
- M. S. Arnold, A. A. Green, J. F. Hulvat, S. I. Stupp and M. C. Hersam, Sorting Carbon Nanotubes by Electronic Structure Using Density Differentiation, Nat. Nanotechnol., 2006, 1, 60–65 CrossRef CAS.
- S. Ghosh, S. M. Bachilo and R. B. Weisman, Advanced Sorting of Single-Walled Carbon Nanotubes by Nonlinear Density Gradient Ultracentrifugation, Nat. Nanotechnol., 2010, 5, 443–450 CrossRef CAS.
- K. Ihara, H. Endoh, T. Saito and F. Nihey, Separation of Metallic and Semiconducting Single-Wall Carbon Nanotube Solution by Vertical Electric Field, J. Phys. Chem. C, 2011, 115, 22827–22832 CrossRef CAS.
- X. Tu, A. Manohar, A. Jagota and M. Zheng, DNA Sequence Motifs for Structure Specific Recognition and Separation of Carbon Nanotubes, Nature, 2009, 460, 250–253 CrossRef CAS.
- H. P. Liu, D. Nishide, T. Tanaka and H. Kataura, Large-Scale Single-Chirality Separation of Single-Wall Carbon Nanotubes by Simple Gel Chromatography, Nat. Commun., 2011, 2, 309–317 CrossRef.
- H. Liu, T. Tanaka, Y. Urabe and H. Kataura, High-Efficiency Single-Chirality Separation of Carbon Nanotubes Using Temperature-Controlled Gel Chromatography, Nano Lett., 2013, 13, 1996–2003 CrossRef CAS.
- X. Zeng, D. Yang, H. Liu, N. Zhou, Y. Wang, W. Zhou, S. Xie and H. Kataura, Detecting and Tuning the Interactions between Surfactants and Carbon Nanotubes for Their High-Efficiency Structure Separation, Adv. Mater. Interfaces, 2018, 5(2), 1700727 CrossRef.
- A. Nish, J. Hwang, J. Doig and R. J. Nicholas, Highly Selective Dispersion of Single-Walled Carbon Nanotubes Using Aromatic Polymers, Nat. Nanotechnol., 2007, 2, 640–646 CrossRef CAS.
- J. Ouyang, J. Ding, J. Lefebvre, Z. Li, C. Guo, A. J. Kell and P. R. L. Malenfant, Sorting of Semiconducting Single-Walled Carbon Nanotubes in Polar Solvents with an Amphiphilic Conjugated Polymer Provides General Guidelines for Enrichment, ACS Nano, 2018, 12(2), 1910–1919 CrossRef CAS.
- C. Y. Khripin, J. A. Fagan and M. Zheng, Spontaneous Partition of Carbon Nanotubes in Polymer-Modified Aqueous Phases, J. Am. Chem. Soc., 2013, 135, 6822–6825 CrossRef CAS.
- N. K. Subbaiyan, A. N. G. Parra-Vasquez, S. Cambré, M. A. Santiago Cordoba, S. E. Yalcin, C. E. Hamilton, N. H. Mack, J. L. Blackburn, S. K. Doorn and J. G. Duque, Benchtop Aqueous Two-Phase Extraction of Isolated Individual Single-Walled Carbon Nanotubes, Nano Res., 2015, 8(5), 1755–1769 CrossRef CAS.
- J. A. Fagan, C. Y. Khripin, C. Silvera Batista, J. R. Simpson, E. H. Hároz, A. R. Hight Walker and M. Zheng, Isolation of Specific Small-Diameter Single-Wall Carbon Nanotube Species via Aqueous Two-Phase Extraction, Adv. Mater., 2014, 26, 2800–2804 CrossRef CAS.
- J. A. Fagan, E. H. Hároz, R. Ihly, H. Gui, J. L. Blackburn, J. R. Simpson, S. Lam, A. R. Hight Walker, S. K. Doorn and M. Zheng, Isolation of >1 nm Diameter Single-Wall Carbon Nanotube Species Using Aqueous Two-Phase Extraction, ACS Nano, 2015, 9, 5377–5390 CrossRef CAS.
- G. Ao, C. Y. Khripin and M. Zheng, DNA-Controlled Partition of Carbon Nanotubes in Polymer Aqueous Two-Phase Systems, J. Am. Chem. Soc., 2014, 136, 10383–10392 CrossRef CAS.
- G. Ao, J. K. Streit, J. A. Fagan and M. Zheng, Differentiating Left and Right-Handed Carbon Nanotubes by DNA, J. Am. Chem. Soc., 2017, 138, 16677–16685 CrossRef.
- P.-A. Albertsson, Partition of Cell Particles and Macromolecules, Wiley-Interscience, Hoboken, NJ, 2nd edn, 1971 Search PubMed.
- B. Y. Zaslavsky, Aqueous Two-Phase Partitioning, Marcel Dekker, New York, 1994 Search PubMed.
- N. L. Abbott, D. Blankschtein and T. A. Hatton, Protein Partitioning in 2-Phase Aqueous Polymer Systems. 1. Novel Physical Pictures and a Scaling-Thermodynamic Formulation, Macromolecules, 1991, 24, 4334–4348 CrossRef CAS.
- M. Iqbal, Y. Tao, S. Xie, Y. Zhu, D. Chen, X. Wang, L. Huang, D. Peng, A. Sattar and M. A. B. Shabbir, et al., Aqueous Two-Phase System (ATPS): An Overview and Advances in its Applications, Biol. Proced. Online, 2016, 18, 18 CrossRef.
- N. K. Subbaiyan, S. Cambré, A. N. G. Parra-Vasquez, E. H. Hároz, S. K. Doorn and J. G. Duque, Role of Surfactants and Salt in Aqueous Two-Phase Separation of Carbon Nanotubes toward Simple Chirality Isolation, ACS Nano, 2014, 8(2), 1619–1628 CrossRef CAS.
- E. Turek, T. Shiraki, T. Shiraishi, T. Shiga, S. Fujigaya and D. Janas, Single-Step Isolation of Carbon Nanotubes with Narrow-Band Light Emission Characteristics, Sci. Rep., 2019, 9, 535 CrossRef.
- L. Wei, B. Liu, X. Wang, H. Gui, Y. Yuan, S. Zhai, A. G. Ng, C. Zhou and Y. Chen, (9,8) Single-Walled Carbon Nanotube Enrichment via Aqueous Two-Phase Separation and Their Thin-Film Transistor Applications, Adv. Electron. Mater., 2015, 1(11), 1500151 CrossRef.
- J. K. Streit, S. Lam, Y. Piao, A. R. Hight Walker, J. A. Fagan and M. Zheng, Separation of Double-Wall Carbon Nanotubes by Electronic Type and Diameter, Nanoscale, 2017, 9, 2531–2540 RSC.
- V. A. Eremina, P. A. Obraztsov, P. V. Fedotov, A. I. Chernov and E. D. Obraztsova, Separation and Optical Identification of Semiconducting and Metallic Single-Walled Carbon Nanotubes, Phys. Status Solidi B, 2017, 254(5), 1600659 CrossRef.
- M. S. Y. Tang, E.-P. Ng, J. C. Juan, C. W. Ooi, T. C. Ling, K. L. Woon and P. L. Show, Metallic and Semiconducting Carbon Nanotubes Separation using an Aqueous Two-Phase Separation Technique: a Review, Nanotechnology, 2016, 27, 332002 CrossRef.
- L. Wei, B. S. Flavel, W. Li, R. Krupke and Y. Chen, Exploring the Upper Limit of Single-Walled Carbon Nanotube Purity by Multiple-Cycle Aqueous Two-Phase Separation, Nanoscale, 2017, 9, 11640–11646 RSC.
- P. Finnie, J. Ding, Z. Li and C. T. Kingston, Assessment of the Metallicity of Single-Wall Carbon Nanotube Ensembles at High Purities, J. Phys. Chem. C, 2014, 118, 30127–30138 CrossRef CAS.
- J. Ding, Z. Li, J. Lefebvre, F. Cheng, G. Dubey, S. Zou, P. Finnie, A. Hrdina, L. Scoles and G. P. Lopinski, et al., Enrichment of Large-Diameter Semiconducting SWCNTs by Polyfluorene Extraction for High Network Density Thin Film Transistors, Nanoscale, 2014, 6, 2328–2339 RSC.
- H. Gui, J. K. Streit, J. A. Fagan, A. R. H. Walker, C. Zhou and M. Zheng, Redox Sorting of Carbon Nanotubes, Nano Lett., 2015, 15, 1642–1646 CrossRef CAS.
- Y. Zhao, J. G. Clar, L. Li, J. Xu, T. Yuan, J.-C. J. Bonzongo and K. J. Ziegler, Selective Desorption of High-Purity (6,5) SWCNTs from Hydrogels through Surfactant Modulation, Chem. Commun., 2016, 52, 2928–2931 RSC.
- J. Defillet, M. Martinati, W. Wenseleers and S. Cambré, Systematic Aqueous Two-Phase Separations of Carbon Nanotubes to Investigate the Separation Mechanism, Abstract B03-0699, 233rd Electrochemical Society Meeting, Seattle, USA, May 2018 Search PubMed.
- M. Park, J. Park, J. Lee and S.-Y. Ju, Scaling of Binding Affinities and Cooperativities of Surfactants on Carbon Nanotubes, Carbon, 2018, 139, 427–436 CrossRef CAS.
- R. M. Jain, M. Ben-Naim, M. P. Landry and M. S. Strano, Competitive Binding in Mixed Surfactant Systems for Single-Walled Carbon Nanotube Separation, J. Phys. Chem. C, 2015, 119, 22737–22745 CrossRef CAS.
- H. Li, G. Gordeev, O. Garrity, S. Reich and B. S. Flavel, Separation of Small Diameter SWCNTs in 1 – 3 Steps with Aqueous Two-Phase Extraction, ACS Nano, 2019, 13(2), 2567–2578 CAS.
- Y. Moroi, M. Kitagawa and H. Itoh, Aqueous Solubility and Acidity Constants of Cholic, Deoxycholic, Chenodeoxycholic, and UrsodeoxychoIic Acids, J. Lipid Res., 1992, 33, 49–53 CAS.
- J. K. Streit, J. A. Fagan and M. Zheng, A Low Energy Route to DNA-Wrapped Carbon Nanotubes via Replacement of Bile Salt Surfactants, Anal. Chem., 2017, 89, 10496–10503 CrossRef CAS PubMed.
- R. H. Perry and D. W. Green, Chemical Engineers' Handbook, McGraw-Hill, 8th edn, 2007 Search PubMed.
- Certain equipment, instruments or materials are identified in this paper in order to adequately specify the experimental details. Such identification does not imply recommendation by the National Institute of Standards and Technology (NIST) nor does it imply the materials are necessarily the best available for the purpose..
- E. Turek, T. Wasiak, G. Stando and D. Janas, Probing the Mechanics of Aqueous Two-Phase Extraction using Large Diameter Single-Walled Carbon Nanotubes, Nanotechnology, 2018, 29, 405704 CrossRef.
- M. Zhang, C. Y. Khripin, J. A. Fagan, P. McPhie, Y. Ito and M. Zheng, Single-Step Total Fractionation of Single-Wall Carbon Nanotubes by Countercurrent Chromatography, Anal. Chem., 2014, 86, 3980–3984 CrossRef CAS.
- S. Stefansson, R. Lazo-Portugal, S. Ahn and M. Knight, Spiral Countercurrent Chromatography Enrichment, Characterization, and Assays of Carbon Nanotube Chiralities for Use in Biosensors, ACS Omega, 2017, 2(3), 1156–1162 CrossRef CAS PubMed.
- S. Lam, M. Zheng and J. A. Fagan, Characterizing the Effect of Salt and Surfactant Concentration on the Counterion Atmosphere around Surfactant Stabilized SWCNTs Using Analytical Ultracentrifugation, Langmuir, 2016, 32(16), 3926–3936 CrossRef CAS.
- A. Shankar, J. Mittal and A. Jagota, Binding between DNA and Carbon Nanotubes Strongly Depends upon Sequence and Chirality, Langmuir, 2014, 30(11), 3176–3183 CrossRef CAS.
- Y. Zheng, S. M. Bachilo and R. B. Weisman, Enantiomers of Single-Wall Carbon Nanotubes Show Distinct Coating Displacement Kinetics, J. Phys. Chem. Lett., 2018, 9(13), 3793–3797 CrossRef CAS.
- J. Sim, S. Kim, M. Jang, M. Park, H. Oh and S.-Y. Ju, Determination of the Absolute Enantiomeric Excess of the Carbon Nanotube Ensemble by Symmetry Breaking Using the Optical Titration Method, Langmuir, 2017, 33(41), 11000–11009 CrossRef CAS.
- J. A. Fagan, M. Zheng, V. Rastogi, J. R. Simpson, C. Y. Khripin, C. A. Silvera Batista and A. R. Hight Walker, Analyzing Surfactant Structures on Length and Chirality Resolved (6,5) Single-Wall Carbon Nanotubes by Analytical Ultracentrifugation, ACS Nano, 2013, 7, 3373–3387 CrossRef CAS.
- M. Lyu, B. Meany, J. Yang, Y. Li and M. Zheng, Towards Complete Resolution of DNA/Carbon Nanotube Hybrids by Aqueous Two-phase Systems, in preparation.
- T. P. Tyler, T. A. Shastry, B. J. Leever and M. C. Hersam, Narrow Diameter Distributions of Metallic Arc Discharge Single Walled Carbon Nanotubes via Dual-Iteration Density Gradient Ultra-centrifugation, Adv. Mater., 2012, 24, 4765–4768 CrossRef CAS.
- M. Zheng, Structure-Defined DNA-Carbon Nanotube Hybrids and Their Applications, ECS Trans., 2018, 85(13), 511–517 CrossRef CAS.
- D. P. Salem, M. P. Landry, G. Bisker, J. Ahn, S. Kruss and M. S. Strano, Chirality Dependent Corona Phase Molecular Recognition of DNA-Wrapped Carbon Nanotubes, Carbon, 2016, 97, 147–153 CrossRef CAS.
- V. Schroeder, S. Savagatrup, M. He, S. Lin and T. M. Swager, Carbon Nanotube Chemical Sensors, Chem. Rev., 2019, 119(1), 599–663 CrossRef CAS PubMed.
- M. Zheng, A. Jagota, E. D. Semke, B. A. Diner, R. S. McLean, S. R. Lustig, R. E. Richardson and N. G. Tassi, DNA-Assisted Dispersion and Separation of Carbon Nanotubes, Nat. Mater., 2003, 2, 338–342 CrossRef CAS.
- R. Haggenmueller, S. S. Rahatekar, J. A. Fagan, J. Chun, M. L. Becker, R. R. Naik, T. Krauss, L. Carlson, J. F. Kadla and P. C. Trulove, et al., Comparison of the Quality of Aqueous Dispersions of Single Wall Carbon Nanotubes using Surfactants and Biomolecules, Langmuir, 2008, 24(9), 5070–5078 CrossRef CAS.
- W. Wenseleers, I. I. Vlasov, E. Goovaerts, E. Obraztsova, A. S. Lobach and A. Bouwen, Efficient Isolation and Solubilization of Pristine Single-Walled Nanotubes in Bile Salt Micelles, Adv. Funct. Mater., 2004, 14, 1105–1112 CrossRef CAS.
- A. J. Blanch, C. E. Lenehan and J. S. Quinton, Optimizing Surfactant Concentrations for Dispersion of Single-Walled Carbon Nanotubes in Aqueous Solution, J. Phys. Chem. B, 2010, 114(30), 9805–9811 CrossRef CAS.
- The k-factor is a value published for all/most rotors that combines geometric effects and the maximum applied acceleration of a rotor such that time and rotor speed to perform an equivalent separation in a different rotor can be easily determined..
- Y. Zheng, S. R. Sanchez, S. M. Bachilo and R. B. Weisman, Indexing the Quality of Single-Wall Carbon Nanotube Dispersions Using Absorption Spectra, J. Phys. Chem. C, 2018, 122(8), 4681–4690 CrossRef CAS.
- S. G. King, E. Castaldelli, L. McCaffterty, S. R. P. Silva and V. Stolojan, Micro-Centrifugal Technique for Improved Assessment and Optimization of Nanomaterial Dispersions: The Case for Carbon Nanotubes, ACS Appl. Nano Mater., 2018, 1(11), 6217–6225 CrossRef CAS.
- J. Campo, Y. Piao, S. Lam, C. M. Stafford, J. K. Streit, J. R. Simpson, A. R. Hight Walker and J. A. Fagan, Enhancing Single-Wall Carbon Nanotube Properties through Controlled Endohedral Filling, Nanoscale Horiz., 2016, 1, 317–324 RSC.
- J. K. Streit, C. R. Snyder, J. Campo, M. Zheng, J. R. Simpson, A. R. Hight Walker and J. A. Fagan, Alkane Encapsulation Induces Strain in Small Diameter Single Wall Carbon Nanotubes, J. Phys. Chem. C, 2018, 122(21), 11577–11585 CrossRef CAS.
- S. Cambré and W. Wenseleers, Separation and Diameter Sorting of Empty (End-Capped) and Water-Filled (Open) Carbon Nanotubes by Density Gradient Ultracentrifugation, Angew. Chem., Int. Ed., 2011, 50, 2764–2768 CrossRef.
- S. Cambré, S. M. Santos, W. Wenseleers, A. R. T. Nugraha, R. Saito, L. Cognet and B. Lounis, Luminescence Properties of Individual Empty and Water-Filled Single-Walled Carbon Nanotubes, ACS Nano, 2012, 6, 2649–2655 CrossRef.
- J. A. Fagan, J. Y. Huh, J. R. Simpson, J. L. Blackburn, J. M. Holt, B. A. Larsen and A. R. H. Walker, Separation of Empty and Water-Filled Single-Wall Carbon Nanotubes, ACS Nano, 2011, 5, 3943–3953 CrossRef CAS.
- H. Gui, H. Chen, C. Y. Khripin, B. Liu, J. A. Fagan, C. Zhou and M. Zheng, A facile and Low-Cost Length Sorting of Single-Wall Carbon Nanotubes by Precipitation and Applications for Thin-Film Transistors, Nanoscale, 2016, 8, 3467–3473 RSC.
- Y. Piao, J. R. Simpson, J. K. Streit, G. Ao, M. Zheng, J. A. Fagan and A. R. Hight Walker, Intensity Ratio of Resonant Raman Modes for (N, M) Enriched Semiconducting Carbon Nanotubes, ACS Nano, 2016, 10, 5252–5259 CrossRef CAS.
- M. Pfohl, D. D. Tune, A. Graf, J. Zaumseil, R. Krupke and B. S. Flavel, Fitting Single Walled Carbon Nanotube Optical Spectra, ACS Omega, 2017, 2(3), 1163–1171 CrossRef CAS PubMed.
- J. K. Streit, S. M. Bachilo, S. Ghosh, C.-W. Lin and R. B. Weisman, Directly Measured Optical Absorption Cross Sections for Structure-Selected Single-Walled Carbon Nanotubes, Nano Lett., 2014, 14(3), 1530–1536 CrossRef CAS PubMed.
- S. R. Sanchez, S. M. Bachilo, Y. Kadria-Vili, C.-W. Lin and R. B. Weisman, (n, m)-Specific Absorption Cross Sections of Single-Walled Carbon Nanotubes Measured by Variance Spectroscopy, Nano Lett., 2016, 16(11), 6903–6909 CrossRef CAS.
Footnote |
| † Electronic supplementary information (ESI) available: Methods information, suggested workflows for different diameter ranges of SWCNT soots, and additional detail information for surfactant ATPE as applied at NIST. See DOI: 10.1039/c9na00280d |
| This journal is © The Royal Society of Chemistry 2019 |