
 Open Access Article
 This Open Access Article is licensed under a Creative Commons Attribution-Non Commercial 3.0 Unported Licence
Dispersing gold nanoparticles on thiolated polyaniline-multiwalled carbon nanotubes for development of an indole-3-acetic acid amperometric immunosensor
Zhaohong
Su
 *a,
Yongbing
Cheng
a,
Chaorong
Li
a,
Yuanfu
Xiong
a,
Langtao
Xiao
b,
Shu
Chen
c and
Xiaoli
Qin
*a
*a,
Yongbing
Cheng
a,
Chaorong
Li
a,
Yuanfu
Xiong
a,
Langtao
Xiao
b,
Shu
Chen
c and
Xiaoli
Qin
*a
aCollege of Science, Hunan Agricultural University, Changsha 410128, PR China. E-mail: zhaohongsu@hunau.edu.cn; qinxl@hunau.edu.cn
bHunan Provincial Key Laboratory of Phytohormones and Growth Development, College of Bioscience and Biotechnology, Hunan Agricultural University, Changsha 410128, PR China
cKey Laboratory of Theoretical Organic Chemistry and Function Molecule of Ministry of Education, School of Chemistry and Chemical Engineering, Hunan University of Science and Technology, Xiangtan 411201, PR China
First published on 24th July 2019
Abstract
An amperometric immunosensor based on new thiolated bionanocomposite with a high dispersion of gold nanoparticles (AuNPs) for the sensitive detection of indole-3-acetic acid (IAA) is being reported herein. Briefly, a thiolated nanocomposite was prepared via the microwave-assisted thiol–ene reaction of 2,5-dimercapto-1,3,4-thiadiazole (DMcT) with oxidized polyaniline (PANI), which was synthesized in the presence of multiwalled carbon nanotubes (MWCNTs), yielding thiolated polyaniline (TPANI)-MWCNTs. Further, AuNPs were deposited on the TPANI-MWCNTs by microwave-assisted method to obtain a AuNPs/TPANI-MWCNTs nanocomposite. Finally, the thiolated bionanocomposite film was constructed via the specific chemical reaction between boronic acid functionalized AuNPs and the vicinal diol functionalized AuNP labeled immunoglobulin G (IgG–AuNPs). The change in the reduction peak current of Fe(CN)63− was used to monitor the immunoreaction between IAA and antibody. The TPANI-MWCNT nanocomposites uniformly disperse AuNPs, IgG–AuNPs and anti-IAA-AuNPs, leading to the amplification of the signal of the immunosensor. Fourier transform infrared spectra (FTIR), cyclic voltammetry (CV), transmission electron microscopy (TEM), ultraviolet visible spectroscopy (UV-vis) and differential pulse voltammetry (DPV) were used to characterize the nanocomposite film and the stepwise modification of the immunosensor. The prepared thiolated bionanocomposite material has good biocompatibility, a highly uniform dispersion of the AuNPs with a narrow size distribution as verified by TEM, and high load/activity of the immobilized antibody proved via DPV. The fabricated IAA amperometric immunosensor not only exhibits a good linear arrange from 1.0 pg mL−1 to 10 ng mL−1 with the limit of detection of 0.97 pg mL−1 (S/N = 3), but also possesses good selectivity, reproducibility and stability for the detection of IAA.
1. Introduction
Indole-3-acetic acid (IAA), a kind of universal phytohormone synthesized by plants, plays an important role in plant growth regulation and development.1,2 Therefore, it is urgent to develop analytical methods capable of providing quantitative or qualitative analysis of IAA for understanding the physiological processes in plants. However, the low concentration of IAA in plant body is not only easily interfered by external conditions such as heat, light and oxygen, but also by internal interfering substances like amino acid, saccharides and pigments, which cause a tremendous barrier in its detection. To overcome the detectability problems, large amounts of the novel technologies and methods including capillary electrophoresis (CE),3 chemiluminescence,4 high performance liquid chromatography (HPLC),5 gas chromatography-mass spectrometry (GC-MS),6 surface plasmon resonance (SPR)7 and molecularly imprinted piezoelectric sensing8 have already been applied to detect IAA. Although these modern methods of analysis have been effective in IAA analyses, their application is limited by the requirement of the prophase sample processing and expensive experimental instruments. Therefore, it is necessary to develop a simple and rapid approach for the sensitive detection of IAA in small plant samples.Recently, electrochemical methods have aroused considerable concern for the IAA assay due to the advantages of low cost, rapid response, high sensitivity and simple manipulation. Li et al. developed a sensitive electrochemical molecularly imprinted sensor based on catalytic amplification by silver nanoparticles for IAA determination by ASV9 and the detection limit was 0.2 nmol L−1. The marriage of this electrochemical analysis with immunoassays promises to extend the detection limits and enhance our understanding of IAA's roles in plant growth and development. For example, Yin et al. developed a label-free electrochemical immunosensor for the ultrasensitive detection of IAA based on 4-aminophenylboronic acid, magnetic nanoparticles functionalized with horseradish peroxidase-conjugated goat anti-rat immunoglobulin G (HRP-IgG-Fe3O4) and rat monoclonal antibody against IAA-modified gold nanoparticles (anti-IAA-AuNPs)10 with a detection limit of 18 pg mL−1. Currently, owing to their unique properties, functional nanomaterials with strong absorption capacity, good biocompatibility, as well as structural compatibility are able to enrich immune biological molecules and are thus considered to be the best candidates for signal labeling to improve sensitivity.
Thiol–ene chemistry includes free radical or ion mechanism and uses the S–H bond and double bond or triple bond for crosslinking reactions. Since it has good stereoselectivity, mild reaction conditions and less side effects and advantages of less pollution to the environment, it has become a popular method for the synthesis of functional nanomaterials.11 More interestingly, polyaniline as an electro-conducting polymer (CP) with good conductivity and excellent stability can be easily thiolated through nucleophilic substitution reactions of thiols with the CPs at their oxidation state.12 The thiolated CPs after thiol–ene reaction contain abundant S and N groups and can anchor Au precursors to gain the uniform and better dispersion of AuNPs. These thiolated nanocomposites have a potential application in electrochemical biosensors. However, as far as we know, such attempts have not been reported to date.
Herein, in order to improve the sensitivity and detection limit of electrochemical sensors for IAA, a label-free immunosensor was developed on the basis of novel thiolated bionanocomposites. The signal was amplified by high dispersion of AuNPs deposited on thiolated polyaniline (TPANI)-multiwalled carbon nanotube (MWCNT) nanocomposites, goat anti-rat immunoglobulin G-functionalized gold nanoparticles (IgG–AuNPs) and rat monoclonal antibody against IAA-modified AuNPs (anti-IAA-AuNPs). A schematic representation of the fabrication of the immunosensor is shown in Scheme 1. The change in the reduction peak current of Fe(CN)63− was used to monitor the immunoreaction between IAA and the antibody. Furthermore, the practical applicability of the developed immunosensor was evaluated by the detection of IAA extracted from different plant seeds.
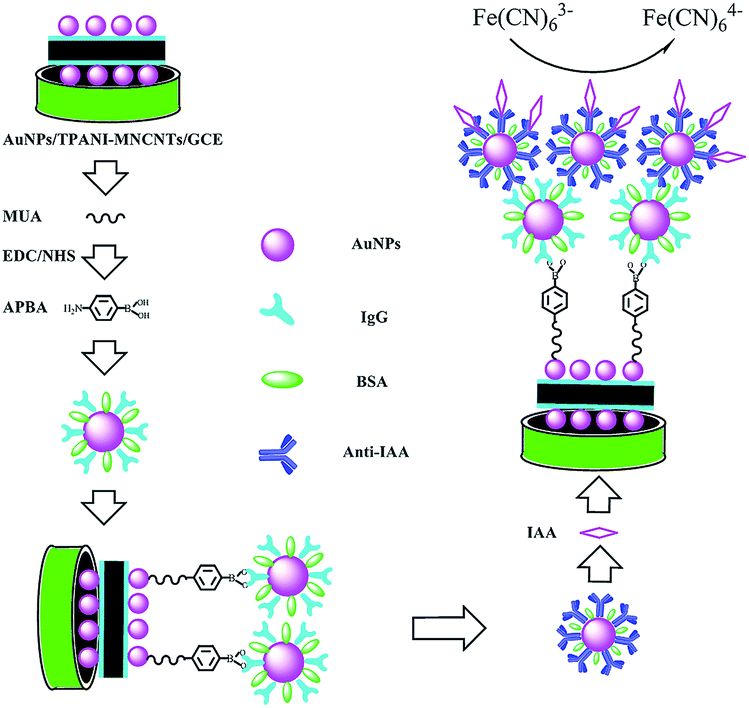 | ||
| Scheme 1 Schematic illustration of the fabrication and detection process of IAA amperometric immunosensor. | ||
2. Materials and methods
2.1. Materials
IAA, salicylic acid (SA), abscisic acid (ABA), gibberellic acid (GA), potassium ferricyanide (K3[Fe(CN)6]), chloroauric acid (HAuCl4) and trisodium citrate were purchased from Aladdin (Shanghai, China). 1-Ethyl-3-(3-dimethylaminopropyl) carbodiimide hydrochloride (EDC), N-hydroxysuccinimide (NHS), 4-aminophenylboronic acid (APBA), rat monoclonal antibody against IAA (anti-IAA) and 11-mercaptoundecanoic acid (MUA) were provided by Sigma (U.S). 2,5-Dimercapto-1,3,4-thiadiazole (DMcT) was the product of Alfa Aesar (U.S). Goat anti-rat immunoglobulin G (IgG) was purchased from Sangon Co., Ltd. (Shanghai, China). MWCNTs of ca. 20–40 nm average diameter were purchased from Shenzhen Nanotech Port Co., Ltd. (Shenzhen, China). Aniline, ammonium persulfate (APS) and ethylene glycol were purchased from Sinopharm Chemical Reagent Co., Ltd (Shanghai, China). Phosphate buffer solution (PBS) was prepared by mixing the stock solutions of 0.1 M NaH2PO4 and 0.1 M Na2HPO4, and the pH was adjusted using NaOH or HCl. Double-distilled deionized water was used throughout the experiments.AuNPs,13 IgG–AuNPs,13 and anti-IAA-AuNPs10 were synthesized according to the previous reports.
2.2. Apparatus
All electrochemical experiments were conducted on a CHI660E electrochemical workstation (Shanghai Chenhua Instruments, Co., China) with a conventional three-electrode system. A glassy carbon disk electrode (GCE) with 3 mm diameter was used as the working electrode, a KCl-saturated calomel electrode (SCE) as the reference electrode and a platinum plate as the counter electrode. All potentials in this work are cited versus SCE. The GCE was carefully polished and cleaned according to the previously reported method.13 TEM (JEM-3010, Jeol, Japan) was applied to characterize the morphology of composites. FTIR and UV-vis spectra were obtained from a Nicolet Nexus 670 FTIR spectrophotometer and UV-2450 spectrophotometer, respectively. High performance liquid chromatography (HPLC) analysis was performed on an Agilent 1100 instrument.2.3. Preparation of AuNPs/TPANI-MWCNTs/GCE
25 mg MWCNTs, 12 μL aniline and 28.5 mg APS were added into 25 mL aqueous solution containing 1 M HCl and was subjected to mild sonication for 30 min. The above solutions were immediately transferred to a microwave reactor (600 W) and subjected to continuous reaction for 5 min, and then the mixed solution was centrifuged thrice with anhydrous ethanol and double distilled deionized water, respectively, to obtain the PANI-MWCNT sediments. Following that, PANI-MWCNTs were dispersed in a mixed solution containing 10 mL 0.2 M H2SO4 and 10 mL anhydrous ethanol (volume ratio 1![[thin space (1/6-em)]](https://www.rsc.org/images/entities/char_2009.gif) :1) and sonicated for 30 min. Subsequently, 0.05 mg mL−1 DMcT (anhydrous ethanol as solvent) was added to the above solution and transferred to the microwave reactor (600 W) to continuously react for 5 min. Further, the TPANI-MWCNT suspension was centrifuged three times with anhydrous ethanol and double distilled deionized water, respectively. Following that, TPANI/MWCNTs was added into 25 mL ethylene glycol and 300 μL 97.1 mM HAuCl4 and sonicated for 30 min. The solution was adjusted to pH = 8–9 using 0.1 M NaOH. Afterwards, it was transferred to the microwave reactor (600 W) to continuously react for 10 min. The mixed solutions were centrifuged at 11000 rpm for 5 min with acetone, anhydrous ethanol and double distilled deionized water to obtain AuNPs/TPANI-MWCNT composite. Finally, 5 μL 1 mg mL−1 AuNPs/TPANI-MWCNTs were dripped onto the treated GCE to form a dry film through an infrared lamp, which was termed as AuNPs/TPANI-MWCNTs/GCE.
:1) and sonicated for 30 min. Subsequently, 0.05 mg mL−1 DMcT (anhydrous ethanol as solvent) was added to the above solution and transferred to the microwave reactor (600 W) to continuously react for 5 min. Further, the TPANI-MWCNT suspension was centrifuged three times with anhydrous ethanol and double distilled deionized water, respectively. Following that, TPANI/MWCNTs was added into 25 mL ethylene glycol and 300 μL 97.1 mM HAuCl4 and sonicated for 30 min. The solution was adjusted to pH = 8–9 using 0.1 M NaOH. Afterwards, it was transferred to the microwave reactor (600 W) to continuously react for 10 min. The mixed solutions were centrifuged at 11000 rpm for 5 min with acetone, anhydrous ethanol and double distilled deionized water to obtain AuNPs/TPANI-MWCNT composite. Finally, 5 μL 1 mg mL−1 AuNPs/TPANI-MWCNTs were dripped onto the treated GCE to form a dry film through an infrared lamp, which was termed as AuNPs/TPANI-MWCNTs/GCE.
2.4. Preparation of an amperometric immunosensor
The preparation of an amperometric immunosensor is depicted in Scheme 1. Briefly, the obtained electrode (AuNPs/TPANI-MWCNTs/GCE) was rinsed with double-distilled deionized water and dried with nitrogen blowing. Subsequently, the obtained electrode was incubated with 10 μL MUA (2.5 mM) for 1 h to allow MUA to assemble on the electrode surface by Au–S bonding. The modified electrode was then rinsed with double-distilled deionized water to remove the unreacted MUA. After drying under a nitrogen stream, a mixed solution of NHS (50 mM) and EDC (200 mM) was dropped on the surface of the electrode for 1 h to activate the terminal carboxyl group of the immobilized MUA. Further, 10 μL of APBA (2.5 mM) was dropped on the electrode surface and incubated for 1 h. A fixed APBA monolayer was obtained by the interaction between the amino and activated carboxyl groups (APBA/TPANI-MWCNTs/GCE). The remaining activated carboxyl groups were blocked by immersing in 0.1 M ethanolamine solution for 30 min. The IgG–AuNPs (volume ratio of AuNPs and IgG (1 mg mL−1) is 4:1, Fig. 1A) was then assembled on the electrode by incubating the modified electrode with 10 μL of the IgG–AuNP dispersion solution for 2.5 h (Fig. 1B) at room temperature under humid conditions. The modified electrode was then immersed in 1% BSA for 30 min to eliminate the nonspecific binding effect and block the remaining active groups. Further, 10 μL of anti-IAA-AuNP (1 mg mL−1 anti-IAA) complex was dropped onto the electrode surface and incubated for 1 h (Fig. 1C). Finally, 10 μL of 1 ng mL−1 IAA was dropped onto the surface of the modified electrodes and incubated for 1 h (Fig. 1D).
 | ||
| Fig. 1 Effect of volume ratio of AuNPs and IgG (A), incubation time for IgG–AuNPs (B), anti-IAA-AuNPs (C) and IAA (D) on the change in the reduction peak current of Fe(CN)63−/4−. | ||
For IAA detection, 10 μL of different concentrations of IAA solution or IAA from plant seeds were dropped onto the surface of the modified electrodes and incubated for 1 h. The immunosensor was then rinsed with 10 mM PBS (pH 7.4) to remove the unreacted IAA. Subsequently, the immunosensors were used for the electrochemical assay.
2.5. Electrochemical measurements and IAA immunodetection
All electrochemical measurements were performed in 0.1 M PBS (pH 7.4) solution containing 5 mM Fe(CN)63− at room temperature. The change in the reduction peak current of Fe(CN)63− obtained by differential pulse voltammetry (DPV) was used to characterize the immunosensor. The DPV from 0.7 V to 0 V with 4 mV potential step, 50 mV amplitude, 0.05 s pulse width, 0.2 s pulse period and 2 s quiet time was conducted.2.6. Preparation of plant material samples
A grinding rod was used to grind the seeds (corn, wheat, soybeans) into a coarse powder. Then, the obtained powder (5 g) was added to 80% methanol solution (20 mL). The powder was extracted by keeping the above solution in a refrigerator at 4 °C for 12 h after mixing homogeneously. The mixture was then centrifuged at 5000 rpm and the supernatant was passed through a Sep-Pak C18 column (Sigma, USA) that was pre-washed with ethanol, double-distilled deionized water and 80% methanol solution.10 The effluent was collected and the solvent was dried with nitrogen at room temperature. The powder was redissolved in 10 mL of 10 mM NaOH solution and diluted with 990 mL of 10 mM PBS (pH 7.4).3. Results and discussion
3.1. Characterization of the nanocomposites
Several techniques were employed to characterize the preparation of the thiolated nanocomposites. Firstly, the FTIR spectra of DMcT, PANI-MWCNTs and AuNPs/TPANI-MWCNTs were detected (Fig. 2). For DMcT, the main peaks at 1048, 1445 and 2478 cm−1 correspond to the N–N, C![[double bond, length as m-dash]](https://www.rsc.org/images/entities/char_e001.gif) N and S–H stretching vibrations, respectively. 646 and 710 cm−1 bands stem from C–S–C symmetric and asymmetric stretching vibrations, respectively.14 For PANI-MWCNTs, the main peaks at 1409, 1644 and 1123 cm−1 belong to the CC stretching of the benzenoid ring and quinoid ring and C–N stretching of the secondary aromatic amine, respectively.15 After the interaction between DMcT and PANI, a new peak at 628 cm−1 (C–S–C symmetric stretching vibration) appeared.14 Simultaneously, the peak at 2478 cm−1 (S–H stretching vibration) disappeared. The FTIR spectra could reveal that the formation of DMcT-PANI occurred after the microwave-assisted thiol–ene reaction of DMcT and oxidized PANI.
N and S–H stretching vibrations, respectively. 646 and 710 cm−1 bands stem from C–S–C symmetric and asymmetric stretching vibrations, respectively.14 For PANI-MWCNTs, the main peaks at 1409, 1644 and 1123 cm−1 belong to the CC stretching of the benzenoid ring and quinoid ring and C–N stretching of the secondary aromatic amine, respectively.15 After the interaction between DMcT and PANI, a new peak at 628 cm−1 (C–S–C symmetric stretching vibration) appeared.14 Simultaneously, the peak at 2478 cm−1 (S–H stretching vibration) disappeared. The FTIR spectra could reveal that the formation of DMcT-PANI occurred after the microwave-assisted thiol–ene reaction of DMcT and oxidized PANI.
 | ||
| Fig. 2 FTIR spectra of the DMcT (a), PANI-MWCNTs (b), and AuNPs/TPANI-MWCNTs (c). | ||
To investigate the stepwise interaction process of the modified interfaces, cyclic voltammetry (CV) has been employed. As shown in Fig. 3, the interaction between thiol and PANI decreased the redox peaks of PANI at 0.25/0.21 V and 0.65/0.60 V, which may reveal an electronic and structural modification of the PANI backbones. Similar phenomenon has also been reported for thio-, monoalkoxy-, and dialkoxy-substituted PANI.16 Hence, the MWCNTs can be functionalized with thiolated polyaniline via a microwave-assisted thiol–ene reaction to obtain a number of surface functional groups (S and N groups).
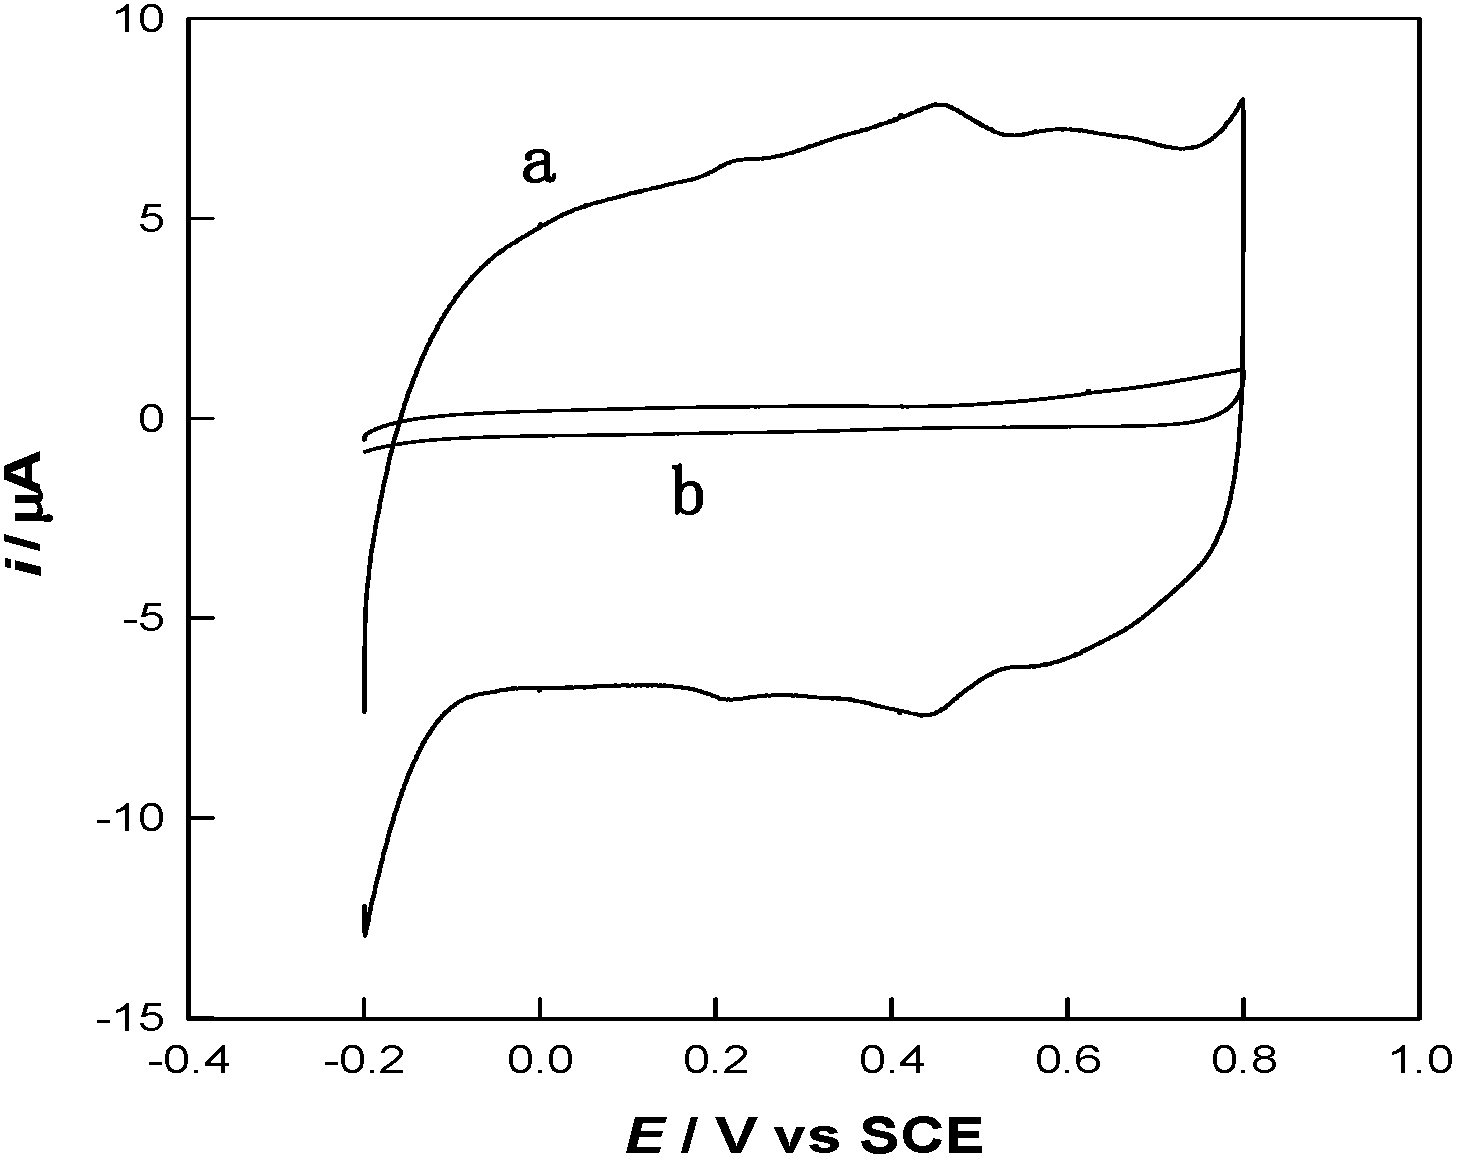 | ||
| Fig. 3 CV curves of PANI-MWCNTs/GCE (a) and TPANI-MWCNTs/GCE (b) in 0.5 M H2SO4 at a scan rate of 50 mV s−1. | ||
The TEM images of AuNPs/TPANI-MWCNT, AuNPs/PANI-MWCNT and AuNPs/MWCNT nanocomposites were examined, as shown in Fig. 4. Numerous well-dispersed AuNPs were observed to be successfully loaded on TPANI-MWCNTs (Fig. 4C), but there is no obvious uniformly dispersed AuNPs loaded on PANI-MWCNTs (Fig. 4B) or MWCNTs (Fig. 4A). This is because the functional groups on the surface of the pristine MWCNTs and PANI-MWCNTs are not only limited but also poorly dispersed. When AuNPs are deposited on the surface, there are insufficient uniform functional groups to anchor Au precursors and AuNPs, leading to poor dispersion and extensive aggregation of AuNPs on the surface. However, the TPANI layer on MWCNTs has numerous functional groups (such as S and N) with uniform distribution. These functional groups are responsible for the immobilization of Au precursors on MWCNT surfaces through the coordination effect. Therefore, the high density of AuNPs with uniform distribution is observed on the surface of TPANI-MWCNTs. These results provide the evidence that the prepared AuNPs/TPANI-MWCNT nanocomposite has a potential application in electrochemical biosensors.
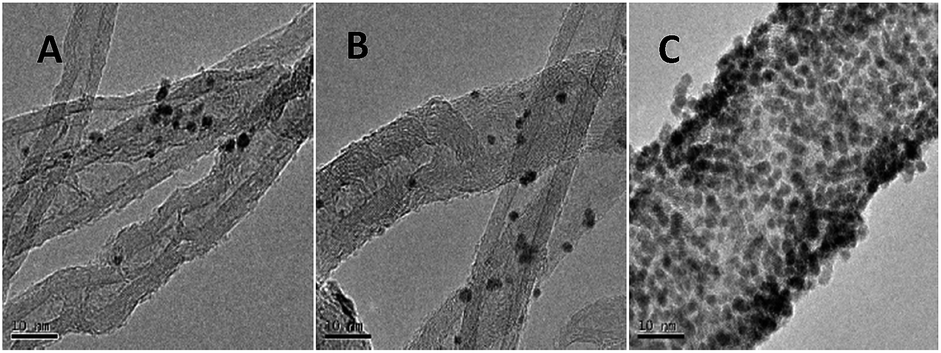 | ||
| Fig. 4 TEM images of AuNPs/MWCNTs (A), AuNPs/PANI-MWCNTs (B), and AuNPs/TPANI-MWCNTs (C). | ||
Fig. 5A shows the UV-vis spectra of IgG (a), IgG–AuNPs (b) and AuNPs (c). For IgG, the absorption peak was observed at 260 nm.10 For AuNPs, an obvious absorption peak was observed at 520 nm. After modification with IgG, two absorption peaks at about 265 nm and 523 nm could be observed due to the change in size and surface environment17,18 from mutual reactions between AuNPs and IgG. According to the above data, it is demonstrated that IgG was immobilized on the AuNP surface. Fig. 5B shows the UV-vis spectra of anti-IAA (a), anti-IAA-AuNPs (b) and AuNPs (c). A noticeable absorption peak of AuNPs and a sharp absorption peak of the typical protein absorption were observed at 520 nm and 280 nm, respectively. When AuNPs were modified with anti-IAA, two absorption peaks appeared at 522 and 283 nm, respectively. The absorption peak at 283 nm could be ascribed to the existence of anti-IAA.10 Meanwhile, the absorption peak of AuNPs shifted slightly from 520 nm to 522 nm due to the modification with anti-IAA. According to the above data, we can conclude that the anti-IAA was successfully immobilized on the AuNPs.
 | ||
| Fig. 5 (A) UV-vis absorption spectra of IgG (a), IgG–AuNPs (b) and AuNPs (c). (B) UV-vis absorption spectra of anti-IAA (a), anti-IAA-AuNPs (b) and AuNPs (c). | ||
Fig. 6 shows the DPV curve of the stepwise modification of the immuno-electrode. The curve of bare GCE showed a characteristic reduction peak of Fe(CN)63− at about 0.17 V (curve a). After the modification of bare GCE with AuNPs/TPANI-MWCNTs, the reduction peak current increased significantly with a low background current (curve b). These can be attributed to the good conductivity of AuNPs/TPANI-MWCNTs due to the high-dispersion of AuNPs, which increased the electron transport ability. However, the reduction peak current decreased after APBA and IgG–AuNP immobilization (curve c and d). It could be attributed to the fact that negatively charged APBA and IgG–AuNPs can block the diffusion of negatively charged Fe(CN)63− to the electrode by the electrostatic repulsion force and can thereby decrease the electron transfer rate. After binding the anti-IAA-AuNP complexes to IgG–AuNPs, the current further decreased (curve e) because of the steric hindrance effect of the immobilized antibody, which demonstrated the successful immobilization of the anti-IAA on the electrode surface. Furthermore, the negatively charged IAA (the pKa of IAA is 4.75) also can block the diffusion of negatively charged Fe(CN)63− to the electrode by the electrostatic repulsion force, which results in a significant decrease in the reduction peak current of Fe(CN)63−/4−. More importantly, the reduction peak current further decreases when the concentration of IAA increases from 0.1 to 1 ng mL−1 (curves f and g). These results indicate that this method can be employed to detect IAA based on the immunoreactions.
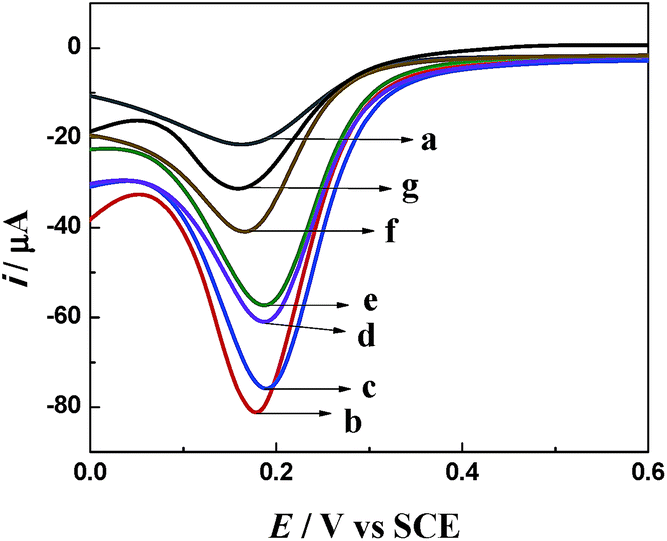 | ||
| Fig. 6 DPV curves of different electrodes in 0.1 M PBS (pH = 7.4) containing 5 mM Fe(CN)63−: (a) GCE, (b) AuNPs/TPANI-MWCNTs/GCE, (c) APBA/AuNPs/TPANI-MWCNTs/GCE, (d) after IgG–AuNPs were immobilized on the electrode, (e) after anti-IAA-AuNPs were immobilized on the electrode, (f and g) IAA was captured on the electrode. The incubation concentrations of IAA in curves (f) and (g) were 0.1 and 1 ng mL−1, respectively. | ||
3.2. Analytical performance of the immunosensor
To examine the detection sensitivity and detection range of the proposed amperometric immunosensor, DPV curves were tested for different concentrations of IAA under optimum experimental conditions (Fig. 7). The change in the reduction peak current of Fe(CN)63− decreased with the increase in the IAA concentration. The linear regression equation of current responses versus logarithm of IAA concentration was Δi (μA) = 9.22logc (ng mL−1) + 27.27 (R2 = 0.9992), with a wide detection range from 1.0 pg mL−1 to 10 ng mL−1 and a low detection limit (LOD) of 0.97 pg mL−1, which is lower than most of previous reports, as listed in Table 1.
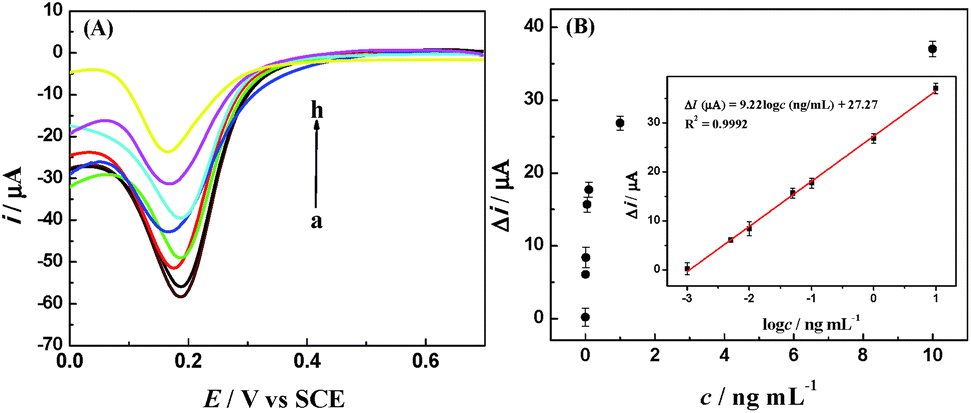 | ||
| Fig. 7 (A) DPV curves of the prepared electrochemical immunosensor after incubation with 0 (a), 0.001 (b), 0.005 (c), 0.01 (d), 0.05 (e), 0.1 (f), 1.0 (g), 10.0 (h) ng mL−1 in 0.1 M PBS (pH 7.4) containing 5 mM Fe(CN)63−. (B) The relation between the change in the reduction peak current and IAA concentration. Inset: the calibration curve plot of the change in the reduction peak current versus the logarithm of IAA concentration. | ||
| Analytical technique | Label | Linear range | LOD |
|---|---|---|---|
| CV19 | HRP | 5–500 μg mL−1 | 5 μg mL−1 |
| DPV10 | Label-free | 0.02–500 ng mL−1 | 0.018 ng mL−1 |
| Photoelectrochemical20 | Label-free | 0.1–1000 ng mL−1 | 0.5 ng mL−1 |
| Amperometric21 | Label-free | 0.1–43 μmol L−1 | 0.074 μmol L−1 |
| HPLC5 | Label-free | 50–5000 ng mL−1 | 0.2 ng mL−1 |
| HPLC-MS/MS6 | Label-free | 5–100 ng mL−1 | 2 ng mL−1 |
| Chemiluminescence4 | AuNPs | 0.02–30 ng mL−1 | 0.01 ng mL−1 |
| DPV22 | Label-free | 0.02–20 ng mL−1 | 0.016 ng mL−1 |
| Amperometric23 | Label-free | 0.8–4 μmol L−1 | 0.21 μmol L−1 |
| DPV24 | Label-free | 0.00001–100 μg mL−1 | 43 pg mL−1 |
| DPVThis work | Label-free | 0.001–10 ng mL−1 | 0.97 pg mL−1 |
As we all know, the specificity of an electrochemical immunosensor is very important for it to be used in wide applications. In order to examine the specificity of the developed method, the fabricated amperometric immunosensor was incubated with 0.1 ng mL−1 IAA solution, and the other four was orderly incubated with 10 ng mL−1 SA, 10 ng mL−1 GA, 10 ng mL−1 ABA and a mixture containing IAA for 1 h. The obtained Δi values were 13.69 μA, 1.45 μA, 1.06 μA, 1.50 Ma and 12.52 μA, respectively (Fig. 8A). These results show that the fabricated amperometric immunosensor has acceptable detection specificity because of the specific antigen–antibody reaction.
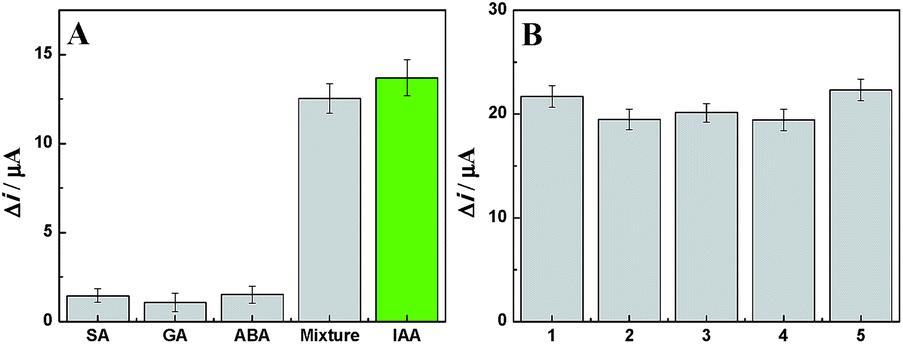 | ||
| Fig. 8 (A) Current response of the electrochemical immunosensor for 10 ng mL−1 SA, GA, ABA, mixture, 0.1 ng mL−1 IAA, (B) current response of five as-prepared electrochemical immunosensors in the same concentration of IAA (0.1 ng mL−1). | ||
Reproducibility is yet another crucial performance measure for an immunosensor. Five as-prepared immunoelectrodes were incubated with the same concentration of IAA (0.1 ng mL−1) and the obtained Δi values were 21.69 μA, 19.47 μA, 20.12 μA, 19.43 μA and 22.32 μA, respectively (Fig. 8B). These similar results indicate that the fabricated amperometric immunosensor has a good reproducibility. Stability of the amperometric immunosensor was also investigated. After the immunoelectrode was placed in a refrigerator for a week, the experimental data showed that the Δi value still retained 94.06% of initial current for detecting 0.1 ng mL−1 of IAA, which demonstrated good stability of the amperometric immunosensor.
3.3. Detection of IAA in plant seeds
For evaluating the feasibility of the developed amperometric immunosensors for practical sample detection, the analysis of IAA from different plant seed extracts were implemented.4 The samples were used for IAA assay. The obtained results were compared with the values from HPLC, as listed in Table 2. The relative deviation (%) ranged from −4.57% to 4.98% between the immunosensor and HPLC, indicating that these immunosensors can be utilized for IAA detection.| Samples | Results by HPLC ng g−1 (n = 3) | Results by immunosensor ng g−1 (n = 3) | Relative deviation (%) |
|---|---|---|---|
| Corn | 645.20 ± 13.28 | 632.50 ± 14.15 | −2.01 |
| Wheat | 80.10 ± 5.35 | 84.30 ± 7.68 | 4.98 |
| Soybean | 18.30 ± 1.23 | 17.50 ± 2.08 | −4.57 |
4. Conclusions
In summary, we synthesized thiolated nanocomposite AuNPs/TPANI-MWCNTs with a high dispersion of AuNPs and then used it to successfully fabricate a sensitive amperometric immunosensor for IAA detection. The results indicated that the analytical performance greatly improved based on the current change in the redox probe of Fe(CN)63−. The thiol–ene chemistry improved the performance of the nanocomposites, which can more uniformly disperse AuNPs, and double-signal amplification of IgG–AuNPs and anti-IAA-AuNPs enabled the capture of more anti-IAA and IAA on the electrode surface through immunoreactions. The immunosensor had some attractive advantages such as wide linear range, low LOD, acceptable selectivity and reproducibility and the detection of IAA extracted from various plant seeds. The proposed method can also be expected to test other phytohormones based on other phytohormone-antibodies or inhibitory proteins.Conflicts of interest
There are no conflicts to declare.Acknowledgements
This work was supported by the National Natural Science Foundation of China (21305039), the Foundation of Hunan Province (14JJ3097), the Foundation of Hunan Agricultural University for 1515 Talents, the Foundation of Hunan Provincial Key Laboratory of Crop Germplasm Innovation and Resource Utilization (17KFXM03), and the Foundation of Orient Science and Technology College of Hunan Agricultural University (17QNZ03). Yongbing Cheng and Chaorong Li contributed equally to this work.References
- H. Mazur, A. Kosakowska and K. Pazdro, J. Chromatogr., 1997, 766, 261 CrossRef CAS.
- C. Uggla, E. J. Mellerowicz and B. Sundberg, Plant Physiol., 1998, 117, 113 CrossRef CAS PubMed.
- J. C. Olsson, P. E. Andersson, K. Bo and A. C. Nordström, J. Chromatogr. A, 1996, 755, 289 CrossRef CAS.
- X. Hun, Z. Mei, Z. Wang and Y. He, Spectrochim. Acta, Part A, 2012, 95, 114 CrossRef CAS PubMed.
- Z. Xi, Z. Zhang, Y. Sun, Z. Shi and W. Tian, Talanta, 2009, 79, 216 CrossRef CAS PubMed.
- S. Giannarelli, B. Muscatello, P. Bogani, M. M. Spiriti, M. Buiatti and R. Fuoco, Anal. Biochem., 2010, 398, 60 CrossRef CAS PubMed.
- C. Wei, H. Zhou, C. Chen, Z. Li and J. Zhou, Anal. Lett., 2011, 44, 2911 CrossRef CAS.
- A. Kugimiya and T. Takeuchi, Electroanalysis, 1999, 11, 1158 CrossRef CAS.
- J. Li, W. Yin, Y. Tan and H. Pan, Sens. Actuators, B, 2014, 197, 109 CrossRef CAS.
- H. Yin, Z. Xu, Y. Zhou, M. Wang and S. Ai, Analyst, 2013, 138, 1851 RSC.
- W. Xi, T. F. Scott, C. J. Kloxin and C. N. Bowman, Adv. Funct. Mater., 2014, 24, 2572 CrossRef CAS.
- Z. Su, J. Huang, Q. Xie, Z. Fang, C. Zhou, Q. Zhou and S. Yao, Phys. Chem. Chem. Phys., 2009, 11, 9050 RSC.
- X. Qin, A. Xu, L. Liu, W. Deng, C. Chen, Y. Tan, Y. Fu, Q. Xie and S. Yao, Chem. Commun., 2015, 51, 8540 RSC.
- J. M. Pope, T. Sato, E. Shoji, D. A. Buttry, T. Sotomura and N. Oyama, J. Power Sources, 1997, 68, 739 CrossRef CAS.
- J. Ding, X. Li, X. Wang, J. Zhang, D. Yu and B. Qiu, Nanoscale Res. Lett., 2015, 10, 1 CrossRef CAS PubMed.
- B. B. And and T. W. Hanks, Macromolecules, 2000, 33, 8035 CrossRef.
- S. Peng, Z. Yang, X. Ni, H. Zhang, J. Ouyang and O. Fangping, Mater. Res. Express, 2014, 1, 015044 CrossRef.
- M. D. Stoller, S. Park, Y. Zhu, J. An and R. S. Ruoff, Nano Lett., 2008, 8, 3498 CrossRef CAS PubMed.
- J. Li, L. T. Xiao, G. M. Zeng, G. H. Huang, G. L. Shen and R. Q. Yu, Anal. Chim. Acta, 2003, 494, 177 CrossRef CAS.
- B. Sun, L. Chen, X. Yan, L. Min, H. Yin and S. Ai, Biosens. Bioelectron., 2014, 51, 164 CrossRef CAS PubMed.
- F. Liu, J. Tang, J. Xu, Y. Shu, Q. Xu, H. Wang and X. Hu, Biosens. Bioelectron., 2016, 86, 871 CrossRef CAS PubMed.
- Z. Su, X. Xu, Y. Cheng, Y. Tan, L. Xiao, D. Tang, H. Jiang, X. Qin and H. Wang, Nanoscale, 2019, 11, 962 RSC.
- H. Li, C. Wang, X. Wang, P. Hou, B. Luo, P. Song, D. Pan, A. Li and L. Chen, Biosens. Bioelectron., 2019, 126, 193 CrossRef CAS PubMed.
- X. Cao, X. Zhu, S. He, X. Xu, Y. Ye and S. Gunasekaran, Nanoscale, 2019, 11, 10247 RSC.
| This journal is © The Royal Society of Chemistry 2019 |