
 Open Access Article
 This Open Access Article is licensed under a
 Creative Commons Attribution 3.0 Unported Licence
Quantification and biodegradability assessment of meso-2,3-dimercaptosuccinic acid adsorbed on iron oxide nanoparticles†
S.
Bemowsky
 a,
A.
Rother
a,
W.
Willmann
bc,
J.
Köser
a,
M.
Markiewicz
ad,
R.
Dringen
bc and
S.
Stolte
*ad
a,
A.
Rother
a,
W.
Willmann
bc,
J.
Köser
a,
M.
Markiewicz
ad,
R.
Dringen
bc and
S.
Stolte
*ad
aUFT – Centre for Environmental Research and Sustainable Technology, Department Sustainable Chemistry, University of Bremen, Leobener Straße 6, D-28359 Bremen, Germany
bCBIB – Centre for Biomolecular Interactions Bremen, Neurobiochemistry, Faculty 2 (Biology/Chemistry), University of Bremen, Leobener Straße 5/NW2, D-28359 Bremen, Germany
cUFT – Centre for Environmental Research and Sustainable Technology, Department Neurobiochemistry, University of Bremen, Leobener Straße 6, D-28359 Bremen, Germany
dTechnische Universität Dresden, Faculty of Environmental Sciences, Department of Hydrosciences, Institute of Water Chemistry, Bergstraße 66, 01069 Dresden, Germany. E-mail: stefan.stolte@tu-dresden.de
First published on 12th August 2019
Abstract
Many interesting applications of magnetic iron oxide nanoparticles (IONPs) have recently been developed based on their magnetic properties and promising catalytic activity. Depending on their intended use, such nanoparticles (NPs) are frequently functionalized with proteins, polymers, or other organic molecules such as meso-2,3-dimercaptosuccinic acid (DMSA) to improve their colloidal stability or biocompatibility. Although the coating strongly affects the colloidal properties and environmental behaviour of NPs, quantitative analysis of the coating is often neglected. To address this issue, we established an ion chromatographic method for the quantitative analysis of surface-bound sulfur-containing molecules such as DMSA. The method determines the amount of sulfate generated by complete oxidation of sulfur present in the molecule. Quantification of the DMSA content of DMSA-coated IONPs showed that reproducibly approximately 38% of the DMSA used in the synthesis was adsorbed on the IONPs. Tests for the biodegradability of free and NP-bound DMSA using a microbial community from a wastewater treatment plant showed that both free and NP-bound DMSA was degraded to negligible extent, suggesting long-term environmental stability of DMSA-coated IONPs.
1. Introduction
Magnetic iron oxide nanoparticles (IONPs) with either magnetite (Fe3O4) or maghemite/hematite (Fe2O3) as the cores have received much attention in recent decades because of their unique magnetic properties and high catalytic activities.1,2 They have been developed for a wide range of biomedical and environmental applications. These include biomedical imaging, cellular labelling and tracking in tumour therapy, targeted drug delivery systems,3,4 and soil and groundwater remediation,5 including wastewater treatment.6,7 Their use in remediation is based on their efficient removal of toxic metal ions from aqueous solutions via adsorption,7,8 after which they can be removed by applying external magnetic fields.9 Hu et al. reported adsorption capacities of 17.0–19.2 mg g−1 for Cr(VI), 26.8 mg g−1 for Cu(II), and 23.6 mg g−1 for Ni(II) by maghemite nanoparticles (NPs).10,11 Uncoated IONPs have high surface energies because of their large surface-to-volume ratios and are therefore prone to particle agglomeration,6 and this tends to minimize surface energies. NP-specific properties such as superparamagnetism,12 reactivity, and mobility6 can consequently change. Furthermore, they are sensitive to air oxidation13 because of their high chemical activities. IONPs are therefore often coated with inorganic or organic compounds such as Au,14,15 silica,16 humic acid,17 and dextran18,19 or other polymers20,21 to enhance their colloidal stability and reduce the probability of magnetite IONP oxidation in aqueous media.22 A coating can also be used to endow IONPs with specific surface functionalities for cell labelling and targeting,3 or ion binding to increase metal ion adsorption for water treatment processes.6 In particular, NPs functionalized with meso-2,3-dimercaptosuccinic acid (DMSA, Fig. 1A) have potential applications in drug delivery systems,23,24 as heating agents for magnetic hyperthermia25–27 and remediation of heavy-metal-contaminated environments.28,29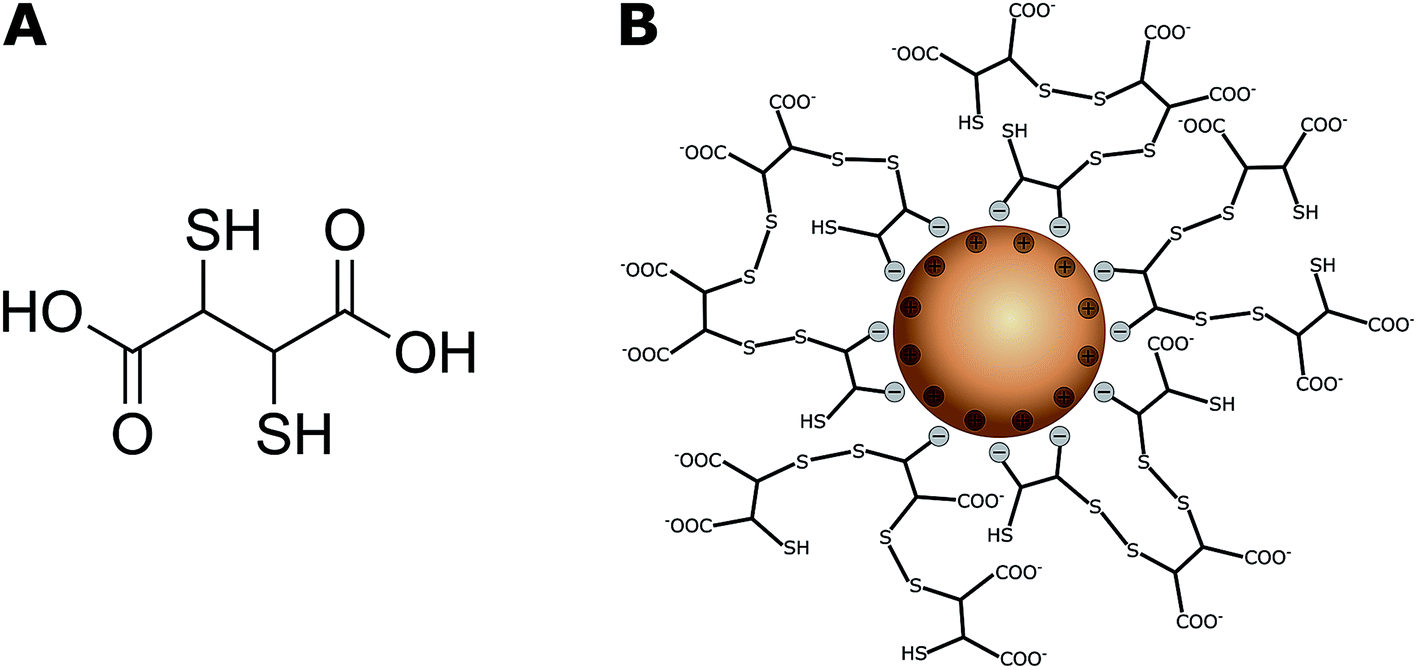 | ||
| Fig. 1 (A) Chemical structure of meso-2,3-dimercaptosuccinic acid (DMSA); (B) DMSA-IONP: functionalized surface via binding of DMSA carboxylate groups and cage formation by disulfide bridges.32 The thiol and negatively charged carboxylate groups on the surface can effectively capture heavy metal ions.41 | ||
DMSA contains two sulfhydryl groups (–SH),30,31 and oxidation of DMSA molecules forms a cage via disulfide crosslinking around the IONPs and modifies the surface charges of the particles because of an excess of carboxylic groups (Fig. 1B).32
Because DMSA as a thiol-containing compound is a good chelator of metals such as arsenic, cadmium, lead, and mercury31,33,34 and is categorized as not harmful to humans or other mammals, it is approved for clinical chelation therapy.35–37 Similarly, studies of DMSA-coated IONPs (DIONPs) have shown weak or no genotoxicity and cytotoxicity towards mammalian cells such as cultured brain astrocytes38 and human dermal fibroblasts39 at the highest tested concentrations, namely 0.22 and 0.10 g Fe L−1 (4000 and 1791 μM iron). However, uncoated IONPs affected brain nerve cells of mice via induction of oxidative stress and morphological damage on administration of 130 μg of IONPs.40 Few studies have evaluated the environmental effects of DIONPs and uncoated IONPs.41–43 The consequences of exposing aquatic organisms such as duckweed (Lemna minor), green algae (Raphidocelis subcapitata), or water fleas (Daphnia magna) to such NPs have recently been investigated.41 The determined EC50 values (72 h) for green algae range from 0.05 mg Fe L−1 for uncoated IONPs to 0.13 mg Fe L−1 for DIONPs (0.86–2.27 μM Fe). DIONPs showed no effect and uncoated IONPs showed moderate toxic effects on Daphnia (EC50 21–66 mg Fe L−1 and 374–1181 μM Fe, respectively) after 72 h, but ingestion and accumulation of coated and uncoated IONPs was observed in the gastrointestinal tract of daphnids. Neither type of IONPs (with or without DMSA coating) affected Lemna; this was because of particle agglomeration in the medium. The DMSA coating apparently mitigates the ecotoxicity of IONPs and therefore environmental processes which cause degradation of the coating and release of IONPs will essentially increase the environmental hazard posed by these NPs. In the aforementioned studies, comprehensive particle characterization was performed by atomic absorption spectroscopy, atomic force spectroscopy, dynamic and electrophoretic light scattering (DLS/ELS), flow field-flow fractionation, transmission electron microscopy, and other techniques.41,44–46 However, information on the amount of DMSA adsorbed on NP surfaces is not yet available. In particular, the ratio of bound/free DMSA and its changes over time (e.g. as a result of biodegradation) are important in environmental hazard assessment because the stability, biological effects, and transport behaviours of DIONPs in any environmental medium will be directly affected.
The standard electrochemical procedures such as capillary or gel electrophoresis which are used for the detection and separation of NPs by size and shape47 cannot be used to determine and quantify surface-adsorbed biomolecule concentrations. In electrochemical analysis, NPs in the sample can cause problems such as adsorption on the electrode surface47 or can affect the signal sensitivity of UV/Vis detectors,48 which are often used in electrochemical methods. Known methods of detection for DMSA include high-performance liquid chromatography (HPLC)30,34,49 paired with fluorescence detection or a gas chromatographic system coupled with a flame ionization detector (GC-FID).50 DMSA tends to oligomerize in atmospheric oxygen because of formation of disulfide bridges. Quantification of DMSA usually requires conversion of oligomers to monomeric DMSA via chemical reactions, e.g. with dithiothreitol, or electrochemically. Limits of quantification for GC-FID and HPLC are 150 μmol L−1 and 0.14–0.55 μmol L−1 (depending on physiological matrices) respectively. These methods are not suitable for NPs or solutions with high metal ion concentrations, because of lack of volatility, the possibility of capillary blocking, or interference with detection. To avoid DMSA oligomerization in analytical samples, we suggest complete oxidation of the thiol groups of DMSA to sulfate ions in the presence of aqua regia at high temperatures. The sulfate concentration can be assessed quantitatively by ion chromatography (IC). In this study, this analytical approach was validated and used to determine the ratio of bound/free DMSA.
Chemical transformations of nanomaterials in the environment include adsorption of macromolecules, biodegradation of coatings, dissolution, oxidation, reduction, and sulfidation, many of which have been studied in detail, but less attention has been paid to transformations of surface coatings.51,52 In particular, the effects of aqueous photochemical reactions, biodegradation, and similar processes on adsorbed macromolecules lead to corona changes and strongly affect surface interactions and reactivity, which in turn affect the transport, fate, and toxicity of NPs.52–54 It has been shown that poly(ethylene oxide) which was covalently linked to NPs was biologically degraded by bacteria enriched from urban river water.55 The microbial degradation of some macromolecules can occur extracellularly by secreted enzymes,56,57 but the degradation of water-soluble molecules by bacteria often requires uptake into the cell.56,58 Intracellular degradation of the coating of Au NPs by enzymes in rats59 and embryonic mouse fibroblasts60 was detected for proteins (bovine serum albumin) and poly(isobutylene-alt-maleic anhydride) with a dodecyl side chain, respectively. Further examples of transformations of adsorbed biomolecules include photochemical degradation of the citrate coating of CeO2 NPs61 or the thiolated poly(ethylene glycol) corona of Au NPs.54
For coated NPs, in most cases it is not possible to comment on the amount of adsorbed material. Because the concentrations are unknown, assumptions have to be made for interpretation of the experimental data, as described by Zhang et al.41 After the release of DIONPs into the environment, microbial degradation of the surface coating can lead to a change in particle behaviour. It is therefore important to determine how much substance is adsorbed on the NP surfaces. In this study, we established and validated a quantitative method for the determination of NP-bound DMSA and then examined whether or not it was biodegradable. To determine the amount of DMSA coated on DIONP, the NPs were digested and the thiol groups of the surface-adsorbed DMSA were oxidized to sulfate, which was then quantified by IC.
2. Materials and methods
2.1 Materials
All chemicals were purchased in the highest purity available from Sigma-Aldrich (Steinheim, Germany), Merck (Darmstadt, Germany), or VWR (Langenfeld, Germany). This includes DMSA (≥97.5%), FeCl3 (≥99.99%), HCl (≥37%, puriss p.a.), HNO3 (≥65%, puriss p.a.), H2SO4 (95–97%, puriss p.a.), K2SO4 (≥99%), KI (≥99.5%, puriss p.a.), Na2CO3 (99.95–100.05%), and NaHCO3 (≥99.7%). EPA-certified (United States Environmental Protection Agency) thread vials (20 mL, clear glass, ND24) from neo-Lab (Heidelberg, Germany) were used for colloidal stability testing. Twenty-four-well microtitre plates were obtained from Sarstedt (Nümbrecht, Germany). MilliQ water (resistivity 18.2 MΩ cm) was produced with a Millipore MilliQ Plus water purification system (Burlington, MA, USA).2.2 Procedures for synthesis of DIONPs
![[thin space (1/6-em)]](https://www.rsc.org/images/entities/char_2009.gif) :1 mixture of 1.4 M HCl and 4.5% w/v KMnO4 in double-distilled water) and then fresh iron-detection reagent (30 μL; 2.5 M ammonium acetate, 1 M ascorbate, 6.5 mM ferrozine, and 6.5 mM neocuproine) was added.64 After reaction for 30 min at room temperature, samples (280 μL) were placed in the wells of a microtitre plate (Sarstedt, Nümbrecht, Germany) and the absorbance of the iron–ferrozine complex at 540 nm was recorded with a Sunrise RC microtitre plate photometer (Tecan, Crailsheim, Germany). The iron content was determined by comparing the absorbance of the sample to those of defined iron standard solutions (FeCl3 in 10 mM HCl).
:1 mixture of 1.4 M HCl and 4.5% w/v KMnO4 in double-distilled water) and then fresh iron-detection reagent (30 μL; 2.5 M ammonium acetate, 1 M ascorbate, 6.5 mM ferrozine, and 6.5 mM neocuproine) was added.64 After reaction for 30 min at room temperature, samples (280 μL) were placed in the wells of a microtitre plate (Sarstedt, Nümbrecht, Germany) and the absorbance of the iron–ferrozine complex at 540 nm was recorded with a Sunrise RC microtitre plate photometer (Tecan, Crailsheim, Germany). The iron content was determined by comparing the absorbance of the sample to those of defined iron standard solutions (FeCl3 in 10 mM HCl).
2.3 Method validation
To investigate the amount of DMSA adsorbed on NPs, the NPs were digested, and the organic coating was oxidized to enable determination of the thiol groups of DMSA as sulfate. An IC method was established with K2SO4 as the standard for the concentration range 5–95 μM. To calculate the amount of DMSA bound to the particles two types of analytical samples were prepared (for details please see Fig. S1 in the ESI†): ‘sample A’ after coating, centrifugation, washing and filtration through 0.2 μm syringe filter contained NP-bound DMSA and free DMSA that coprecipitated with the pellet (mpellet = mfree + mbound); ‘sample B’ after additional step of ultrafiltration contained only free DMSA that was present in the pellet (mfree). The ultrafiltration was performed using Vivaspin 500 centrifugal filters (Sartorius, Göttingen, Germany) with a polyethersulfone membrane (3000 molecular-weight cut-off). The filter was rinsed four times with deionized water (500 μL) at 14100 rcf for 30 min prior to centrifuging the NPs to avoid contamination with interfering ions in the IC analysis. The amount of bound DMSA was then calculated as: mbound = mpellet − mfree.
Release of iron ions during digestion of the DIONP samples could affect the analysis, therefore additional iron chloride (10 μL of 50 mM FeCl3, 0.125 mM in the sample) was added to the calibration standards prior to their treatment to investigate its influence on the analysis.
Both types of samples (A and B) were digested with aqua regia at high temperature to oxidize DMSA to water-soluble sulfate and to dissolve the NPs (in sample A). An aqueous sample (100 μL) consisting of DIONPs (sample A) or free DMSA (sample B) was mixed with 37% HCl (80 μL) and ≤69% HNO3 (20 μL), followed by addition of 50 mM FeCl3 (10 μL). The mixture was homogenized for 30 s with a vortex mixer (Heidolph, Schwabach, Germany) and then centrifuged in a Minispin Plus centrifuge (Eppendorf, Hamburg, Germany) for 30 s at 6700 rcf. The organic material in the sample was oxidized overnight at 95 °C in a thermoblock (Eppendorf, Thermomixer compact). The dried sample was then dissolved in the IC eluent (1 mL; mixture of Na2CO3 and NaHCO3). To avoid transfer of residual particles in sample A into the IC system, 700 μL of this sample were transferred to a new cup and centrifuged once more for 30 min at 14100 rcf. The 500 μL of both samples were vortexed and centrifuged again at 14100 rcf for 30 min.
Finally, the 500 μL of each sample were diluted with eluent (1480 μL) and an internal anion standard (20 μL; 5 mM KI), homogenized for 20 s with a vortex, and then analysed via IC. For samples without FeCl3 the last centrifugation step was omitted and 500 μL of the sample were directly diluted with eluent and internal standard. For a flowchart of sample preparation please see Fig. S1 in ESI file.†
The zeta potentials of the samples were determined by ELS under the same conditions as those used for DLS, except the scattering angle was changed to 15°. A sample (5 mL) was directly injected into a flow cell and equilibrated, after which three repetitions with a measurement time of 300 s were performed. Data were evaluated by the Smoluchowski equation from the refractive index, viscosity, and dielectric constant (ε = 78.3) of pure water with Beckman Coulter software (see DLS section). All measurements were recorded as three independent replicates for each sample.
Calibration was performed with K2SO4 over the concentration range 5–95 μM in concentration steps of 10 μM. Five independent repetitions were performed for each sample. The detection limit was determined with the student t-test for a confidence interval of 95% and the quantification limit corresponded to three times the detection limit.
2.4 Biodegradation test
A manometric respirometry method, namely OECD 301 F (Organisation for Economic Cooperation and Development, OECD, 2006) was used to measure the pressure decrease in test vessels caused by consumption of oxygen used by bacteria to degrade the sample.65 The test mixture (final volume 432 mL) contained a mineral medium (8.5 mg L−1 KH2PO4, 21.75 mg L−1 K2HPO4, 22.13 mg L−1 Na2HPO4·2H2O, 1.7 mg L−1 NH4Cl, 27.5 mg L−1 CaCl2, 22.5 mg L−1 MgSO4·7H2O, and 0.25 mg L−1 FeCl3), microbial inoculum, nitrification inhibitor (allylthiourea, 5 mg L−1), and 20 mg L−1 of the test substance. The microbial inoculum was derived from activated sludge from an aeration tank at the municipal wastewater treatment plant in Delmenhorst, Germany, with an average dry sludge content of 5 g L−1. Prior to the experiments, flocs were allowed to settle and then discarded. The remaining supernatant was aerated for 7 days and used as the inoculum after addition of a medium containing 104 to 105 colony-forming units per millilitre on average, determined by a Paddle test (Hach Lange, Düsseldorf, Germany). The test substances were weighed and combined with 1 L of inoculum in volumetric flasks. Two samples of volume 432 mL were taken from each flask and placed in amber-glass test bottles (OxiTop, WTW). Because of the limited sensitivity of the technique (lowest measurable range 40 mg O2 L−1) the concentrations of the test substance were significantly higher than expected environmental concentrations. Each sample test was run in duplicate, with blank samples to account for endogenous cellular breathing, and positive controls containing benzoic acid in the same concentration as that of the sample substance (20 mg L−1). During the test, the temperature was maintained at 20 °C. The decrease in pressure inside the bottle caused by oxygen consumption was measured, recorded, and converted to the biochemical oxygen demand (BOD). Finally, the percentage degradation was calculated from the BOD value and theoretical oxygen demand of DMSA, according to the guidelines.653. Results and discussion
3.1 Calibration of sulfate and effect of digestion process
The data shown in Fig. 2 curve A represent mean values of K2SO4 standards (5–95 μM) with standard deviations (n = 5). This calibration curve showed that the sulfate limit of detection (LOD) was 0.32 mg L−1 (1.83 μM) and the limit of quantification (LOQ) was 0.96 mg L−1 (5.49 μM). An internal anion standard, 50 μM KI, was used to correct for peak area variations (in the range 2.5–6.3%) over time from the quotient of the sulfate and iodine peak areas in the chromatograms. This ratio was used to obtain a calibration curve; a linearity check indicated second-order regression (R2 = 0.9998). | ||
| Fig. 2 (Curve A) Calibration (n = 5) of K2SO4 over the concentration range. (Curve B) Calibration and determination of recovery rates of K2SO4 subjected to the same digestion procedure as the samples. Data represent mean values ± SD (n = 3). | ||
The sulfate recovery rates in the oxidation protocol were investigated for K2SO4 concentrations of 5, 25, 45, 65, 85, and 95 μM (Fig. 2 curve B). These samples showed average sulfate recovery rates of 93.7 ± 8.0% over three independent repetitions. A comparison of the two calibration curves showed that the area ratio after sample oxidation decreased by an average of 10.28 ± 1.21% over the concentration range, resulting in a higher LOD and LOQ of 0.57 mg L−1 (3.29 μM) and 1.72 mg L−1 (9.87 μM), respectively. A possible cause of the reduced signal and lower sensitivity could be loss of sulfate during sample preparation and treatment.
A direct comparison of the calibration curves (see Fig. S2 in the ESI†) obtained with and without addition of iron ions showed no significant difference (p = 0.4613 > 0.05). This indicates that the presence of iron ions did not affect the detection of sulfate and the added FeCl3 was not measurably contaminated with sulfate during production. The recovery rate was 98.5 ± 7.2%. However, the LOD and LOQ for the calibration curve with added FeCl3 decreased by approximately 44% to 0.14 mg L−1 (0.81 μM) and 0.42 mg L−1 (2.43 μM), respectively. This enables better quantification of sulfate from the DMSA-containing samples. It seems that the presence of iron ions affects the sensitivity by reducing the measurement variability, resulting in lower LOD and LOQ values.
3.2 Quantification of DMSA
After successfully verifying the reproducibility of the sulfate detection method, the method was used to determine known DMSA concentrations of 0.1, 0.5, 0.9, 1.3, 1.7, and 1.9 mM. DMSA contains two thiol groups, therefore two equivalents of sulfate are released by oxidation of one equivalent DMSA. If this fact and dilution through sample preparation are taken into account, the theoretical sulfate concentrations correspond to those of the calibration samples (5, 25, 45, 65, 85, and 95 μM). As shown in Fig. 3, an acceptable mean recovery rate for the digested DMSA samples, namely 80.6 ± 17.4% over three independent repetitions, was achieved. The sequence of steps needed for the sample preparation (see also ESI Fig. S1†) is one possible reason for the variations in the DMSA recovery rate. Another reason might have been an incomplete digestion of DMSA, therefore not all of the substance would be present as measurable sulfate. This is also true for surface adsorbed DMSA since a basic medium is used during the coating process and thiols tend to form disulfide bonds under these conditions which may affect the recovery rate of DMSA by incomplete oxidation to sulfate. Furthermore, the potential maximum recovery may be lower because the purity of DMSA is given as ≥97.5%, and on drying a maximum loss of 1% water can occur. | ||
| Fig. 3 Influence of digestion process on sulfate recovery of DMSA in comparison to the calibration and determination of recovery rates of K2SO4 after the digestion procedure. Data represent mean values ± SD (n = 3). | ||
 | ||
| Fig. 4 Influence of FeCl3 addition (0.125 mM in sample) on the DMSA digestion and recovery rate of sulfate. Data represent mean values ± SD (n = 3). | ||
Metal ions such as Fe3+ can be weakly bound by DMSA because of its chelating properties.31,66,67 This might reduce DMSA oligomerization, which enables more complete oxidation of sulfur and therefore higher sulfate recovery rates. Iron ions could also act as redox catalysts and have a positive effect on the oxidation of sulfur to sulfate.68,69 As a result, the concentrations of DMSA will be determined more precisely, with a higher recovery.
| Batch | c (Fe) [mmol L−1] | c (DMSA total) [mmol L−1] | c (DMSA bound) [mmol L−1] | c (DMSA free) [mmol L−1] | Molar ratio DMSA (bound)/Fe |
|---|---|---|---|---|---|
| A | 46.13 | 1.35 ± 0.15 | 1.13 ± 0.14 | 0.22 ± 0.08 | 0.0245 ± 0.0029 |
| B | 40.49 | 1.24 ± 0.32 | 1.00 ± 0.34 | 0.24 ± 0.12 | 0.0247 ± 0.0084 |
| C | 43.00 | 1.25 ± 0.32 | 1.02 ± 0.34 | 0.23 ± 0.03 | 0.0237 ± 0.0079 |
| D | 35.60 | 1.36 ± 0.45 | 1.18 ± 0.42 | 0.19 ± 0.04 | 0.0331 ± 0.0118 |
| Mean | 41.31 ± 4.45 | 1.30 ± 0.31 | 1.08 ± 0.31 | 0.22 ± 0.07 | 0.0265 ± 0.0078 |
For the biodegradation tests, a known concentration of the biomolecule in the test system is required. Knowledge of the quantities of bound and free DMSA in the DIONP samples enabled us to investigate the biodegradability of the produced material.
In this regard, the IC analysis showed that samples used for biodegradation testing contained not only bound DMSA but also some dissolved DMSA oligomers amounting to approximately 20% of the bound amount (Table 1).
3.3 Characterization of DIONP
DLS measurements showed that after incubation for 28 days the DIONP were colloidally stable in water. The hydrodynamic diameter (d) was 39.1 ± 10.5 nm in diluted dispersions and showed no significant change over the time of the incubation period. In the biodegradation medium OECD 301 F the DIONP were not colloidally stable and agglomerated. The hydrodynamic diameter in this medium showed a slow and steady increase during the incubation period of 28 days from 41.3 ± 10.7 nm in the beginning (0 days) to the end (28 days) with 946 ± 252 nm (Tables 2 and 3). According to the Derjaguin–Landau–Verwey–Overbeek theory, the ionic strength strongly affects the surface charge and colloidal stability of NP dispersions.72 As the ionic strength of the OECD 301 F medium (21.5 mM) is much higher than that of MilliQ water, particle repulsion is weaker and the probability of contact between particles rises. Additionally, the medium contains Ca2+ and Mg2+ ions, which are known to promote particle–particle interactions by bridging effects, and thus agglomeration of NPs.21,73| Time [d] | Parameter | |||
|---|---|---|---|---|
| d (distribution size) [nm] | PI | z [mV] | pH | |
| 0 | 43.6 ± 11.6 | 0.225 | −49.6 ± 5.69 | 8.14 |
| 1 | 46.3 ± 12.1 | 0.231 | −47.0 ± 2.92 | 7.52 |
| 2 | 43.8 ± 12.4 | 0.226 | −47.6 ± 6.49 | 7.90 |
| 7 | 42.8 ± 11.0 | 0.225 | −39.9 ± 3.52 | 8.33 |
| 14 | 41.9 ± 11.0 | 0.237 | −47.5 ± 2.76 | 7.73 |
| 21 | 38.3 ± 9.9 | 0.278 | −43.8 ± 3.90 | 8.06 |
| 28 | 39.1 ± 10.5 | 0.286 | −45.4 ± 3.75 | 7.44 |
| Time [d] | Parameter | |||
|---|---|---|---|---|
| d (distribution size) [nm] | PI | z [mV] | pH | |
| 0 | 41.3 ± 10.7 | 0.214 | −37.5 ± 1.47 | 7.72 |
| 1 | 73.3 ± 20.8 | 0.204 | −37.0 ± 0.82 | 7.72 |
| 2 | 96.3 ± 26.5 | 0.184 | −37.5 ± 1.38 | 7.73 |
| 7 | 334 ± 86.8 | 0.259 | −35.6 ± 0.64 | 7.69 |
| 14 | 546 ± 148 | 0.275 | −37.4 ± 0.63 | 7.62 |
| 21 | 631 ± 165 | 0.267 | −37.7 ± 0.46 | 7.56 |
| 28 | 946 ± 252 | 0.322 | −37.2 ± 0.39 | 7.52 |
Large errors in diameters determined by DLS can arise because the measurements are based on the intensity of light scattered by particles in solution. Consequently, when calculating the diameter, larger particles are weighted more strongly than smaller particles because the contribution of scattered light to the correlation function scales with r6 (radius to the power of six). Light-scattering techniques such as DLS cannot detect individual particles inside agglomerates. In these techniques, all agglomerates are therefore regarded as single particles, resulting in a larger calculated diameter.
3.4 Biodegradability
We performed an ultimate biodegradability study with free DMSA and DIONPs. There was no significant degradation of DMSA in either case. As shown in Fig. 5, the degradation rates for free and bound DMSA were less than 10%. The test fulfilled the validity criteria (BOD in blanks, IONP blanks and degradation of benzoate within a given time frame; see Fig. S3 and S4 in ESI†). A control experiment with uncoated IONPs and benzoate showed that the NPs (or ions released from the NPs) had no effect on the biodegradability of an easily degradable substance, proving that the presence of NPs does not negatively affect the microbial community (see Fig. S4 in ESI†). A biodegradation of at least 60% initial BOD, which was achieved during the test period within a time frame of 10 days, can be considered as evidence of ready biodegradability in accordance with the OECD 301 F guidelines.65 The 10 days window starts when 10% biodegradation is reached. The 60% pass level represents virtually complete ultimate biodegradation of the test substance because it is assumed that the remaining 30–40% is assimilated by biomass or is present as products of biosynthesis. | ||
| Fig. 5 Biological degradation of DMSA in dissolved form (orange circle) or adsorbed on the surface of DIONP (blue circle). Data represent mean values ± SD (error range as an area of coloured lines, n = 4 for DIONP and n = 8 for DMSA). | ||
The biodegradation was below 10% over the entire duration of the experiments, therefore the tested substances are considered to be not readily biodegradable; this contradicts the BIOWIN prediction. Quantitative structure–activity relationship models predict that the chemical structure of DMSA is readily biodegradable. The BIOWIN v.4.10, US Environmental Protection Agency Estimation Programs Interface Suite was used to predict the probability of biodegradation.74 Microbial conversion of mercaptosuccinic acid, which is structurally similar to DMSA, but has only one –SH functional group, has been reported in the literature.75 This supports the prediction made by the biodegradability model.
A key factor in the microbial degradation of biomolecules is the physical accessibility of the substance. For NPs or large biomolecules, the pathways for cellular entry into microorganisms are unfortunately insufficiently understood.76 In addition to the diffusion of small molecules through the membrane pores, endocytosis-like processes have been observed in which extracellular material is imported into the cells via the membrane transport system.77–79 A single DMSA molecule is smaller than 1 nm on the basis of sum of the known bond lengths (H–O, C–O, C–C) and could pass directly through membrane pores of size 4–50 nm.80,81 After uptake, small molecules can be biologically degraded by intracellular enzymes. DMSA tends to oligomerize by formation of disulfide bridges via thiol groups (–SH). This property of DMSA may strongly affect its bioavailability. The same applies to bound DMSA in the DIONP coating if microorganisms are unable to take up the coated NPs. For comparison we have predicted ultimate biodegradability of DMSA oligomers containing up to six DMSA units. Upon addition of the fifth DMSA molecule the applicability domain of the BIOWIN model in terms of molecular weight of the compound in question is exceeded. Despite that biodegradability actually increases with each additional DMSA unit.
Furthermore, the state of aggregation may vary in the range of environmental NP concentrations compared to the laboratory scale. NPs may be influenced by organic matter in aqueous systems, changing their behaviour by adsorbing to or exchanging the DMSA. The binding of strong ligands is of great importance for particle stability. One example is the interaction of the DMSA carboxylate groups on the IONP surface and the formation of a disulfide network.32,82 A more stable NP coating and thus reduced aggregation can influence particle properties such as stability and dissolution rates and change their bioavailability for pelagic organisms.83
The tendency of DMSA to form disulfide bridges and to polymerize probably complicates the uptake of DMSA from solution into microorganisms. Moreover, the DMSA coating on DIONPs may be less accessible to organisms which break down the coating from a free end group.52 The uptake of coated NPs into bacterial cells probably did not occur. The strong negative charge of NPs (Table 3) gives raise to repulsion between NPs and cells which are also negatively charged.84 Therefore, the lack of degradation of both DMSA oligomers in solution as well as DMSA present in NPs coating is most probably caused by their poor bioavailability.
4. Conclusions
We developed and validated a method for quantitative analysis of DMSA in IONP samples and used the method to determine the amounts of IONP-bound DMSA. It allowed us to determine the average amount of DMSA molecules present in the DIONPs coating with a quantification limit of 1.22 μmol L−1, which is about the same order of magnitude as the HPLC methods described in the literature, but with much simpler sample preparation. This method may be applicable to coated NPs of other metals and metal oxides if these NPs have a coating with a known sulfur content (as in the case of DMSA, which has two thiol groups) and these groups can be oxidized to sulfate. The method can therefore be used to verify the reproducibility of NP synthesis with regard to surface coating with DMSA or any other sulfur-containing coating.DIONPs were colloidally stable in water over a long period of time but agglomerated in saline media because of the high ionic strength.
The stability of coating is an important issue defining fate of NPs in the environment.85,86 We have shown on a laboratory scale that the DMSA coating cannot be stripped of by the microbial community of wastewater treatment plant within the time range of the experiments. Under the selected aerobic test conditions, no significant degradation of DMSA was observed. In addition to the structure of the DMSA coating, the increasing size during incubation in the biodegradation medium may lead to reduced bioavailability. This suggests that the DIONP will be more stable than uncoated IONP in wastewater treatment plant, which is a likely release pathway considering possible application in medicine.86,87 The stability in freshwater will most probably be even higher due to lower salinity and less abundant microbial community.
These results suggest potential persistence of DMSA or DIONPs in the environment, but additional studies are needed to verify this first suspicion. Consequently, DIONPs could remain intact in wastewater treatment plants, albeit in agglomerated form, and interact with sewage sludge, for example.88,89 In some regions, sludge is used as fertilizer in agriculture and therefore enters other environmental compartments such as soils and sediment. During 2015, about 40% of the annual sewage sludge produced in Germany was recycled for agriculture and landscaping measures.90
Depending on the environmental conditions at the release site, coating of IONPs can affect particle behaviour, transport, or possible release of DMSA and iron ions. These effects also need to be investigated for potential long-term environmental exposures of NPs. While short-term exposures could cause only minor effects, extended exposure might lead to severe toxicity or inhibition of the organism metabolism.91,92 Especially low concentrations of NPs could develop effects after accumulation in the environment or organisms. The widespread use of nanotechnology in waste water treatment, agriculture and other sectors requires a more ecologically relevant system approach including long-term studies under environmental realistic scenarios.93
Conflicts of interest
The authors declare no conflicts of interest.Acknowledgements
The authors would like to thank Mathias Gogolin, Maren Nolte, and Sarah Schriefer for performing some IC measurements in the context of student projects. This study was financially supported by the Hans-Böckler Foundation within the Graduate School for NanoCompetence and by the German Federal Ministry of Education and Research (BMBF, funding code 03X0152, project “DENANA”).References
- K. Zhu, Y. Ju, J. Xu, Z. Yang, S. Gao and Y. Hou, Acc. Chem. Res., 2018, 51, 404–413 CrossRef CAS PubMed.
- A. S. Teja and P.-Y. Koh, Prog. Cryst. Growth Charact. Mater., 2009, 55, 22–45 CrossRef CAS.
- W. Wu, Z. Wu, T. Yu, C. Jiang and W.-S. Kim, Sci. Technol. Adv. Mater., 2015, 16, 023501 CrossRef.
- A. K. Gupta, R. R. Naregalkar, V. D. Vaidya and M. Gupta, Nanomedicine, 2007, 2, 23–39 CrossRef CAS PubMed.
- A. B. Cundy, L. Hopkinson and R. L. D. Whitby, Sci. Total Environ., 2008, 400, 42–51 CrossRef CAS.
- P. Xu, G. M. Zeng, D. L. Huang, C. L. Feng, S. Hu, M. H. Zhao, C. Lai, Z. Wei, C. Huang, G. X. Xie and Z. F. Liu, Sci. Total Environ., 2012, 424, 1–10 CrossRef CAS PubMed.
- M. Hua, S. Zhang, B. Pan, W. Zhang, L. Lv and Q. Zhang, J. Hazard. Mater., 2012, 211–212, 317–331 CrossRef CAS PubMed.
- J.-S. Hu, L.-S. Zhong, W.-G. Song and L.-J. Wan, Adv. Mater., 2008, 20, 2977–2982 CrossRef CAS.
- L. Carlos, F. S. G. Einschlag, M. C. González and D. O. Mártire, in Waste Water - Treatment Technologies and Recent Analytical Developments, InTech, 2013 Search PubMed.
- J. Hu, G. Chen and I. M. C. Lo, Water Res., 2005, 39, 4528–4536 CrossRef CAS PubMed.
- J. Hu, G. Chen and I. M. C. Lo, J. Environ. Eng., 2006, 132, 709–715 CrossRef CAS.
- D. Huber, Small, 2005, 1, 482–501 CrossRef CAS.
- D. Maity and D. C. Agrawal, J. Magn. Magn. Mater., 2007, 308, 46–55 CrossRef CAS.
- M. Chen, S. Yamamuro, D. Farrell and S. A. Majetich, J. Appl. Phys., 2003, 93, 7551–7553 CrossRef CAS.
- S. Moraes Silva, R. Tavallaie, L. Sandiford, R. D. Tilley and J. J. Gooding, Chem. Commun., 2016, 52, 7528–7540 RSC.
- M. D. Alcalá and C. Real, Solid State Ionics, 2006, 177, 955–960 CrossRef.
- J. Liu, Z. Zhao and G. Jiang, Environ. Sci. Technol., 2008, 42, 6949–6954 CrossRef CAS PubMed.
- C. Tassa, S. Y. Shaw and R. Weissleder, Acc. Chem. Res., 2011, 44, 842–852 CrossRef CAS PubMed.
- T.-H. Chung, C.-C. Hsieh, J.-K. Hsiao, S.-C. Hsu, M. Yao and D.-M. Huang, RSC Adv., 2016, 6, 45553–45561 RSC.
- A. K. Gupta and M. Gupta, Biomaterials, 2005, 26, 3995–4021 CrossRef CAS PubMed.
- J. Filser, D. Arndt, J. Baumann, M. Geppert, S. Hackmann, E. M. Luther, C. Pade, K. Prenzel, H. Wigger, J. Arning, M. C. Hohnholt, J. Köser, A. Kück, E. Lesnikov, J. Neumann, S. Schütrumpf, J. Warrelmann, M. Bäumer, R. Dringen, A. von Gleich, P. Swiderek and J. Thöming, Nanoscale, 2013, 5, 1034–1046 RSC.
- A.-H. Lu, E. L. Salabas and F. Schüth, Angew. Chem., Int. Ed., 2007, 46, 1222–1244 CrossRef CAS PubMed.
- R. Mejías, S. Pérez-Yagüe, L. Gutiérrez, L. I. Cabrera, R. Spada, P. Acedo, C. J. Serna, F. J. Lázaro, Á. Villanueva, M. d. P. Morales and D. F. Barber, Biomaterials, 2011, 32, 2938–2952 CrossRef PubMed.
- C. R. A. Valois, J. M. Braz, E. S. Nunes, M. A. R. Vinolo, E. C. D. Lima, R. Curi, W. M. Kuebler and R. B. Azevedo, Biomaterials, 2010, 31, 366–374 CrossRef CAS PubMed.
- S. Kossatz, R. Ludwig, H. Dähring, V. Ettelt, G. Rimkus, M. Marciello, G. Salas, V. Patel, F. J. Teran and I. Hilger, Pharm. Res., 2014, 31, 3274–3288 CrossRef CAS PubMed.
- S. Kossatz, J. Grandke, P. Couleaud, A. Latorre, A. Aires, K. Crosbie-Staunton, R. Ludwig, H. Dähring, V. Ettelt, A. Lazaro-Carrillo, M. Calero, M. Sader, J. Courty, Y. Volkov, A. Prina-Mello, A. Villanueva, Á. Somoza, A. L. Cortajarena, R. Miranda and I. Hilger, Breast Cancer Res., 2015, 17, 66 CrossRef PubMed.
- M. Sanhaji, J. Göring, P. Couleaud, A. Aires, A. L. Cortajarena, J. Courty, A. Prina-Mello, M. Stapf, R. Ludwig, Y. Volkov, A. Latorre, Á. Somoza, R. Miranda and I. Hilger, Nanomedicine, 2019, 20, 101983 CrossRef CAS PubMed.
- W. Yantasee, C. L. Warner, T. Sangvanich, R. S. Addleman, T. G. Carter, R. J. Wiacek, G. E. Fryxell, C. Timchalk and M. G. Warner, Environ. Sci. Technol., 2007, 41, 5114–5119 CrossRef CAS PubMed.
- A. Iqbal, K. Iqbal, B. Li, D. Gong and W. Qin, J. Nanosci. Nanotechnol., 2017, 17, 4386–4409 CrossRef CAS.
- M. Rivera, W. Zheng, H. V. Aposhian and Q. Fernando, Toxicol. Appl. Pharmacol., 1989, 100, 96–106 CrossRef CAS.
- K. Sompamit, U. Kukongviriyapan, W. Donpunha, S. Nakmareong and V. Kukongviriyapan, Toxicol. Lett., 2010, 198, 77–82 CrossRef CAS PubMed.
- C. Petters, E. Irrsack, M. Koch and R. Dringen, Neurochem. Res., 2014, 39, 1648–1660 CrossRef CAS PubMed.
- H. V Aposhian, Annu. Rev. Pharmacol. Toxicol., 1983, 23, 193–215 CrossRef PubMed.
- H. V Aposhian and M. M. Aposhian, Annu. Rev. Pharmacol. Toxicol., 1990, 30, 279–306 CrossRef PubMed.
- M. E. Sears, Sci. World J., 2013, 2013, 1–13 CrossRef PubMed.
- J. H. Graziano, E. S. Siris, N. Lolacono, S. J. Silverberg and L. Turgeon, Clin. Pharmacol. Ther., 1985, 37, 431–438 CrossRef CAS PubMed.
- J. H. Graziano, Med. Toxicol., 1986, 1, 155–162 CrossRef CAS PubMed.
- M. Geppert, M. C. Hohnholt, K. Thiel, S. Nürnberger, I. Grunwald, K. Rezwan and R. Dringen, Nanotechnology, 2011, 22, 145101 CrossRef PubMed.
- M. Auffan, L. Decome, J. Rose, T. Orsiere, M. De Meo, V. Briois, C. Chaneac, L. Olivi, J. Berge-lefranc, A. Botta, M. R. Wiesner and J. Bottero, Environ. Sci. Technol., 2006, 40, 4367–4373 CrossRef CAS PubMed.
- B. Wang, W. Feng, M. Zhu, Y. Wang, M. Wang, Y. Gu, H. Ouyang, H. Wang, M. Li, Y. Zhao, Z. Chai and H. Wang, J. Nanopart. Res., 2009, 11, 41–53 CrossRef CAS.
- Y.-Q. Zhang, R. Dringen, C. Petters, W. Rastedt, J. Köser, J. Filser and S. Stolte, Environ. Sci.: Nano, 2016, 3, 754–767 RSC.
- E. C. Oliveira-Filho, J. S. Filho, L. A. Novais, W. S. Peternele, R. B. Azevedo and C. K. Grisolia, Environ. Sci. Pollut. Res., 2016, 23, 18362–18368 CrossRef CAS PubMed.
- X. Zhu, S. Tian and Z. Cai, PLoS One, 2012, 7, e46286 CrossRef CAS PubMed.
- S. Laurent, D. Forge, M. Port, A. Roch, C. Robic, L. Vander Elst and R. N. Muller, Chem. Rev., 2010, 110, 2574 CrossRef CAS.
- M. Baalousha, A. Manciulea, S. Cumberland, K. Kendall and J. R. Lead, Environ. Toxicol. Chem., 2008, 27, 1875 CrossRef CAS PubMed.
- M. Baalousha, Sci. Total Environ., 2009, 407, 2093–2101 CrossRef CAS PubMed.
- N. Surugau and P. L. Urban, J. Sep. Sci., 2009, 32, 1889–1906 CrossRef CAS PubMed.
- T. Lana-Villarreal, A. Rodes, J. M. Pérez and R. Gómez, J. Am. Chem. Soc., 2005, 127, 12601–12611 CrossRef CAS PubMed.
- X. H. Ju, Y. Shi, N. Liu, R. C. Guo, B. J. Wang and X. Cui, J. Chromatogr. B: Anal. Technol. Biomed. Life Sci., 2009, 877, 1621–1626 CrossRef CAS PubMed.
- J. J. Knudsen and E. L. McGown, J. Chromatogr. B: Biomed. Sci. Appl., 1988, 424, 231–241 CrossRef CAS.
- S. M. Louie, R. Ma and G. V. Lowry, in Frontiers of Nanoscience, Elsevier Ltd., 1st edn, 2014, vol. 7, pp. 55–87 Search PubMed.
- C. Lei, Y. Sun, D. C. W. Tsang and D. Lin, Environ. Pollut., 2018, 232, 10–30 CrossRef CAS PubMed.
- G. V. Lowry, K. B. Gregory, S. C. Apte and J. R. Lead, Environ. Sci. Technol., 2012, 46, 6893–6899 CrossRef CAS PubMed.
- S. M. Louie, J. M. Gorham, E. A. McGivney, J. Liu, K. B. Gregory and V. A. Hackley, Environ. Sci.: Nano, 2016, 3, 1090–1102 RSC.
- T. L. Kirschling, P. L. Golas, J. M. Unrine, K. Matyjaszewski, K. B. Gregory, G. V. Lowry and R. D. Tilton, Environ. Sci. Technol., 2011, 45, 5253–5259 CrossRef CAS PubMed.
- G. F. White, N. J. Russell and E. C. Tidswell, Microbiol. Rev., 1996, 60, 216–232 CAS.
- J. M. Inacio and I. de Sa-Nogueira, J. Bacteriol., 2008, 190, 4272–4280 CrossRef CAS PubMed.
- F. Kawai, Biosci., Biotechnol., Biochem., 2010, 74, 1743–1759 CrossRef CAS PubMed.
- W. G. Kreyling, A. M. Abdelmonem, Z. Ali, F. Alves, M. Geiser, N. Haberl, R. Hartmann, S. Hirn, D. J. de Aberasturi, K. Kantner, G. Khadem-Saba, J.-M. Montenegro, J. Rejman, T. Rojo, I. R. de Larramendi, R. Ufartes, A. Wenk and W. J. Parak, Nat. Nanotechnol., 2015, 10, 619–623 CrossRef CAS PubMed.
- M. Chanana, P. RiveraGil, M. A. Correa-Duarte, L. M. Liz-Marzán and W. J. Parak, Angew. Chem., Int. Ed., 2013, 52, 4179–4183 CrossRef CAS PubMed.
- M. Auffan, A. Masion, J. Labille, M.-A. Diot, W. Liu, L. Olivi, O. Proux, F. Ziarelli, P. Chaurand, C. Geantet, J.-Y. Bottero and J. Rose, Environ. Pollut., 2014, 188, 1–7 CrossRef CAS PubMed.
- A. Bee, R. Massart and S. Neveu, J. Magn. Magn. Mater., 1995, 149, 6–9 CrossRef CAS.
- M. Geppert, M. Hohnholt, L. Gaetjen, I. Grunwald, M. Bäumer and R. Dringen, J. Biomed. Nanotechnol., 2009, 5, 285–293 CrossRef CAS PubMed.
- J. Riemer, H. H. Hoepken, H. Czerwinska, S. R. Robinson and R. Dringen, Anal. Biochem., 2004, 331, 370–375 CrossRef CAS PubMed.
- OECD, Test No. 301: Ready Biodegradability, OECD Publishing, 1992, vol. 301 Search PubMed.
- J. Aaseth, M. A. Skaug, Y. Cao and O. Andersen, J. Trace Elem. Med. Biol., 2015, 31, 260–266 CrossRef CAS PubMed.
- M. K. Lawson, M. Valko, M. T. D. Cronin and K. Jomová, Curr. Pharmacol. Rep., 2016, 2, 271–280 CrossRef CAS.
- E. S. G. Barron, Z. B. Miller and G. Kalnitsky, Biochem. J., 1947, 41, 62–68 CrossRef CAS PubMed.
- A. Dhakshinamoorthy, M. Alvaro and H. Garcia, Chem. Commun., 2010, 46, 6476 RSC.
- W. Rastedt, K. Thiel and R. Dringen, Biomed. Phys. Eng. Express, 2017, 3, 035007 CrossRef.
- S. M. Louie, R. D. Tilton and G. V. Lowry, Environ. Sci.: Nano, 2016, 3, 283–310 RSC.
- M. Pavlin and V. B. Bregar, Digest Journal of Nanomaterials and Biostructures, 2012, 7, 1389–1400 Search PubMed.
- G. Salas, C. Casado, F. J. Teran, R. Miranda, C. J. Serna and M. P. Morales, J. Mater. Chem., 2012, 22, 21065 RSC.
- US EPA, Estimation Programs Interface Suite™ for Microsoft® Windows, v 4.11, United States Environmental Protection Agency, Washington, DC, USA, 2018 Search PubMed.
- U. Brandt, A. Deters and A. Steinbüchel, Appl. Microbiol. Biotechnol., 2015, 99, 4545–4557 CrossRef CAS PubMed.
- S. J. Klaine, P. J. J. Alvarez, G. E. Batley, T. F. Fernandes, R. D. Handy, D. Y. Lyon, S. Mahendra, M. J. McLaughlin and J. R. Lead, Environ. Toxicol. Chem., 2008, 27, 1825 CrossRef CAS PubMed.
- A. Kumar, A. K. Pandey, S. S. Singh, R. Shanker and A. Dhawan, Chemosphere, 2011, 83, 1124–1132 CrossRef CAS PubMed.
- T. G. A. Lonhienne, E. Sagulenko, R. I. Webb, K.-C. Lee, J. Franke, D. P. Devos, A. Nouwens, B. J. Carroll and J. A. Fuerst, Proc. Natl. Acad. Sci. U. S. A., 2010, 107, 12883–12888 CrossRef CAS PubMed.
- J. A. Fuerst and E. Sagulenko, Biochim. Biophys. Acta, Mol. Cell Res., 2014, 1843, 1732–1738 CrossRef CAS PubMed.
- S. O. Meroueh, K. Z. Bencze, D. Hesek, M. Lee, J. F. Fisher, T. L. Stemmler and S. Mobashery, Proc. Natl. Acad. Sci. U. S. A., 2006, 103, 4404–4409 CrossRef CAS PubMed.
- W. Vollmer, D. Blanot and M. A. De Pedro, FEMS Microbiol. Rev., 2008, 32, 149–167 CrossRef CAS PubMed.
- N. Fauconnier, J. N. Pons, J. Roger and A. Bee, J. Colloid Interface Sci., 1997, 194, 427–433 CrossRef CAS PubMed.
- R. Behra, L. Sigg, M. J. D. Clift, F. Herzog, M. Minghetti, B. Johnston, A. Petri-Fink and B. Rothen-Rutishauser, J. R. Soc., Interface, 2013, 10, 20130396 CrossRef PubMed.
- Z. Li, K. Greden, P. J. J. Alvarez, K. B. Gregory and G. V Lowry, Environ. Sci. Technol., 2010, 44, 3462–3467 CrossRef CAS PubMed.
- C. Su, J. Hazard. Mater., 2017, 322, 48–84 CrossRef CAS PubMed.
- E. Demangeat, M. Pédrot, A. Dia, M. Bouhnik-le-Coz, F. Grasset, K. Hanna, M. Kamagate and F. Cabello-Hurtado, Environ. Sci.: Nano, 2018, 5, 992–1001 RSC.
- L. Mohammed, H. G. Gomaa, D. Ragab and J. Zhu, Particuology, 2017, 30, 1–14 CrossRef CAS.
- G. Cornelis, K. Hund-Rinke, T. Kuhlbusch, N. van den Brink and C. Nickel, Crit. Rev. Environ. Sci. Technol., 2014, 44, 2720–2764 CrossRef CAS.
- S. Loureiro, P. S. Tourinho, G. Cornelis, N. W. Van Den Brink, M. Díez-Ortiz, S. Vázquez-Campos, V. Pomar-Portillo, C. Svendsen and C. A. M. Van Gestel, in Soil Pollution, Elsevier, 2018, pp. 161–190 Search PubMed.
- Statistisches Bundesamt (Destatis), Statistisches Jahrbuch - Deutschland und Internationales, 2017 Search PubMed.
- H. Li, F. Cui, Z. Liu and D. Li, Bioresour. Technol., 2017, 234, 448–455 CrossRef CAS PubMed.
- L. Otero-González, J. A. Field and R. Sierra-Alvarez, Water Res., 2014, 58, 160–168 CrossRef PubMed.
- A. D. Servin and J. C. White, NanoImpact, 2016, 1, 9–12 CrossRef.
Footnote |
| † Electronic supplementary information (ESI) available. See DOI: 10.1039/c9na00236g |
| This journal is © The Royal Society of Chemistry 2019 |