 Open Access Article
Converting bimetallic M (M = Ni, Co, or Fe)–Sn nanoparticles into phosphides: a general strategy for the synthesis of ternary metal phosphide nanocrystals†
Anke
Düttmann
 *a,
Patrick
Bottke
 b,
Thorsten
Plaggenborg
a,
Christian
Gutsche
 a,
Jürgen
Parisi
a,
Martin
Knipper
a,
Jürgen
Parisi
a,
Martin
Knipper
 a and
Joanna
Kolny-Olesiak
 *a
*a
aDepartment of Physics, Carl von Ossietzky University Oldenburg, Carl-von-Ossietzky-Straße 9-11, Oldenburg, 26129, Germany. E-mail: joanna.kolny@uni-oldenburg.de; anke.duettmann@uni-oldenburg.de
bDepartment of Chemistry, Carl von Ossietzky University Oldenburg, Carl-von-Ossietzky-Straße 9-11, Oldenburg, 26129, Germany
First published on 24th May 2019
Abstract
Ternary metal tin phosphides are promising candidates for electrochemical or catalytic applications. Nevertheless, their synthesis, neither as bulk nor nanomaterials is well investigated in the literature. Here, we describe a general synthetic strategy to convert bimetallic M–Sn (M = Ni, Co, and Fe) nanoparticles to ternary metal phosphides by decomposition of tributylphosphine at 300 °C. At high phosphorus concentrations, Ni3Sn4 nanoparticles convert to hybrid structured Ni2SnP and β-Sn. The CoSn2 and FeSn2 nanoparticles undergo a phosphorization, too and form hybrid nanocrystals reported here for the first time, containing ternary or binary phosphides. We identified the crystal structure of the nanoparticles via XRD and HRTEM measurements using the diffraction data given for Ni2SnP in literature. We were able to locate the Ni2SnP and β-Sn crystal structure within the nanoparticles to demonstrate the phase composition of the nanoparticles. By transferring the synthesis to cobalt and iron, we obtained nanoparticles exhibiting similar hybrid structures and ternary element compositions for Co–Sn–P and binary Fe–P and FeSn2 compositions. In the last step, we used the given information to propose a conversion mechanism from the binary M–Sn nanoparticles through phosphorization.
Introduction
Tin-based bimetallic nanoparticles M–Sn (M = Ni, Co, and Fe) are attractive candidates for applications as anode material in lithium-ion batteries,1–5 in electronic devices6 or catalysts for semi-hydrogenation of alkynes7 due to their combined properties of low melting point, stability against oxidation, catalytic properties, and ferromagnetism.8 The synthesis of those materials is challenging itself in terms of size, shape, and composition control. On the other hand, transition metal phosphides M–P apply in catalytic, electronic, and magnetic processes.9–11 Therefore, a combination of tin-based bimetallic materials with phosphorus (M–Sn–P) is highly interesting, at least in three different areas of application such as energy storage, catalysis, and soldering.12–17 The properties of these materials and their performance in the applications mentioned above still need further investigations. This requires developing synthetic methods, allowing for precise control of the morphological parameters and the composition of M–Sn–P particles.The synthesis of nano-sized ternary metal phosphides is limited to a few methods based on a direct reaction between all educts or a two-step synthesis with a phosphorization step coming second. The latter was used in the synthesis of NiCoP nanostructures. They were fabricated by the phosphorization through sodium phosphates of Ni–Co hydroxides on Ti-foil or Ni-foam.18–21 Nickel or cobalt molybdenum phosphides were synthesized in one step with the following calcination procedure using ammonium phosphates.22 The same approach was used by Chu et al. and Yu et al. to get Ni–Cu–P and Fe0.5Co0.5P.23,24 The colloidal synthesis of binary phosphides was achieved by conversion of metallic particles into phosphides via decomposition of alkyl phosphines such as trioctylphosphine or tributylphosphine.25–27 Among ternary metal phosphides containing Sn and Ni, Co or Fe, only the combination of Ni, Sn, and P has been described in the literature. Ternary Ni–Sn–P is known to form Ni-rich compounds, such as Ni2SnP, Ni3SnP, and Ni10SnP3 with decreasing Sn-content at phosphorus richer compositions. The synthesis is based on the one-step synthesis by ball milling techniques13,14,28 or pellet-pressing and annealing procedures using red phosphorus.29 However, no reports about the colloidal synthesis of nickel-tin phosphide nanoparticles have been published, yet, neither is there any information about bulk or nanostructured ternary compounds of Co- or Fe–Sn phosphides.
Here, we present a conversion strategy from tin-based bimetallic nanoparticles to ternary hybrid nanocrystals. First, we introduce the synthesis of monodisperse Ni3Sn4, CoSn2, and FeSn2 nanoparticles. Adding tributylphosphine as phosphorus source into the reaction solution, we achieve a phosphorization of the nanoparticles. We compare the results obtained at two different phosphorus concentrations and characterize the resulting crystal structures and compositions via powder X-ray diffraction (XRD), high-resolution transmission electron microscopy (HRTEM), and energy-dispersive X-ray spectroscopy (EDX) measurements. In the last section of the manuscript, we describe the growth process of the ternary phosphides and discuss the differences between particles containing nickel, cobalt, and iron.
Experimental
Chemicals
Oleylamine (technical grade, 70%), tin chloride SnCl2 (99.99%), iron chloride FeCl2 (99.99%), nickel chloride NiCl2 (98%), tri-butylphosphine (TBP, 93,5%), lithium-bis(trimethylsilyl)amide LiN(SiMe3)2 (97%), toluene (99.8%), diisobutylaluminium hydride in tetrahydrofuran (1 M DIBAH in THF), oleic acid (90%), and chloroform (99.8%) were used as purchased from Sigma Aldrich. Cobalt chloride CoCl2 (97%) was used as purchased from Acros Organics.Synthesis of M–Sn–P nanoparticles
The typical synthesis for ternary M–Sn–P nanoparticles (M = Ni, Co, and Fe) is based on the synthesis of Ni3Sn4 nanoparticles reported before.30 Oleylamine (130 ml) and tin chloride (0.0948 g, 0.5 mmol) were dried at 140 °C under vacuum and argon atmosphere consecutively to provide an oxygen-free surrounding for the reduction. Otherwise oxidation processes can occur, leading to side products. The second metal chloride is dissolved in excess tributylphosphine (TBP, 15 ml, 60 mmol). For Ni–Sn–P nanoparticles 0.375 mmol (48.6 mg) NiCl2 were used to gain a ratio of the metallic ions of Ni![[thin space (1/6-em)]](https://www.rsc.org/images/entities/char_2009.gif) :
:![[thin space (1/6-em)]](https://www.rsc.org/images/entities/char_2009.gif) Sn of 3
Sn of 3![[thin space (1/6-em)]](https://www.rsc.org/images/entities/char_2009.gif) :
:![[thin space (1/6-em)]](https://www.rsc.org/images/entities/char_2009.gif) 4. After injecting the metal salt solution at 160 °C, a freshly prepared solution of 6.3 mmol (1.05 g) LiN(SiMe3)2 in 3 ml toluene is added directly followed by the injection of 2 mmol of the reducing agent DIBAH by now at 150 °C. The solution was held at this temperature for 30 min and afterwards heated up to 300 °C for 8 h. To purify the synthesized nanoparticles, the solution was cooled down and the dispersion was centrifuged with methanol to precipitate the nanoparticles. They were redispersed in a chloroform/oleic acid (40 ml/2 ml) solution for long-term stabilization as oleic acid-capped nanoparticles and washed once with methanol. By centrifugation without precipitation agent, agglomerates can be separated. TEM and X-ray diffraction data of all precipitates are plotted in the ESI Fig. S1–S5.† For synthesis of (Co/Fe)–Sn–P nanoparticles, the amounts of metal chloride were adjusted to 0.25 mmol (33.1 mg) CoCl2 and to 0.5 mmol (63.4 mg) FeCl2. The synthesis was repeated with a decreased amount of TBP to 5 ml (20 mmol) to investigate the influence of the phosphorus concentration.
4. After injecting the metal salt solution at 160 °C, a freshly prepared solution of 6.3 mmol (1.05 g) LiN(SiMe3)2 in 3 ml toluene is added directly followed by the injection of 2 mmol of the reducing agent DIBAH by now at 150 °C. The solution was held at this temperature for 30 min and afterwards heated up to 300 °C for 8 h. To purify the synthesized nanoparticles, the solution was cooled down and the dispersion was centrifuged with methanol to precipitate the nanoparticles. They were redispersed in a chloroform/oleic acid (40 ml/2 ml) solution for long-term stabilization as oleic acid-capped nanoparticles and washed once with methanol. By centrifugation without precipitation agent, agglomerates can be separated. TEM and X-ray diffraction data of all precipitates are plotted in the ESI Fig. S1–S5.† For synthesis of (Co/Fe)–Sn–P nanoparticles, the amounts of metal chloride were adjusted to 0.25 mmol (33.1 mg) CoCl2 and to 0.5 mmol (63.4 mg) FeCl2. The synthesis was repeated with a decreased amount of TBP to 5 ml (20 mmol) to investigate the influence of the phosphorus concentration.
The synthesis of the tin-based bimetallic nanoparticles proceeds analogue to the synthesis of the ternary compounds except for the amount of TBP. The phosphorus source (TBP) was left out, so all metal chlorides were added to the dried oleylamine solution as powders after the tin chloride was dried.
Methods
Results and discussion
In the following, we first present the synthesis of bimetallic M–Sn nanoparticles, obtained without any phosphorus source in the reaction solution. After that, we describe their transformation to ternary phosphides, which takes place in the presence of tributylphosphine, acting as a phosphorus source. In the last part of the manuscript, we discuss the growth mechanism of the ternary phosphide nanocrystals.Characterization of bimetallic M–Sn nanoparticles
In a typical synthesis of bimetallic M–Sn nanoparticles, both metal chlorides were dissolved in oleylamine and reduced at 150 °C by diisobutylaluminium hydride after adding a lithium base to form an oleylamine-metal precursor. Nanoparticle growth is induced via heating up to 300 °C for 8 h. The X-ray diffraction patterns in Fig. 1 show broad diffraction peaks matching the tin-rich phase in the bulk phase diagram, which is Ni3Sn4, CoSn2, and FeSn2, respectively. No additional peaks of other crystalline phases are detected. However, a broad background can be observed at lower diffraction angles (around 31° 2θ) for the Co–Sn and Fe–Sn sample, most likely caused by amorphous tin oxides. It has to be noted that after the synthesis the particles are exposed to air, resulting in the oxidation of the surface layer. The Ni3Sn4 and CoSn2 nanoparticles are almost spherical, while the FeSn2 nanoparticles show some undefined shapes. Independent of their shape, all nanoparticles are single-crystalline with an amorphous oxide shell, as shown in Fig. 2. The Ni–Sn nanoparticles exhibit the thinnest oxide shell among the three kinds of materials, which can be the reason for the low background signal in the corresponding diffraction data. The fast Fourier transformed (FFT) images of the crystalline areas can be indexed to monoclinic Ni3Sn4 (Fig. 2c, ICSD: 04-007-1116), tetragonal CoSn2 (Fig. 2f, ICSD: 03-065-2697), and tetragonal FeSn2 (Fig. 2i, ICSD: 04-003-4677), which is in agreement with the X-ray diffraction data.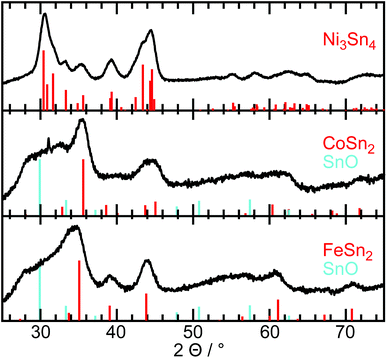 | ||
| Fig. 1 X-ray diffraction data of the M–Sn nanoparticles synthesized without a phosphorus source. The tin oxide patterns symbolize the low crystalline background for the Co–Sn and Fe–Sn sample. | ||
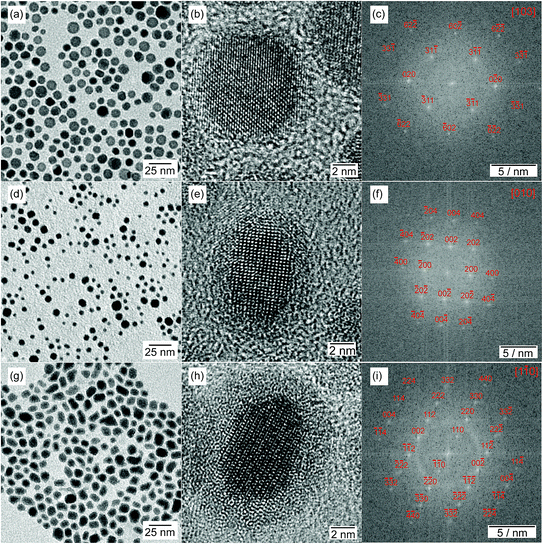 | ||
Fig. 2 TEM and HRTEM images with the corresponding FFT (a–c) for Ni3Sn4 in [103] direction, (d–f) for CoSn2 in [101], and (g–i) for FeSn2 in [![[1 with combining macron]](https://www.rsc.org/images/entities/char_0031_0304.gif) 10]. 10]. | ||
Characterization of Ni–Sn–P nanoparticles
The synthesized Ni–Sn–P nanoparticles are shown in a representative TEM image in Fig. 3a. They are mostly spherical and of uniform size, with a mean particle diameter of 9.8 nm ± 1.8 nm. The majority of the particles exhibits variations of contrast, which can be caused by variations in composition or grain boundaries in polycrystalline particles.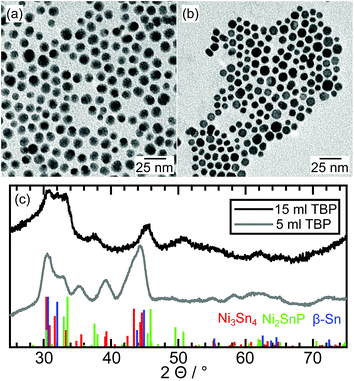 | ||
| Fig. 3 TEM image of an ensemble of Ni–Sn–P nanoparticles after synthesis with (a) 15 ml TBP and (b) 5 ml TBP, and (c) the X-ray diffraction patterns with reference data of Ni3Sn4, Ni2SnP and β-Sn. | ||
The broad peaks in the X-ray diffraction pattern (Fig. 3c, black curve) reveal the presence of relatively small crystallites. The diffraction peaks can be assigned to Ni2SnP (ICSD: 04-010-2577) and β-Sn (AMCSD: 0011248).
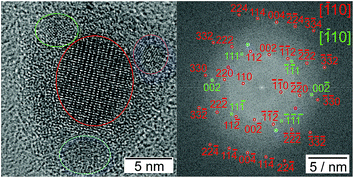
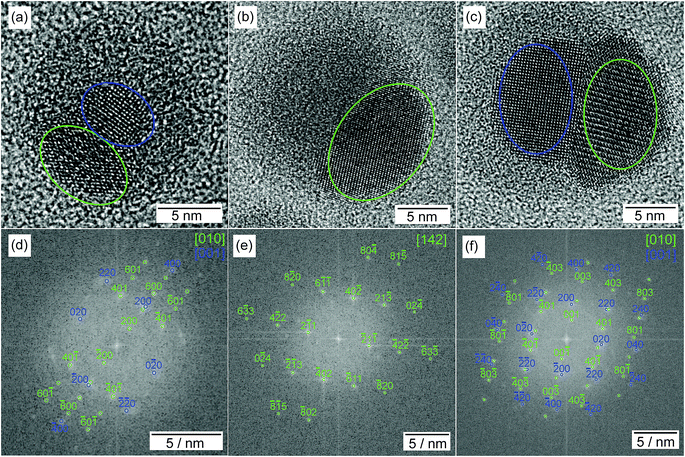
Using HRTEM combined with a Fast Fourier Transformation of the crystalline regions, the crystal structures of the nanoparticles were studied. The predominant part of the sample exhibits hybrid structured nanoparticles, as presented in Fig. 4. One of the two crystallites shows the orthorhombic Ni2SnP crystal structure with β-Sn in epitaxial growth. If the nanoparticle is not optimally oriented to the electron beam, only one of the phases is visible as portrayed in Fig. 4b with the orthorhombic Ni2SnP crystal structure.
The composition of the nanocrystals was investigated by EDX measurements, in particular, that of the nanoparticles observed before with HRTEM. Due to the relatively large spot size of the electron beam of 1.5 nm and the small area of the crystallites, the results of the EDX measurements cannot provide the exact compositions but show clear tendencies matching the crystal structure analysis (Fig. S6 and S7, Table S1 and S2 in ESI†). Nanoparticles identified with the Ni2SnP crystal structure always show a high concentration of all three elements (Ni, P, and Sn). Next to the identified Ni2SnP regions, there always is an Sn-rich region, which can be indexed to the β-Sn crystal structure in case of an orientation of the lattice planes parallel to the electron beam. In all cases, the Sn content is slightly higher compared to the stoichiometry of the detected phases, which is likely caused by the presence of an Sn-rich oxide shell reported before in literature1,31 for M–Sn materials.
In addition to that, no amorphous oxide shell surrounding the P-rich phases can be observed because of the lower oxidation potential of metal phosphides compared to pure metals, which was described before, for example, for nickel phosphides.11
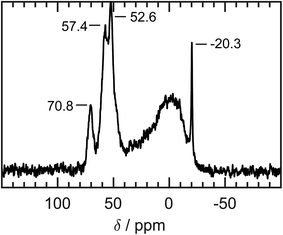
As a complementary measurement to identify the chemical environment of the phosphorus atom, a solid-state high-resolution 31P MAS-NMR measurement was conducted (Fig. 5). The crystallographic structure of Ni2SnP provides the same chemical environment of all phosphorus atoms in an ideal crystal. Here, we deal with hybrid nanoparticles with a high interface to volume ratio. The chemical shifts and the FWHM of the signals can give a first hint of the present relations of phosphorus in this sample. A chemical shift at −20.3 ppm points to remaining tributylphosphine at the surface of the particles. Furthermore, there are three distinguishable signals at 70.8 ppm, 57.4 ppm, and 52.6 ppm. The location and broad FWHM of these signals indicate low mobility of the phosphorus atoms compared to the highly mobile tributylphosphine at the nanoparticles' surface. The chemical shift to more positive values indicates the paramagnetic influence of the nickel atoms. A broad signal around 3 ppm refers to a different chemical environment for phosphorus atoms without the paramagnetic influence of nickel atoms but maybe due to the presence of oxygen. Up to this point, the exact identification of the NMR signals is still uncertain and needs further investigations, but backs up the assumption of phosphorus atoms integrated into the crystal structure.
Overall, the monoclinic Ni3Sn4 nanoparticles could be transformed to hybrid-structured nanoparticles with a tetragonal Ni2SnP and β-Sn phase by including a large excess of a phosphorus source (15 ml TBP) in the solution.
In the next step, we reduced the concentration of tributylphosphine to one-third (5 ml TBP) to investigate the possibility of the formation of the ternary phosphides at a lower excess of the phosphorus source.
The synthesized nanoparticles differ in appearance from the ones synthesized with a high phosphorus concentration. Contrast differences within one nanoparticle, which were an indication for the formation of hybrid nanostructures, are missing. Both the X-ray diffraction data (grey curve in Fig. 3c) and the TEM image (Fig. 3b) resemble that of bimetallic particles synthesized without TBP. The nanoparticles crystallize in the Ni3Sn4 structure with no additional reflections. However, HRTEM measurements combined with EDX measurements reveal the incorporation of phosphorus into some of the particles. Unfortunately, the sample is not uniform in terms of composition, even though, all particles exhibit the same Ni3Sn4 crystal structure (Fig. S8†). In some of the Ni3Sn4 nanoparticles, phosphorus is not detectable by EDX. However, also nanoparticles with up to 20% phosphorus are present in the sample. In the latter case, the tin content is distinctly lower. XPS measurements (Fig. S11†) do not show any signal in the range of the P 2p orbital (130 eV). Therefore, phosphorus atoms are preferably located in the crystalline core and not near the surface of the nanoparticle.
Thus, ternary phosphides can be formed from Ni3Sn4 nanoparticles, without changing the crystal lattice, if the fraction of phosphorus is relatively small, while Sn–Ni2SnP hybrid nanocrystals are obtained at high phosphorus concentration.
Characterization of Co–Sn–P nanoparticles
The synthesized Co–Sn–P nanoparticles are shown in Fig. 6a. They have a mean diameter of 12.6 nm ± 2.1 nm and reveal contrast differences within one nanoparticle comparable to the Ni–Sn–P nanoparticles. The X-ray diffraction data are plotted in Fig. 6c (black curve) and exhibit mainly two broad diffraction peaks at 34.6° 2θ and 46.1° 2θ. There is no sign left of the tetragonal CoSn2 crystal structure, which was the phase obtained without the phosphorus source. Furthermore, no diffraction peak can be indexed to any Co–Sn phase or a cobalt or tin phosphide. Without identifying the new phase on hand, it can be concluded, that a phase transformation took place. To the best of our knowledge, there is no diffraction data in the literature of any ternary Co–Sn–P compound. So, in contrast to the Ni–Sn–P nanoparticles, no reference data for the identification of the structure of the particles in the HRTEM images could be used.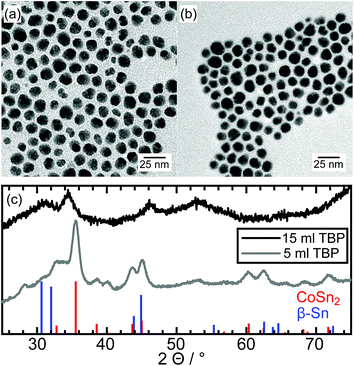 | ||
| Fig. 6 TEM image of an ensemble of Co–Sn–P nanoparticles after synthesis with (a) 15 ml TBP and (b) 5 ml TBP, and (c) the X-ray diffraction patterns with reference data of CoSn2 and β-Sn. | ||
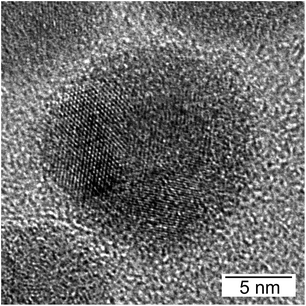
The HRTEM images reveal the polycrystalline nature of the nanoparticles. In most cases, two or three crystallites are visible at the same time. The oxide shell surrounding the crystallites is thinner than for the CoSn2 nanoparticles synthesized without TBP. This points to higher stability against oxidation, which could be observed before for the Ni2SnP crystallites. An exemplary Co–Sn–P nanoparticle is presented in Fig. 7. We compared the element composition via point-EDX measurements of the crystalline regions within the nanoparticles. All measurements show a reproducible element ratio of P![[thin space (1/6-em)]](https://www.rsc.org/images/entities/char_2009.gif) :
:![[thin space (1/6-em)]](https://www.rsc.org/images/entities/char_2009.gif) Co
Co![[thin space (1/6-em)]](https://www.rsc.org/images/entities/char_2009.gif) :
:![[thin space (1/6-em)]](https://www.rsc.org/images/entities/char_2009.gif) Sn = 1
Sn = 1![[thin space (1/6-em)]](https://www.rsc.org/images/entities/char_2009.gif) :
:![[thin space (1/6-em)]](https://www.rsc.org/images/entities/char_2009.gif) 1
1![[thin space (1/6-em)]](https://www.rsc.org/images/entities/char_2009.gif) :
:![[thin space (1/6-em)]](https://www.rsc.org/images/entities/char_2009.gif) 1. Next to these crystallites, we find amorphous looking regions. Here, the element composition fluctuates but shows a clear tendency to Sn-rich composition with low P concentration. The correlation of an Sn-rich region next to the P-rich phases was observed in the same manner for the Ni–Sn–P nanoparticles.
1. Next to these crystallites, we find amorphous looking regions. Here, the element composition fluctuates but shows a clear tendency to Sn-rich composition with low P concentration. The correlation of an Sn-rich region next to the P-rich phases was observed in the same manner for the Ni–Sn–P nanoparticles.
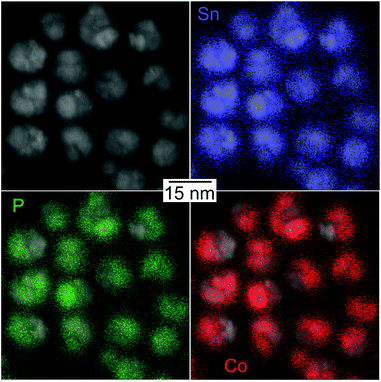
In contrast to the Ni–Sn–P sample, the Sn-rich regions still contain some phosphorus, which could be the reason why none of these regions can be identified as tetragonal β-Sn. However, both samples have in common that, the formation of ternary phosphide is accompanied by the generation of tin-rich regions in the particle. The element distribution of Sn, Co, and P for an ensemble of nanoparticles is presented in Fig. 8. Each nanocrystal comprises of two different regions. The first one contains Sn, Co, and P indicating the formation of a ternary compound with a 1![[thin space (1/6-em)]](https://www.rsc.org/images/entities/char_2009.gif) :
:![[thin space (1/6-em)]](https://www.rsc.org/images/entities/char_2009.gif) 1
1![[thin space (1/6-em)]](https://www.rsc.org/images/entities/char_2009.gif) :
:![[thin space (1/6-em)]](https://www.rsc.org/images/entities/char_2009.gif) 1 stoichiometry. The second, smaller part of the particle, is tin-rich, and only traces of the other two elements are detectable by EDX. Overall, the particles retain their original cobalt tin ratio of 1
1 stoichiometry. The second, smaller part of the particle, is tin-rich, and only traces of the other two elements are detectable by EDX. Overall, the particles retain their original cobalt tin ratio of 1![[thin space (1/6-em)]](https://www.rsc.org/images/entities/char_2009.gif) :
:![[thin space (1/6-em)]](https://www.rsc.org/images/entities/char_2009.gif) 2, indicating a conversion from uniform CoSn2 to a CoSnP–Sn hybrid nanostructure by partial phosphorization and reorganization of the original particle.
2, indicating a conversion from uniform CoSn2 to a CoSnP–Sn hybrid nanostructure by partial phosphorization and reorganization of the original particle.
Comparable to the Ni–Sn–P synthesis, larger nanoparticles could be separated from the product with diameters of several hundreds of nanometers, accompanied by smaller crystallites in the size range of several nanometers (Fig. S3†). The X-ray diffraction pattern shows diffraction peaks matching large β-Sn crystallites and a second unidentified crystal structure with substantially broadened reflections. The peak positions of this unknown phase correspond with the unidentified diffraction peaks of the small nanoparticles in (Fig. 6c) and are summarized in Table S3.† The low number of diffraction peaks points to a highly symmetric crystal structure. No additional crystalline Co–Sn phase is observed. As discussed below, we assume an initial formation of CoSn2 crystals with the following phosphorization. Consequently, the fact no diffraction peak matches CoSn2 indicates a complete phase transformation to the ternary phosphide and an additional Sn-rich phase.
The formation of ternary Co–Sn–P nanoparticles was also studied with the amount of TBP reduced to 5 ml. A representative TEM image is shown in Fig. 6b, revealing variations of contrast within the particles, indicating the formation of hybrid nanostructures. However, the X-ray diffraction data plotted in Fig. 6c (grey curve) can be assigned to the CoSn2-structure. The presence of a small fraction of the β-Sn phase cannot be excluded because of the substantial broadening of the reflections. At approximately 34° 2θ, a plateau indicates an additional diffraction signal matching the unknown diffraction peak belonging to the ternary Co–Sn–P structure.
Analogue to the Ni–Sn–P sample synthesized with 5 ml TBP, the particles in this sample do not have a uniform composition. Point EDX measurements reveal the variation of the Co, Sn, and P content in different nanoparticles. Representative to the sample, there are three nanoparticles presented in Fig. S9.† One fraction of the sample exists of CoSn2 nanoparticles with a P concentration of less than 10%. These nanoparticles still crystallize in the tetragonal CoSn2 crystal structure. The oxide shell surrounding the crystallite is comparable to the one in Fig. 2e. The second group of this sample already consists of a P concentration of up to 30% and is polycrystalline. These particles either are binary CoSn2 crystallites with intercalated P or already exhibit the ternary Co–Sn–P compound combined with CoSn2 crystallites. XPS measurements (Fig. S11†) of the P 2p range reveal two signals at 133 eV and 129 eV, which originate from phosphate groups at the surface and metal phosphide in the crystalline core of the nanoparticle.32,33 The binding energy of the phosphidic species is lower than of elemental phosphorus (130 eV), indicating a higher electron density, caused by electron transfer from the metals.
Characterization of Fe–Sn–P nanoparticles
The Fe–Sn–P nanoparticles synthesized with 15 ml TBP are shown in Fig. 9a and have a mean particle diameter of 15.1 nm ± 3.1 nm. Contrast differences appear similar to the previous samples and indicate the formation of hybrid nanostructures. The X-ray diffraction data in Fig. 9c (black curve) reveal diffraction peaks matching the β-Sn and a binary Fe2P (COD: 1011335) crystal structure. Calculations of the crystallite size by the Scherrer equation using the FWHM of the diffraction peaks lead to about 9.5 nm crystallites for the β-Sn phase and about 5.5 nm for the Fe2P phase. This difference is due to agglomerated nanoparticles, such as the one shown in Fig. S10.† In addition to that, there is a broad background at 31° 2θ, which is similar to diffraction signals resulting from amorphous metal oxides, for example, SnOx (ref. 34) and small β-Sn crystallites. Diffraction peaks matching the FeSn2 crystal structure are barely visible indicating the presence of only a small fraction of this phase in the sample. No additional peaks indicating the formation of a ternary Fe–Sn–P phase are detected. This is the first hint of different phase composition in contrast to the Ni- and Co- containing samples.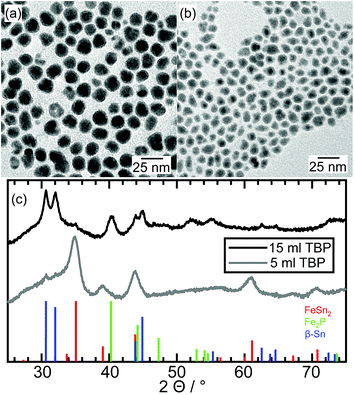 | ||
| Fig. 9 TEM image of an ensemble of Fe–Sn–P nanoparticles after synthesis with (a) 15 ml TBP and (b) 5 ml TBP and (c) the X-ray diffraction patterns with reference data of FeSn2, Fe2P, and β-Sn. | ||
HRTEM images show highly polycrystalline nanoparticles (Fig. 10). Some of them can be assigned to FeSn2 and Fe2P (Fig. 10a), or FeP (Fig. 10b); for others, such as the one shown in Fig. 10c, no reliable phase identification is possible because of the low number of lattice planes belonging to one crystallite. The phase composition measured by HRTEM-EDX shows a high P and Fe concentration with low Sn concentration for the crystalline regions indexed to the Fe–P crystal structures. In the outer regions of the nanoparticle, the Sn concentration increases, because of the Sn-rich oxide shell. A high Sn concentration within the nanoparticle appears in the space between the crystalline iron phosphides or at overlapping β-Sn crystallites. The element distribution within one nanoparticle is pictured in Fig. 11 by EDX mapping measurements. Two kinds of regions can be distinguished within the particle: the first one is tin-rich, the other contains phosphorus and iron. A small fraction of tin found in the second region originates from the tin oxide shell covering the particles. Thus, the reaction of FeSn2 nanoparticles with TBP does not yield ternary Fe–Sn–P phases but a combination of binary iron phosphide and tin-rich regions. In contrast to the phosphorization of CoSn2 particles, the original Fe![[thin space (1/6-em)]](https://www.rsc.org/images/entities/char_2009.gif) :
:![[thin space (1/6-em)]](https://www.rsc.org/images/entities/char_2009.gif) Sn ratio of 1
Sn ratio of 1![[thin space (1/6-em)]](https://www.rsc.org/images/entities/char_2009.gif) :
:![[thin space (1/6-em)]](https://www.rsc.org/images/entities/char_2009.gif) 2 is not maintained, the overall composition of the resulting particles is Fe
2 is not maintained, the overall composition of the resulting particles is Fe![[thin space (1/6-em)]](https://www.rsc.org/images/entities/char_2009.gif) :
:![[thin space (1/6-em)]](https://www.rsc.org/images/entities/char_2009.gif) Sn
Sn![[thin space (1/6-em)]](https://www.rsc.org/images/entities/char_2009.gif) :
:![[thin space (1/6-em)]](https://www.rsc.org/images/entities/char_2009.gif) P 1
P 1![[thin space (1/6-em)]](https://www.rsc.org/images/entities/char_2009.gif) :
:![[thin space (1/6-em)]](https://www.rsc.org/images/entities/char_2009.gif) 1
1![[thin space (1/6-em)]](https://www.rsc.org/images/entities/char_2009.gif) :
:![[thin space (1/6-em)]](https://www.rsc.org/images/entities/char_2009.gif) 1. Thus, tin is released from the particles during the phosphorization process.
1. Thus, tin is released from the particles during the phosphorization process.
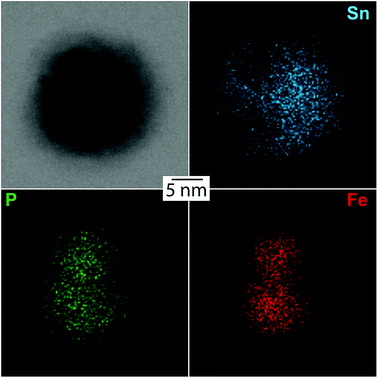 | ||
| Fig. 11 EDX mapping of an Fe–Sn–P nanoparticle visualizing the element distributions of Sn, P, and Fe. | ||
Ternary phosphides were also not formed when the amount of TBP is reduced to 5 ml (Fig. 9b), but the XP spectrum of P 2p exhibits the same XP signals as for the analogue Co–Sn sample (Fig. S11†). A phosphate signal (133 eV) and a metallic phosphide signal (129 eV) are present, which demonstrates the formation of a binary Fe–P structure. The X-ray diffraction pattern is dominated by the diffraction signals resulting from the FeSn2 crystal structure, and no other crystalline phases are detectable. X-ray diffraction is a volume-weighted measurement, so it is not surprising, that small Fe–P phases detected within one nanoparticle, for example, in Fig. 12, do not show visible diffraction signals. Here again, P is localized in Fe-rich regions, indicating the beginning of phase segregation already at low P concentrations.
Thus, despite using FeSn2 particles, with a uniform distribution of both metals, in the reaction with the phosphorus source, no ternary Fe–Sn–P particles could be formed, but polycrystalline structures, containing iron phosphide and tin-rich regions were generated.
Growth mechanism of ternary metal–tin-phosphides
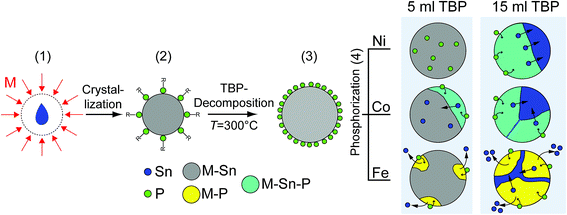
Using the information given by the characterization of the syntheses, we conclude a four-step mechanism described schematically in Fig. 13 for the formation of ternary metal–tin phosphides. The first step takes place at a low temperature of 150 °C. M–Sn nanoparticles are formed by a monomer diffusion of M and Sn into stable liquid Sn nanodroplets, which form first (1).30 The nanoparticles are stabilized by oleylamine and over the phosphorus group of TBP (2). Information about the nanoparticles at this stage of the synthesis can be found in Fig. S11 and S12 in the ESI.† At 300 °C, TBP decomposes, likely supported by the catalytic effect of metallic components to decrease the binding energy between phosphorus and carbon (3).25,35–37 Over time, phosphorus diffuses into the M–Sn crystal (4). For all three metals, phosphides containing less tin than the original bimetallic nanoparticles accompanied by tin-rich regions are formed during this step. However, the detailed composition and morphology of the final product depend on the metal component (Ni, Co, or Fe) and the total amount of phosphorus in the solution.Low amounts of phosphorus can be incorporated into the Ni3Sn4 nanoparticles without changing their crystallographic structure. Increasing the phosphorus concentration in the particles leads to the conversion from uniform, monoclinic Ni3Sn4 structure to hybrid nanoparticles of orthorhombic Ni2SnP and tetragonal β-Sn. The resulting phosphide phase contains less tin, compared to the initial intermetallic Ni3Sn4 nanocrystals; however, the tin excess remains in the particle, and hybrid nanocrystals are generated in this way.
Phosphorization of the CoSn2 crystal structure leads to the formation of ternary Co–Sn–P compounds already with low amounts of TBP (5 ml). Ternary phosphides with relatively low phosphorus concentrations start growing at different places near the surface of the CoSn2. As a result, polycrystalline nanoparticles are formed, still exhibiting the CoSn2 crystal structure.
In the case of higher phosphorus concentrations (15 ml TBP in the reaction solution), the CoSn2 crystal structure fully converts into a new Co–Sn–P phase with the stoichiometry of 1![[thin space (1/6-em)]](https://www.rsc.org/images/entities/char_2009.gif) :
:![[thin space (1/6-em)]](https://www.rsc.org/images/entities/char_2009.gif) 1
1![[thin space (1/6-em)]](https://www.rsc.org/images/entities/char_2009.gif) :
:![[thin space (1/6-em)]](https://www.rsc.org/images/entities/char_2009.gif) 1 and an additional Sn-rich region. In analogy to the Ni-containing sample, the Co
1 and an additional Sn-rich region. In analogy to the Ni-containing sample, the Co![[thin space (1/6-em)]](https://www.rsc.org/images/entities/char_2009.gif) :
:![[thin space (1/6-em)]](https://www.rsc.org/images/entities/char_2009.gif) Sn ratio is higher in the ternary phosphide, compared to the original CoSn2 particles, but is retained in the overall composition of the hybrid nanostructure. Thus, tin atoms are displaced from CoSn2 during the phosphorization process but remain in the particles as an additional tin-rich phase.
Sn ratio is higher in the ternary phosphide, compared to the original CoSn2 particles, but is retained in the overall composition of the hybrid nanostructure. Thus, tin atoms are displaced from CoSn2 during the phosphorization process but remain in the particles as an additional tin-rich phase.
In contrast to the results described for Ni3Sn4 and CoSn2, during phosphorization of the FeSn2 sample, a small fraction of phosphorus suffices to induce nucleation of iron phosphides at the nanoparticle surface. These regions consisting of binary iron phosphides grow larger at a higher phosphorus concentration, while some of the Sn exits the nanoparticle and forms Sn agglomerates, such as the one in Fig. S10 in the ESI.† Finally, no FeSn2 crystallites are left and polycrystalline nanocrystals composed of several iron phosphide domains and tin-rich regions are formed.
Conclusion
In this work, we showed the conversion of bimetallic M–Sn nanoparticles into phosphides by adding tributylphosphine to the reaction solution. We could separate the formation of bimetallic seeds from the further phosphorization step, by starting the synthesis at a relatively low temperature of 150 °C, sufficient for the nucleation of the M–Sn compounds, followed by prolonged heating the reaction solution at 300 °C. Increasing the temperature affects the decomposition of TBP; as a result, TBP decomposes in the presence of bimetallic nanoparticles and P diffuses into the nanoparticles after their formation. We were able to synthesize nanocrystalline Ni2SnP particles in colloidal solution for the first time and characterized them by XRD, HRTEM, and EDX measurements. In addition to that, we showed that also Co forms a ternary compound with Sn and P in a stoichiometric ratio of Co![[thin space (1/6-em)]](https://www.rsc.org/images/entities/char_2009.gif) :
:![[thin space (1/6-em)]](https://www.rsc.org/images/entities/char_2009.gif) Sn
Sn![[thin space (1/6-em)]](https://www.rsc.org/images/entities/char_2009.gif) :
:![[thin space (1/6-em)]](https://www.rsc.org/images/entities/char_2009.gif) P = 1
P = 1![[thin space (1/6-em)]](https://www.rsc.org/images/entities/char_2009.gif) :
:![[thin space (1/6-em)]](https://www.rsc.org/images/entities/char_2009.gif) 1
1![[thin space (1/6-em)]](https://www.rsc.org/images/entities/char_2009.gif) :
:![[thin space (1/6-em)]](https://www.rsc.org/images/entities/char_2009.gif) 1. During the phosphorization of FeSn2 nanocrystals, no ternary Fe–Sn–P but binary FeP and Fe2P phases were formed, and some of the tin atoms left the nanoparticles and agglomerated into β-Sn crystallites.
1. During the phosphorization of FeSn2 nanocrystals, no ternary Fe–Sn–P but binary FeP and Fe2P phases were formed, and some of the tin atoms left the nanoparticles and agglomerated into β-Sn crystallites.
In all three cases, the formation of the binary and ternary phosphides is accompanied by a displacement of tin atoms from the original bimetallic crystal structure, resulting in the generation of a hybrid structure. The M–Sn–P phases obtained in these reactions have a higher M![[thin space (1/6-em)]](https://www.rsc.org/images/entities/char_2009.gif) :
:![[thin space (1/6-em)]](https://www.rsc.org/images/entities/char_2009.gif) Sn ratio, compared to the original bimetallic particles. Therefore, the fraction of the binary or ternary phosphide in the final nanostructures is limited by the fraction of M in the initial bimetallic M–Sn phase. Thus, to synthesize pure ternary phosphides, M-richer M–Sn nanoparticles should be used in the phosphorization reaction, such as Ni3Sn2 or Co3Sn2.
Sn ratio, compared to the original bimetallic particles. Therefore, the fraction of the binary or ternary phosphide in the final nanostructures is limited by the fraction of M in the initial bimetallic M–Sn phase. Thus, to synthesize pure ternary phosphides, M-richer M–Sn nanoparticles should be used in the phosphorization reaction, such as Ni3Sn2 or Co3Sn2.
Further experimental and theoretical studies will be needed to synthesize monocrystalline ternary tin-based phosphides and to identify the crystal structure of the ternary Co–Sn–P compound obtained here.
Conflicts of interest
There are no conflicts to declare.Acknowledgements
This work was funded by the Deutsche Forschungsgesellschaft (KN 1210/1-1). Furthermore, we gratefully acknowledge funding of the “EWE Nachwuchsgruppe Dünnschichtphotovoltaik” of the EWE AG, Oldenburg, Germany and we thank the Deutsche Forschungsgemeinschaft for the financial support of the NMR equipment (DFG GZ: INST 184/155-1 FUGG). The funding for HRTEM by the DFG (INST 184/106-1 FUGG) is acknowledged. The authors thank M. Macke for technical support, Erhard Rhiel and Ute Friedrich for HRTEM support and Daniel Friesen for preparing the Co–Sn sample with 5 ml TBP.References
- X.-L. Wang, W.-Q. Han, J. Chen and J. Graetz, Single-Crystal Intermetallic M–Sn (M = Fe, Cu, Co, Ni) Nanospheres as Negative Electrodes for Lithium-Ion Batteries, ACS Appl. Mater. Interfaces, 2010, 2(5), 1548–1551, DOI:10.1021/am100218v.
- G. Schmuelling, N. Oehl, O. Fromm, M. Knipper, J. Kolny-Olesiak, T. Plaggenborg, J. Parisi, M. Winter and T. Placke, Synthesis and Electrochemical Characterization of Nano-Sized Ag4Sn Particles as Anode Material for Lithium-Ion Batteries, Electrochim. Acta, 2016, 196, 597–602, DOI:10.1016/j.electacta.2016.03.019.
- Q. Dong, Preparation and Performance of Nickel–Tin Alloys Used as Anodes for Lithium-Ion Battery, Solid State Ionics, 2004, 167(1–2), 49–54, DOI:10.1016/j.ssi.2004.01.007.
- M. Chamas, A. Mahmoud, J. Tang, M. T. Sougrati, S. Panero and P.-E. Lippens, Aging Processes in Lithiated FeSn2 Based Negative Electrode for Li-Ion Batteries: A New Challenge for Tin Based Intermetallic Materials, J. Phys. Chem. C, 2017, 121(1), 217–224, DOI:10.1021/acs.jpcc.6b11302.
- J. Zhang and Y. Xia, Co–Sn Alloys as Negative Electrode Materials for Rechargeable Lithium Batteries, J. Electrochem. Soc., 2006, 153(8), A1466–A1471, DOI:10.1149/1.2204871.
- H. P. R. Frederikse, R. J. Fields and A. Feldman, Thermal and Electrical Properties of Copper-tin and Nickel-tin Intermetallics, J. Appl. Phys., 1992, 72(7), 2879–2882, DOI:10.1063/1.351487.
- Y. Liu, X. Liu, Q. Feng, D. He, L. Zhang, C. Lian, R. Shen, G. Zhao, Y. Ji and D. Wang, et al. Intermetallic NixMy (M = Ga and Sn) Nanocrystals: A Non-Precious Metal Catalyst for Semi-Hydrogenation of Alkynes, Adv. Mater., 2016, 28(23), 4747–4754, DOI:10.1002/adma.201600603.
- X.-L. Wang, M. Feygenson, H. Chen, C.-H. Lin, W. Ku, J. Bai, M. C. Aronson, T. A. Tyson and W.-Q. Han, Nanospheres of a New Intermetallic FeSn5 Phase: Synthesis, Magnetic Properties and Anode Performance in Li-Ion Batteries, J. Am. Chem. Soc., 2011, 133(29), 11213–11219, DOI:10.1021/ja202243j.
- S. L. Brock, S. C. Perera and K. L. Stamm, Chemical Routes for Production of Transition-Metal Phosphides on the Nanoscale: Implications for Advanced Magnetic and Catalytic Materials, Chem.–Eur. J., 2004, 10(14), 3364–3371, DOI:10.1002/chem.200305775.
- J. F. Callejas, C. G. Read, C. W. Roske, N. S. Lewis and R. E. Schaak, Synthesis, Characterization, and Properties of Metal Phosphide Catalysts for the Hydrogen-Evolution Reaction, Chem. Mater., 2016, 28(17), 6017–6044, DOI:10.1021/acs.chemmater.6b02148.
- S. Motojima, T. Wakamatsu and K. Sugiyama, Corrosion Stability of Vapour-Deposited Transition Metal Phosphides at High Temperature, J. Less-Common Met., 1981, 82, 379–383, DOI:10.1016/0022-5088(81)90257-5.
- J. Yu, Q. Li, Y. Li, C.-Y. Xu, L. Zhen, V. P. Dravid and J. Wu, Ternary Metal Phosphide with Triple-Layered Structure as a Low-Cost and Efficient Electrocatalyst for Bifunctional Water Splitting, Adv. Funct. Mater., 2016, 26(42), 7644–7651, DOI:10.1002/adfm.201603727.
- C. Marino, N. Dupré and C. Villevieille, Elucidation of Reaction Mechanisms of Ni2SnP in Li-Ion and Na-Ion Systems, J. Power Sources, 2017, 365, 339–347, DOI:10.1016/j.jpowsour.2017.08.096.
- Z. P. Xia, Y. Lin and Z. Q. Li, A New Phase in Ni–Sn–P System and Its Property as an Anode Material for Lithium-Ion Batteries, Mater. Charact., 2008, 59(9), 1324–1328, DOI:10.1016/j.matchar.2007.11.004.
- D. Lan, W. Wang and Q. Li, Cu4SnP10 as a Promising Anode Material for Sodium Ion Batteries, Nano Energy, 2017, 39, 506–512, DOI:10.1016/j.nanoen.2017.07.026.
- Y. Tian and P. Wu, First-Principles Study of Structural, Elastic and Thermodynamic Properties of Ni–Sn–P Intermetallics, J. Mater. Res., 2017, 32(3), 512–521, DOI:10.1557/jmr.2016.497.
- A. Kumar, Z. Chen, S. G. Mhaisalkar, C. C. Wong, P. S. Teo and V. Kripesh, Effect of Ni–P Thickness on Solid-State Interfacial Reactions between Sn–3.5Ag Solder and Electroless Ni–P Metallization on Cu Substrate, Thin Solid Films, 2006, 504(1), 410–415, DOI:10.1016/j.tsf.2005.09.059.
- A. M. Pornea, M. W. Abebe and H. Kim, Ternary NiCoP Urchin like 3D Nanostructure Supported on Nickel Foam as a Catalyst for Hydrogen Generation of Alkaline NaBH4, Chem. Phys., 2019, 516, 152–159, DOI:10.1016/j.chemphys.2018.08.044.
- H. Liang, A. N. Gandi, D. H. Anjum, X. Wang, U. Schwingenschlögl and H. N. Alshareef, Plasma-Assisted Synthesis of NiCoP for Efficient Overall Water Splitting, Nano Lett., 2016, 16(12), 7718–7725, DOI:10.1021/acs.nanolett.6b03803.
- X. Zhang, A. Wu, X. Wang, C. Tian, R. An and H. Fu, Porous NiCoP Nanosheets as Efficient and Stable Positive Electrodes for Advanced Asymmetric Supercapacitors, J. Mater. Chem. A, 2018, 6(37), 17905–17914, 10.1039/c8ta05551c.
- R. Zhang, X. Wang, S. Yu, T. Wen, X. Zhu, F. Yang, X. Sun, X. Wang and W. Hu, Ternary NiCo2Px Nanowires as PH-Universal Electrocatalysts for Highly Efficient Hydrogen Evolution Reaction, Adv. Mater., 2017, 29(9), 1605502, DOI:10.1002/adma.201605502.
- C. Stinner, R. Prins and T. Weber, Binary and Ternary Transition-Metal Phosphides as HDN Catalysts, J. Catal., 2001, 202(1), 187–194, DOI:10.1006/jcat.2001.3283.
- S. Chu, W. Chen, G. Chen, J. Huang, R. Zhang, C. Song, X. Wang, C. Li and K. Ostrikov, Holey Ni–Cu Phosphide Nanosheets as a Highly Efficient and Stable Electrocatalyst for Hydrogen Evolution, Appl. Catal., B, 2019, 243, 537–545, DOI:10.1016/j.apcatb.2018.10.063.
- C. Tang, L. Gan, R. Zhang, W. Lu, X. Jiang, A. M. Asiri, X. Sun, J. Wang and L. Chen, Ternary FexCo1−XP Nanowire Array as a Robust Hydrogen Evolution Reaction Electrocatalyst with Pt-like Activity: Experimental and Theoretical Insight, Nano Lett., 2016, 16(10), 6617–6621, DOI:10.1021/acs.nanolett.6b03332.
- A. E. Henkes and R. E. Schaak, Trioctylphosphine:
![[thin space (1/6-em)]](https://www.rsc.org/images/entities/char_2009.gif) A General Phosphorus Source for the Low-Temperature Conversion of Metals into Metal Phosphides, Chem. Mater., 2007, 19(17), 4234–4242, DOI:10.1021/cm071021w.
A General Phosphorus Source for the Low-Temperature Conversion of Metals into Metal Phosphides, Chem. Mater., 2007, 19(17), 4234–4242, DOI:10.1021/cm071021w. - N. Zhang, A. Shan, R. Wang and C. Chen, Co2P Nanostructures by Thermal Decomposition: Phase Formation and Magnetic Properties, CrystEngComm, 2012, 14(4), 1197–1200, 10.1039/c2ce06333f.
- A. E. Henkes, Y. Vasquez and R. E. Schaak, Converting Metals into Phosphides: A General Strategy for the Synthesis of Metal Phosphide Nanocrystals, J. Am. Chem. Soc., 2007, 129(7), 1896–1897, DOI:10.1021/ja068502l.
- C. Schmetterer, M. Wildner, G. Giester, K. W. Richter and H. Ipser, The Crystal Structure of Ni21Sn2P6, Z. Anorg. Allg. Chem., 2009, 635(2), 301–306, DOI:10.1002/zaac.200800409.
- C. Schmetterer, J. Vizdal, A. Kroupa, A. Kodentsov and H. Ipser, The Ni-Rich Part of the Ni–P–Sn System: Isothermal Sections, J. Electron. Mater., 2009, 38(11), 2275–2300, DOI:10.1007/s11664-009-0854-8.
- A. Düttmann, C. Gutsche, M. Knipper, J. Parisi and J. Kolny-Olesiak, Detailed Characterization of the Surface and Growth Mechanism of Monodisperse Ni3Sn4 Nanoparticles, ACS Omega, 2018, 3(12), 16924–16933, DOI:10.1021/acsomega.8b02597.
- N. H. Chou and R. E. Schaak, A Library of Single-Crystal Metal–Tin Nanorods: Using Diffusion as a Tool for Controlling the Morphology of Intermetallic Nanocrystals, Chem. Mater., 2008, 20(6), 2081–2085, DOI:10.1021/cm703640u.
- S. Carenco, Z. Liu and M. Salmeron, The Birth of Nickel Phosphide Catalysts: Monitoring Phosphorus Insertion into Nickel, ChemCatChem, 2017, 9(12), 2318–2323, DOI:10.1002/cctc.201601526.
- V. Tallapally, R. J. A. Esteves, L. Nahar and I. U. Arachchige, Multivariate Synthesis of Tin Phosphide Nanoparticles: Temperature, Time, and Ligand Control of Size, Shape, and Crystal Structure, Chem. Mater., 2016, 28(15), 5406–5414, DOI:10.1021/acs.chemmater.6b01749.
- N. Oehl, G. Schmuelling, M. Knipper, R. Kloepsch, T. Placke, J. Kolny-Olesiak, T. Plaggenborg, M. Winter and J. Parisi, In Situ X-Ray Diffraction Study on the Formation of α-Sn in Nanocrystalline Sn-Based Electrodes for Lithium-Ion Batteries, CrystEngComm, 2015, 17(44), 8500–8504, 10.1039/c5ce01841b.
- R.-K. Chiang and R.-T. Chiang, Formation of Hollow Ni2P Nanoparticles Based on the Nanoscale Kirkendall Effect, Inorg. Chem., 2007, 46(2), 369–371, DOI:10.1021/ic061846s.
- P. K. Khanna, K.-W. Jun, K. B. Hong, J.-O. Baeg and G. K. Mehrotra, Synthesis of Indium Phosphide Nanoparticles via Catalytic Cleavage of Phosphorus Carbon Bond in N-Trioctylphosphine by Indium, Mater. Chem. Phys., 2005, 92(1), 54–58, DOI:10.1016/j.matchemphys.2004.12.029.
- J. Liu, X. Chen, M. Shao, C. An, W. Yu and Y. Qian, Surfactant-Aided Solvothermal Synthesis of Dinickel Phosphide Nanocrystallites Using Red Phosphorus as Starting Materials, J. Cryst. Growth, 2003, 252(1), 297–301, DOI:10.1016/s0022-0248(03)00939-4.
Footnote |
| † Electronic supplementary information (ESI) available. See DOI: 10.1039/c9na00203k |
| This journal is © The Royal Society of Chemistry 2019 |

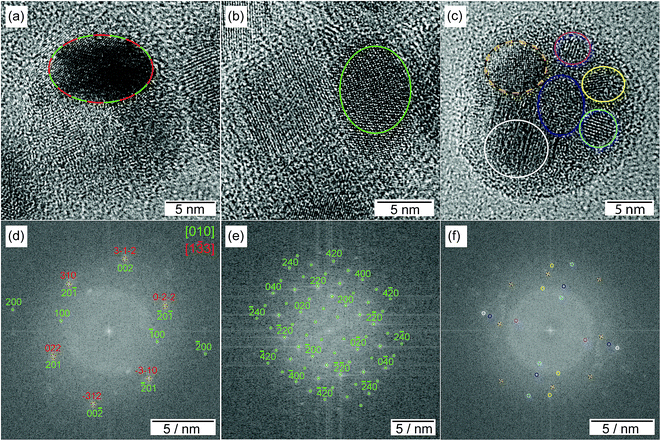
![[3 with combining macron]](https://www.rsc.org/images/entities/char_0033_0304.gif) 3] orientation and to the Fe2P crystal structure (green) in [010] orientation, for (b + e) to the FeP crystal structure in [001] orientation. For the sake of clarity, the labeling of the FFT signals is incomplete, but all detected spots match the given pattern. In (c + f) a representative polycrystalline nanoparticle is shown without phase identification. The color assigns the phase to the region in the nanoparticle.
3] orientation and to the Fe2P crystal structure (green) in [010] orientation, for (b + e) to the FeP crystal structure in [001] orientation. For the sake of clarity, the labeling of the FFT signals is incomplete, but all detected spots match the given pattern. In (c + f) a representative polycrystalline nanoparticle is shown without phase identification. The color assigns the phase to the region in the nanoparticle.