
 Open Access Article
 This Open Access Article is licensed under a Creative Commons Attribution-Non Commercial 3.0 Unported Licence
Magnetic tuning of SERS hot spots in polymer-coated magnetic–plasmonic iron–silver nanoparticles†
Stefano
Scaramuzza
a,
Stefano
Polizzi
b and
Vincenzo
Amendola
 *a
*a
aDepartment of Chemical Sciences, University of Padova, Via Marzolo 1, I-35131 Padova, Italy. E-mail: vincenzo.amendola@unipd.it
bDepartment of Molecular Sciences and Nanosystems, Centro di Microscopia Elettronica “G. Stevanato”, Università Cà Foscari Venezia, Via Torino 155/b, I-30172 Venezia-Mestre, Italy
First published on 22nd May 2019
Abstract
Plasmonic nanostructures are intensively studied for their ability to create electromagnetic hot spots, where a great variety of optical and spectroscopic processes can be amplified. Understanding how to control the formation of hot spots in a dynamic and reversible way is crucial to further expand the panorama of plasmon enhanced phenomena. In this work, we investigate the ability to modulate the hot spots in magnetic–plasmonic iron-doped silver nanoparticles dispersed in aqueous solution, by applying an external magnetic field. Evidence of magnetic field induction of hot spots was achieved by measuring the amplification of surface enhanced Raman scattering (SERS) from analytes dispersed in the solution containing Ag–Fe NPs. A polymeric shell was introduced around Ag–Fe NPs to confer colloidal stability, and it was found that the length and density of the polymer chains have a significant influence on SERS performance, and therefore on the formation of electromagnetic hot spots, under the action of the external magnetic field. These findings are expected to provide an important contribution to understanding the growing field of tuneable electromagnetic enhancement by external stimuli, such as magnetic fields applied to magnetic–plasmonic nanoparticles.
Introduction
The collective oscillation of conduction electrons in metal nanostructures, known as localized surface plasmon (LSP), attracted a great wealth of interest in the last few decades due to the rich variety of physical phenomena and chemical processes that can be originated.1,2 In particular, many research efforts have been directed towards the generation and control of electromagnetic hot spots, which are the portion of space in close proximity to the surface of metal nanoparticles (NPs) where the LSP generates the enhancement of the incident electromagnetic field, acting like a nanometric lens.3–5 The hot spots are especially observed at the junctions between metal nanoparticles, where the local field can be several orders of magnitude larger than the background field, making the amplification of optical phenomena in the neighbourhood of the plasmonic NPs possible.6–10 This includes, for instance, surface enhanced Raman scattering (SERS),8,9 surface enhanced infrared and optical absorption,2,11 surface enhanced fluorescence,12 surface enhanced chiroptical effects,13 enhanced multiple harmonic generation14 and magneto-optical effects.15 Among these, SERS is the most widely investigated phenomenon, because of the diffusion of Raman spectroscopy, the ability to obtain appreciable enhancement of the scattering from analytes adsorbed on metal surfaces, the variety of analytes that can be detected (from DNA to anticancer drugs, toxic compounds, pollutants, etc.), and the usually very small Raman scattering cross section of the same compounds without SERS (10−30 to 10−25 cm2).4,9,16A more recent evolution in the field is concerned with the ability to control hot spot formation in a reversible and remote way, by acting on the physical properties of the plasmonic nanostructure itself or of its environment, i.e. the embedding matrix or the substrate.3,10,17–19 These experiments allow a better understanding of the electromagnetic and plasmonic processes at the basis of surface enhanced optical phenomena,3,17 and introduce new ways to finely tune the interparticle distance towards optimal distribution and intensity of hot spots.3,10,17–20 Besides, the localization of probe molecules or analytes exactly at the hot spots can be facilitated by the dynamic and reversible formation of narrow gaps between metal nanostructures.20 To date, hot spot tuning has been achieved in different ways: by supporting plasmonic NPs in elastic substrates which can be mechanically deformed to change the interparticle distance;21 by using thermosensitive or pH responsive matrixes;22,23 by using focused laser beams in a fluid matrix to optically pinch and manipulate the NPs;24 by chemical transformation of metal NPs in arrays by growing or shrinking their size;3,25 and by using a magnetic field in magnetic–plasmonic nanostructures.26–28 In particular, the final approach has been considered frequently, due to the various magnetic–plasmonic nanostructures proposed in the literature, such as nanoshells with a magnetic core coated with a noble metal shell,29–31 core–satellite NPs,18,20,32–35 dumbbells or heterostructures made of magnetic and plasmonic components,36 and dielectric matrixes embedding mixtures of noble metals and iron oxides.19 Another advantage of magnetic–plasmonic NPs is the possibility to control their position in the liquid phase as well as on a substrate, by removal of the dispersing liquid after magnetic assembly.26,27 These nanosystems were exploited for the detection of multiple analytes of interest by SERS, such as dyes,29 viral DNA,37 melamine,38 arylthiols,39 pesticides26 or other toxic molecules,32,40 for biomedicine, food safety, chemical reaction monitoring and environmental analysis. Sensitivities in the nM range, or even lower, have been reported also in the case of complex matrixes which interfere with sensitivity and the signal-to-noise ratio, thanks to the magnetic separation of the plasmonic substrate after absorption of the analyte.26,27 According to several authors,35,41 the preparation of these magnetic–plasmonic systems is not straightforward due to the multiple stages of synthesis. Other commonly encountered issues are low yield, poor colloidal stability restricting their use to only one time after deposition on a solid substrate (i.e. not reusable),29,42 the lack of flexibility in surface functionalization on demand,26,27,43 and the presence of background spectroscopic signals due to the constituents of the magnetic–plasmonic nanostructures (such as the polymeric matrix).19 To date, this has limited the thorough investigation of hot spot formation in a magnetic field under conditions of reversibility, such as in the liquid phase, and as a function of different densities and types of surface coatings.
In this work, we have synthesized magnetic–plasmonic Ag–Fe NPs by an easy procedure based on laser ablation in liquid (LAL),44,45 which is compatible with surface functionalization of the metal NPs with desired molecules,46,47 like stabilizing hydrophilic polymers. Ag NPs are renowned for their large plasmonic performance and local field enhancement,48 while Fe atoms introduce the magnetic properties required for the realization of nanostructures that are responsive to an external magnetic force, allowing for instance the separation of bound analytes from complex mixtures.26,27,49 The mixing of Ag and Fe inside the same metal nanoparticle, that is not thermodynamically allowed50 and would also require tedious procedures to avoid Fe oxidation,51 became straightforward with the laser ablation in liquid method.46,47 Several previous reports showed the laser synthesis in liquid of gold–iron52 and silver–iron metal nanoparticles,46,47 nanocrescents,53 and core–shell structures with either a plasmonic core and magnetic oxide shell54 or a magnetic iron core and plasmonic shell.55 By LAL we easily synthesized polymer-coated Ag–Fe NPs required to study the formation of electromagnetic hot spots in the liquid phase, after the application of an external magnetic field, and as a function of the density and thickness of the surface coating, through the detection of the SERS signal coming from analytes interacting with the metal surface.
Results and discussion
Magnetic–plasmonic Ag–Fe nanoparticles were achieved by laser ablation with 1064 nm (6 ns) pulses of a bulk target composed of 25 at% Ag and 75 at% Fe dipped in pure ethanol.46,47 Taking advantage of the great flexibility in surface functionalization of laser generated Ag–Fe NPs, colloidal stability was ensured by mixing the NP dispersion in ethanol with an aqueous solution containing ethylenediaminetetraacetic acid (EDTA) and thiolated polyethyleneglycol (PEG), following the simple procedure described in the Experimental methods. While thiolated PEG molecules react with the surface of Ag–Fe NPs by establishing S–Ag chemical bonds,47 EDTA molecules dissolve the synthesis by-products like oxidised iron species, which in this way are easily washed away by dialysis in water, according to a previously reported procedure.46,47 After dialysis, the aqueous solution of Ag–Fe NPs was finally subjected to a selective sedimentation based separation (SBS) protocol,56 in order to collect only the larger particles among those stably dispersed in the liquid phase. Transmission electron microscopy (TEM, Fig. 1A and S1 in the ESI†) shows that the collected sample is composed of groups of NPs (i.e. 5–10), welded into larger agglomerates with an average size of 156 ± 47 nm, and characterized by an irregular shape that motivated their description as “nanotruffles” in a previous report.46 Such an irregular shape is renowned for the ability to support multiple hot spots when the nanostructures are isolated or coupled together, because tips, edges and swellings are preferential sites of local electromagnetic field amplification, especially when compared to smoother geometries like compact spheres.1,2,19In all Ag–Fe NPs examined, both Ag Lα (3.0 keV) and Fe Kα (6.4 keV) peaks were found by energy dispersive X-ray spectroscopy (EDS, Fig. 1B), with a relative intensity corresponding to 73 ± 5% atomic Ag and 27 ± 5% atomic Fe. Coexistence of Ag and Fe within the same NPs was further confirmed by EDS linescans and bidimensional maps (Fig. S2 in the ESI†). The decrease of the iron fraction with respect to the bulk target (Fe 75% atomic) is in agreement with that previously observed for laser ablation synthesis of Fe-doped Ag and Au NPs,46,52 and it has been explained with the strong tendency of iron to react with oxygen atoms in the liquid solution (coming from ethanol molecules and the atmosphere) during the fast ablation dynamics.44 Besides, thin film and nanoparticle synthesis experiments showed that metallic Ag and Fe do not form substitutional alloys, not even as a metastable state.46,57 Hence, the two elements can be coupled at the nanoscale only by forming disordered domains or defects inside a metallic crystalline matrix, when element segregation is prevented with ultrafast quenching of the atomic diffusivity.46,58 This is further confirmed by the high concentration of structural defects observed by low (Fig. 1A) and high resolution TEM (Fig. 1C) and by the concomitant selected area electron diffraction (SAED) pattern of a single Ag–Fe NP (Fig. 1D), which precisely matches all the reflections of face centered cubic (fcc) silver. Hence, we find more appropriate referencing to these particles as Fe-doped Ag NPs instead of Fe–Ag nanoalloys.
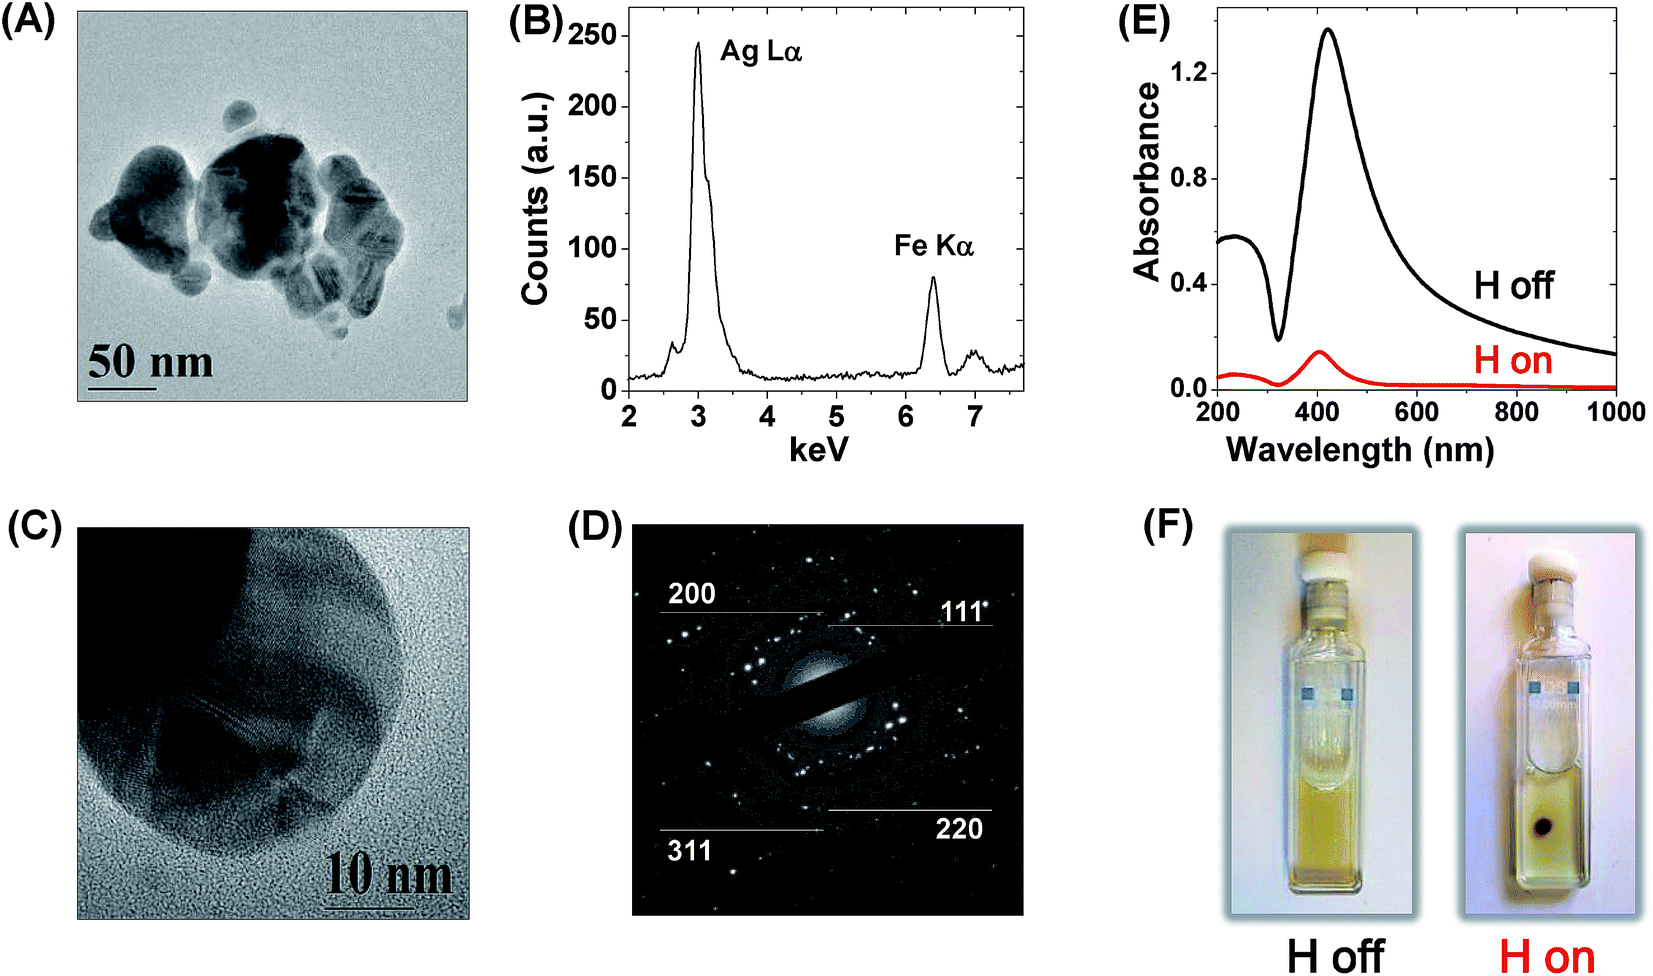 | ||
| Fig. 1 (A) TEM image of a representative Ag–Fe NP, showing the irregular “nanotruffle” shape. (B) EDS spectrum showing the Ag Lα (3.0 keV) and Fe Kα (6.4 keV) peaks. (C) HRTEM image of a portion of a Ag–Fe NP, showing several stacking faults and regions with different electronic contrast. (D) SAED pattern with reflections ascribable to fcc Ag. In particular, the reflections from the (111), (200), (220) and (311) planes are highlighted. (E) UV-visible spectra of PEG-coated Ag–Fe NP dispersion in water before (black, “H off”) and after (red, “H on”) the application of a magnetic field with a cylindrical NdFeB permanent magnet (2 mm diameter). The decrease in absorbance is due to the migration of nanoparticles towards the permanent magnet. (F) Pictures showing a cuvette filled with the Ag–Fe NP dispersion before (“H off”) and after (“H on”) placing the permanent magnet on its top lying face. | ||
As a consequence of the dominating metal Ag character of the Ag–Fe NPs, their UV-visible absorption spectrum clearly shows a sharp plasmon resonance band at 410 nm (black line in Fig. 1E), and the colloidal solution exhibits the typical yellow-green colour of Ag NPs (Fig. 1F). However, the magnetic response of the Ag–Fe NPs can be readily observed by the naked eye due to their accumulation in the proximity of a permanent magnet placed near the cell containing the nanoparticle dispersion (Fig. 1F), in a timescale of 1 hour, and by the simultaneous drop in the optical density (red line in Fig. 1E). Since the NPs remaining in solution after placing the magnet are smaller, the plasmon peak is slightly blue shifted compared to the initial value, according to what has been previously reported.46 In fact, previous studies evidenced the superparamagnetic properties of laser generated Fe-doped Ag NPs, due to the presence of Fe atoms with unpaired electrons which confer a permanent magnetic dipole moment.46,47 In the presence of an external magnetic field, the magnetic dipoles in NPs are aligned with the applied field and experience a magnetic force that is proportional to the field gradient.59 The resulting motion of the magnetic material in a viscous medium is called magnetophoresis.60 The intensity of the magnetophoretic force scales linearly with the volume of the object;59,60 hence the SBS protocol was crucial for the selection of Ag–Fe NPs with large mass and maximum response to the magnetic field. Also, the local field enhancement is size-dependent,48,61 with optimum conditions in the size range comparable to that achieved for Ag–Fe NPs by the application of the SBS protocol, that is between tens and few hundreds of nm.
Since the magnetic–plasmonic Ag–Fe NPs are stably dispersed in water, they represent a powerful platform for the investigation of hot-spot formation and tuning by an external magnetic field. The simplest way to monitor local field enhancement in a liquid solution of plasmonic nanostructures is the detection of SERS signals from an analyte in their proximity.3,6,18 Hence, SERS was investigated at 633 nm with a micro-Raman spectrometer, by mixing the Ag–Fe NP dispersion in a solution of 4-[(4-dimethylaminophenyl)phenyl-methyl]-N,N-dimethylaniline (MG) at a final concentration of 8.3 nM. Fig. 2A exhibits a representative Raman spectrum collected with a 5× objective at 3 mW of a quartz cuvette containing the mixture of Ag–Fe NPs and MG (black line). All of the Raman peaks associated with MG, i.e. those related to C–C stretching (1295, 1595 and 1617 cm−1), N-phenyl stretching (1367 and 1397 cm−1), C–H in-plane bending (1172 and 1220 cm−1), C–H out of plane bending (803 cm−1), ring vibrations of radical orientation (530 and 917 cm−1), and phenyl–C+–phenyl out of plane bending (439 cm−1), are in agreement with previous reports.62,63 Taking the dominant vibrational band at 1616 cm−1 after background subtraction as a reference, it was possible to calculate that the spectrum is 15 times more intense in the mixture than in the bare MG solution without Ag–Fe NPs (grey line in Fig. 2A and S4 in the ESI†). MG is a cationic molecule which can interact with negatively charged nanoparticles19,62,63 and, in fact, Z-spectroscopy showed that Ag–Fe NPs have a negative Z-potential of −30 mV under our experimental conditions. Since Ag–Fe NPs are coated with PEG, the addition of the cationic analyte does not induce the coagulation of the colloid, and instead remains stable. Nonetheless, the cationic dyes become part of the electrical double layer surrounding the particle, so a certain number of molecules stay near the metal surface, where the local electromagnetic field is amplified, as required to have SERS. The fact that the Raman signal of MG undergoes only a 15-fold increase can be explained by the structure of the metal NPs and the low ionic strength of the solution. Regarding metal NPs, their polymeric coating interferes with the disposition of cumbersome cations like MG at the Stern layer, that is the innermost layer of counterions temporarily bound to the charged surface in an electrolyte solution.64 On the other hand, the Debye length, i.e. the thickness of the diffuse layer of counterions around the charged surface, turns out to be of the order of 3 μm at the electrolyte concentration used in this experiment (8.3 nM), meaning that most of the MG molecules in the electric double layer are too far from the metal surface to benefit from local field enhancement.
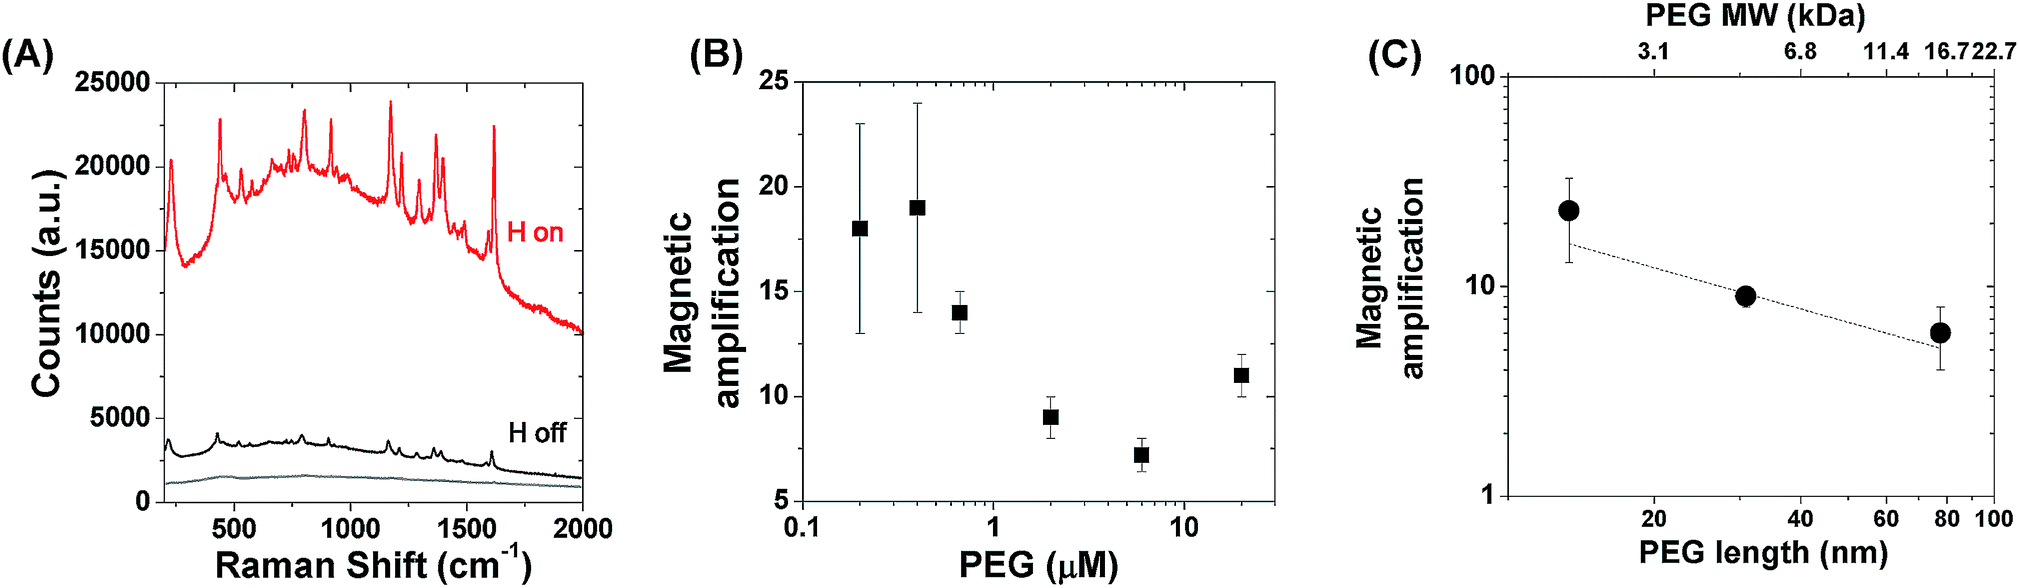 | ||
| Fig. 2 (A) Raman spectra of the Ag–Fe NP dispersion in a solution of 8.3 nM MG before (“H off”, black line) and after (“H on”, red line) magnetic focusing. The reference spectrum collected from a MG solution with the same concentration is also shown (grey line). (B) Magnetic amplification of the SERS signal as a function of thiolated PEG concentration added during the Ag–Fe NP coating procedure. (C) Magnetic amplification of the SERS signal as a function of the PEG molecular weight and the corresponding estimated chain length according to ref. 65 and 66. | ||
It should also be noted that Ag–Fe NPs are well dispersed in solution, and that electromagnetic hot spots in isolated plasmonic nanostructures are orders of magnitude less effective than in the same nanostructures coupled together at a nanometric distance.3,10 However, Ag–Fe NPs can be focused by the external magnetic field within an area as small as the face of the permanent magnet, in our case a cylinder with a diameter of 2 mm. In this configuration, a further ∼10-fold amplification of the Raman signal was measured (red line in Fig. 2A and S4 in the ESI†), corresponding to a ∼150-fold growth in the intensity compared to MG alone (after background subtraction). It is worth mentioning that the focal point was adjusted each time to the position of the highest signal, which was in the middle of the cell in the absence of the magnetic field, or at the bottom of the cell after application of the permanent magnet, where particles have been accumulated.
Interestingly, we found that PEG coating plays a relevant role in the SERS amplification induced by the magnetic field. As shown in Fig. 2B, a ∼2-fold increase of the magnetic amplification is obtained by adding PEG at a concentration lower than 0.1 μM during the synthetic procedure described above, while the amplification reaches a plateau for a PEG concentration higher than 2 μM, suggesting that this is the threshold required for the saturation of the Ag–Fe NP surface. We also probed the effect of PEG molecular mass, namely of its chain length, on the magnetic amplification, by keeping the PEG molar concentration unchanged at 2 μM, and using either 2000 Da or 20![[thin space (1/6-em)]](https://www.rsc.org/images/entities/char_2009.gif) 000 Da PEG. While there was no trend in Z-potential values versus the PEG molecular weight (Fig. S3 in the ESI†), shortening the PEG chain to 2000 Da has a positive effect of doubling the magnetic amplification of the SERS signal (23 ± 10 for 2000 Da versus 9 ± 1 for 5000 Da), as shown in Fig. 2C, while the effect is negative when using 20000 Da PEG, because the magnetic amplification is reduced to 6 ± 2.
000 Da PEG. While there was no trend in Z-potential values versus the PEG molecular weight (Fig. S3 in the ESI†), shortening the PEG chain to 2000 Da has a positive effect of doubling the magnetic amplification of the SERS signal (23 ± 10 for 2000 Da versus 9 ± 1 for 5000 Da), as shown in Fig. 2C, while the effect is negative when using 20000 Da PEG, because the magnetic amplification is reduced to 6 ± 2.
In addition to the formation of new electromagnetic hot spots when the plasmonic nanostructures are pushed together by the attractive magnetic force, several other factors may be considered in the amplification of the Raman signal from magnetically focused Ag–Fe NPs. First of all, due to the electroneutrality principle, the accumulation of negatively charged Ag–Fe NPs in a small volume of solution is associated with a process of reverse osmosis which tends to increase the concentration of counterions in the electric double layer;64 hence magnetic focusing also increases the concentration of MG molecules. However, magnetic amplification changed with PEG concentration and length, which can be explained by the reverse osmotic effect only if the polymer coating also influences the overall concentration of Ag–Fe NPs attracted at the site of analysis. For instance, although PEG chains are indispensable for Ag–Fe NP stability and reversibility of the magnetic amplification process, it should be noted that polymer coating also influences the hydrodynamic friction coefficient of the nanostructure,59,60,67 which measures the resistance to particle migration under the action of the magnetic force. However, the efficiency of magnetic migration, expressed as the ratio of solution absorbance at the surface plasmon resonance maximum (at 410 nm) before (Abs (H = 0)) and after (Abs (H ≠ 0)) magnetic focusing of Ag–Fe NPs, was not correlated to the PEG length in our experiments. Therefore, the reverse osmotic effect is not responsible for changes of magnetic amplification versus the PEG concentration or length.
Instead, it is likely that PEG chains hamper the electromagnetic coupling between Ag–Fe NPs accumulated in the proximity of the permanent magnet by steric repulsion.64,66,67 To gain more insights into hot spot formation as a function of the polymeric coating of magnetic–plasmonic NPs, we performed numerical calculations of the local field enhancement and SERS enhancement factor (GSERS) at 633 nm with the discrete dipole approximation method. GSERS is representative of hot spot formation in plasmonic nanostructures because it can be evaluated as the 4th power of the local electric field normalized to the value of the incident field, according to the widely used approximation valid for excitation with visible light.2,68 Based on the TEM observations and the optical absorption analysis reported above, we adopted a representative “nanotruffle” structure with a size in the 102 nm range for the Ag–Fe NPs (Fig. 3), and we used the optical constant of silver. In particular, GSERS maps were calculated for a dimer of Ag–Fe NPs with increasing interparticle distance (gap) ranging from 2 nm to infinity (monomer, see Fig. 3), and immersed in a non-absorbing dielectric environment with the same refractive index of water. Although the Ag–Fe NP dimer cannot be fully representative of the complexity of the real samples, useful information on the hot spot distribution and dynamics in the magnetic–plasmonic nanostructures when passing from the dispersed state to the coupled state can be obtained by evaluating the GSERSversus interparticle distance. At an infinite gap, the Ag–Fe NPs alone already support several hot spots in concomitance with surface irregularities, where GSERS can reach values of the order of 103. As expected, the local field enhancement inside the gap further increases when two identical NPs are used, reaching the maximum GSERS of ∼107 for 2 nm of interparticle distance, although the local field enhancement becomes appreciable only for gaps smaller than ∼30 nm.
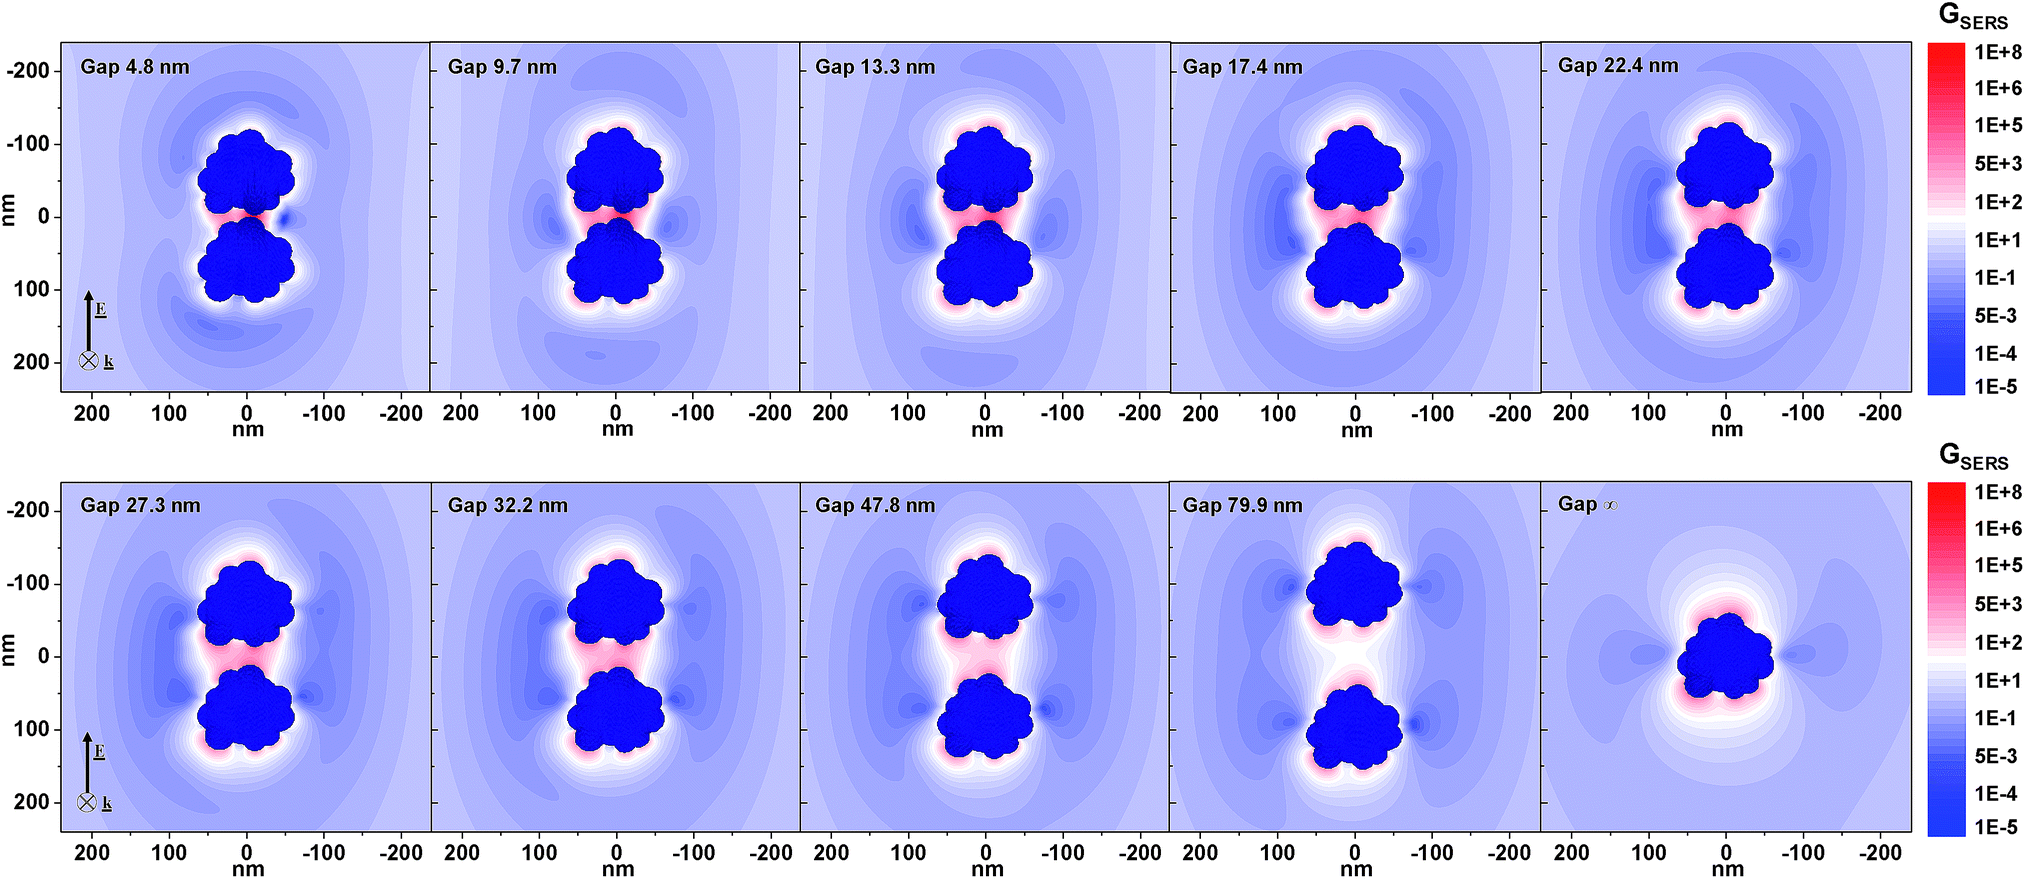 | ||
| Fig. 3 Calculated GSERS maps of Ag–Fe NP dimers in water, with the gap distance variable between 4.8 nm and infinity (monomer), for an incident electromagnetic wave of 633 nm linearly polarized along the dimer axis. | ||
To obtain a more handy picture of the GSERS trend, in Fig. 4A we plotted the maximum SERS enhancement factor measured in the middle of the gap (red circles) and at 2 nm from the NP surface (black squares), versus the interparticle distance. Since the interparticle distance encompasses two orders of magnitude, and the GSERS seven orders of magnitude, a log–log plot was adopted. Clearly, the local field enhancement is higher in the proximity of the NP surface than in the middle point; however both trends are essentially linear in the logarithmic scale. In particular, in the 10–80 nm gap range, the linear interpolation provides a slope of −4.84 ± 0.13 (R2 = 0.99576) in the middle of the gap and −2.23 ± 0.14 (R2 = 0.97784) at 2 nm from the surface. This result can be related to the PEG coating, assuming that PEG chains have the effect of limiting the minimum interparticle distance when Ag–Fe NPs are focused by the external magnetic force. According to this hypothesis, the local field enhancement should be lower when PEG with a longer chain is used, or when the PEG density on the particle surface is higher. In fact, both trends are observed in the results in Fig. 2B and C, meaning that magnetic amplification of the Raman signal is compatible with hot spot formation by magnetic attraction.
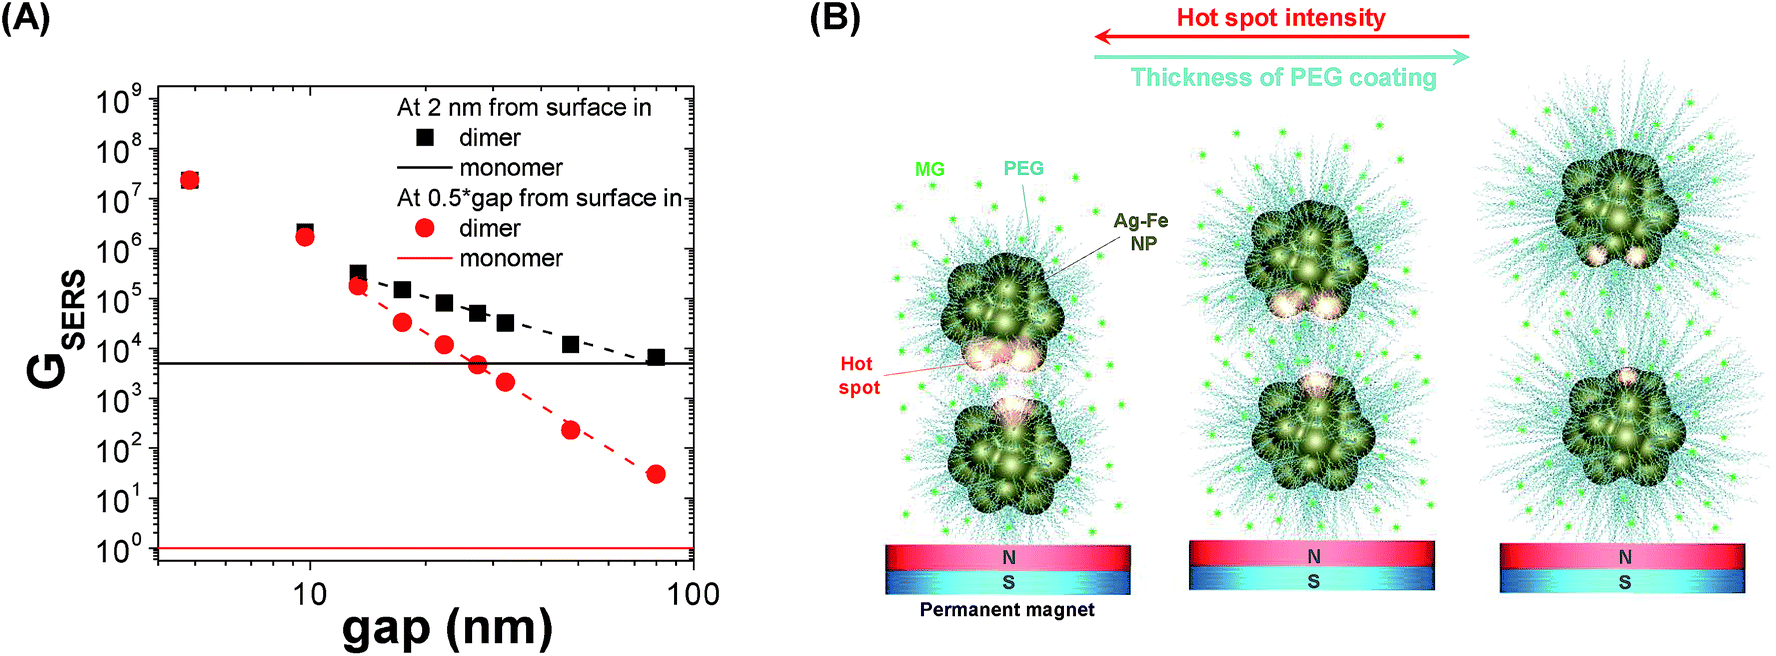 | ||
| Fig. 4 (A) Logarithmic plot of maximum GSERS measured in the middle of the gap (red circles) or at a distance of 2 nm from the PEG-coated Ag–Fe NP surface (black squares) versus the dimer gap. Dashed lines are linear fit of the GSERS data in the 10–80 nm range. Horizontal continuous lines represent the maximum GSERS values at 2 nm (black) and at an infinite distance (red) from a single Au–Fe NP. (B) Schematic representation of hot-spot formation in PEG-coated Ag–Fe NPs when attracted by a permanent magnet in a liquid dispersion of MG: by reducing the thickness of the PEG layer, interparticle gap also decreases, and local field enhancement increases. | ||
To further substantiate this result, we fitted magnetic amplification versus the PEG length expressed in nm (Fig. 2C), evaluated according to the literature,66,67 and we found a slope of −0.65 ± 0.30 (R2 = 0.82835). Although this value cannot be compared directly with the theoretical slopes in Fig. 4A which are related to just one representative dimer of Ag–Fe NPs, one can observe that the magnetic amplification recalls the trend expected for GSERS for molecules at few nm from the metal surface, instead of that for molecules in the middle of the gap. As pictorially represented in Fig. 4B, the latter case is ascribable to MG molecules dispersed in solution, while the former requires that MG molecules are located in the Stern layer of NPs as counterions. Hence, the slope value is in agreement with what has already been hypothesized on the basis of signal enhancement just after mixing Ag–Fe NPs with the solution of the analyte. This is reasonable considering that GSERS is several orders of magnitude larger in the proximity of the metal surface. In fact, multiple studies have shown that the majority of the SERS signal originates from only a small fraction of molecules located in the areas of strongest local field enhancement.4,9,63,69
It should be noted also that, as shown in Fig. 4, GSERS increases approximately by ∼50 times when the gap is reduced from 80 to 10 nm, whereas the Raman signal changes by ∼4 times when the PEG length is changed in the same range. This can be explained with the uncertainty related to experiments or calculations, or to the higher density of low molecular weight PEG chains on the metal surface, which limits the accessibility to MG molecules. The results in Fig. 2B, where magnetic amplification of the Raman signal is higher when the density of PEG coating is lower, are also well explained by the interference of a dense polymeric coating with the absorption of cationic molecules on the metal surface, and with the minimum distance between Ag–Fe NPs in the presence of a magnetic field due to PEG steric repulsion. In fact, also at parity of the PEG molecular weight, the thickness of the polymeric coating depends on the chain density, due to the transition from a brush-like configuration at high density to a mushroom-like configuration at low density.64,66,67
Taken together, the above considerations can reasonably explain the observed increase of SERS signals with decreasing PEG coating and chain length as due to the formation of new electromagnetic hot spots under the application of an external magnetic field. This process is reversible by removing the magnetic field, thanks to the polymeric coating around the magnetic–plasmonic NPs. It is worth pointing out that the electric double layer is a dynamic and reversible phenomenon as well, especially when the polymeric coating prevents stable absorption of the analyte on the metal surface. Hence, MG molecules nearby the colloidally stable PEG-coated Ag–Fe NPs can be removed and replaced with a different analyte. In fact, contrary to what happens in solvent drying on a solid substrate, which is commonly used for the concentration of SERS active nanostructures, magnetic focusing can be performed within the colloidal dispersion in an optical cuvette.26–28 Thus, the process can be repeated multiple times, and the SERS substrate can be regenerated, namely the analyte can be removed and the substrate can be reused virtually an unlimited number of times. This is demonstrated in Fig. 5, where we show the magnetically amplified SERS spectra collected from Ag–Fe NPs by cyclically alternating two different analytes, MG and HITC (1,1′,3,3,3′,3′-hexamethylindotricarbocyanine iodide), both at the same molar concentration of 8.3 nM, which is comparable to or even lower than values reported for similar experiments with magnetic–plasmonic SERS substrates.19,26,27,29 Before changing the analyte type, Ag–Fe NPs were subjected to a simple regeneration procedure consisting of centrifuge washing with water. Raman measurements on the regenerated Ag–Fe NPs prior to the addition of the next analyte show no signal, while an intense spectrum with all the characteristic peaks was found each time after the addition of the analyte and magnetic focusing of nanoparticles. In more detail, the magnetic amplification of the SERS signal in the results in Fig. 5 was 10 ± 3 for MG and 14 ± 6 for HITC, evidencing the regenerability of the polymer-coated magnetic–plasmonic Ag–Fe NPs.
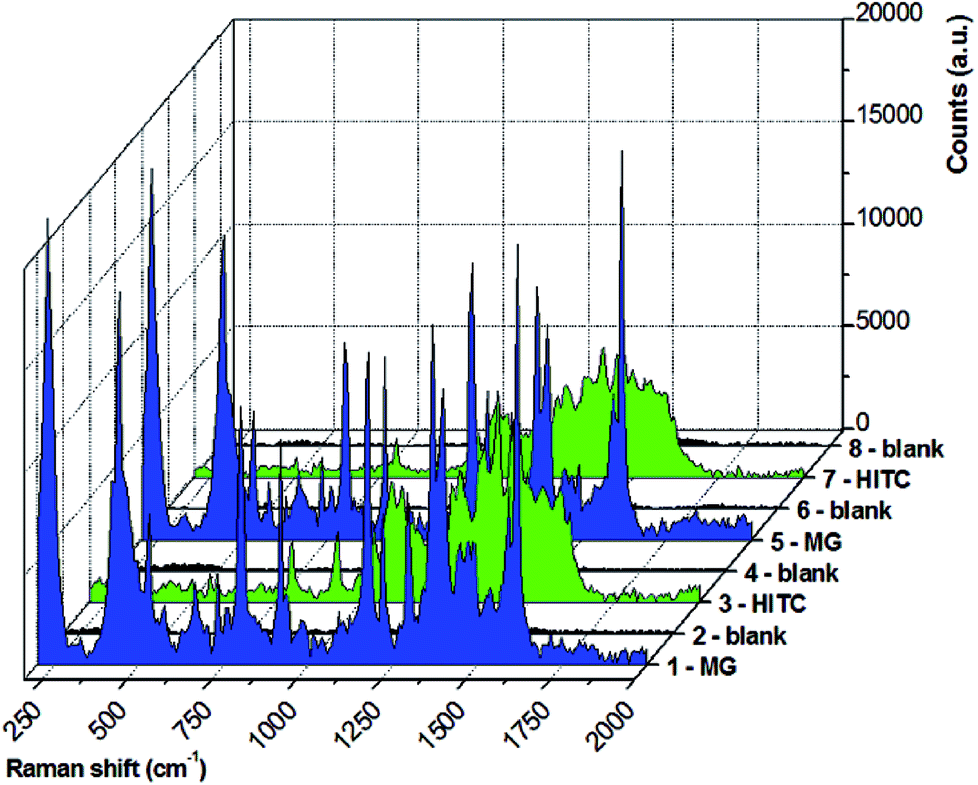 | ||
| Fig. 5 Raman spectra of a magnetically focused Ag–Fe NP dispersion mixed with MG (1, blue plot), after the regeneration procedure (2, black plot), mixed with HITC (3, green plot), after the second regeneration procedure (4, black plot), mixed with MG (5, blue plot), after the third regeneration procedure (6, black plot), mixed with HITC (7, green plot) and after the fourth regeneration procedure (8, black plot) ready for the next analyte. | ||
From the signal-to-noise ratio under our experimental conditions (3 mW and 10 s of accumulation), a limit of detection (LOD) of 60 pM can be estimated. This value is compatible with that reported in the literature for magnetic–plasmonic SERS.19,26,27,29 However, it is worth noting that longer accumulation times during Raman measurements can be used, with a consequent decrease of the noise background (which scales with the square root of accumulation time in our setup) and a consequent decrease of the LOD. This is especially possible when working in water, where heat dissipation is more efficient than in air. Another advantage of SERS assays in liquid is the possibility of increasing the concentration of nanoparticles prior to the addition to the solution of the analyte. In the present study, nanoparticles can be easily concentrated to 10–50 times to minimize dilution of the solution of the analyte while mixing the two moieties. Finally, magnetic attraction of the SERS substrate allows concentration of the probed molecule in the same small volume in the proximity of the permanent magnet, independent of the above lying liquid volume. This makes it possible to use larger volumes of the analyte solution to increase the Raman signal at parity of the analyte concentration. All these factors suggest the possibility of a further increase of the LOD beyond the value estimated under our experimental conditions.
Conclusions
In summary, we reported for the first time a study of dynamic electromagnetic hot spot formation in magnetic plasmonic NPs coated with polymers to confer colloidal stability. Fe-doped Ag NPs were obtained by an efficient laser ablation in liquid procedure, conjugated with thiolated PEG with different levels of surface coating density and thickness. Magnetic response allowed the concentration of Ag–Fe NPs in a small area, while the plasmonic and electrostatic interactions with cationic dyes paved the way to the study of local field enhancement before and after the magnetophoretic process, by monitoring the SERS signal and with the support of numerical calculations about hot spot formation. The results showed that magnetic focusing induced new hot spots between the Ag–Fe NPs. This corresponds to an enhancement of the Raman signal from nearby dyes of more than two orders of magnitude compared to the pure dye solution. The reverse osmotic effect, which locally increases the analyte concentration, and the increase of local electric field required for SERS, both contribute to this result. The PEG coating played a relevant role in the formation of hot spots, with better performances observed for incomplete Ag–Fe NP surface coverage and shorter polymer chains. The dependence of the Raman signal on the PEG molecular weight is in general agreement with theoretical predictions of hot spot formation in coupled silver nanoparticles, thus supporting the evidence of electromagnetic hot spot formation during magnetic accumulation of Ag–Fe NPs. Moreover, the colloidal stability introduced by the polymeric coating conferred reversibility to the SERS process, and multiple regeneration of the magnetic–plasmonic substrate was also demonstrated by simple washing cycles, followed by the sequential detection of different analytes. Overall, this study opens the way to the exploitation of Ag–Fe NPs for various fundamental and practical applications based on magnetically reconfigurable plasmonic materials, and contributes to the understanding of the dynamic and tuneable formation of electromagnetic hot spots in response to external stimuli, which is crucial to further expand the panorama of plasmon enhanced phenomena.Experimental methods
Ag–Fe NP synthesis
The laser ablation synthesis was performed with 1064 nm (6 ns, 50 Hz) pulses with a fluence of 6.7 × 10⁻³ J mm−2. The pulses are focused with a 15 cm lens on a bimetallic target composed of 25 at% Ag and 75 at% Fe (from Mateck) placed at the bottom of a cell containing HPLC ethanol (>99.8% pure, from Sigma Aldrich). Then, the Ag–Fe NP dispersion (0.1 mg mL−1) in ethanol was mixed with an aqueous solution containing ethylenediaminetetraacetic acid sodium salt dihydrate (EDTA, from Sigma Aldrich, 2 mg mL−1) and thiolated polyethyleneglycol (PEG, 2 μM) and kept for 60 minutes at 30 °C. We used thiolated polyethylene glycol with a molar mass of 2000, 5000 and 20000 Da from Sigma-Aldrich. After 60 minutes, the Ag–Fe NP dispersion was washed multiple times with distilled water using dialysis concentration membranes (cut-off 10000 Da, working at 2000 rcf). Finally, Ag–Fe NPs were subjected to a selective sedimentation based separation (SBS) protocol56 in two steps with a bench centrifuge, which consisted of (i) centrifugation for 1 hour at 70 rcf in 1.5 mL tubes, discarding the sediment, and (ii) centrifugation for 1 hour at 300 rcf of the remaining solution and collection of the sediment, which represents our final Ag–Fe NP sample.
Characterization
UV-visible spectra were recorded with a Varian Cary 5 using quartz cells with a 2 mm optical path. TEM analysis was carried out at 300 kV with a JEOL JEM 3010 microscope using a Gatan Multiscan CCD 794 Camera and an X-ray energy dispersive spectrometer (EDS, Oxford Instruments). The sample for analysis was obtained by drop casting of a diluted solution of Ag–Fe NPs onto a Cu grid coated with a holey carbon film (Agar Scientific). High dilution was used in order to avoid agglomeration of the nanoparticles during liquid evaporation on the TEM grid. EDS analysis and line scans were performed with a SEM model Zeiss Sigma VP equipped with a Bruker Quantax 200 detector (window size 30 mm2) and a Si drift detector. The Ag L lines and the Fe K lines were considered for the line scans and quantitative analysis on NPs deposed on the same grid previously analysed by TEM. In fact, the Fe L lines are in a region affected by the interference from elements composing the grid for electron microscopy (C, O and Cu), while the Ag K line is at a much higher energy than the Fe K lines and Ag L lines.70 Z-spectroscopy was performed with a Malvern Zetasizer Nano ZS.Raman measurements were carried out at 633 nm with a micro-Raman spectrometer equipped with a He–Ne laser, using a power of 3 mW, and using a 5× objective. Three Raman measurements, each of 10 s, were carried out on each sample placed in 2 mm quartz cells. SERS experiments were performed by mixing 0.5 mL of a 0.2 mg mL−1 Ag–Fe NP dispersion with 0.1 mL of a 5 10−7 M solution of either 4-[(4-dimethylaminophenyl)phenyl-methyl]-N,N-dimethylaniline (MG, from Sigma Aldrich) or 1,1′,3,3,3′,3′-hexamethylindotricarbocyanine iodide (HITC, from Exciton).
Magnetic focusing and NP regeneration
Ag–Fe NPs were focused by placing a cylindrical NdFeB permanent magnet (2 mm diameter and 4 mm length) on a quartz cuvette containing the nanoparticle dispersion for 1 hour. Measurements were performed on samples which consist of a liquid solution contained in a quartz cuvette; therefore microscope objectives with a focal distance exceeding the cuvette wall thickness were required. The 5× objective used (NA 0.12, surface coverage 0.36) has a spot size of 18 μm and a spot volume of 3000 μm3, which is small enough to stay within the region in proximity of the permanent magnet where nanoparticles are accumulated, but at the same time allows sampling of a volume containing a large number of nanoparticles. Since the nanoparticle concentration is in the nM range (calculated following the data reported in ref. 71), a rough estimation of hot spots contained in the probed volume is of the order of 103.In SERS spectra collected cyclically from the two different analytes (MG and HITC), the Ag–Fe NP substrates were regenerated with 3 centrifuge runs at 15000 rcf for 10 minutes with water and NaCl 10−4 M, followed by a cycle at 25000 rcf in distilled water for 10 minutes to eliminate the salt.
Numerical calculations
Local field enhancement and GSERS were evaluated through numerical calculations based on discrete dipole approximation (DDA), using the DDSCAT code and the related DDFIELD routine.72 A minimum of 2 × 10⁵ dipoles for each NP in the target was used to ensure that the interdipole spacing was smaller than the NP size and incident wavelength of 633 nm. In fact, for metal particles in the 2–200 nm size range, an error smaller than 10% is achieved using a number of dipoles at least of the order of 104 and using an interdipole spacing much smaller than the wavelength of interest.72,73 The effect of the water solvent was accounted for by setting the refractive index of the non-absorbing matrix to n = 1.334. The complex dielectric constant of Ag was obtained from the study by Palik.74GSERS was calculated on the equatorial plane of the dimer for an incident electric field linearly polarized along the dimer axis.Conflicts of interest
There are no conflicts to declare.Acknowledgements
This research was performed with the support of the University of Padova grants no. CPDA114097/11 (PRAT) and “4NANOMED” (STARS).Bibliography
- S. A. Maier, Plasmonics: Fundamentals and Applications, Springer, 2007 Search PubMed.
- V. Amendola, R. Pilot, M. Frasconi, O. M. Maragò and M. A. Iatì, J. Phys.: Condens. Matter, 2017, 29, 203002 CrossRef PubMed.
- C. Zhang, E. You, Q. Jin, Y. Yuan, M. Xu, S. Ding, J. Yao and Z. Tian, Chem. Commun., 2017, 53, 6788–6791 RSC.
- D. Radziuk and H. Moehwald, Phys. Chem. Chem. Phys., 2015, 17, 21072–21093 RSC.
- A. Lee, G. F. S. Andrade, A. Ahmed, M. L. Souza, N. Coombs, E. Tumarkin, K. Liu, R. Gordon, A. G. Brolo and E. Kumacheva, J. Am. Chem. Soc., 2011, 133, 7563–7570 CrossRef CAS PubMed.
- A. Chen, A. E. DePrince, A. Demortière, A. Joshi-Imre, E. V. Shevchenko, S. K. Gray, U. Welp and V. K. Vlasko-Vlasov, Small, 2011, 7, 2365–2371 CrossRef CAS PubMed.
- A. Chen, R. L. Miller, A. E. DePrince, A. Joshi-Imre, E. Shevchenko, L. E. Ocola, S. K. Gray, U. Welp and V. K. Vlasko-Vlasov, Small, 2013, 9, 1939–1946 CrossRef CAS PubMed.
- N. Gandra and S. Singamaneni, Adv. Mater., 2013, 25, 1022–1027 CrossRef CAS PubMed.
- D. Cialla, A. März, R. Böhme, F. Theil, K. Weber, M. Schmitt and J. Popp, Anal. Bioanal. Chem., 2012, 403, 27–54 CrossRef CAS PubMed.
- X. Lu, Y. Huang, B. Liu, L. Zhang, L. Song, J. Zhang, A. Zhang and T. Chen, Chem. Mater., 2018, 30, 1989–1997 CrossRef CAS.
- C. D'Andrea, J. Bochterle, A. Toma, C. Huck, F. Neubrech, E. Messina, B. Fazio, O. M. Marago, E. Di Fabrizio and M. de La Chapelle, ACS Nano, 2013, 7, 3522–3531 CrossRef PubMed.
- F. Tam, G. P. Goodrich, B. R. Johnson and N. J. Halas, Nano Lett., 2007, 7, 496–501 CrossRef CAS PubMed.
- V. K. Valev, J. J. Baumberg, C. Sibilia and T. Verbiest, Adv. Mater., 2013, 25, 2517–2534 CrossRef CAS PubMed.
- M. Celebrano, X. Wu, M. Baselli, S. Großmann, P. Biagioni, A. Locatelli, C. De Angelis, G. Cerullo, R. Osellame and B. Hecht, Nat. Nanotechnol., 2015, 10, 412–417 CrossRef CAS PubMed.
- G. Armelles, A. Cebollada, A. García-Martín and M. U. González, Adv. Opt. Mater., 2013, 1, 10–35 CrossRef.
- C. Byram, S. S. B. Moram and V. R. Soma, Analyst, 2019, 144, 2327–2336 RSC.
- V. Thambi, A. Kar, P. Ghosh and S. Khatua, J. Phys. Chem. C, 2018, 122, 24885–24890 CrossRef CAS.
- Q.-H. Guo, C.-J. Zhang, C. Wei, M.-M. Xu, Y.-X. Yuan, R.-A. Gu and J.-L. Yao, Spectrochim. Acta, Part A, 2016, 152, 336–342 CrossRef CAS PubMed.
- A. La Porta, A. Sánchez-Iglesias, T. Altantzis, S. Bals, M. Grzelczak and L. M. Liz-Marzán, Nanoscale, 2015, 7, 10377–10381 RSC.
- Y. Hu and Y. Sun, J. Phys. Chem. C, 2012, 116, 13329–13335 CrossRef CAS.
- H. Kang, C.-J. Heo, H. C. Jeon, S. Y. Lee and S.-M. Yang, ACS Appl. Mater. Interfaces, 2013, 5, 4569–4574 CrossRef CAS PubMed.
- Y. Lu, G. L. Liu and L. P. Lee, Nano Lett., 2005, 5, 5–9 CrossRef CAS PubMed.
- X. Qian, J. Li and S. Nie, J. Am. Chem. Soc., 2009, 131, 7540 CrossRef CAS PubMed.
- S. Bernatova, M. G. Donato, J. Jezek, Z. Pilat, O. Samek, A. Magazzu, O. M. Maragò, P. Zemanek and P. G. Gucciardi, J. Phys. Chem. C, 2019, 123, 5608–5615 CrossRef CAS.
- P. K. Kundu, D. Samanta, R. Leizrowice, B. Margulis, H. Zhao, M. Börner, T. Udayabhaskararao, D. Manna and R. Klajn, Nat. Chem., 2015, 7, 646–652 CrossRef CAS PubMed.
- D. Song, R. Yang, F. Long and A. Zhu, J. Environ. Sci., 2019, 80, 14–34 CrossRef PubMed.
- H. Lai, F. Xu and L. Wang, J. Mater. Sci., 2018, 53, 8677–8698 CrossRef CAS.
- Q. Xu, Ann. Phys., 2012, 524, A161–A162 CrossRef.
- C. Niu, B. Zou, Y. Wang, L. Cheng, H. Zheng and S. Zhou, Langmuir, 2016, 32, 858–863 CrossRef CAS PubMed.
- J. Du and C. Jing, J. Phys. Chem. C, 2011, 115, 17829–17835 CrossRef CAS.
- C. Wang, J. Wang, P. Li, Z. Rong, X. Jia, Q. Ma, R. Xiao and S. Wang, Nanoscale, 2016, 8, 19816–19828 RSC.
- N. R. Kadasala and A. Wei, Nanoscale, 2015, 7, 10931–10935 RSC.
- L. W. Yap, H. Chen, Y. Gao, K. Petkovic, Y. Liang, K. J. Si, H. Wang, Z. Tang, Y. Zhu and W. Cheng, Nanoscale, 2017, 9, 7822–7829 RSC.
- M. Ye, Z. Wei, F. Hu, J. Wang, G. Ge, Z. Hu, M. Shao, S.-T. Lee and J. Liu, Nanoscale, 2015, 7, 13427–13437 RSC.
- X. Zhang, Y. Zhu, X. Yang, Y. Zhou, Y. Yao and C. Li, Nanoscale, 2014, 6, 5971–5979 RSC.
- Z. Liu, Y. Wang, R. Deng, L. Yang, S. Yu, S. Xu and W. Xu, ACS Appl. Mater. Interfaces, 2016, 8, 14160–14168 CrossRef CAS PubMed.
- H. Zhang, M. H. Harpster, H. J. Park, P. A. Johnson and W. C. Wilson, Anal. Chem., 2010, 83, 254–260 CrossRef PubMed.
- H. Hu, Z. Wang, L. Pan, S. Zhao and S. Zhu, J. Phys. Chem. C, 2010, 114, 7738–7742 CrossRef CAS.
- M. Gühlke, S. Selve and J. Kneipp, J. Raman Spectrosc., 2012, 43, 1204–1207 CrossRef.
- X. X. Han, A. M. Schmidt, G. Marten, A. Fischer, I. M. Weidinger and P. Hildebrandt, ACS Nano, 2013, 7, 3212–3220 CrossRef CAS PubMed.
- Y. Zhai, L. Han, P. Wang, G. Li, W. Ren, L. Liu, E. Wang and S. Dong, ACS Nano, 2011, 5, 8562–8570 CrossRef CAS PubMed.
- Z. Y. Bao, J. Dai, D. Y. Lei and Y. Wu, J. Appl. Phys., 2013, 114, 124305 CrossRef.
- J. Lim and S. A. Majetich, Nano Today, 2013, 8, 98–113 CrossRef CAS.
- V. Amendola and M. Meneghetti, Phys. Chem. Chem. Phys., 2013, 15, 3027–3046 RSC.
- D. Zhang, B. Gökce and S. Barcikowski, Chem. Rev., 2017, 117, 3990–4103 CrossRef CAS PubMed.
- V. Amendola, S. Scaramuzza, S. Agnoli, G. Granozzi, M. Meneghetti, G. Campo, V. Bonanni, F. Pineider, C. Sangregorio and P. Ghigna, et al. , Nano Res., 2015, 8, 4007–4023 CrossRef CAS.
- S. Scaramuzza, D. Badocco, P. Pastore, D. F. Coral, M. B. Fernández van Raap and V. Amendola, ChemPhysChem, 2017, 18, 1026–1034 CrossRef CAS PubMed.
- K. G. Stamplecoskie, J. C. Scaiano, V. S. Tiwari and H. Anis, J. Phys. Chem. C, 2011, 115, 1403–1409 CrossRef CAS.
- J. M. J. Santillán, D. M. Arboleda, D. F. Coral, M. B. van Raap, D. Muraca, D. C. Schinca, L. B. Scaffardi, D. Muñetón Arboleda, D. F. Coral and M. B. Fernández van Raap, et al. , ChemPhysChem, 2017, 18, 1192–1209 CrossRef PubMed.
- H. Okamoto, Desk Handbook: Phase Diagrams for Binary Alloys, ASM International, Ohio, 2000 Search PubMed.
- S. Peng, C. Lei, Y. Ren, R. E. Cook and Y. Sun, Angew. Chem., Int. Ed., 2011, 50, 3158–3163 CrossRef CAS PubMed.
- V. Amendola, M. Meneghetti, O. M. Bakr, P. Riello, S. Polizzi, S. Fiameni, H. Dalaver, P. Arosio, T. Orlando and C. de Julian Fernandez, et al. , Nanoscale, 2013, 5, 5611–5619 RSC.
- S. Scaramuzza, S. Agnoli and V. Amendola, Phys. Chem. Chem. Phys., 2015, 17, 28076–28087 RSC.
- V. Amendola, S. Scaramuzza, F. Carraro and E. Cattaruzza, J. Colloid Interface Sci., 2017, 489, 18–27 CrossRef CAS PubMed.
- A. Tymoczko, M. Kamp, O. Prymak, C. Rehbock, J. Jakobi, U. Schürmann, L. Kienle and S. Barcikowski, Nanoscale, 2018, 10, 16434–16437 RSC.
- F. Bonaccorso, M. Zerbetto, A. C. C. Ferrari and V. Amendola, J. Phys. Chem. C, 2013, 117, 13217–13229 CrossRef CAS.
- H. Wan, A. Tsoukatos, G. C. Hadjipanayis, Z. G. Li and J. Liu, Phys. Rev. B, 1994, 49, 1524 CrossRef CAS.
- Y. Peng, F. Wang, Z. Wang, A. M. Alsayed, Z. Zhang, A. G. Yodh and Y. Han, Nat. Mater., 2015, 14, 101–108 CrossRef CAS PubMed.
- J. Lim, C. Lanni, E. R. Evarts, F. Lanni, R. D. Tilton and S. A. Majetich, ACS Nano, 2011, 5, 217–226 CrossRef CAS PubMed.
- I. R. Rodrigues, L. Lukina, S. Dehaeck, P. Colinet, K. Binnemans and J. Fransaer, J. Phys. Chem. C, 2018, 122, 23675–23682 CrossRef CAS.
- R. N. Cassar, D. Graham, I. Larmour, A. W. Wark and K. Faulds, Vib. Spectrosc., 2014, 71, 41–46 CrossRef CAS.
- L. He, N.-J. Kim, H. Li, Z. Hu and M. Lin, J. Agric. Food Chem., 2008, 56, 9843–9847 CrossRef CAS PubMed.
- V. Amendola and M. Meneghetti, Adv. Funct. Mater., 2012, 22, 353–360 CrossRef CAS.
- J. N. Israelachvili, Intermolecular and Surface Forces, Academic Press, 2011 Search PubMed.
- T. L. Doane, C. H. Chuang, R. J. Hill and C. Burda, Acc. Chem. Res., 2011, 45, 317–326 CrossRef PubMed.
- C. Biver, R. Hariharan, J. Mays and W. B. Russel, Macromolecules, 1997, 30, 1787–1792 CrossRef CAS.
- T. L. Doane, C.-H. Chuang, R. J. Hill and C. Burda, Acc. Chem. Res., 2012, 45, 317–326 CrossRef CAS PubMed.
- E. C. Le Ru and P. G. Etchegoin, Chem. Phys. Lett., 2006, 423, 63–66 CrossRef CAS.
- P. G. Etchegoin, M. Meyer, E. Blackie and E. C. Le Ru, Anal. Chem., 2007, 79, 8411–8415 CrossRef CAS PubMed.
- J. A. Bearden, Rev. Mod. Phys., 1967, 86–99 Search PubMed.
- C. Contado, R. Argazzi and V. Amendola, J. Chromatogr. A, 2016, 1471, 178–185 CrossRef CAS PubMed.
- B. T. Draine, and P. J. Flatau, arXiv: 1305.6497, 2013.
- B. T. Draine and P. J. Flatau, J. Opt. Soc. Am., 1994, 11, 1491–1499 CrossRef.
- E. D. Palik, Handbook of Optical Constants of Solids, Academic Press, 1985 Search PubMed.
Footnote |
| † Electronic supplementary information (ESI) available: Additional TEM images of Ag–Fe NPs; EDS linescans and bidimensional maps; Z-potential values versus the PEG molecular weight; magnification of the Raman spectra of Ag–Fe NPs mixed with MG. See DOI: 10.1039/c9na00143c |
| This journal is © The Royal Society of Chemistry 2019 |