
 Open Access Article
 This Open Access Article is licensed under a Creative Commons Attribution-Non Commercial 3.0 Unported Licence
Assessing size-dependent cytotoxicity of boron nitride nanotubes using a novel cardiomyocyte AFM assay†
Jerry
Augustine‡
ab,
Timothy
Cheung‡
ab,
Valerie
Gies
a,
Jennifer
Boughton
ab,
Maohui
Chen
a,
Zygmunt J.
Jakubek
a,
Steven
Walker
c,
Yadienka
Martinez-Rubi
c,
Benoit
Simard
c and
Shan
Zou
 *ad
*ad
aMetrology Research Centre, National Research Council Canada, 100 Sussex Drive, Ottawa, Ontario K1A 0R6, Canada. E-mail: shan.zou@nrc-cnrc.gc.ca
bDepartment of Chemistry and Chemical Biology, McMaster University, 1280 Main St. W., Hamilton, Ontario L8S 4L8, Canada
cSecurity and Disruptive Technologies Research Centre, National Research Council Canada, 100 Sussex Drive, Ottawa, Ontario K1A 0R6, Canada
dDepartment of Chemistry, Carleton University, 1125 Colonel By Drive, Ottawa, Ontario K1S 5B6, Canada
First published on 26th March 2019
Abstract
As boron nitride nanotubes (BNNTs) find increased use in numerous applications, potential adverse health effects of BNNT exposure are a growing concern. Current in vitro cytotoxicity studies on BNNTs are inconsistent and even contradictory, likely due to the lack of reference materials, standardized characterization methods and measurement protocols. New approaches, particularly with the potential to reliably relate in vitro to in vivo studies, are critically needed. This work introduces a novel atomic force microscopy (AFM)-based cardiomyocyte assay that reliably assesses the cytotoxicity of a well-characterized boron nitride nanotube reference material, code named BNNT-1. High energy probe sonication was used to modify and control the length of BNNT-1. The polymer polyethylenimine (PEI) was used concurrently with sonication to produce stable, aqueous dispersions of BNNT-1. These dispersions were used to perform a systematic analysis on both the length and height of BNNT-1 via a correlated characterization approach of dynamic light scattering (DLS) and AFM. Cytotoxicity studies using the novel cardiomyocyte AFM model were in agreement with traditional colorimetric cell metabolic assays, both revealing a correlation between tube length and cytotoxicity with longer tubes having higher cytotoxicity. In addition to the size-dependent cytotoxicity, it was found that BNNT-1 exhibits concentration and cell-line dependent cytotoxic effects.
Introduction
Boron nitride nanotubes (BNNTs) are an emerging class of nanomaterials that exhibit a wide range of exceptional properties. BNNTs are isoelectronic to carbon nanotubes (CNTs) with B–N pairs replacing pairs of carbon atoms.1,2 BNNTs are hydrophobic and exhibit higher levels of chemical and thermal stability than CNTs. For example, they have high thermal conductivity and resist oxidation up to 950 °C.2–5 In addition, being boron rich, they demonstrate the ability to absorb neutron radiation.3,6,7 Because of these exceptional properties, their application has been frequently explored in a variety of fields, such as biomedicine,8–12 composite and aerospace engineering,13–15 and nano-electronics.2While BNNTs have great potential in many fields, furthering their development has proven difficult, particularly in the field of biotechnology due to inconclusive knowledge about their toxicity. There are many discrepancies in the reports on the cytotoxicity of BNNTs (Table S1†), which can be attributed to the differences in the source of materials, the materials' physical characteristics and a lack of standardized measurement protocols. To resolve these inconsistencies, it is imperative that cytotoxicity tests are performed using well-characterized and readily available boron nitride nanotube reference materials. According to the International Organization for Standardization (ISO), a reference material (RM) should be characterized using a metrologically sound procedure for specific properties.16 Size is typically the most thoroughly characterized property for nanoscale RMs. For nanomaterials used in biological and medical applications, it is important that the cytotoxicity is investigated to understand and reduce potential health risks. This is especially true for BNNTs as various medical applications such as orthopedic implants,7 dental adhesive materials,17 and drug delivery vehicles are being developed.18 The National Research Council Canada (NRC), the world’s leading producer of BNNTs via a hydrogen catalyzed induction thermal plasma process from hexagonal boron nitride powder,19 is currently developing the first boron nitride nanotube RM, code named BNNT-1,20 which will facilitate comparative inter-laboratory studies, such as cytotoxicity and application developments.
Physical characterization of BNNT-1 has proven to be challenging. In particular, due to their extreme hydrophobicity, obtaining a stable, aqueous dispersion of pristine BNNTs is difficult, hindering systematic characterization and cytotoxicity studies.2 A common method used to minimize aggregation in aqueous media is the use of polymers as dispersion agents. Non-covalent dispersion agents and surfactants contain hydrophilic moieties that adsorb onto the surface of BNNTs through intermolecular forces. Polyethylenimine (PEI),18 PEGylated phospholipids,21 and Tween 80 (ref. 22) are examples of non-covalent dispersion agents that have previously been used by various groups to produce aqueous dispersions of BNNTs. Of the many types of dispersants available, non-ionic dispersants are favoured when being used in biological systems since they are largely non-toxic and have favourable interactions with lipid membranes.23 PEI is an example of a non-toxic (at relevant concentrations of <0.01 wt%) and non-ionic dispersant which has previously been shown to stabilize BNNTs for cytotoxicity evaluations.18 Surface functionalization and modification of BNNTs24 with polymers has allowed for the production of stable dispersions, though it should be noted that these modifications are potentially capable of masking the cytotoxic effects of BNNTs.14
In addition to the thorough understanding of the as-produced BNNT-1 candidate reference material’s characteristics, post-production processing, in particular modification of the length and aspect ratio of BNNTs, is important for their use in a variety of applications. For example, BNNTs in the hundred micrometre range have been used extensively for strengthening composite materials,25 while shorter nanotubes are more desirable for biological applications due to their perceived cytocompatibility.22,26,27 The length of BNNTs is typically controlled at the synthesis stage by varying the production conditions; however, it is difficult to achieve a narrow distribution of length at this stage.2 Greater control of length and a more monodisperse population of BNNTs may be achieved by post-synthesis manipulation, for example by methods such as AFM cutting28 and prolonged bath sonication.21 In the present study, BNNT-1 was successfully processed by probe sonication producing shorter nanotubes than originally synthesized and with a narrower size distribution.
By performing cytotoxicity measurements using BNNTs with controlled and well-characterized properties, it will be possible to resolve the previously mentioned inconsistencies in cytotoxicity, in particular the size dependence of cytotoxicity, facilitating development of protocols for safe handling of the material and use in biological applications. However, there is no clear consensus on how to measure the cytotoxicity, as each commonly used method has its own advantages and disadvantages which can impact the measurements (see ESI Table S1† and all references there). Therefore, it is highly desirable that new and more robust methods for reliable measurements of BNNT-1 cytotoxicity are developed. To this end, an AFM-based cardiomyocyte cell assay was applied to probe the beating pattern of cardiomyocytes, which is an indicator of BNNT-1 cytotoxicity. This new approach was previously developed by our group to probe the effects of heart medications on the arrhythmic changes in cardiomyocyte beatings.29 Similar studies have been performed by us and other groups with various small molecules.29–31 Although we have developed this method for pre-screening in the early drug development stage,29 here it is adapted to probe the cytotoxicity of nanomaterials. This new method is cross-examined with traditional metabolic assays and both approaches can reveal cytotoxicity trends and be further correlated. In addition, polymer modification is applied to the BNNT-1 RM, in order to create stable aqueous dispersions with high concentrations that are suitable for size and cytotoxicity measurements. Manipulation by probe sonication with controlled energy is also performed to modify the length of BNNT-1, which was assessed by both dynamic light scattering (DLS) and AFM imaging analysis.
Experimental section
BNNT-1 synthesis & aqueous dispersion
Boron nitride nanotubes were synthesized using a hydrogen-catalyzed induction thermal plasma process using pure hexagonal boron nitride powder as feedstock.19,32 This is a high yield method that allows for the production of few-walled, highly crystalline, high-quality and small diameter BNNTs.19,32 A large amount of BNNTs (>50 g) were purified, homogenized and bottled under controlled humidity and temperature, followed by low dosage gamma irradiation to produce the reference material code named BNNT-1. To create an aqueous dispersion, 5 to 10 mg of BNNT-1 was weighed into a 20 mL glass scintillation vial. An appropriate amount of PEI (molar mass of 750k, Sigma-Aldrich, USA) was diluted to a final concentration of 0.01 wt% using Milli-Q water before being added to BNNT-1 to create a 0.5 mg mL−1 dispersion. The vial was sonicated in a bath sonicator (Fisher Scientific, USA) at 45 °C for 15 to 20 min until no visible individual particles were apparent.Dispersion stability measurements
The stability of the BNNT-1 dispersion was evaluated with a Turbiscan™ LAB stability analyzer (Formulaction SA, France). Dispersions were equilibrated at 37 °C for 30 min before being transferred to the Turbiscan™ LAB analyzer where they were maintained at 37 °C and periodically monitored over a span of 24 h, as these are the conditions that were used for toxicity measurements. Transmission and backscattering profiles were regularly measured at 40 μm intervals along the vessel height during this time period. Further experimental details, including the protocol for stability tests in cell culture media, can be found in the ESI.†Probe sonication of BNNT-1
5 mL of the 0.5 mg mL−1 BNNT-1 dispersion was transferred to a 15 mL plastic centrifuge tube (Falcon, USA). The dispersion was submerged in an ice-water bath (∼4 °C) and processed with an ultrasonic processor equipped with a 6 mm probe (Cole-Parmer, USA) at an average power of 10 W, per the output display. The sample was sonicated in intervals of 10 min with at least a 1 min break between intervals to prevent excessive heating of the sample. 4 μL aliquots were removed at 0, 5, 10, 20, 30, 45, 50, 60, 90 and 120 min sonication time points for DLS measurements.DLS measurements
DLS characterization was performed using a Zetasizer Nano ZS (red) particle size analyzer (Malvern Instruments, UK) and Zetasizer software. Samples were diluted to 2 μg mL−1 using Milli-Q water and were transferred to a semi-micro polystyrene disposable cuvette (VWR, USA). For each sample, 5 measurements consisting of at least ten, 10 s long runs were taken. Samples were run at 25 °C with 180 s equilibration time before measurement. For each measurement, the Z-average hydrodynamic diameter was calculated. The mean Z-average size of 5 measurements ± standard deviation was reported for each sample.AFM imaging of BNNTs
For the systematic characterization of the BNNT-1 RM, AFM imaging was applied to obtain the morphology of the nanotubes. In order to acquire a statistically meaningful number of height/topography images for profile analysis, a detailed procedure was followed (see the ESI†). First, dispersions of BNNT-1 samples (0.2 mg mL−1) were centrifuged for 1 h at 1500g. Next, 75 μL of the supernatant was spin-coated onto a freshly cleaved 1 cm × 1 cm square mica substrate. Finally, AFM images were recorded using both a NanoWizard II BioAFM (JPK Instruments, Germany) mounted on an Olympus IX81 inverted microscope (Olympus Corporation, Japan) and a MultiMode NanoScope V with a PeakForce QNM mode (Bruker Nano Surfaces Division, Santa Barbara, CA, USA). Images with 5 μm × 5 μm, 8 μm × 8 μm and 10 μm × 10 μm size were processed and analyzed using both Gwyddion 2.51 (Czech Metrology Institute, Czech Republic) and DNA Trace software (LPMV, Switzerland). Selection of probes and further image processing procedures are described in the ESI.†Cell culture
All cells were maintained at 37 °C in an incubator with 5% CO2 and 95% relative humidity. NB4 (human peripheral blood), HepG2 (human liver epithelium) and U87 (human primary glioblastoma epithelium) cells were cultured in Gibco DMEM supplemented with 9% Gibco fetal bovine serum (FBS) and 1× Gibco penicillin–streptomycin. A549 (human lung epithelium) cells were cultured in Gibco F12K medium with 9% FBS and 1× Gibco penicillin–streptomycin. Cells were passaged once to twice a week depending on confluency. Cell media, FBS and penicillin–streptomycin were purchased from Life Technologies (USA) and cells were purchased from Cedarlane Laboratories (Canada). Cor.At cardiomyocytes were thawed and plated onto sterile glass 35 mm × 10 mm dishes (Electron Microscopy Sciences, Hatfield, PA, USA) according to the protocol provided by the cell provider with slight modifications. Cells and culture medium were purchased from nCardia (Germany). More information can be found in the ESI.†Cell toxicity assays
For cytotoxicity testing, the WST-8 (2-(2-methoxy-4-nitrophenyl)-3-(4-nitrophenyl)-5-(2,4-disulfophenyl)-2H-tetrazolium, VistaLab Technologies, Brewster, USA), MTS (3-(4,5-dimethylthiazol-2-yl)-5-(3-carboxymethoxyphenyl)-2-(4-sulfophenyl)-2H-tetrazolium, Abcam, CBG, UK) and MTT (3-(4,5-dimethylthiazol-2-yl)-2,5-diphenyltetrazolium bromide, Sigma Aldrich, WI, USA) assays were carried out in clear 96-well, flat bottom plates (Fisher Scientific, ON, Canada). For cell toxicity measurements, the 0.5 mg mL−1 BNNT-1 dispersion was diluted to the desired concentrations using cell culture media, with all wells containing a final PEI concentration of 0.001 wt%. After incubating for 24 h in a humidified incubator at 37 °C with 5% CO2 and 95% relative humidity, the plates were treated with the assay reagent. Following an additional 4 h incubation period, the optical density of the plates was read using a FLUOstar Omega microplate reader (BMG Labtech, Canada) at the appropriate wavelength as per the assay protocol (see the ESI†). At least 2 plates with 6 wells each per concentration were tested for each material and cell line. Additional details for the MTT assay and experimental setup can be found in the ESI.†Monitoring beating behavior of cardiomyocytes
A JPK AFM-optical microscope system with DNP-S10 probes (cantilever B, ∼0.12 N m−1, Bruker AFM Probes, Camarillo, CA, USA) was used to record the beating patterns of Cor.At cardiomyocytes. The cells were maintained at 36 to 37 °C using a Peltier heating/cooling device throughout the duration of the experiments. The temperature was monitored using a thermocouple thermometer. Time traces with one to two minutes of duration were collected on each cell.29 More information on data collection and analysis can be found in the ESI.†Results and discussion
Dispersion of BNNT-1 in aqueous medium
To date, it has not been possible to obtain stable aqueous dispersions of BNNTs at high concentrations without surface or chemical modification. It is essential for cytotoxicity studies, as well as various biological applications, that stable, concentrated dispersions of BNNTs are reproducibly prepared. In the present study, branched PEI (molar mass of 750k) was selected to disperse BNNT-1 as it has been previously demonstrated to be an effective dispersant and minimally toxic at relevant concentration.18,33 The cytotoxicity of PEI was evaluated at different concentrations via the WST-8 assay on a sample cell line, HepG2. At a concentration of 0.001 wt% post 24 h exposure, PEI was observed to be non-toxic as the cell viability decreased by less than 5–10% (Fig. S1†). As such, a 0.01 wt% PEI stock solution was used to suspend BNNT-1 at a concentration of 0.5 mg mL−1, as the PEI concentration would be diluted 10-fold in cytotoxicity studies as per our experimental procedures. After 15 to 20 min of sonication at 45 °C, the dispersion was milky white coloured with no apparent particles or clumps (Fig. 1A). No sedimentation was observed after leaving the dispersion undisturbed for 24 h (Fig. 1B). Shorter sonication times failed to produce a stable homogeneous dispersion, and longer sonication times were avoided to minimize the possibility of damaging the integrity of tubes. (More details on effects of longer sonication times can be found in the ESI.†) | ||
| Fig. 1 Stability of BNNT-1 aqueous dispersion. A 0.5 mg mL−1 BNNT-1 dispersion was produced by bath sonicating BNNT-1 in a solution of 0.01 wt% PEI (750k) at 45 °C until a homogeneous, milky white dispersion was achieved. (A) The BNNT-1 dispersion (0.5 mg mL−1) immediately after bath sonication. (B) The same, undisturbed dispersion after 24 h, showing no visible change from 0 h. (C) Backscattering and transmittance data from Turbiscan analysis of the 0.5 mg mL−1 BNNT-1 dispersion at 37 °C over 24 h. | ||
Due to the high concentration of the dispersion, it was difficult to visually detect sedimentation or precipitation. Therefore, a Turbiscan LAB analyzer was used to quantitatively evaluate the stability of the dispersion. The Turbiscan analysis of the BNNT-1 dispersion revealed a 12% increase (from 22% to 34%) of transmittance across all heights after 24 h, despite there being no visually detectable change in the outward appearance of the solution (Fig. 1C). There was no height-dependent variation in the transmittance and backscattering spectra.34 The most plausible explanation for this observation is that the tubes continued to debundle during the stability analysis and no measurable sedimentation was present. Therefore, the suspension was deemed sufficiently stable and suitable for further characterization and cytotoxicity studies.
In addition to testing the stability of the BNNT-1 dispersion in water, its stability in cell culture media, which is more relevant for cytotoxicity studies, was also measured with a Turbiscan LAB analyzer.35 At 50 μg mL−1, the BNNT-1 dispersion was found to be stable in DMEM cell culture medium at 37 °C for 24 h, confirming that it could be used for cytotoxicity studies (more information can be found in the ESI and Fig. S2†).
BNNT-1 length and height characterization by AFM
Atomic force microscopy (AFM) imaging and analysis was used to measure BNNT-1 length and height (a more detailed explanation on how the samples were prepared, tubes were selected, and how measurements were performed can be found in the ESI and Fig. S3†). A representative height topography image of the entire scan and of a section containing an individual tube are shown in Fig. 2A and B, respectively.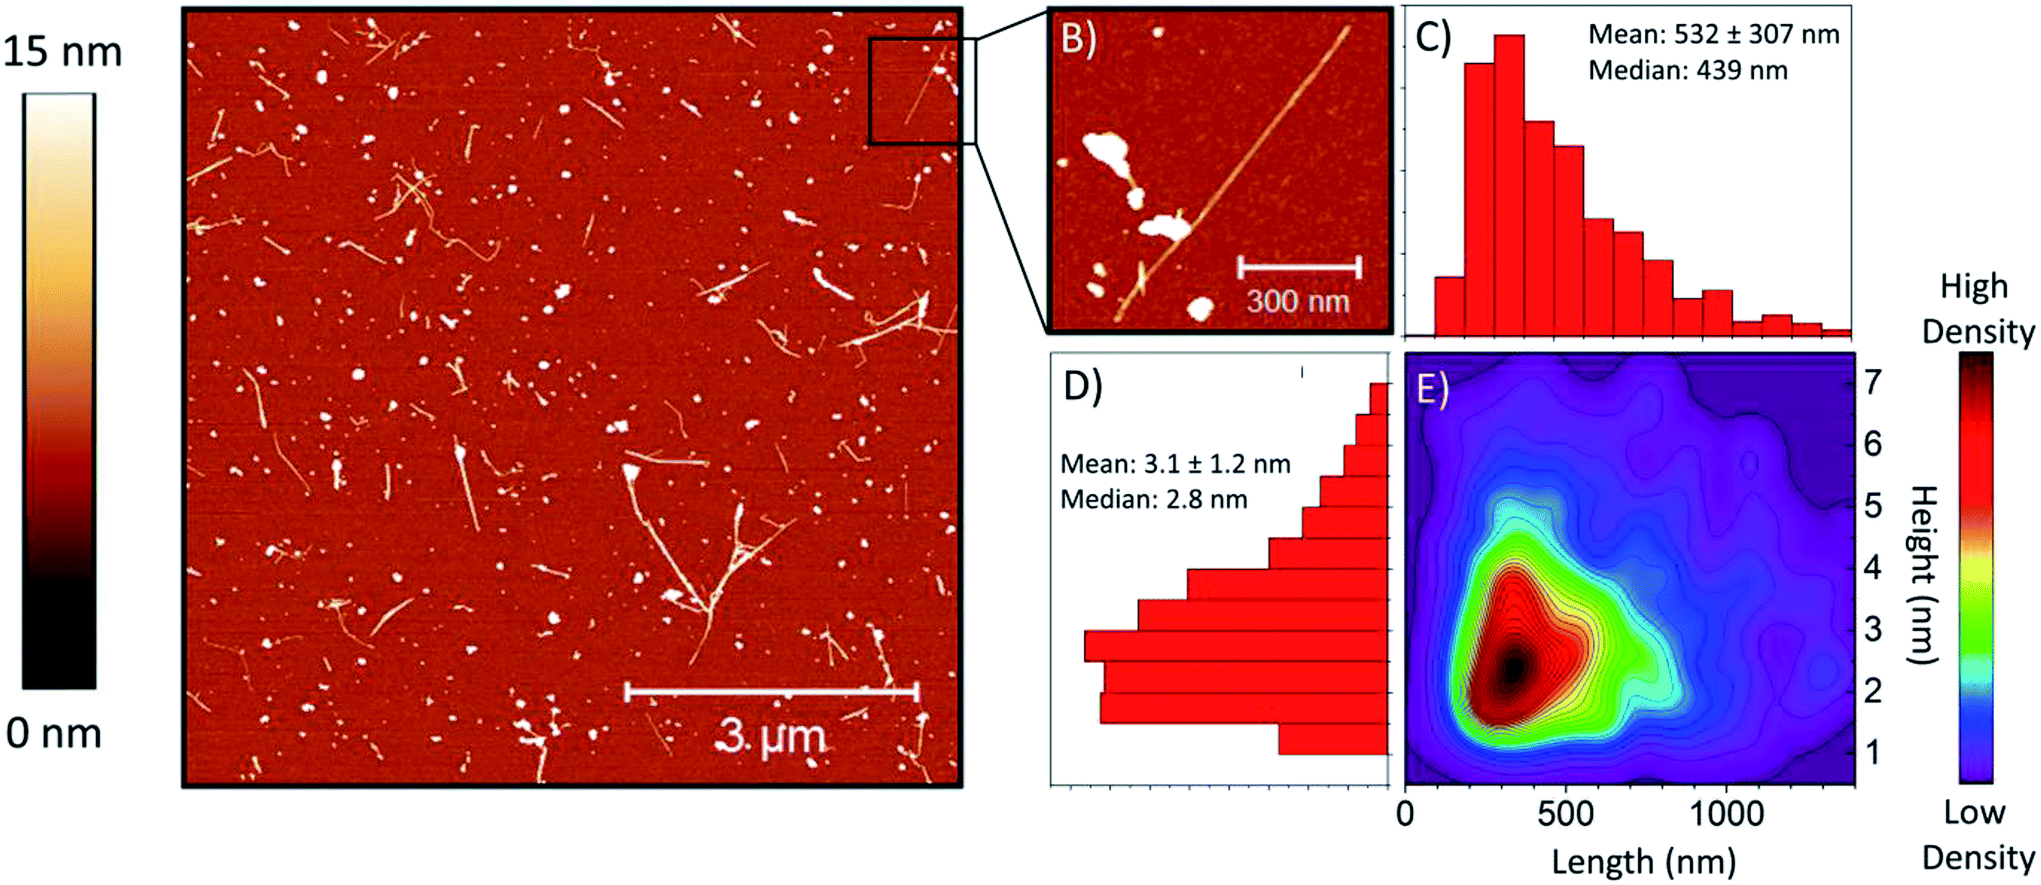 | ||
| Fig. 2 Characterization of BNNT-1 length and height by AFM. A total of 907 tubes were imaged by AFM, approximately 300 from each of 3 independently prepared samples. BNNT-1 was washed with solvent and centrifuged to remove impurities before being redispersed in 0.01% PEI at 0.5 mg mL−1. The dispersion was then diluted to 0.2 mg mL−1 before spin coating onto a freshly cleaved mica substrate. The obtained AFM images were processed and analyzed using a custom made code and Gwyddion software. (A) Representative 8 μm × 8 μm AFM image of the purified BNNT-1. (B) A higher resolution re-scanned image of the area in (A) (indicated by a black square) with a different scan angle. (A) and (B) have a Z-scale of 15 nm. (C and D) Combined histograms of the lengths and heights, respectively, for all 907 tubes analyzed. In the analysis, only tubes with height in the 1 to 7 nm range, not extending past the image edges and not obscured by impurities or artifacts, were considered. (E) 2D kernel density plot of BNNT-1 length and height. | ||
The means and medians for independently prepared samples (∼300 tubes from each, Fig. S4 and S5†) are summarized in Table 1. The length and height results demonstrate that dispersions can be produced reproducibly following the dispersion and characterization protocol. A combined histogram for the length (Fig. 2C) and height (Fig. 2D) of the three samples was compiled, as well as the combined 2D kernel density plot as a function of BNNT-1 length and height (Fig. 2E).
| Length (nm) | Height (nm) | N | |||
|---|---|---|---|---|---|
| Mean | Median | Mean | Median | ||
| a Means are expressed as mean ± one standard deviation of the distribution. | |||||
| Sample 1 | 518 ± 273 | 451 | 3.0 ± 1.2 | 2.8 | 306 |
| Sample 2 | 532 ± 324 | 438 | 3.1 ± 1.3 | 2.8 | 304 |
| Sample 3 | 545 ± 319 | 468 | 3.1 ± 1.2 | 2.9 | 297 |
This 2D plot serves as a useful tool to visualize potential correlations between the length and height of BNNT-1. From the density plot, it is evident that the highest proportion of tubes are about 300 to 500 nm long with heights of 2 to 3 nm. There is a diagonal spread going up and right from the region of highest density, indicating a positive correlation between tube length and height. While it is possible that tubes with larger diameter (as measured from the AFM height) are also longer, the correlation may also be a result of individual tubes touching each other and unresolved in the AFM images leading to apparently connected tubes being erroneously counted as single tubes. It is also possible that small residual bundles of few-walled nanotubes present in the images could not easily be distinguished from single tubes with a larger number of walls. There exists a clear lower length and height limit in the 2D density plot. The low height limit stems from the 1 nm minimum height threshold prescribed in the protocol for tubes to be counted. The low length edge is partially a consequence of the limited lateral scale of the AFM images. While in 8 μm × 8 μm images the number of longer tubes excluded from counting due to crossing an edge of the image could be minimized, it was more difficult to accurately identify and measure extremely short tubes (<50 nm) due to the combination of tip convolution and pixel size (16 nm). Reviewing all the collected images we concluded that there was only a small number of extremely short tubes less than 50 nm long, and thus, not counting them did not significantly impact the length and height distribution analysis.
Shortening of BNNTs by probe sonication
The length of BNNTs has traditionally been controlled during synthesis. However, as-produced BNNTs tend to be highly polydisperse, as seen in Fig. 2, and their length is difficult to control. It has been previously proposed that the length of BNNTs may be reduced post-synthesis via sonication.21,36To this end, probe sonication was used to shorten the length of BNNT-1. DLS was used to monitor the shortening of BNNTs as the sonication progressed. It should be noted that since Z-average represents an equivalent sphere diameter, it should not be and has not been in this work used as an estimation of the absolute lengths of BNNTs, but merely as a length change indicator approximately proportional to the actual length (as the diameter was largely unchanged during sonication). A dramatic decrease of the Z-average size value with increasing sonication energy was observed at low energies, to slow down at higher energies and effectively plateau at energies above 14.4 MJ g−1 (equivalent to 1 h sonication under the conditions used) (Tables 2, S2 and Fig. S6A†). No significant change with increasing sonication energy was observed for the polydispersity index (PDI), the value of which was in the 0.2 and 0.3 range.
| Sonication energy (MJ g−1) | Z-average (nm) | PDI |
|---|---|---|
| a Each Z-average is presented as the average of two samples ± standard error of the mean. Each sample was measured 5 times. | ||
| 0 | 252.9 ± 3.9 | 0.248 ± 0.025 |
| 14.4 | 191.9 ± 5.2 | 0.228 ± 0.022 |
To calibrate the DLS estimation of BNNT-1 length post probe sonication, dispersions sonicated with 14.4 MJ g−1 energy (labeled s-BNNT-1) were imaged by AFM using the same protocol as previously described (note that the samples were separately prepared and different from those presented in Fig. 2 and Table 1). After sonication, the average length of BNNT-1 decreased from 458 ± 345 nm (n = 312) to 224 ± 129 nm (n = 432) (p < 0.001) (Fig. 3). The height of the tubes remained essentially unchanged, measuring 3.3 ± 2.4 nm before sonication and 3.4 ± 2.3 nm after sonication (Fig. S6B†). This indicates that the high energy sonication did not affect the number of walls of the BNNTs or remove the PEI coating. Further analysis of tubes with heights > 7 nm (Fig. 3D) did not show any drastic changes (the average height of BNNT-1 changed from 10.6 ± 2.7 nm to 10.5 ± 3.3 nm after 1 h sonication at 14.4 MJ g−1), indicating there was no further debundling of the tubes that were measured.
 | ||
| Fig. 3 Comparison of BNNT-1 dispersed in 0.01 wt% PEI before and after probe sonication. Representative AFM images of PEI-coated BNNT-1 (A) before and (B) after probe sonication delivering 14.4 MJ g−1 energy to the sample. Both images are 5 μm × 5 μm with a Z-scale of 15 nm. BNNT-1 length (C) and height (D) distributions (measured on tubes with height > 7 nm) correspond to the unsonicated and sonicated BNNT-1 samples, respectively. | ||
The shortening of BNNTs has been previously reported by various groups. Zheng et al. have demonstrated precise cutting of BNNTs using AFM.28 Lee et al. previously reported that BNNTs could be shortened by bath sonication over the course of 30+ h,21 and observed their in-house produced BNNTs shortening from 5 to 10 μm to a post-sonication length of 460 nm. Our BNNT-1 nanotubes were reduced to a length of ∼200 nm using a 10 W probe sonication for 1 h, indicating that more significant cutting is possible using probe sonication.
Tracking the shortening of BNNT-1 over time using DLS, we observed that Z-average as a function of sonication energy can be approximately described using a power law or an exponential function (Fig. S6A†). Lee et al. have observed similar dependence using bath sonication for a prolonged time (>30 h).21 In our previous work on graphene oxide sonication, we also observed exponential or power law dependence of size as a function of sonication energy.37–39 In Fig. S6,† the rapid decrease of Z-average size with sonication energy at low energies can be mainly attributed to fragmentation of small bundles and aggregates of nanotubes. Subsequent much slower variation at sonication energies greater than ∼5 MJ g−1 likely results from nanotube fragmentation caused by a combination of shear force, ultrasonic cavitation and radical formation on nanotube walls.21
The sample corresponding to the AFM image and the histogram shown in Fig. 3B and D, respectively, was sonicated with 14.4 MJ g−1 energy. In order to examine the effects of higher sonication energy on BNNT-1 length, another sample was sonicated with 28.8 MJ g−1 and the size was measured using DLS and AFM (Fig. S6C†). It was apparent that doubling the sonication energy did reduce the length of BNNTs, but at most, by just a few percent. The breaking apart of BNNT-1 into nanoribbons previously reported by Liao et al. was also not observed.36
A second PEI polymer with a smaller molar mass (25k) was also applied to modify both BNNT-1 and s-BNNT-1 samples. Less stable dispersions (BNNT-1/25k PEI and s-BNNT-1/25k PEI) were obtained relative to the suspensions prepared with 750k PEI. However, upon conducting AFM imaging, it was observed that the length distributions (Fig. S7†) were very similar.
BNNT-1 and s-BNNT-1 cytotoxicity analyzed by WST-8 assay
As BNNTs have shown promise for many biomedical applications, it is vital that their biocompatibility is thoroughly analyzed. Since physical changes to BNNTs can affect their cytotoxicity,18,22,26,27 it was crucial that BNNT-1 was well-characterized before testing and that multiple cell lines and assays are used to measure the cytotoxicity. The relationship between the physical characteristics of BNNT-1 and its cytotoxicity, especially size, was probed by comparing the cytotoxicity of BNNT-1 and s-BNNT-1.A variety of metabolic assays were evaluated for their suitability to test BNNT-1 toxicity: WST-8, MTS and MTT. These three assays were tested on the HepG2 cell line with various BNNT-1 concentrations ranging from 0 to 50 μg mL−1. These assays involve the reduction of a tetrazolium reagent by metabolically active cells to a coloured formazan. The concentration of formazan can be quantified by measurement of absorbance. The absorbance values can then be used to determine the number of metabolically active cells relative to control, which translates into the viability of the cells. The WST-8 and MTS assays showed similar results, with cell viabilities of about 70% for the highest concentration of BNNT-1 (Fig. S8†). However, the MTT assay showed drastically different results, with a sharp viability decrease to 30% at 10 μg mL−1 BNNT-1, followed by a further decrease at a much smaller rate to 20% at 50 μg mL−1 (Fig. S8†). This difference was attributed to an additional solubilisation step in the MTT assay. While the WST-8 and MTS assays produce a water-soluble formazan when reduced, MTT produces a water-insoluble formazan that must be solubilized with DMSO. This necessitates the removal of the cell media along with the suspended BNNTs. It is possible that formazan crystals adsorbed onto the suspended BNNTs and subsequently were removed from the cell culture wells before they could be solubilized. This would lead to a low absorbance measure, and consequently, result in a low cell viability calculation. Another group has also reported interference with the MTT assay using BNNTs.40 As a result, the MTT assay was not deemed suitable for cytotoxicity testing and the WST-8 assay was used for all subsequent tests due to its ease of use, high sensitivity, and reproducibility.
The four selected cell lines represent different human tissues: HepG2, liver; A549, lung; NB4, peripheral blood; and U-87 MG, brain. Of the four, only the NB4 cells are suspension cells; the other three are adherent. All cell lines exhibited no or minimal toxicity to the PEI control (Fig. 4, 0 μg mL−1 BNNT-1 treatments are 0.001 wt% PEI controls). BNNT-1 and s-BNNT-1 were observed to be non-toxic to A549 cells as the cells remained ∼100% viable for all concentrations studied. s-BNNT-1 was non-toxic at all concentrations tested for the U-87 MG and HepG2 cells, while the viability decreased to ∼75% with the treatment of BNNT-1 at 25 μg mL−1, with no further change in viability at 50 μg mL−1. NB4 cells showed the highest sensitivity to the materials under study, reaching 60% viability when treated with 50 μg mL−1 BNNT-1 and 65% with s-BNNT-1. However, s-BNNT-1 was only observed to exhibit cytotoxicity at 25 μg mL−1 and above, while BNNT-1 was observably cytotoxic at all tested concentrations (Fig. 4).
 | ||
| Fig. 4 Cytotoxicity of BNNT-1/750k PEI and s-BNNT-1/750k PEI on four cell lines representing different target areas of the human body measured using the WST-8 assay. (A) HepG2 represents the human liver. (B) A549 represents the human lung. (C) NB4 represents human white blood cells. (D) U87 represents the human brain. Cells were exposed to the tested material for 24 h at 37 °C in a humidified incubator, followed by 4 h incubation with WST-8. Cell viabilities are relative to 0.001 wt% PEI control (with 0 μg mL−1 BNNT-1). | ||
Many factors have been shown to affect the cytotoxicity of BNNTs, most notably aspect ratio, purity and coating.18,22,26,27 Unfortunately, many groups have omitted the physical characteristics of BNNTs, such as number of walls, length and height, making it difficult to compare results across groups and determine which properties play key roles in cytotoxicity. There are a few studies suggesting that the cytotoxicity of BNNTs is cell-line and size-dependent, with nanotubes greater than 1 μm in length exhibiting higher toxicity than the short length tubes.22,41,42 In our study, BNNT-1 exhibited greater cytotoxicity than s-BNNT-1 for all cell lines except for A549, for which both materials were non-toxic. Since s-BNNT-1 was produced from the same material as BNNT-1, it can be concluded that shorter BNNTs are less cytotoxic. In particular, it was noted that BNNT-1 contained a significant proportion of tubes longer than 1 μm, while s-BNNT-1 did not possess such long tubes (Fig. 3). It is possible that the long nanotubes are responsible for the bulk of the cytotoxic effects observed. Our results suggest that BNNTs exhibit size-dependent cytotoxicity, with shorter tubes imparting less cytotoxic effects, which is in line with the studies previously mentioned. This finding is slightly counterintuitive as one may assume that smaller nanomaterials are more likely to be internalized within a cell or interact more easily with cells. However, it has been recently found that high-aspect ratio “long-fibres” such as CNTs that are biopersistent pose an asbestos-like hazard.43,44 The cytotoxicity of BNNT-1 was also shown to be cell-line dependent, as different cell lines reacted differently to BNNT-1 exposure. Of particular note was that NB4, being the only suspension cell line, exhibited the highest sensitivity to BNNTs of all the cell lines tested. This is likely due to a larger surface area being available for interaction with the nanomaterial, resulting in more instances of internalization or interactions with the cell membrane. This trend was also observed in our previous studies on graphene oxide cytotoxicity.38,39
BNNT-1 and s-BNNT-1 cytotoxicity on Cor.At cardiomyocytes
Traditional viability assays can only provide toxicity information based on cell death. To overcome this limitation of the aforementioned cytotoxicity tests, a new cytotoxicity assay using cardiomyocytes combined with AFM measurement was developed. This assay was recently established by our group and uses AFM to directly measure the beating pattern of cardiomyocytes after exposure to a material of choice.29 Variations in beat frequency and amplitude, as well as visual appearance, can be used as an indication of cytotoxicity. The method was previously tested and verified using the heart medications isoproterenol, nifedipine and sotalol and was found to be in good agreement with other techniques such as patch clamp and MEA.29 While AFM has previously been used on cardiomyocytes to probe small molecule toxicity,29,31 we have shown that this assay can also be used to effectively evaluate the cytotoxicity of nanomaterials.Unlike many colorimetric cytotoxicity measurements which only distinguish between living and dead cells, the AFM based cardiomyocyte assay allows for cells to be observed at intermediate levels of health. As a result, this is a dynamic model with living cells that is more relatable to in vivo conditions than traditional assays. In our previous publication, we demonstrated that Cor.At murine iPSC-derived cardiomyocytes exhibited stable, homogeneous beating patterns for up to 10 days after initial culture.29 All measurements were therefore performed between 3 and 10 days post-plating. For each individual cell, the time interval between peaks in the AFM trace was extracted and taken as the beat interval. The average beat interval and standard deviation were calculated for each cell. The standard deviation was used as an indicator of irregularity in the beating pattern, as cardiomyocytes that beat irregularly will have more variation in beat frequency. In addition to the quantitative beating data, each cell was sorted into one of three categories of health by visual inspection. Fig. 5 shows examples of the categorization of cells. Cells with a flat, transparent morphology were considered visually healthy. The darkened cells with a crumpled, not well spread morphology were categorized as visually unhealthy ones. Cells with constant beat interval and amplitude were considered to have a regular beating pattern. (Videos of the treated and untreated cardiomyocyte cells can be found in ESI Videos VS1 and VS2.†) Category 1 cells visually appear healthy and have regular beating patterns. Category 2 cells either visually appear unhealthy or have irregular beating patterns (irregular amplitude and/or beat frequency). Category 3 cells both visually appear unhealthy and have irregular beating patterns (Fig. 5) (see Experimental and ESI sections for more details†). Category 1 cells were considered to be healthy, while Category 2 and 3 cells were unhealthy.
 | ||
| Fig. 5 Examples of optical images of Cor.At cardiomyocytes along with their beating patterns measured by AFM. (A) Healthy cells, characterized by clear appearance and a flat morphology; (B) unhealthy cells, characterized by a raised, shrivelled morphology; (C) regular beating pattern with consistent beat frequency and amplitude; (D) irregular beating pattern with inconsistent beat frequency and/or amplitude. | ||
Cor.At cells treated with 0.001 wt% PEI for 24 h vs. untreated cells showed few differences. As demonstrated in Fig. S9A,† the proportion of Category 1 cells treated with PEI dropped by 15% and no cells were observed in Category 3. There was no significant difference in the standard deviations of beating intervals between the PEI-treated cells and cells that received no treatment (Fig. S9B,† see their mean values in Fig. 7A and B). It was determined that this level of cytotoxicity imparted by PEI was acceptable for further tests with BNNT-1.
Furthermore, Cor.At cells were treated with varying concentrations of BNNT-1 or s-BNNT-1 with 0.001 wt% PEI for 24 h. At 5 μg mL−1, the proportion of Category 1 cells dropped by 17% and 4% for BNNT-1 and s-BNNT-1, respectively, compared to the 0.001 wt% PEI control (Fig. 6A). Higher cytotoxicity at 20 μg mL−1 and 50 μg mL−1 is observed, with ca. 10% to 25% of cells remaining in Category 1, 70% to 80% of cells in Category 2 and 0% to 10% in Category 3 for both materials.
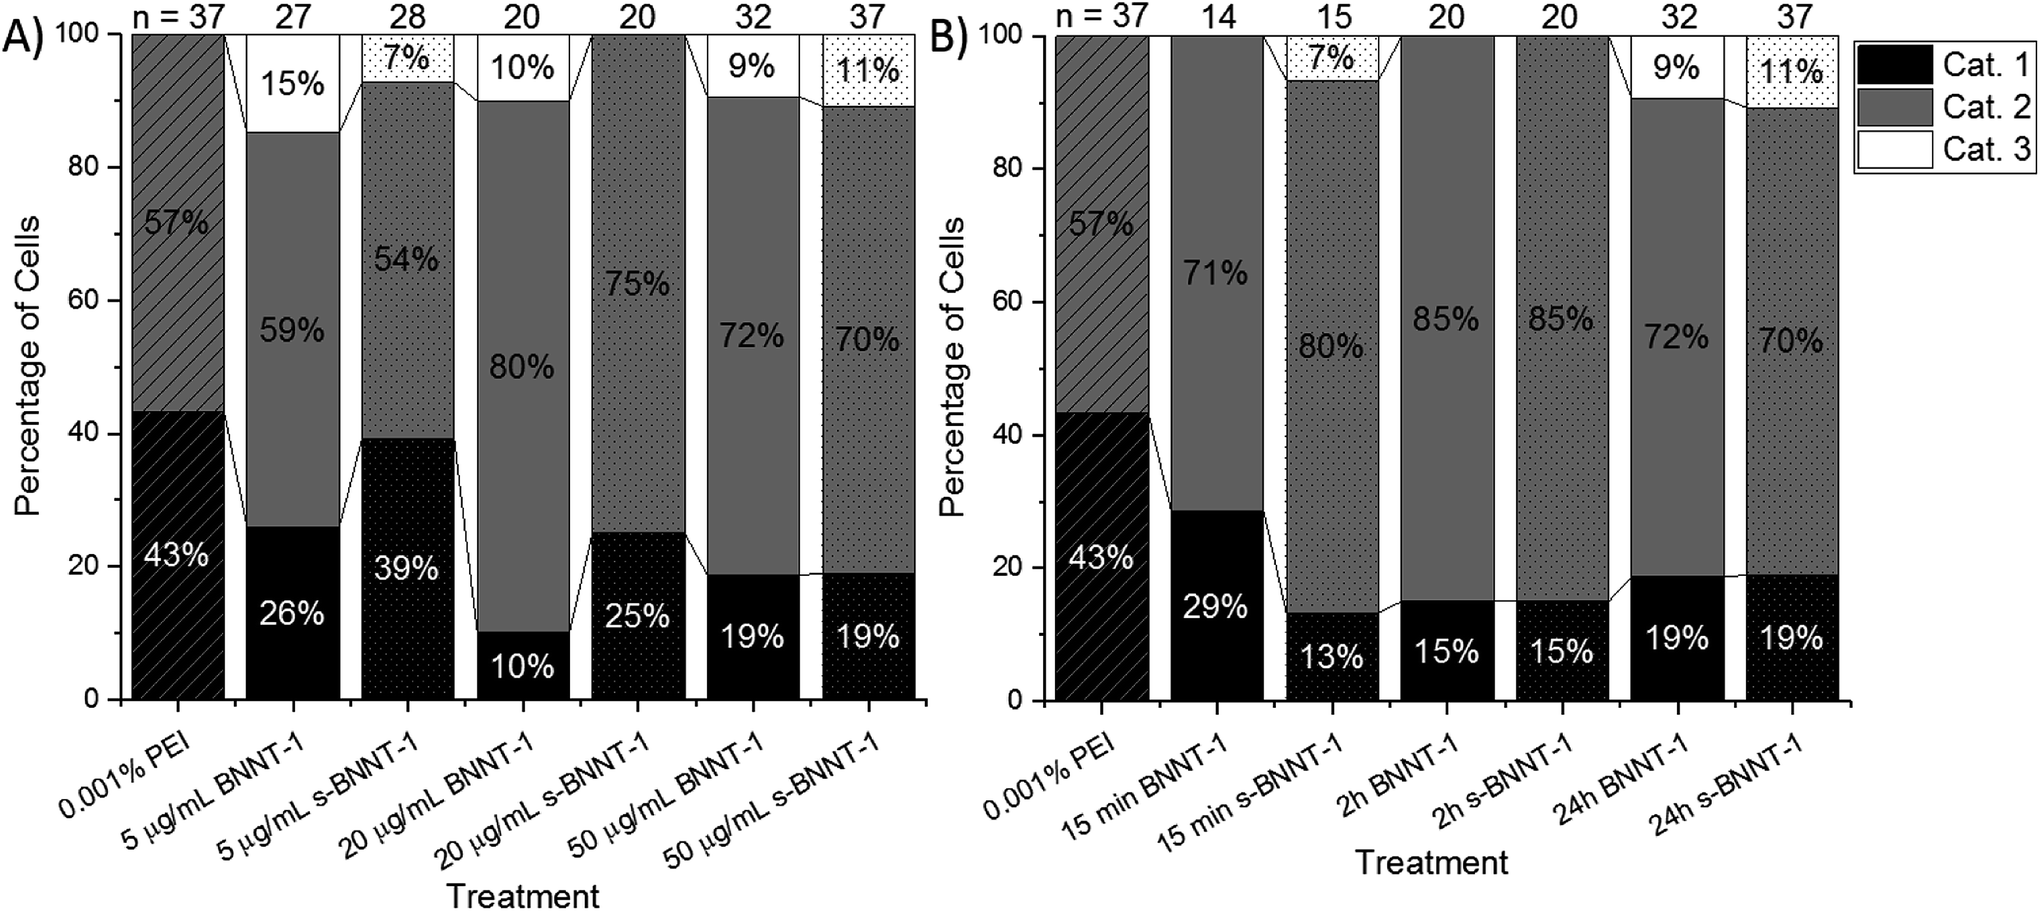 | ||
| Fig. 6 Proportion of cells categorized into 3 different categories. After exposure to each material and analysis of the physical appearance and beating pattern of Cor.At cardiomyocytes, the cells were assigned to one of three categories: Category 1 cells have both a healthy appearance and regular beating pattern; Category 2 cells either have an unhealthy appearance or irregular beating pattern; Category 3 cells have both an unhealthy appearance and irregular beating pattern. (A) Cells after 24 h exposure to varying concentrations of BNNT-1 and s-BNNT-1. (B) Cells after varying exposure times (from 15 min, 2 h to 24 h) to 50 μg mL−1 BNNT-1 or 50 μg mL−1 s-BNNT-1. Numbers above bars indicate the total number of cells analyzed per treatment. | ||
When comparing BNNT-1 to s-BNNT-1 at 5 μg mL−1 and 20 μg mL−1, it can be observed that s-BNNT-1 tended to be less cytotoxic than BNNT-1, with more cells in Category 1 (Fig. 6A). Cor.At follows a similar toxicity profile to NB4 (Fig. 4C) in that s-BNNT-1 is less cytotoxic at low concentrations, but at higher concentrations, the cytotoxicity of the two materials is similar. As with the metabolic assays, concentration-dependent cytotoxicity was observed.
Another advantage of using AFM is being able to instantaneously observe cells without having to incubate with additional chemical reagents. This allows for toxicity measurements to be taken minutes after exposure to a material, rather than after days or hours as with a traditional metabolic assay. To observe the time dependent toxicity of BNNTs, cardiomyocytes were observed using AFM 15 min, 2 h, and 24 h after exposure to 50 μg mL−1 BNNT-1 and s-BNNT-1 (Fig. 6B). The 2 h time period showed a similar toxicity profile when compared to the 24 h time period for the same material, indicating that toxicity appears to be exerted within the first 2 h after exposure to the material. For both materials, the 24 h time period showed the largest numbers of Category 3 cells. This was likely because the visual signs of cell damage needed time to manifest. After 15 min and 2 h, most cells had a healthy visual appearance, but some cells had an irregular beating pattern, which would place them in Category 2. Interestingly, after 15 min of s-BNNT-1 or BNNT-1 treatments, Cor.At cells exhibited more irregular beating behaviors than the PEI control (Fig. 6B), indicating some shorter length tubes may interact with cells faster than the longer tubes.
Using the categorization of cells as an indicator of toxicity as previously described (Fig. 6), it is difficult to confirm whether or not BNNT-1 is more toxic than s-BNNT-1, as suggested by the WST-8 assay (Fig. 4). However, when the standard deviations in beat frequency for individual cells are presented in a graph, an interesting trend can be observed. After 24 h treatment with 50 μg mL−1 BNNT-1 or s-BNNT-1, the s-BNNT-1 treated cells had a similar spread to the PEI control, while the BNNT-1 treated cells had a much wider distribution (Fig. 7). Detailed beat interval distributions for individual representative cells can be found in the ESI (Fig. S10†). This trend was also observed at different time points and different concentrations (Fig. S11†). It is evident that the longer BNNT-1 had a higher chance of greatly affecting the beating pattern of the cardiomyocytes. Combined with the counting data from the categorization, it may be concluded that while a similar number of cells are affected by treatment with BNNT-1 and s-BNNT-1, the longer tubes have a larger effect on the cells.
The cytotoxicity trends observed in the traditional assays match those observed in the cardiomyocyte assays, namely the concentration and size dependent cytotoxicity. It is important to note that all cells observed using the AFM-cardiomyocyte assay were still living, compared to traditional metabolic assays, which only distinguish between living and dead cells based on the metabolic activity level of the population of the cells.
The AFM assay method allowed us to measure cells in intermediate levels of health: cells with irregular beating patterns. BNNT-1 treated cells were observed to have more irregular beating patterns relative to the PEI control and the s-BNNT-1 treated cells (Fig. 7). This matches the trend observed with the traditional assays, where s-BNNT-1 was observed to be less toxic than BNNT-1. However, whereas s-BNNT-1 was shown to be largely non-toxic using traditional assays, the cardiomyocyte assay showed it to have observable effects on the living cells. With a smaller molar mass PEI-25k, treatments of BNNT-1/25k PEI and s-BNNT-1/25k PEI followed similar observed effects on Cor.At cardiomyocytes (see Fig. S12†). The mechanism of cytotoxicity of BNNTs is unclear. Although we were unable to observe BNNTs by optical microscopy (due to their transparency in visible light), it is unlikely that BNNT-1 nanotubes were settling on the cardiomyocytes to physically impair their beating. Multiple groups have previously noted that BNNTs are easily internalized by most types of cells, with phagocytes exhibiting the highest level of cytotoxicity.22,26 Ciofani et al. demonstrated that endocytosis is the most likely pathway of internalization for PEI-coated BNNTs.18 Further studies with longer exposure times and imaging analysis should seek to elucidate the exact mechanism of cytotoxicity and how the size of BNNTs plays a role in said mechanism.
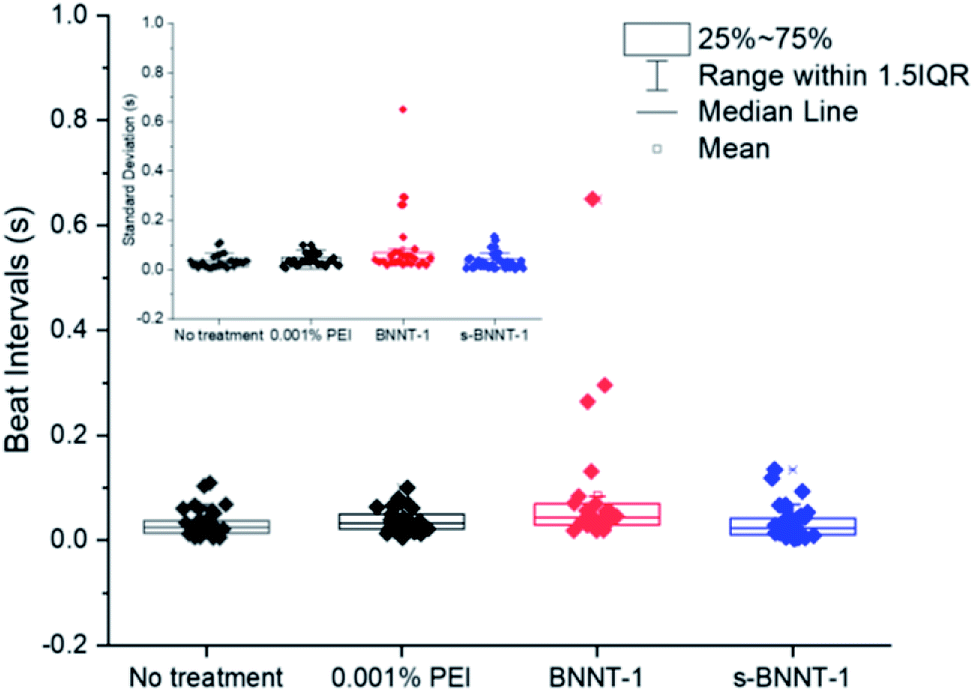 | ||
| Fig. 7 Beat frequency determined by AFM measurements for Cor.At cardiomyocytes, with no treatment, after 24 h treatment with 0.001 wt% PEI, 50 μg mL−1 BNNT-1 or 50 μg mL−1 s-BNNT-1. Inset: Corresponding standard deviation values for each individual Cor.At cardiomyocytes measured, respectively. Both beat interval and standard deviation were plotted individually on top of a box and whisker plot, where the box represents the range between the 25th and 75th percentile. | ||
Conclusion
The essential requirement, namely a stable aqueous dispersion with high concentration (0.5 mg mL−1), for morphology characterization and cytotoxicity assessment of boron nitride nanotubes was realized by using a polymer modification in both water and cell media. The stability has been demonstrated using multiple light scattering analysis for at least 24 h at 37 °C. A correlated height and length distribution of reference material BNNT-1 was determined. BNNT-1 length was manipulated by high energy probe sonication and characterized by DLS and AFM. A recently developed cardiomyocyte-AFM assay was applied to assess the cytotoxicity of BNNT-1 and a sonicated, shortened sample (s-BNNT-1), which was in good agreement with multiple traditional metabolic assays using multiple cell lines. The unique capability of this newly developed AFM-based cardiomyocyte assay is to monitor the transitioning from a healthy state (with regular rhythm) to irregular arrhythmia beating behaviors, caused by treatment with drugs or nanomaterials. In both methods, BNNT-1 was revealed to be more toxic than s-BNNT-1, indicating that the size of BNNT-1 plays a significant role in its cytotoxicity.Conflicts of interest
There are no conflicts to declare.Acknowledgements
The authors wish to thank the National Research Council Canada (NRC) for the financial support and the Natural Sciences and Engineering Research Council (NSERC) of Canada for the Discovery Grant (RGPIN-2014-05199 to S. Z.).Notes and references
- G. Ciofani, S. Danti, D. D'Alessandro, L. Ricotti, S. Moscato, G. Bertoni, A. Falqui, S. Berrettini, M. Petrini and V. Mattoli, ACS Nano, 2010, 4, 6267–6277 CrossRef CAS PubMed.
- D. Golberg, Y. Bando, Y. Huang, T. Terao, M. Mitome, C. Tang and C. Zhi, ACS Nano, 2010, 4, 2979–2993 CrossRef CAS PubMed.
- D. Golberg, Y. Bando, C. Tang and C. Zhi, Adv. Mater., 2007, 19, 2413–2432 CrossRef CAS.
- C.-W. Chang, W.-Q. Han and A. Zettl, J. Vac. Sci. Technol., B: Microelectron. Nanometer Struct.--Process., Meas., Phenom., 2005, 23, 1883–1886 CrossRef CAS.
- X. Chen, P. Wu, M. Rousseas, D. Okawa, Z. Gartner, A. Zettl and C. R. Bertozzi, J. Am. Chem. Soc., 2009, 131, 890–891 CrossRef CAS PubMed.
- S. A. Thibeault, C. C. Fay, S. E. Lowther, K. D. Earle, G. Sauti, J. H. Kang, C. Park and A. M. McMullen, Radiation Shielding Materials Containing Hydrogen, Boron, and Nitrogen: Systematic Computational and Experimental Study, Phase I, 2012 Search PubMed.
- D. Lahiri, F. Rouzaud, T. Richard, A. K. Keshri, S. R. Bakshi, L. Kos and A. Agarwal, Acta Biomater., 2010, 6, 3524–3533 CrossRef CAS PubMed.
- G. G. Genchi, A. Rocca, A. Grillone, A. Marino and G. Ciofani, Boron nitride nanotubes in nanomedicine: historical and future perspectives, in Boron Nitride Nanotubes in Nanomedicine, ed. G. Ciofani and V. Mattoli, Elsevier, 2016, ch. 13, pp. 201–217 Search PubMed.
- Z. Gao, C. Zhi, Y. Bando, D. Golberg and T. Serizawa, Functionalization of boron nitride nanotubes for applications in nanobiomedicine, in Boron Nitride Nanotubes in Nanomedicine, ed. G. Ciofani and V. Mattoli, Elsevier, 2016, ch. 2, pp. 17–40 Search PubMed.
- E. Shakerzadeh, Theoretical investigations of interactions between boron nitride nanotubes and drugs, in Boron Nitride Nanotubes in Nanomedicine, ed. G. Ciofani and V. Mattoli, Elsevier, 2016, ch. 4, pp. 59–77 Search PubMed.
- T. H. Ferreira and E. M. B. d. Sousa, Applications and perspectives of boron nitride nanotubes in cancer therapy, in Boron Nitride Nanotubes in Nanomedicine, ed. G. Ciofani and V. Mattoli, Elsevier, 2016, ch. 6, pp. 95–109 Search PubMed.
- X. Chen and C. Ke, Structural and physical properties of boron nitride nanotubes and their applications in nanocomposites, in Boron Nitride Nanotubes in Nanomedicine, ed. G. Ciofani and V. Mattoli, Elsevier, 2016, ch. 12, pp. 183–199 Search PubMed.
- B. Ashrafi, M. B. Jakubinek, Y. Martinez-Rubi, M. Rahmat, D. Djokic, K. Laqua, D. Park, K.-S. Kim, B. Simard and A. Yousefpour, Acta Astronaut., 2017, 141, 57–63 CrossRef CAS.
- J. Guan, K. S. Kim, M. B. Jakubinek and B. Simard, ChemistrySelect, 2018, 3, 9308–9312 CrossRef CAS.
- J. H. Kang, G. Sauti, C. Park, V. I. Yamakov, K. E. Wise, S. E. Lowther, C. C. Fay, S. A. Thibeault and R. G. Bryant, ACS Nano, 2015, 9, 11942–11950 CrossRef CAS PubMed.
- ISO 17034:2016 General requirements for the competence of reference material producers https://www.iso.org/standard/29357.html.
- F. W. Degrazia, V. C. B. Leitune, F. Visioli, S. M. W. Samuel and F. M. Collares, Dent. Mater., 2018, 34, 427–433 CrossRef CAS PubMed.
- G. Ciofani, V. Raffa, A. Menciassi and A. Cuschieri, Biotechnol. Bioeng., 2008, 101, 850–858 CrossRef CAS PubMed.
- K. S. Kim, C. T. Kingston, A. Hrdina, M. B. Jakubinek, J. Guan, M. Plunkett and B. Simard, ACS Nano, 2014, 8, 6211–6220 CrossRef CAS PubMed.
- Contact the corresponding author for reference material availability information..
- C. H. Lee, D. Zhang and Y. K. Yap, J. Phys. Chem. C, 2011, 116, 1798–1804 CrossRef.
- L. Horvath, A. Magrez, D. Golberg, C. Zhi, Y. Bando, R. Smajda, E. Horvath, L. Forro and B. Schwaller, ACS Nano, 2011, 5, 3800–3810 CrossRef CAS PubMed.
- J. K. Lee, D. B. Kim, J. I. Kim and P. Y. Kim, Toxicol. In Vitro, 2000, 14, 345–349 CrossRef CAS PubMed.
- A. D. Smith McWilliams, C. A. de los Reyes, L. Liberman, S. Ergülen, Y. Talmon, M. Pasquali and A. A. Marti, Nanoscale Advances, 2019, 1, 1096–1103 RSC.
- M. Antillon, P. Nautiyal, A. Loganathan, B. Boesl and A. Agarwal, Adv. Eng. Mater., 2018, 20, 1800122 CrossRef.
- S. Del Turco, G. Ciofani, V. Cappello, M. Gemmi, T. Cervelli, C. Saponaro, S. Nitti, B. Mazzolai, G. Basta and V. Mattoli, Colloids Surf., B, 2013, 111, 142–149 CrossRef CAS PubMed.
- G. Ciofani, S. Danti, G. G. Genchi, B. Mazzolai and V. Mattoli, Small, 2013, 9, 1672–1685 CrossRef CAS PubMed.
- M. Zheng, X. Chen, C. Park, C. C. Fay, N. M. Pugno and C. Ke, Nanotechnology, 2013, 24, 505719 CrossRef PubMed.
- A. Chen and S. Zou, Analyst, 2016, 141, 6303–6313 RSC.
- M. Pesl, J. Pribyl, I. Acimovic, A. Vilotic, S. Jelinkova, A. Salykin, A. Lacampagne, P. Dvorak, A. C. Meli and P. Skladal, Biosens. Bioelectron., 2016, 85, 751–757 CrossRef CAS PubMed.
- T. Yue, K. H. Park, B. E. Reese, H. Zhu, S. Lyon, J. Ma, P. J. Mohler and M. Zhang, Langmuir, 2016, 32, 1909–1919 CrossRef CAS PubMed.
- K. Keun Su, K. Myung Jong, P. Cheol, C. F. Catharine, C. Sang-Hyon, T. K. Christopher and S. Benoit, Semicond. Sci. Technol., 2017, 32, 013003 CrossRef.
- V. Kafil and Y. Omidi, BioImpacts, 2011, 1, 23–30 CAS.
- O. Mengual, G. Meunier, I. Cayré, K. Puech and P. Snabre, Talanta, 1999, 50, 445–456 CrossRef CAS PubMed.
- M. Pavlin and V. B. Bregar, Dig. J. Nanomater. Biostruct., 2012, 7, 1389–1400 Search PubMed.
- Y. Liao, Z. Chen, J. W. Connell, C. C. Fay, C. Park, J. W. Kim and Y. Lin, Adv. Funct. Mater., 2014, 24, 4497–4506 CrossRef CAS.
- B. R. Coleman, T. Knight, V. Gies, Z. J. Jakubek and S. Zou, ACS Appl. Mater. Interfaces, 2017, 9, 28911–28921 CrossRef CAS PubMed.
- V. Gies, G. Lopinski, J. Augustine, T. Cheung, O. Kodra and S. Zou, Nanoscale Advances, 2019, 1, 817–826 RSC.
- V. Gies and S. Zou, Toxicol. Res., 2018, 7, 93–101 RSC.
- G. Ciofani, S. Danti, D. D'Alessandro, S. Moscato and A. Menciassi, Biochem. Biophys. Res. Commun., 2010, 394, 405–411 CrossRef CAS PubMed.
- T. Ferreira, L. Hollanda, M. Lancellotti and E. B. de Sousa, J. Biomed. Mater. Res., Part A, 2015, 103, 2176–2185 CrossRef CAS PubMed.
- J. Niskanen, I. Zhang, Y. Xue, D. Golberg, D. Maysinger and F. M. Winnik, Nanomedicine, 2016, 11, 447–463 CrossRef CAS PubMed.
- E. Felley-Bosco and M. MacFarlane, Chem. Res. Toxicol., 2018, 31, 994–1008 Search PubMed.
- V. K. Kodali, J. R. Roberts, M. Shoeb, M. G. Wolfarth, L. Bishop, T. Eye, M. Barger, K. A. Roach, S. Friend, D. Schwegler-Berry, B. T. Chen, A. Stefaniak, K. C. Jordan, R. R. Whitney, D. W. Porter and A. D. Erdely, Nanotoxicology, 2017, 11, 1040–1058 CrossRef CAS PubMed.
Footnotes |
| † Electronic supplementary information (ESI) available. See DOI: 10.1039/c9na00104b |
| ‡ These authors contributed equally. |
| This journal is © The Royal Society of Chemistry 2019 |