 Open Access Article
Porous reduced graphene oxide (rGO)/WO3 nanocomposites for the enhanced detection of NH3 at room temperature†
G.
Jeevitha
a,
R.
Abhinayaa
a,
D.
Mangalaraj
 *a,
N.
Ponpandian
 a,
P.
Meena
b,
Veena
Mounasamy
 c and
Sridharan
Madanagurusamy
 c
c
aDepartment of Nanoscience and Technology, Bharathiar University, Coimbatore 641 046, India. E-mail: dmraj800@yahoo.com
bDepartment of Physics, PSGR Krishnammal College for Women, Coimbatore 641 004, India
cFunctional Nanomaterials & Devices Laboratory, Centre for Nanotechnology and Advanced Biomaterials, School of Electrical & Electronics Engineering, Shanmugha Arts, Science, Technology and Research Academy (SASTRA), Thanjavur-613 401, India
First published on 27th February 2019
Abstract
Incorporation of reduced graphene oxide (rGO) modifies the properties of semiconducting metal oxide nanoparticles and makes it possible to tune the surface area and pore size to optimum values, which in turn improves their gas sensing properties. In this work, to improve the ammonia (NH3) gas sensing characteristics, reduced graphene oxide (rGO) was incorporated into tungsten oxide (WO3) nanospheres using a simple ultrasonication method. The rGO–WO3 nanocomposites exhibited porous nanosheets with nanospherical WO3 as observed with field-emission scanning electron microscopy (FE-SEM). The oxidation state of the rGO–WO3 nanocomposite was determined using X-ray photoelectron spectroscopy (XPS). Three ratios of (1, 5 and 10% rGO/WO3) nanocomposites and pure WO3 showed good selectivity towards NH3 at 10–100 ppm, and more remarkably at room temperature in the range of about 32–35 °C and at a relative humidity (RH) of 55%. The limit of detection (LOD) of the synthesized rGO–WO3 nanocomposites was 1.14 ppm, which will highly favour low detection ranges of NH3. The sensor response was 1.5 times higher than that of the bare WO3 nanospheres. The sensors showed excellent selectivity, ultrafast response/recovery times (18/24 s), reproducibility and stability even after one month of their preparation. We believe that metal oxides using the rGO modifier can improve the sensitivity and reduce the LOD towards NH3 and can be used effectively in real-time environmental monitoring.
1 Introduction
Today's fast industrial development and intense use of vehicles have caused severe air and water pollution. Volatile organic compounds (VOCs) like acetone, ethanol and formaldehyde and toxic gases such as, ammonia (NH3), hydrogen sulfide (H2S) and nitrogen oxide (NO2, NO and N2O) are the major pollutants, which have hazardous effects on both human health and the environment.1 These toxic compounds are released every day from different sources into the environment and it is very essential to detect them to minimize their harmful effects.2 NH3, accounted to be a very toxic gas, has been identified as the origin for many serious respiratory diseases. With the rapid developments in technology, the use of NH3 has become unavoidable, especially in applications like production of explosives employed in defense, fuels for automobiles, fertilizer and in food processing. The long-term acceptable exposure limit of NH3 is around 50 ppm, as reported by the occupational safety and health administration (OSHA).3–5 Exposure to NH3 above this limit may lead to serious health issues. Thus, selective and sensitive detection of NH3 is a vital safety measure for a pollution-free ecosystem. In this regard, it is essential to develop a reliable, cost-effective and ultrasensitive NH3 sensing device, which can work at room temperature.6A number of studies based on metal oxide semiconductor nanoparticles, like zinc oxide (ZnO), tin oxide (SnO2), indium oxide (In2O3), tungsten oxide (WO3), molybdenum oxide (MoO3) and vanadium oxide (V2O5) were conducted towards the development of NH3 gas sensors.7–10 Among these metal oxides, WO3, an n-type semiconductor, is considered as a forefront material for chemiresistive gas sensing application. The sensing effects of WO3 nanoparticles are determined by the capability of tungsten ions to change their valence state upon oxidation/reduction. The oxygen vacancy sites, related to sub-stoichiometric WO3−x, act as active sites for chemisorption and easily regulate the sensing effects of the WO3 nanoparticles as well as the changeable sensibility of these particles with respect to analyte molecules.2,11 However, most of the WO3 nanoparticle based NH3 sensors work in the high temperature range of about 50–350 °C and other factors like high response and recovery times, high resistivity and low surface area restrict the use of WO3 in practical sensing applications. But, the need of the hour is room temperature (RT) sensors with fast response/recovery times and selectivity.12
The hurdles in the usage of semiconducting metal oxides (SMOs) in sensors can be surmounted by compositing them with carbon-based materials. In particular, the outstanding properties of graphene such as, its large specific surface area, chemical functionalities and fast electron transportation kinetics at room temperature ensure that it can be combined very well with SMOs for the fabrication of RT gas sensors. Moreover, SMO/graphene based nanocomposites are being continuously explored in different fields such as electrochromic smart windows, gas and biosensors and photocatalytic and energy storage applications.13–18
Jinjin Shi et al. synthesized graphene oxide/hexagonal WO3 nanosheet composites for the detection of H2S and the sensors employing these nanocomposites showed a low detection limit of 10 ppb at a temperature of about 330 °C.19 Tarcisio M. Perfecto et al. explored WO3·0.33H2O nano-needles and their composites with rGO for detecting isopropanol down to 1 ppm at room temperature.20 Xiaoqian et al. successfully employed the one-step hydrothermal method to prepare WO3 nanorods/graphene nanocomposites, which exhibited sensitivity towards NO2 up to 25 ppb at 300 °C.21 Jasmeet Kaur et al. fabricated rGO/WO3 nanocomposite films, which could detect as low as 1 ppm of acetone in air and exhibited a maximum sensing response at a lower working temperature (200 °C).22 Ruma Ghosh et al. developed rGO/SnO2 hybrid-sensing layers by ultrasonication mixing and studied their sensing performance towards NH3 at room temperature.23 Huiling Tai et al. designed ZnO/rGO bilayer films, which offered excellent NH3 (10–50 ppm) detection at room temperature with fast response/recovery times.24 All these studies indicate that the incorporation of porous rGO into WO3 could lead to ultrasensitive NH3 sensing properties making WO3 an ideal candidate for gas sensing. To the best of our knowledge, no previous reports are available on NH3 sensing using porous rGO/WO3 nanocomposites at room temperature. For confirmation, previously reported literature is listed in ESI Table 1 (ST1†).
In the present work, porous rGO/WO3 nanocomposites were prepared via the ultrasonication method and examined for effective sensing and selective trace level detection of NH3 at room temperature. The WO3 nanospheres were uniformly distributed on the porous rGO sheets and the sheets showed good affinity towards WO3 nanospheres. The obtained sensing results were compared with those of pure WO3 nanospheres. The porous rGO/WO3 nanocomposite sensor revealed outstanding enhancement in NH3 sensing when compared with the pure WO3 sensor. Structural, morphological and electrical measurements were carried out. The possible sensing mechanism was elucidated in detail. The present work will make a major impact on the room temperature sensing of NH3.
2. Experimental section
2.1 Synthesis of WO3 nanostructures and GO
The detailed synthesis methodology and scheme for the preparation of pure WO3 nanospheres are reported in the ESI (Fig. S1 and ST2†). The preparation of GO and rGO has already been reported in our earlier studies.15,252.2 Synthesis of rGO/WO3 nanocomposites
Three different weight percentages (1%, 5% and 10%) of rGO were loaded into the prepared WO3 nanospheres. In a typical synthesis process, the required quantities of the prepared WO3 nanospheres were dispersed using ethanol and sonicated for 20 min. Next, 1% of rGO was dispersed using water and sonicated for 30 min to obtain a homogeneous dispersion. The dispersed rGO solution was then slowly added into the WO3 solution and the mixture was kept in an ultrasonic bath for 1 h to exfoliate a few layers of reduced graphene oxide, which resulted in the formation of a 1% porous rGO/WO3 nanocomposite. Changing the amount of rGO suitably resulted in the formation of 5% and 10% rGO/WO3 nanocomposites. The as-obtained products were labeled as 1% rGO/WO3, 5% rGO/WO3 and 10% rGO/WO3.14,25 The schematic representation of the formation of porous rGO/WO3 nanocomposites is shown in Fig. 1.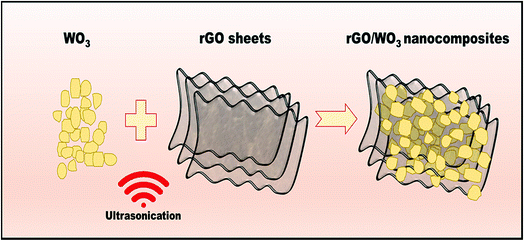 | ||
| Fig. 1 Schematic representation of rGO/WO3 nanocomposite formation using the ultrasonication method. | ||
2.3 Characterization
The structural analysis was done using X-ray Diffraction techniques (XRD, Rigaku Smart Lab) with Cu-Kα radiation (1.5406 Å). The elemental and morphological analyses were done using field emission scanning electron microscopy (FESEM, FEI Quanta 250 FEG). Raman spectra of the prepared nanostructures were recorded using a Horiba Jobin Yvon LABRAM-HR 800 spectrometer with an argon laser at an excitation wavelength of 514 nm. The photoluminescence (PL) spectra were obtained by using a FLUOROLOG, Horiba Jobin Yvon spectrophotometer. The composition and electronic state of the material were recorded using X-ray Photoelectron Spectroscopy ((XPS) Kratos analytical, ESCA-3400, Shimadzu) with an X-ray source (Mg Kα, 1253.6 eV). BET surface area analysis was performed using a BELSHORP MINI II (BEL Japan).2.4 Fabrication of nanocomposite thin films by spin coating
The prepared materials were ultrasonicated and thin film deposition of these materials was done using the spin coating technique. The obtained nanocomposites (1% rGO/WO3, 5% rGO/WO3 and 10% rGO/WO3) were subjected to uniform dispersion by ultrasonication for 10 min. The deposition of uniform rGO/WO3 nanocomposite thin films on pre-cleaned glass substrates (1 × 2 cm) was carried out using a spin coater.26,272.5 Gas-sensing capacity measurements of the fabricated sensors
For sensing measurements, highly conductive silver paste and copper wire were used to establish contacts on the spin coated thin film samples. The copper wires were connected to a high resistance electrometer (Keithley 6517B) interfaced with a computer using RS232 cable for recording the resistance. Room temperature sensing studies were done using a customized sensing chamber. The schematic diagram of the gas sensing set up and the complete measurement details are given elsewhere.7,283. Results and discussion
3.1 Synthesis and characterization of rGO/WO3 nanocomposites
XRD analysis was performed to study the purity and crystal structures of the prepared samples. XRD spectra of pure WO3 nanospheres, GO and rGO are shown in Fig. S2(A & B†). The typical diffraction peaks obtained (Fig. S2A† and 2) in this study indicate the monoclinic phase of WO3 and they are in good agreement with the Joint Committee of Powder Diffraction Standards (JCPDS card no. 89-4476). The characteristic peaks at 23.12°, 23.59° and 24.38° correspond to (0 0 2), (0 2 0) and (2 0 0) orientations respectively. The peaks of all the samples (1%, 5% and 10% rGO/WO3 nanocomposites) occur at nearly the same angle, indicating the successful replication of material formation. No noticeable peak corresponding to rGO is seen and this is owing to the lower percentage of rGO incorporation into WO3. This result is in agreement with earlier reports.18 We further performed Raman spectroscopy, XPS analysis and FESEM to confirm the presence of porous rGO in the obtained rGO/WO3 nanocomposites. The sharp and high intensity reflection peaks obtained for all three samples indicate their highly crystalline nature as well as the phase purity of the prepared samples, which means that the rGO incorporation does not change the phase of WO3.25 The average grain sizes were calculated for all the samples (1%, 5% and 10% rGO/WO3 nanocomposites) using the Scherrer formula and were found to be in the ranges from 42 to 45, 46 to 50 and 39 to 43 nm for 1%, 5% and 10% rGO/WO3 respectively.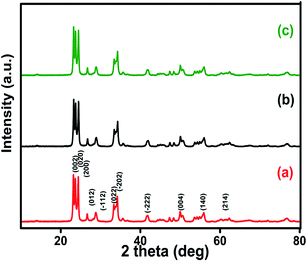 | ||
| Fig. 2 Powder XRD spectra of different weight percentages of 1%, 5% and 10% rGO/WO3 nanocomposites: (a) 1% rGO/WO3, (b) 5% rGO/WO3 and (c) 10% rGO/WO3. | ||
The Raman spectrum of graphene is useful in understanding defects, phonons, phonon–electron interactions and electron–electron interactions and identifying the number of layers of graphene. WO3 is a non-linear type of molecule like ReO3, which consists of corner-sharing packed WO6 octahedra. It comprises 4 atoms and 6 fundamental normal modes of vibration with the space group P21/n (C2h) and exhibits a monoclinic structure.29,30 In the present study, five Raman active modes have been observed experimentally for pure WO3 and D, G, and 2D bands for GO and rGO as shown in Fig. S3(A and B†). In Fig. 3, the sharp intense peaks at 709 and 807 cm−1 correspond to the stretching vibration of O–W–O, whereas the peaks at 264 and 328 cm−1 relate to the bending vibration of W–O–W. The peak at 131 cm−1 is assigned to the lattice vibration of crystalline WO3 and the additional low intensity peaks belong to D and G bands, which denote the presence of porous rGO in the nanocomposite.25 The D band at 1346 cm−1 corresponds to the defect originated in the graphene structure and the G band at 1535 cm−1 is due to the scattering of sp2 carbon atoms from the graphene lattice. The disordered crystal structure of graphene is strongly indicated by the intensity ratio (ID/IG) between the D and G bands. The value of ID/IG for the 10% rGO/WO3 is the highest (1.0), while its values are 0.9 and 0.7 for 5% and 1% rGO/WO3 respectively. This is due to the decrease in the C (sp2) area for the lower concentrations of rGO. In addition to this, the improved intensity of D and G bands for higher percentages of rGO confirms the formation of different weight percentages (1%, 5% and 10%) of rGO/WO3 nanocomposites.
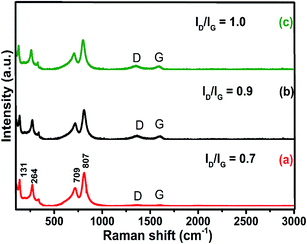 | ||
| Fig. 3 Raman spectra of different weight percentages of nanocomposites (1%, 5% and 10% rGO/WO3): (a) 1% rGO/WO3, (b) 5% rGO/WO3 and (c) 10% rGO/WO3. | ||
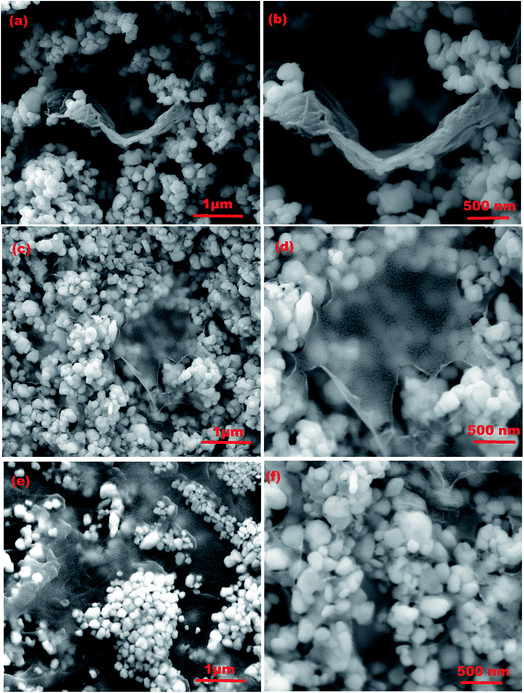
Detailed confirmation about the size, typical morphologies and elemental percentage of the synthesized WO3, GO and rGO nanostructures was obtained by FESEM and EDAX analyses (Fig. S4(a–f)†). Fig. 4(a–f) show the FESEM images of rGO/WO3 nanocomposites with different percentages of rGO content (1%, 5% and 10%) at low and high magnifications. The rGO/WO3 nanocomposite reveals uniform dispersion of WO3 on the ultrathin porous graphene sheet and the average diameter of the WO3 nanospheres is about 120–130 nm. During ultrasonication, the rGO sheets are well dispersed. Transparent thin layered and wrinkled sheets are uniformly incorporated into WO3 due to a strong Van der Waal's interaction occurring between rGO and WO3.15 Besides, rGO incorporation prevents agglomeration of WO3 nanospheres and therefore maintains a high surface area.25
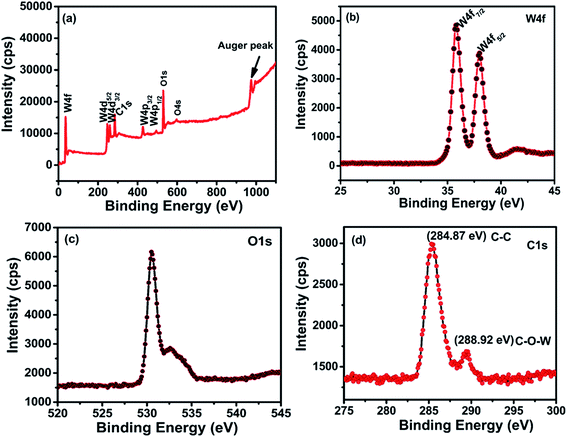
The chemical binding states of rGO/WO3 nanocomposites and the stoichiometry of tungsten and surface elements of the nanocomposites were studied using the X-ray photoelectron spectra (XPS). The phase and chemical structure of all the nanocomposites are similar (confirmed by XRD, Raman and EDAX), except the percentage of rGO incorporation (1%, 5% and 10%). XPS analysis of the 5% rGO/WO3 nanocomposite (Fig. 5(a)) shows four major peaks at 35.7, 37.9, 530.4 and 284.87 corresponding to tungsten, oxygen and carbon and they indicate the formation of the nanocomposite. It is clear that the sample consists of only W, O and C, with no other impurities.31
The W 4f and O 1s core level spectra are shown in Fig. 5(a–c). The W 4f core level corresponds to binding energies 35.7 and 37.9 eV for W 4f7/2 and W 4f5/2 respectively with a spin-orbit separation (W 4f7/2–W 4f5/2) of about 2.2 eV. The binding energy positions are the basic indicators for the W6+oxidation state of WO3, which are in agreement with the previous report.32 The O 1s spectrum (Fig. 5(c)) shows two peaks positioned at 530.4 and 532.5 eV. The former peak with maximum intensity is due to the W![[double bond, length as m-dash]](https://www.rsc.org/images/entities/char_e001.gif) O bonding modes of WO3 corresponding to oxygen atoms O2− in the lattice. The latter small peak is due to the free oxide surfaces in contact with the atmosphere. This indicates the formation of oxygen deficiencies in the nanocomposite. Further, the C 1s shows two peaks at 284.7 and 288.92 eV as seen in Fig. 5(d), which correspond to the binding states of the C
O bonding modes of WO3 corresponding to oxygen atoms O2− in the lattice. The latter small peak is due to the free oxide surfaces in contact with the atmosphere. This indicates the formation of oxygen deficiencies in the nanocomposite. Further, the C 1s shows two peaks at 284.7 and 288.92 eV as seen in Fig. 5(d), which correspond to the binding states of the C![[double bond, length as m-dash]](https://www.rsc.org/images/entities/char_e001.gif) C and C–O–W bonds in the nanocomposite respectively. The absence of any other peaks confirms the successful formation of the nanocomposite.11,33,34
C and C–O–W bonds in the nanocomposite respectively. The absence of any other peaks confirms the successful formation of the nanocomposite.11,33,34
The pore size distribution and specific surface area (SSA) of WO3 with different weight percentages of rGO content were studied using adsorption–desorption analysis.35,36Fig. 6(a–c) show the BET surface area and corresponding BJH pore size distribution of the pure WO3 and different weight percentage nanocomposites (1% and 5% rGO/WO3). Surprisingly, all the samples show type IV isotherms, indicating the formation of mesoporous materials with a relative pressure between 0.1 and 0.9. Specific surface areas of 9.96, 12.53 and 21.464 m2 g−1 with an average pore size distribution of 25.79, 31.68 and 29.41 nm are observed for the pure WO3, 1% and 5% rGO/WO3 respectively.23 This result supports the enhanced performance of the 5% rGO/WO3 nanocomposite and the slight decrease in pore size may be due to the incorporation of a greater number of graphene layers.
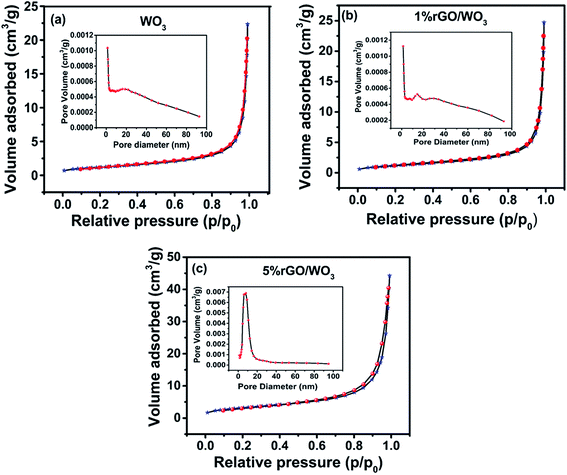 | ||
| Fig. 6 Nitrogen-adsorption/desorption isotherms and corresponding pore size distribution of (a) pure WO3, (b) 1% rGO/WO3 and (c) 5% rGO/WO3. | ||
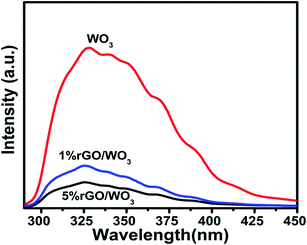
The photoluminescence (PL) spectra are used to study the structural defects and to understand the transfer and recombination processes of photoexcited charge carriers of the prepared nanocomposites. The strongest PL emission peaks appear at 328, 326 and 325 nm (Fig. 7) for WO3, and 1% and 5% rGO/WO3 nanocomposites respectively and they are associated with near-band edge emission (UV-emission). The other small peaks appearing at 414, 409 and 405 nm are attributed to the abundant incorporation of oxygen defects into the prepared WO3 and rGO/WO3 nanocomposite. The PL intensity obtained for 5% rGO/WO3 is six times lower than that for pure WO3 nanospheres and 3 times lower than that for the 1% rGO/WO3 nanocomposite showing a drastic quenching after the introduction of rGO, which is clearly observed in Fig. 7(a–c). When the samples were excited at 290 nm, the PL peak intensities for the three samples were in the following order: WO3 > 1% rGO/WO3 > 5% rGO/WO3. The quenching effect in the nanocomposite is due to the large contact between the WO3 nanospheres and rGO nanosheets, which might be due to the 2D and π–π conjugated structure of rGO. The rGO/WO3 nanocomposites can efficiently hinder the recombination of electron–hole pairs and strongly support the electron transfer from the conduction band of WO3 to the electronic states of rGO. Various researchers have reported similar results on metal oxide/rGO nanocomposites.25,37–39 In the present analysis, the emission peaks are observed to be blue shifted when compared with earlier reports.40 This might be due to the influence of quantum confinement effect in WO3.
Fig. S5† shows the linear behavior of the current–voltage characteristics of pure WO3 and the 5% rGO/WO3 nanocomposite. Here, the I–V measurements were carried out between −20 and +20 V. It is observed from the characteristics that the 5% rGO/WO3 nanocomposite shows the greatest linearity, which confirms the good ohmic contact between the sensing materials and Cu wire.41,42
3.2 Gas sensing performance
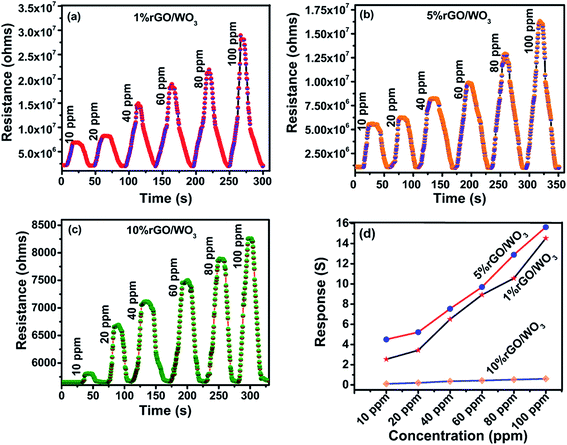
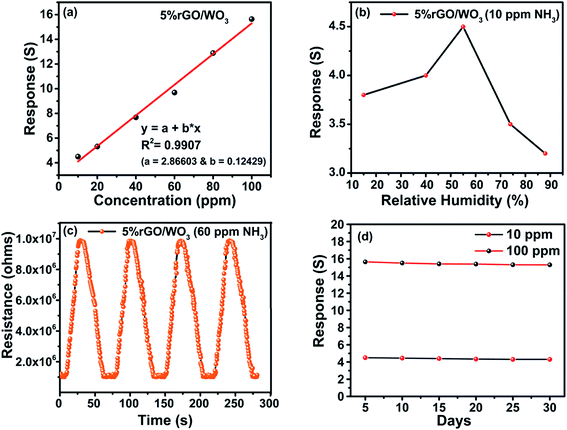
As previously reported, the rGO/WO3 nanocomposite is a promising candidate for detecting many toxic gases such as NO2, H2S, acetone and so on.43–46 In the present work, sensing of NH3, as the target vapour is demonstrated using rGO/WO3 nanocomposites. So far, there are no specific reports on the use of rGO/WO3 nanocomposites towards NH3 sensing at room temperature. Fig. 8(a–d) show the influence of different percentages of rGO (1%, 5% and 10%) in the rGO/WO3 nanocomposite based chemiresistive-type sensor towards the detection of different concentrations (10, 20, 40, 60, 80 and 100 ppm) of the reducing vapour NH3 at 35 °C (RH: 54%). For comparison, different morphologies (nanorods, nanospheres and aggregated nanoparticles) of pure WO3 towards the detection of NH3 were also tested and their dynamic response cure, response and recovery times, sensitivity and selectivity characteristics of the samples are shown in Fig. S6(a–f).† Increase in the percentage of rGO content leads to an increase in conductivity and therefore a noticeable change (decrease) in the resistance value (Fig. 8), which clearly confirms the incorporation of different percentages of rGO into the WO3 nanospheres. When the rGO/WO3 nanocomposite is exposed to different concentrations (10–100 ppm) of NH3, an increase in the resistance value is observed (Fig. 8(a–c)). This indicates the p-type behavior of the sensing element. However, the resistance of the pure WO3 based sensor decreased (Fig. S6(a–c)†) when exposed to NH3 indicating the n-type behavior of WO3. The sensing response of rGO/WO3 nanocomposites towards NH3 is shown in Fig. 8(d). The 5% rGO/WO3 nanocomposite shows the maximum response when compared with the other two percentages of the nanocomposites and pure WO3. The response values of the 5% rGO/WO3 nanocomposite are 4.50, 5.22, 7.53, 9.69, 12.88 and 15.83 for different concentrations of NH3 such as 10, 20, 40, 60, 80 and 100 ppm, respectively. The sensor response value is in the following order: 5% rGO/WO3 > 1% rGO/WO3 > WO3 > 10% rGO/WO3 as seen from Fig. 8(d) and S6(d).† To evaluate the sensing performance of rGO/WO3 nanocomposites, the sensitivity (S) was calculated using the formula,| S = Rg − Ra/Ra, | (1) |
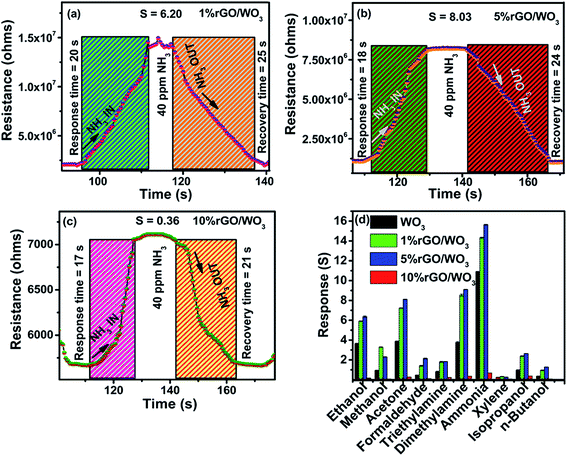
Further, the single transient response/recovery times of all the prepared rGO/WO3 sensors on exposure to 40 ppm NH3 are displayed in Fig. 9(a–c). The response and recovery times of the sensor are respectively defined as the times taken to reach 90% of its stable resistance value on exposure to target vapour and to reach 10% of its baseline resistance value when exposed to an air atmosphere.47–49
The pure WO3 sensor shows a response time of 165 s and recovery time of 132 s, which are shown for comparison in Fig S6(e).† However, the response and recovery times of the prepared sensor are 18 s and 24 s respectively. From these observations, one can confirm that this trend is due to the influence of concentration. Increased NH3 concentration results in faster adsorption on the nanocomposite surface, which leads to a decrease in response time; on the other hand, adsorption of a higher concentration of NH3 slightly prolonged the desorption at room temperature.
It is important to study the selectivity of the prepared material. In this work, ten different compounds, such as, ammonia (NH3), ethanol (C2H6O), methanol (CH3OH), isopropyl alcohol (C3H8O), formaldehyde (CH2O), acetone (C3H6O), triethylamine (C6H15N), dimethylamine (CH3)2NH, xylene (C8H10) and n-butanol (C4H10O) vapours at 100 ppm concentration have been tested. From Fig. 9(d), it is evident that all the rGO/WO3 nanocomposites and pure WO3 selectively detected NH3. Details of the size of each molecule and the dipole moments of all the probable interfering compounds are listed in Table 1. It is evident that the molecular sizes of all the other gases are large when compared to NH3 and this is the reason for its higher permeation ability and hence a higher response and selectivity. NH3 molecules rapidly donate electrons to the rGO/WO3 nanocomposite surface even at room temperature compared to other vapours. This might be another important reason for its selectivity. Especially, the 5% rGO/WO3 nanocomposite has a good selectivity and the highest response to NH3 when compared to the other two percentages of rGO/WO3 nanocomposites and pure WO3. The response values of WO3, and 1%, 5% and 10% rGO/WO3 towards 100 ppm NH3 are 10.5, 14.53, 16.0 and 0.60 respectively.
The 5% rGO/WO3 nanocomposite exhibited an excellent sensing capacity towards NH3, which is 1.5 times higher than that of WO3 nanostructures. Moreover, the rGO/WO3 nanocomposite has a high surface area, which leads to more active reaction sites and an obvious increase in the sensor performance.35 However, the sensing properties are strongly influenced by the rGO content; increasing the rGO content beyond 5% decreases the sensor response. The increase in rGO content beyond 5% leads to an increase in the graphene layer, which fully covers the WO3 surface by wrapping the active sites. Therefore, there is a significant reduction in the electrical resistance and an extreme decrease in the sensor response. A similar result is reported by Perfecto et al.20 towards detection of isopropanol down to 1 ppm. Based on the above discussions, the NH3 sensing properties of the 5% rGO/WO3 nanocomposite and its basic sensor characteristics such as, LOD, RH, reproducibility, and stability were studied.
In addition to high sensitivity and selectivity, a good gas sensor needs a good limit of detection (LOD), relative humidity value (RH%), reproducibility and stability.41 When the NH3 concentration increases, the response value of the sensor proportionally increases. The 5% rGO/WO3 nanocomposite sensor shows (Fig. 10(a)) a linear response on increasing the concentration of NH3. The sensor has an R2 (coefficient of determination) value of 0.9907 as illustrated in Fig. 10(a). The LOD of the 5% rGO/WO3 nanocomposite is calculated using the following formula,
| LOD = 3σ/S | (2) |
To prove the validity of the results obtained from the present work, the observed room temperature NH3 sensing properties of rGO/WO3 nanocomposites are compared with the earlier reports and the data are presented in ST3.† The present work on rGO/WO3 confirms superior sensing properties, ultrafast response and recovery, selectivity and stability towards NH3 specifically at room temperature. Three possible reasons have been proposed, which might be responsible for the enhancement in the sensor response.
(i) The porosity and specific surface area have a significant impact on the gas–solid interaction and provide more active sites for reactions. The obtained BET results proved that the enhancement in sensing performance of the 5% rGO/WO3 nanocomposite is due to the improved specific surface area and pore size of the 5% rGO/WO3 nanocomposite when compared to pure WO3.20
(ii) In gas sensing, the depletion layer formation is directly related to the available number of oxygen vacancies in the rGO/WO3 nanocomposite surface, because oxygen vacancies act as electron capturers, which result in a decrease in the recombination process and they also act as preferential adsorption sites for VOCs and gas molecules.16,23 On the basis of the PL intensity quenching, we conclude that the 5% rGO/WO3 nanocomposite leads to a reduction in charge recombination and this might be another reason for the enhancement in sensing performance of the 5% rGO/WO3 nanocomposite.
(iii) Finally, the p–n heterojunction facilitates electron transfer from the conduction band of WO3 to the electronic states of rGO and strongly hinders the recombination of electron–hole pairs. In addition to this, the ohmic contact helps in the continuous convenient flow of charge carriers at the interfaces of rGO and WO3.43–46,56–58 This ohmic contact formation is the additional reason for the enhanced sensing performance of the 5% rGO/WO3 nanocomposite.
The pore size, specific surface area, p–n heterojunction and ohmic contact formation were studied from the BET, PL and I–V analyses of the prepared rGO/WO3 nanocomposites and the pure WO3 and the results support the enhancement of the sensor response (Fig. 6 and 7). These three characteristics function together to improve the response of rGO/WO3 nanocomposite based NH3 sensors at room temperature.
3.3 Gas sensing mechanism
Based on the above results, it can be said that the vapour sensing mechanism of metal oxide/rGO nanocomposites is governed by many factors, such as sensor porosity, specific surface area and heterojunction formation. Semiconductor metal oxide based sensors work on the principle of the change in resistance owing to the reaction among gas molecules and the sensitive surface. This involves surface reaction, gas adsorption, and desorption processes.59 This process is completely temperature dependent. At temperatures below 100 °C or at room temperature, a single molecular oxygen absorbs only one electron and forms a molecular ionic oxygen species (O2−), but above 100 °C, it is capable of absorbing two electrons to form atomic oxygen species (O- and O2−).47The possible room temperature sensing mechanism of pure WO3 towards NH3 is as follows,
| O2 (atmosphere) + e− (WO3 surface) → O2− (WO3 surface) | (3) |
Initially when the WO3 surface is exposed to an air atmosphere, the oxygen molecules are adsorbed on the WO3 surface by capturing the electrons, which modulates the surface carrier concentration, leading to the formation of an enlarged electron depletion region. This results in a stabilized baseline resistance. Moreover, on exposure of the WO3 surface to the NH3 reducing vapour, the pre-adsorbed oxygen reacts with NH3 to produce N2 and H2O at room temperature. The resistance of the sensing element decreases due to the removal of chemisorbed oxygen, which obeys the n-type behaviour of WO3. As a result, the trapped electrons are released into the conduction band of WO3, thus improving the carrier concentration. As a consequence, the baseline resistance decreases, leading to a decrease in the width of the depletion region.60 The main reaction between WO3 and NH3 based on the above discussions is given below:
| 4NH3 + 3O2− (WO3 surface) → 2N2 + 6H2O + 6e− | (4) |
However, in the case of rGO/WO3 nanocomposites, WO3 is an n-type semiconductor and rGO behaves like p-type. It is well known that the n and p type materials are dominated by electrons and holes respectively. Once they come into contact with each other, a depletion layer is formed at the interface which is a p–n heterojunction. The rGO/WO3 sensor shows p-type behavior towards NH3 detection. rGO possesses a higher work function and defects in the prepared nanocomposite surface, which will provide many adsorption centers for NH3. Therefore, when the sensor surface is exposed to NH3, the NH3 molecules are adsorbed on the composite surface, and the interaction between adsorbed O2− and NH3 releases free electrons and neutralizes the holes in the rGO which contributes to reduction in the width of charge conduction channels, leading to the increase in the width of the electron depletion layer (as shown in Fig. 11) and hence an increase in sensor resistance.
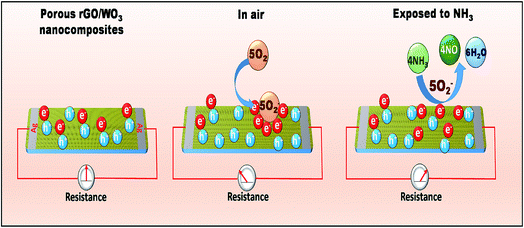 | ||
| Fig. 11 Schematic representation of the gas sensing mechanism of the rGO/WO3 nanocomposite towards NH3 at room temperature. | ||
The results of the present work on NH3 sensing are of immense importance due to the highly improved sensor response of rGO/WO3 nanocomposites at room temperature when compared to the earlier report.9 These results are in concurrence with those of Zhang et al.61
4 Conclusions
Porous and conductive rGO/WO3 nanocomposites were fabricated by a simple ultrasonication method. The structural, morphological, vibrational, compositional and optical properties confirm the formation of the nanocomposite. The 5% rGO/WO3 nanocomposite shows enhanced sensing performance towards NH3, which is attributed to the increased surface area and pore size of the nanocomposite when compared to pure WO3 nanospheres. The voids in the graphene sheet may provide excellent permeability to NH3 due to physisorption. Moreover, the incorporation of WO3 into 2D structures provides a greater number of reactive sites for selective and sensitive detection of NH3. Additionally, the 5% rGO/WO3 nanocomposite sensor was found to be highly selective towards NH3 in the presence of possible interfering gases and exhibited remarkable stability and repeatability at room temperature. The obtained data clearly show that the surface area, pore size, p–n heterojunction and ohmic contact play important roles in the enhancement of sensor performance towards NH3 detection.Conflicts of interest
There are no conflicts to declare.Acknowledgements
The authors would like to thank the Shanmugha Arts, Science, Technology and Research Academy (SASTRA), Thanjavur, India for providing their lab facilities to carry out the sensing work. The authors also wish to express their sincere thanks to the UGC for providing financial support through the UGC-BSR faculty fellowship and DST-FIST, DST-PURSE and UGC-SAP, Government of India, for providing the instrumentation facilities. The authors extend their thanks to METROHM INDIA ltd for their BET characterization facility.References
- A. Mane, S. Kulkarni, S. Navale, A. Ghanwat, N. Shinde, J. Kim and V. Patil, NO2 sensing properties of nanostructured tungsten oxide thin films, Ceram. Int., 2014, 40, 16495–16502, DOI:10.1016/j.ceramint.2014.08.001.
- V. K. Tomer, S. Duhan, A. K. Sharma, R. Malik, S. Jangra, S. P. Nehra and S. Devi, Humidity-Sensing Properties of Ag0 Nanoparticles Supported on WO3–SiO2 with Super Rapid Response and Excellent Stability, Eur. J. Inorg. Chem., 2015, 5232–5240, DOI:10.1002/ejic.201500858.
- S. Y. Cho, H. J Koh, H. W. Yoo, J. S. Kim and H. T. Jung, Tunable Volatile–Organic-Compound Sensor by Using Au Nanoparticle Incorporation on MoS2, ACS Sens., 2017, 2, 183–189, DOI:10.1021/acssensors.6b00801.
- Z. Wang, C. Hou, Q. De, F. Gu and D. Han, One-Step Synthesis of Co-Doped In2O3 Nanorods for High Response of Formaldehyde Sensor at Low Temperature, ACS Sens., 2018, 3, 468–475, DOI:10.1021/acssensors.7b00896.
- R. K. Jha, M. Wan, C. Jacob and P. K. Guha, Ammonia vapour sensing properties of in situ polymerized conducting PANI-nanofiber/WS2 nanosheet composites, New J. Chem., 2017, 42, 735–745, 10.1039/c7nj03343e.
- S. Pandey and K. K. Nanda, Au Nanocomposite Based Chemiresistive Ammonia Sensor for Health Monitoring, ACS Sens., 2016, 1, 55–62, DOI:10.1021/acssensors.5b00013.
- C. S. Rout, M. Hegde, A. Govindaraj and C. N. R. Rao, Ammonia sensors based on metal oxide nanostructures, Nanotechnology, 2007, 18, 205504, DOI:10.1088/0957-4484/18/20/205504.
- V. Srivastava and K. Jain, Mechanism of enhancement in NH3 sensing for surface functionalized WO3 film, RSC Adv., 2015, 5, 56993–56997, 10.1039/c5ra11050e.
- Y. Zhou, K. Zheng, J.-D. Grunwaldt, T. Fox, L. Gu, X. Mo, G. Chen and G. R. Patzke, W/Mo–Oxide Nanomaterials: Structure–Property Relationships and Ammonia-Sensing Studies, J. Phys. Chem. C, 2011, 115(4), 1134–1142, DOI:10.1021/jp106439n.
- V. Mounasamy, G. K. Mani, D. Ponnusamy, K. Tsuchiya, A. K. K. Prasad and M. Sridharan, Template Free Synthesis of Vanadium Sesquioxide (V2O3) Nanosheets and its Room Temperature Sensing Performance, J. Mater. Chem. A, 2018, 6, 6402–6413, 10.1039/c7ta10159g.
- S. Poongodi, P. S. Kumar, Y. Masuda, D. Mangalaraj, N. Ponpandian, C. Viswanathan and S. Ramakrishna, Synthesis of hierarchical WO3 nanostructured thin films with enhanced electrochromic performance for switchable smart windows, RSC Adv., 2015, 5, 96416–96427, 10.1039/c5ra19177g.
- D. D. Nguyen, D. V. Dang and D. C. Nguyen, Hydrothermal synthesis and NH3 gas sensing property of WO3 nanorods at low temperature, Adv. Nat. Sci.: Nanosci. Nanotechnol., 2015, 6, 035006, DOI:10.1088/2043-6262/6/3/035006.
- H. Zhang, K. Jeon and D. Seo, Equipment-Free Deposition of Graphene-Based Molybdenum Oxide Nanohybrid Langmuir–Blodgett Films for Flexible Electrochromic Panel Application, ACS Appl. Mater. Interfaces, 2016, 33, 6–11, DOI:10.1021/acsami.6b04985.
- H. W. Kim, H. G. Na, Y. J. Kwon, S. Y. Kang, M. S. Choi, J. H. Bang, P. Wu and S. S. Kim, Microwave-Assisted Synthesis of Graphene–SnO2 Nanocomposites and Their Applications in Gas Sensors, ACS Appl. Mater. Interfaces, 2017, 9, 31667–31682, DOI:10.1021/acsami.7b02533.
- G. Bharath, R. Madhu, S. Chen, V. Veeramani, A. Balamurugan, D. Mangalaraj, C. Viswanathan and N. Ponpandian, Enzymatic electrochemical glucose biosensors by mesoporous 1D hydroxyapatite-on-2D reduced graphene oxide, J. Mater. Chem. B, 2015, 3, 1360–1370, 10.1039/c4tb01651c.
- P. Nagaraju, A. Alsalme, A. M. Alkathiri and R. Jayavel, Rapid synthesis of WO3/graphene nanocomposite via in situ microwave method with improved electrochemical properties, J. Phys. Chem. Solids, 2018, 120, 250–260, DOI:10.1016/j.jpcs.2018.04.046.
- S. Ramasamy, P. Nagamony and V. Chinnuswamy, Self-assembled SnO2/reduced graphene oxide nanocomposites via Langmuir–Blodgett technique as anode materials for Li-ion batteries, Mater. Lett., 2018, 218, 295–298, DOI:10.1016/j.matlet.2018.01.177.
- A. Seza, F. Soleimani, N. Naseri, M. Soltaninejad, S. M. Montazeri, S. K. Sadrnezhaad, M. R. Mohammadi, H. A. Moghadam, M. Forouzandeh and M. H. Amin, Novel microwave-assisted synthesis of porous g-C3N4/SnO2 nanocomposite for solar water-splitting, Appl. Surf. Sci., 2018, 440, 153–161, DOI:10.1016/j.apsusc.2018.01.133.
- J. Shi, Z. Cheng, L. Gao, Y. Zhang, J. Xu and H. Zhao, Facile synthesis of reduced graphene oxide/hexagonal WO3 nanosheets composites with enhanced H2S sensing properties, Sens. Actuators, B, 2016, 230, 736–745, DOI:10.1016/j.snb.2016.02.134.
- T. M. Perfecto, C. A. Zito, T. Mazon and D. P. Volanti, Flexible room-temperature volatile organic compound sensors based on reduced graphene oxide-WO3·0.33H2O nano-needles, J. Mater. Chem. C, 2018, 6, 2822–2829, 10.1039/c8tc00324f.
- X. An, J. C. Yu, Y. Wang, Y. Hu, X. Yu and G. Zhang, WO3 nanorods/graphene nanocomposites for high-efficiency visible-light-driven photocatalysis and NO2 gas sensing, J. Mater. Chem., 2012, 22, 8525–8531, 10.1039/c2jm16709c.
- J. Kaur, K. Anand, K. Anand and R. C. Singh, WO3 nanolamellae/reduced graphene oxide nanocomposites for highly sensitive and selective acetone sensing, J. Mater. Sci., 2018, 53, 12894–12907, DOI:10.1007/s10853-018-2558-z.
- R. Ghosh, A. K. Nayak, S. Santra, D. Pradhan and P. K. Guha, Enhanced Ammonia Sensing at Room Temperature with Reduced Graphene Oxide/Tin Oxide Hybrid Film, RSC Adv., 2015, 5(62), 50165–50173, 10.1039/c5ra06696d.
- H. Tai, Z. Yuan, W. Zheng, Z. Ye, C. Liu and X. Du, ZnO Nanoparticles/Reduced Graphene Oxide Bilayer Thin Films for Improved NH3-Sensing Performances at Room Temperature, Nanoscale Res. Lett., 2016, 11, 130, DOI:10.1186/s11671-016-1343-7.
- G. Jeevitha, R. Abhinayaa, D. Mangalaraj and N. Ponpandian, Tungsten oxide- graphene oxide (WO3–GO) nanocomposite as an efficient photocatalyst, antibacterial and anticancer agent, J. Phys. Chem. Solids, 2018, 116, 137–147, DOI:10.1016/j.jpcs.2018.01.021.
- N. Ozer, D. G. Chen and C. M. Lampert, Preparation and properties of spin-coated Nb2O5 films by the sol–gel process for electrochromic applications, Thin Solid Films, 1996, 277, 162–168, DOI:10.1016/0040-6090(95)08011-2.
- D. B. Mitzi, L. L. Kosbar, C. E. Murray, M. Copel and A. Afzali, High-mobility ultrathin semiconducting films prepared by spin coating, Nature, 2004, 428, 299–303, DOI:10.1038/nature02389.
- P. Dhivya, A. K. Prasad and M. Sridharan, Magnetron sputtered nanostructured cadmium oxide films for ammonia sensing, J. Solid State Chem., 2014, 214, 24–29, DOI:10.1016/j.jssc.2013.11.030.
- S. Vidya, S. Solomon and J. K. Thomas, Synthesis and characterisation of MoO3 and WO3 nanorods for low temperature co-fired ceramic and optical applications, J. Mater. Sci.: Mater. Electron., 2015, 26, 3243–3255, DOI:10.1007/s10854-015-2823-8.
- E. Cazzanelli, C. Vinegoni, G. Mariotto, A. Kuzmin and J. Purans, Low-Temperature Polymorphism in Tungsten Trioxide Powders and Its Dependence on Mechanical Treatments, J. Solid State Chem., 1999, 143, 24–32, DOI:10.1006/jssc.1998.8061.
- L. Cheg, Y. Hou, B. Zhang, S. Yang, J. W. Guo, L. Wu and H. G. Yang, Hydrogen-treated commercial WO3 as an efficient electrocatalyst for triiodide reduction in dye-sensitized solar cells, Chem. Commun., 2013, 49, 5945–5947, 10.1039/c3cc42206b.
- S. Poongodi, P. S. Kumar, D. Mangalaraj, N. Ponpandian, P. Meena, Y. Masuda and C. Lee, Electrodeposition of WO3 nanostructured thin films for electrochromic and H2S gas sensor applications, J. Alloys Compd., 2017, 719, 71–81, DOI:10.1016/j.jallcom.2017.05.122.
- J. Zhang, J. P. Tu, X. H. Xia, Y. Qiao and Y. Lu, An all-solid-state electrochromic device based on NiO/WO3 complementary structure and solid hybrid polyelectrolyte, Sol. Energy Mater. Sol. Cells, 2009, 93, 1840–1845, DOI:10.1016/j.solmat.2009.06.025.
- A. P. Shpak, A. M. Korduban, M. M. Medvedskij and V. O. Kandyba, XPS studies of active elements surface of gas sensors based on WO3–X nanoparticles, J. Electron Spectrosc. Relat. Phenom., 2007, 156, 172–175, DOI:10.1016/j.elspec.2006.12.059.
- R. Malik, V. K. Tomer, T. Dankwort, Y. K. Mishra and L. Kienle, Cubic mesoporous Pd–WO3 loaded graphitic carbon nitride (g-CN) nanohybrids: Highly sensitive and temperature dependent VOC sensors, J. Mater. Chem. A, 2018, 6, 10718–10730, 10.1039/c8ta02702a.
- G. Bharath, S. Anwer, R. V. Mangalaraj, E. Alhseinat, F. Banat and N. Ponpandian, Sunlight-Induced photochemical synthesis of Au nanodots on α-Fe2O3@Reduced graphene oxide nanocomposite and their enhanced heterogeneous catalytic properties, Sci. Rep., 2018, 8, 1–14, DOI:10.1038/s41598-018-24066-y.
- J. E. Lee, N. T. Khoa, S. W. Kim, E. J. Kim and S. H. Hahn, Fabrication of Au/GO/ZnO composite nanostructures with excellent photocatalytic performance, Mater. Chem. Phys., 2015, 164, 29–35, DOI:10.1016/j.matchemphys.2015.08.017.
- M. Zare, S. Safa, R. Azimirad and S. Mokhtari, Graphene oxide incorporated ZnO nanostructures as a powerful ultraviolet composite detector, J. Mater. Sci.: Mater. Electron., 2017, 28, 6919–6927, DOI:10.1007/s10854-017-6392.
- Y. Wang, W. Wang, H. Mao, Y. Lu, J. Lu, J. Huang, Z. Ye and B. Lu, Electrostatic self-assembly of BiVO4-reduced graphene oxide nanocomposites for highly efficient visible light photocatalytic activities, ACS Appl. Mater. Interfaces, 2014, 6, 12698–12706, DOI:10.1021/am502700p.
- S. Bai, K. Zhang, X. Shu, S. Chen, R. Luo, D. Li and A. Chen, Carboxyl-directed hydrothermal synthesis of WO3 nanostructures and their morphology-dependent gas-sensing properties, CrystEngComm, 2014, 16, 10210–10217, 10.1039/c4ce01167h.
- D. Maity, K. Rajavel and R. T. R. Kumar, Polyvinyl alcohol wrapped multiwall carbon nanotube (MWCNTs) network on fabrics for wearable room temperature ethanol sensor, Sens. Actuators, B, 2018, 261, 297–306, DOI:10.1016/j.snb.2018.01.152.
- D. Maity and R. T. R. Kumar, Polyaniline Anchored MWCNTs on Fabric for High Performance Wearable Ammonia Sensor, ACS Sens., 2018, 3, 1822–1830, DOI:10.1021/acssensors.8b00589.
- A. Esfandiar, A. Irajizad, O. Akhavan, S. Ghasemi and M. R. Gholami, Pd–WO3/reduced graphene oxide hierarchical nanostructures as efficient hydrogen gas sensors, Int. J. Hydrogen Energy, 2014, 39, 8169–8179, DOI:10.1016/j.ijhydene.2014.03.117.
- S. J. Choi, C. Choi, S. J. Kim, H. J. Cho, M. Hakim, S. Jeon and I. D. Kim, Highly Efficient Electronic Sensitization of Non-oxidized Graphene Flakes on Controlled Pore-loaded WO3 Nanofibers for Selective Detection of H2S Molecules, Sci. Rep., 2015, 5, 1–9, DOI:10.1038/srep08067.
- J. Qin, M. Cao, N. Li and C. Hu, Graphene-wrapped WO3 nanoparticles with improved performances in electrical conductivity and gas sensing properties, J. Mater. Chem., 2011, 21, 17167–17174, 10.1039/c1jm12692j.
- S. Bai, Y. Ma, R. Luo, A. Chen and D. Li, Room temperature triethylamine sensing properties of polyaniline–WO3 nanocomposites with p–n heterojunctions, RSC Adv., 2016, 6, 2687–2694, 10.1039/c5ra20843b.
- R. J. B. Balaguru and B. G. Jeyaprakash, Mimic of a gas sensor, metal oxide gas sensing mechanism, factors influencing the sensor performance and role of nanomaterials based gas sensors, NPTEL – Electrical & Electronics Engineering – Semiconductor Nanodevices, 2004 Search PubMed.
- J. Cao, C. Qin, Y. Wang, H. Zhang, B. Zhang, Y. Gong, X. Wang, G. Sun, H. Bala and Z. Zhang, Synthesis of g-C3N4 nanosheet modified SnO2 composites with improved performance for ethanol gas sensing, RSC Adv., 2017, 7, 25504–25511, 10.1039/c7ra01901g.
- L. Zhang, Q. Fang, Y. Huang, K. Xu, F. Ma and P. K. Chu, Facet-engineered CeO2/graphene composites for enhanced NO2 gas-sensing, J. Mater. Chem. C, 2017, 5, 6973–6981, 10.1039/c7tc01523b.
- J. R. Li, R. J. Kuppler and H. C. Zhou, Selective gas adsorption and separation in metal–organic frameworks, Chem. Soc. Rev., 2009, 38, 1477–1504, 10.1039/b802426j.
- N. Murayama, Nanostructural design of electrically conductive ceramics and its application in gas sensors, J. Ceram. Soc. Jpn., 2008, 116, 1167–1174, DOI:10.2109/jcersj2.116.1167.
- H. Tian, H. Fan, M. Li and L. Ma, Zeolitic Imidazolate Framework Coated ZnO Nanorods as Molecular Sieving to Improve Selectivity of Formaldehyde Gas Sensor, ACS Sens., 2016, 1, 243–250, DOI:10.1021/acssensors.5b00236.
- R. J. W. Le Fevre and P. Russell, The dependence on state of the apparent dipole moments of ammonia, methylamine, dimethylamine, and trimethylamine, Trans. Faraday Soc., 1947, 43, 374–393, 10.1039/tf9474300374.
- J. Hu, C. Zou, Y. Su, M. Li, N. Hu, H. Ni, Z. Yang and Y. Zhang, Enhanced NO2 sensing performance of reduced graphene oxide by in situ anchoring carbon dots, J. Mater. Chem. C, 2017, 5, 6862–6871, 10.1039/c7tc01208j.
- X. Song, F. Sun, S. Dai, X. Lin, K. Sun and X. Wang, Hollow NiFe2O4 microspindles derived from Ni/Fe bimetallic MOFs for highly sensitive acetone sensing at low operating temperature, Inorg. Chem. Front., 2018, 5, 1107–1114, 10.1039/c8qi00043c.
- L. Maa, H. Fana, X. Wei, S. Chen, Q. Hu, Y. Liu, C. Zhi, W. Lu, J. Antonio Zapien and H. Huang, Towards High Areal Capacitance, Rate Capability and Tailorable Supercapacitor: Co3O4@Polypyrrole Core–Shell Nanorod Bundle Arrays Electrode, J. Mater. Chem. A, 2018, 6, 19058–19065, 10.1039/c8ta07477a.
- H. Tian, H. Fan, J. Ma, L. Zhiyong, L. Ma, S. Lei, J. Fang and C. Long, Pt-decorated zinc oxide nanorod arrays with graphitic carbon nitride nanosheets for highly efficient dual-functional gas sensing, J. Hazard. Mater., 2018, 341, 102–111, DOI:10.1016/j.jhazmat.2017.07.056.
- L. Ma, H. Fan, K. Fu, S. Lei, Q. Hu, H. Huang and G. He, Protonation of graphitic carbon nitride (g-C3N4) for electrostatically self-assembling Carbon@ g-C3N4 coreshell nanostructure toward high hydrogen evolution, ACS Sustainable Chem. Eng., 2017, 5(8), 7093–7103, DOI:10.1021/acssuschemeng.7b01312.
- A. J. Kulandaisamy, V. Elavalagan, P. Shankar, G. K. Mani, K. J. Babu and J. B. B. Rayappan, Nanostructured Cerium-doped ZnO thin film – A breath sensor, Ceram. Int., 2016, 42(16), 18289–18295, DOI:10.1016/j.ceramint.2016.08.156.
- J. J. Qi, S. Gao, K. Chen, J. Yang, H. W. Zhao, L. Guo and S. H. Yang, Vertically aligned, double-sided, and self-supported 3D WO3 nanocolumn bundles for low-temperature gas sensing, J. Mater. Chem. A, 2015, 3, 18019–18026, 10.1039/c5ta03711e.
- J. Zhang, H. Lu, C. Yan, Z. Yang, G. Zhu, J. Gao, F. Yin and C. Wang, Fabrication of conductive graphene oxide–WO3 composite nanofibers by electrospinning and their enhanced acetone gas sensing properties, Sens. Actuators, B, 2018, 264, 128–138, DOI:10.1016/j.snb.2018.02.026.
Footnote |
| † Electronic supplementary information (ESI) available. See DOI: 10.1039/c9na00048h |
| This journal is © The Royal Society of Chemistry 2019 |

