DOI:
10.1039/C8NA00278A
(Paper)
Nanoscale Adv., 2019,
1, 1482-1488
DNA-templated Au nanoclusters coupled with proximity-dependent hybridization and guanine-rich DNA induced quenching: a sensitive fluorescent biosensing platform for DNA detection†
Received
10th October 2018
, Accepted 28th January 2019
First published on 29th January 2019
Abstract
In this paper, the fluorescence signal of poly(A) DNA-templated Au nanoclusters (AuNCs) is found to be greatly quenched by photoinduced electron transfer (PET) when they are close to guanine (G)-rich DNA. Based on the findings, we have designed a low-cost fluorescence biosensing strategy for the sensitive detection of DNA. Highly luminescent and photo-stable poly(A) DNA-AuNCs were utilized as the fluorescent indicator and G-rich DNA was utilized as the fluorescent quencher. In the absence of target DNA, DNA-AuNCs failed to hybridize with the G-rich DNA and did not form the duplex DNA structure. Strong fluorescence intensity at 475 nm was observed due to the DNA-AuNCs being far away from the G-rich DNA. However, in the presence of target DNA, the DNA-AuNCs together with G-rich DNA could hybridize with the target DNA, leading to the 5′ terminus of the DNA-AuNCs and the 3′ terminus of G-rich DNA being in close proximity and promoting the cooperative hybridization. Therefore, a “Y” junction structure was formed and the G-rich sequences were brought close to the AuNCs. Therefore, the fluorescence intensity of the sensing system decreased significantly. Taking advantage of the poly(A) DNA-templated Au nanoclusters and G-rich DNA proximity-induced quenching, the strategy could be extended to determine other biomolecules by designing appropriate sequences of DNA probes.
1. Introduction
In comparison with traditional organic fluorescent dyes and quantum dots, fluorescent metal nanoclusters with different types of templates or protecting ligands (such as thiolates, DNA, proteins and so on), as a novel fluorescent nanomaterial, have attracted much research interest in many fields in the past ten years.1–3 DNA-templated fluorescent metal nanoclusters have many superior properties, such as simple synthesis, excellent fluorescence, good biocompatibility and photo-stability, and so on.1,2,4,5 In addition to being a template, DNA plays an important role in recognizing biomolecules (e.g. DNA hybridization) through designing appropriate sequences of DNA probes. Moreover, DNA itself is non-toxic. Thus, DNA-templated metal nanoclusters possess low toxicity. Additionally, chemically synthesized DNA can be easily obtained, which can broaden the fundamental studies and the applications of DNA-templated metal nanoclusters.
For example, single-stranded cytosine (C)-rich DNA has been utilized as the template for the formation of Ag nanoclusters (AgNCs).6–8 The prepared AgNCs possessed a high quantum yield and photo-stability. However, it usually suffered from the need for a relatively expensive precursor (AgNO3) and time-consuming preparation procedure (over 24 h).6 Recently, Mokhir and co-workers found that double-stranded DNA could serve as the template and support the formation of copper nanoclusters (CuNCs) in 10 min.9 Wang's group reported that single-stranded polythymine (poly T) DNA could also be used as a template for the formation of CuNCs.10 Although the preparation of poly T-templated CuNCs was very quick (only 5 min), the fluorescence quantum yield of these CuNCs was rather low. In addition, the fluorescence signal of DNA-templated CuNCs could be stable for just 20 min.11,12 Therefore, the photo-stability of CuNCs still needed to improve. Very recently, Tseng and co-workers found that polyadenine DNA was the effective template for the formation of fluorescent AuNCs by a UV-light-assisted reduction method.13 However, it needed incubation for 24 h under 305 nm UV light irradiation. Thus, the exploitation of simple synthesis of highly photo-stable fluorescent nanoclusters is still at an early stage.
As a novel DNA-assisted analytical strategy, the proximity-dependent hybridization assay has attracted increasing interest in the sensitive detection of DNA and protein.14–19 The proximity-dependent hybridization assay depended upon the simultaneous recognition of a target molecule (e.g. DNA or protein) by a pair of affinity probes. This resulted in the hybridization of terminus sequences of the affinity probe pair being in close proximity. On the basis of this principle, Jiang's group has designed some single-step and sensitive electrochemical methods for DNA and platelet-derived growth factor (PDGF) detection by using proximity-dependent surface hybridization assay.14,15,20 Zhao and co-workers have developed a fluorescent biosensor for the multiplexed detection of protein biomarkers based on the fluorescence proximity immunoassay.17 The proximity-dependent hybridization assay was simple, rapid, sensitive, and selective, and exhibited a low background.
It has been reported that most fluorescent dyes can be strongly quenched by guanine (G) bases through photoinduced electron transfer (PET) between guanine bases and fluorophores.21,22 In the PET process, quenchable fluorophores act as electron acceptors in their excited state and guanine bases work as an electron donor.21 The fluorescence quenching phenomenon is usually called guanine (G) quenching. Due to its cost-effective and easy design, G quenching of fluorescence-labeled DNA probes has been used as a powerful tool for the detection of metal ions,23–25 DNA,26,27 protein,28 adenosine triphosphate,29,30 exonuclease/endonuclease activity,31,32 and so on. However, most of these methods usually require complicated fluorescent dye labelling. Therefore, it is still highly desirable for the exploration of a low-cost and label-free G-quenching-based fluorescence strategy for bioassay.
Very recently, our group reported that poly(A) DNA-templated AuNCs exhibited a strong fluorescence signal and high photo-stability through heating-assisted reduction methods.33,34 In this work, we have demonstrated a new fact that G-rich DNA proximity could induce the fluorescence quenching of the DNA-AuNCs. This phenomenon might be attributed to the photoinduced electron transfer (PET) process between the DNA-AuNCs and G-rich DNA in proximity, leading to a decrease in fluorescence intensity. Hence, a novel fluorescent biosensing platform has been developed for DNA detection by coupling the advantages of the poly(A) DNA-templated Au nanoclusters and G-rich DNA proximity-induced quenching.
2. Experimental
2.1. Reagents
HAuCl4 was purchased from Sigma Aldrich Chemical Co. (St. Louis, MO, USA). Trisodium citrate and other reagents (analytical reagent grade) were obtained from Sinopharm Chemical Reagent Co., Ltd. (Shanghai, China) and used without further purification. All buffers and reagent solutions were prepared with ultrapure water (with electrical resistance > 18.2 MΩ cm) from a Millipore Milli-Q water purification system (Billerica, MA, USA). All oligonucleotides used in this work were synthesized by Sangon Biotech Co., Ltd. (Shanghai, China). The sequences are shown in Table 1.
Table 1 Sequences of oligonucleotides used in this work
| DNA probes |
Sequences (5′ → 3′) |
| P1 DNA |
5′-AAAAAAAAAAAAAAAAAAAAAGTCAGTGTGGAAAATCTCTAGC-3′ |
| 3G probe |
5′-GCTAGAGATTTTCCACACTGACT GGG-3′ |
| 4G probe |
5′-GCTAGAGATTTTCCACACTGACT GGGG-3′ |
| 5G probe |
5′-GCTAGAGATTTTCCACACTGACT GGGGG-3′ |
| 6G probe |
5′-GCTAGAGATTTTCCACACTGACT GGGGGG-3′ |
| P2 DNA |
5′-AAAAAAAAAAAAAAAAAAAATATTTCAAGCCGGAAATAGCAATAAGAC-3′ |
| 6G probe 2 |

|
| Target DNA |

|
2.2. Apparatus
All fluorescence measurements were performed on a Hitachi F-7000 fluorescence spectrometer (Hitachi, Japan). The fluorescence emission spectra were recorded from 400 nm to 560 nm with an excitation wavelength of 290 nm. The excitation and emission slits were both set at 5 nm. UV-vis absorption spectra were collected on a Hitachi U-3900 spectrophotometer (Hitachi, Japan). Transmission electron microscopy (TEM) images were obtained using a Tecnai G2 F20 S-TWIN field emission transmission electron microscope.
2.3. Preparation of fluorescent DNA-AuNCs
DNA-AuNCs were synthesized by using poly(A)-DNA as the template according to our previous reported methods.33,34 In brief, a 1 mL volume of an aqueous solution containing 50 μL 1 mM HAuCl4, 100 μL 2 μM P1 or P2 DNA probe and 100 μL 50 mM sodium citrate (pH 6) was prepared at room temperature. After that, the solution was incubated at 90 °C for 30 min. Finally, the prepared AuNCs were named P1 or P2 DNA-AuNCs.
2.4. Hybridization of DNA-AuNCs and G-rich DNA probe
A series of guanine-rich DNA probes (3G, 4G, 5G, and 6G probes) was designed to hybridize with DNA-AuNCs and to quench the fluorescence of the as-prepared AuNCs. Briefly, 50 μL P1 DNA-AuNCs and 10 μL 1 μM G-rich DNA probe were added into a 100 μL reaction system (containing 20 mM Tris–HCl and 100 mM NaCl; pH 7.4). The mixture was heated to 90 °C for 1 min and then gradually cooled down to 37 °C. After being incubated at 37 °C for 30 min, the fluorescence emission spectra were immediately recorded on a Hitachi F-7000 fluorescence spectrometer with an excitation wavelength of 290 nm.
2.5. Fluorescent DNA assays
In a typical DNA assay, 50 μL P2 DNA-AuNCs, 10 μL 1 μM 6G probe 2 and 10 μL H1N1 target DNA (different concentrations) were added into a 100 μL reaction system (containing 20 mM Tris–HCl and 100 mM NaCl; pH 7.4). The mixture was heated to 90 °C for 1 min and then gradually cooled down to 37 °C. After being incubated at 37 °C for 30 min, the fluorescence intensity was immediately recorded on a Hitachi F-7000 fluorescence spectrometer with an excitation wavelength of 290 nm.
3. Results and discussion
3.1. Principle of the guanine proximity-induced fluorescence quenching
As shown in Scheme 1A, P1 DNA was designed to have two parts. One part was the poly(A) DNA template as the AuNC sequences, the other was the hybridization sequences. The 6G probe also contained two parts, G-rich overhang sequences and hybridization sequences. The fluorescence signal of P1 DNA-AuNCs was quenched due to their proximity with G-rich sequences through DNA hybridization with the 6G probe. Taking advantage of the guanine proximity-induced fluorescence quenching and proximity-dependent hybridization assay, we designed a simple and single-step biosensing strategy for nucleic acid detection. The design principle is shown in Scheme 1B. In this sensing system, two oligonucleotide probes were designed according to the target DNA sequence and the melting temperatures. Firstly, P2 DNA, which was complementary to part of the target DNA, contained AuNC sequences and served as a signal probe. Secondly, 6G probe 2, partially complementary with the target DNA and P2 DNA, acted as the quenching probe. As a proof-of-concept, an oligonucleotide sequence from influenza A virus (H1N1) was selected as the target DNA. The melting temperature for the hybrid of the P2 DNA and 6G probe 2 was calculated to be −33.6 °C by using the Zuker program.35 Thus, in the absence of H1N1, P2 DNA failed to hybridize with the 6G probe 2 and did not form duplex DNA at a reaction temperature of 37 °C. Strong fluorescence intensity at 475 nm was observed, because the P2 DNA-AuNCs were far away from the G-rich sequences. However, in the presence of target H1N1, the 6G probe 2 together with P2 DNA could hybridize with the target H1N1, respectively. Here, the 5′ terminus of the P2 DNA and the 3′ terminus of the 6G probe 2 have been drawn into close proximity, which promotes the cooperative hybridization of the residual complementary sequences of the 6G probe 2 and P2 DNA. Therefore, a “Y” junction structure formed and the G-rich sequences were brought close to the P2 DNA-AuNCs, leading to strong fluorescence quenching. A low background was obtained by using the proximity-dependent hybridization.
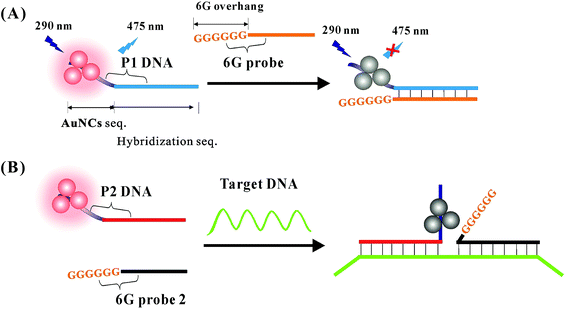 |
| | Scheme 1 (A) Schematic illustration of fluorescence quenching of P1 DNA-AuNCs through proximity with G-rich DNA. (B) Schematic illustration of a fluorescence biosensing method for DNA detection based on P2 DNA-AuNCs coupled with proximity-dependent hybridization and G-rich DNA induced quenching. | |
3.2. Characterization of poly(A) DNA-AuNCs
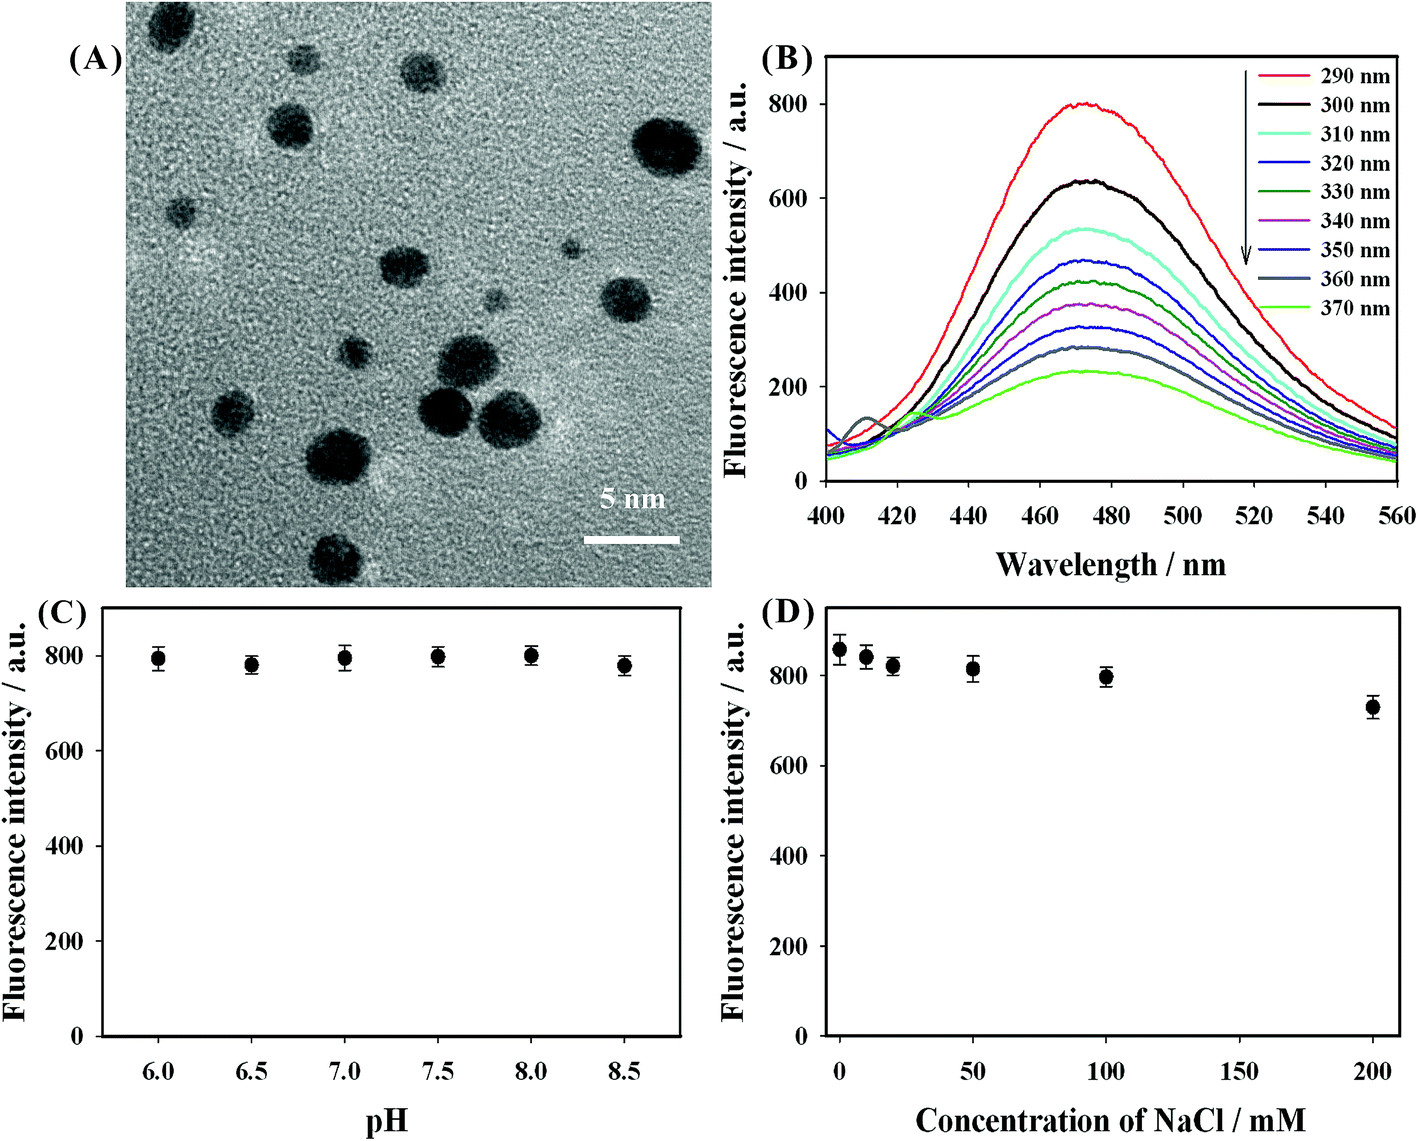
The fluorescent DNA-AuNCs were successfully prepared by using poly(A) DNA as the synthesis template.33,34 The morphological characterization of the obtained AuNCs was performed by transmission electron microscopy (TEM). As shown in Fig. 1(A), the shapes of the prepared AuNCs were nearly spherical with an average diameter of 3 nm. The fluorescence emission spectra of the prepared AuNCs were studied with different excitation wavelengths. From Fig. 1(B), it was observed that the emission peaks of AuNCs remained at around 475 nm as the excitation wavelength increased from 290 nm to 370 nm. The highest fluorescence at 475 nm was obtained when the excitation wavelength was set at 290 nm. The fluorescence quantum yield of the prepared AuNCs was 1.9%. Additionally, the fluorescence intensity (at 475 nm) of the prepared AuNCs had no obvious changes as the pH value was increased from 6.0 to 8.5 (shown in Fig. 1(C)). As indicated in Fig. 1(D), the fluorescence intensity of AuNCs showed no obvious decrease in the presence of 200 mM NaCl. Furthermore, the fluorescence signal of the obtained AuNCs was very stable after being placed at 4 °C for 2 months. These results indicated that the DNA-AuNCs possessed good stability and could be exploited as a fluorescent indicator for the development of a biosensing strategy.
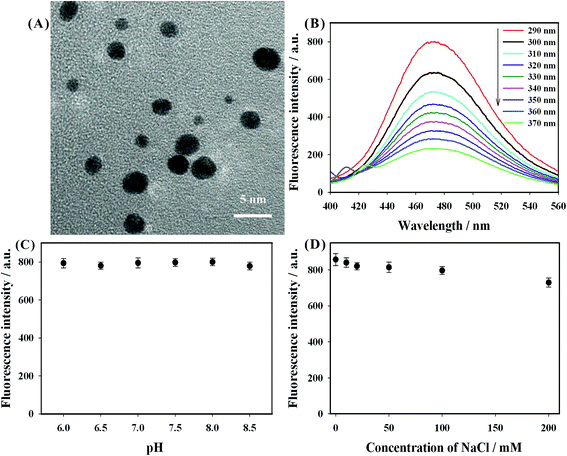 |
| | Fig. 1 (A) TEM image of the prepared DNA-AuNCs. (B) Fluorescence emission spectra of the DNA-AuNCs with different excitation wavelengths. (C) The effect of solution pH value on the fluorescence intensity of P1 DNA-AuNCs. (D) The effect of the NaCl concentration on the fluorescence intensity of P1 DNA-AuNCs. | |
3.3. Evaluation of the feasibility of the fluorescence strategy
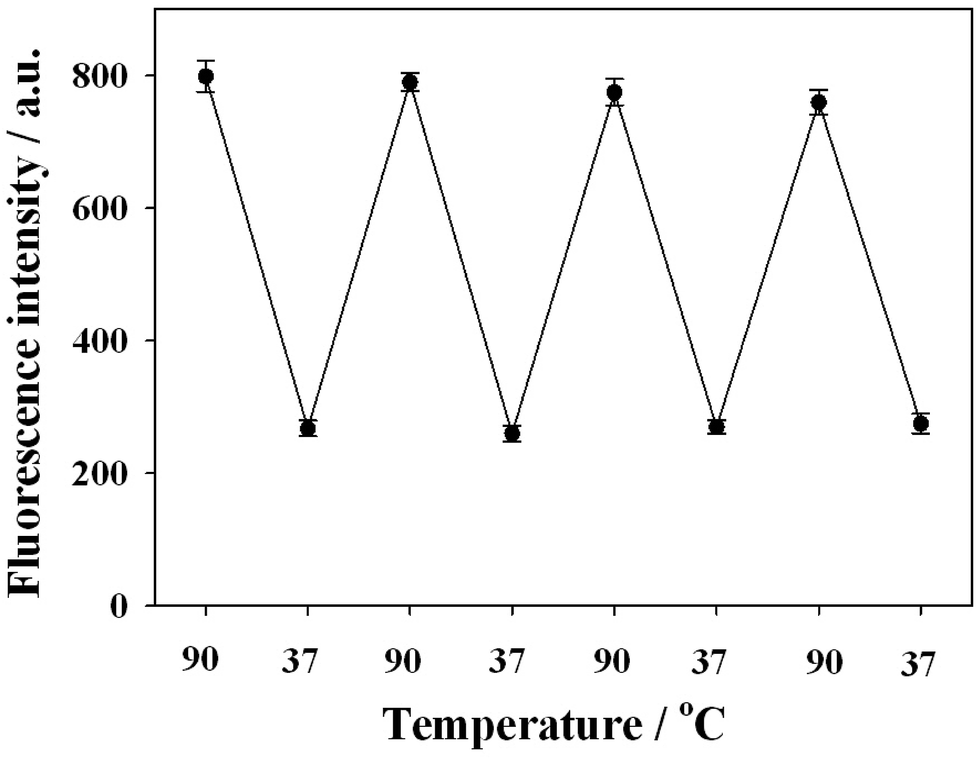
In order to prove this quenching concept and evaluate the guanine proximity-induced fluorescence quenching, P1 DNA-AuNCs were hybridized with different G-rich DNA probes (various guanine contents). The corresponding fluorescence emission spectra are shown in Fig. 2(A). Fig. 2(B) presents the fluorescence intensity (at 475 nm) of P1 DNA-AuNCs hybridized with different G-rich DNA probes. It was observed that fluorescence intensity decreased obviously along with the increase of the number of guanine bases in proximity to the P1 DNA-AuNCs. Approximately 70% of the fluorescence intensity was quenched when P1 DNA-AuNCs were hybridized with the 6G probe (containing 6 guanine bases). This may be ascribed to the close proximity between guanine bases and AuNCs, resulting in the photoinduced electron transfer and the decrease of fluorescence intensity. To further verify that the fluorescence quenching was the result of the guanine proximity caused by the hybridization process, the typical fluorescence intensity of AuNCs was recorded by a thermal cycling process. From Fig. 3, it was observed that fluorescence quenching came from the DNA hybridization, and the guanine proximity-induced fluorescence quenching was reversible.
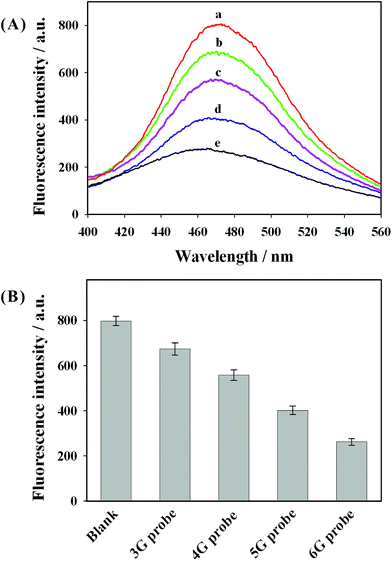 |
| | Fig. 2 (A) Fluorescence emission spectra of the P1 DNA-AuNCs hybridized with different G-rich DNA probes. The curves from (a) to (e) are those of the blank, 3G probe, 4G probe, 5G probe, and 6G probe, respectively. (B) The relationship between the fluorescence intensity and G-rich DNA probes. | |
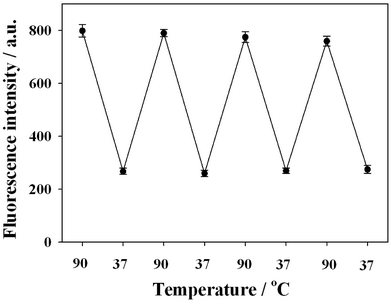 |
| | Fig. 3 Representative fluorescence trace of P1 DNA-AuNCs with the 6G probe during a thermal cycling process. | |
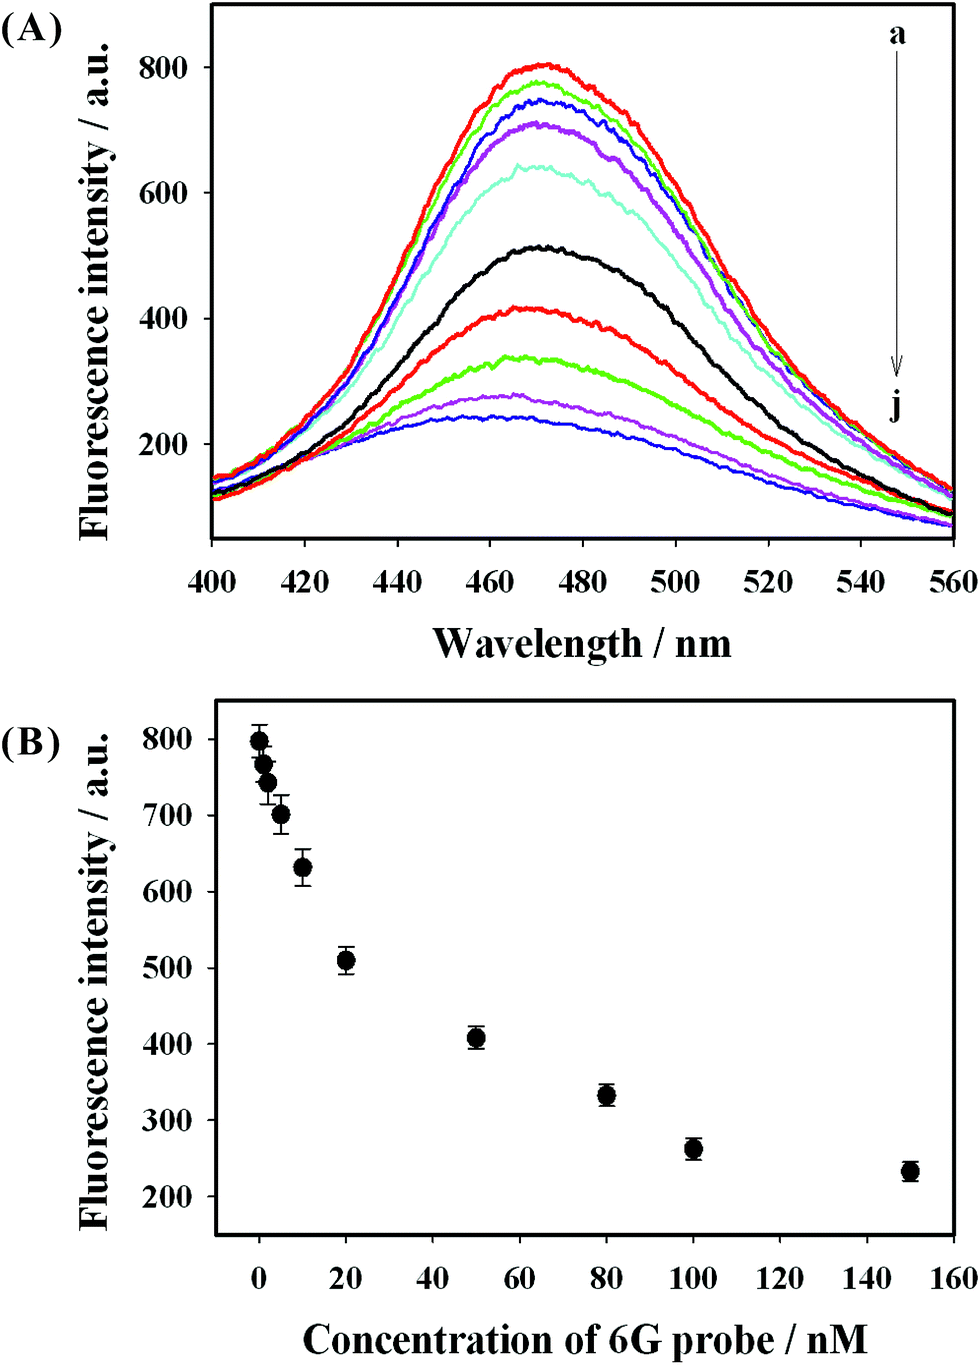
To better understand the guanine proximity-induced fluorescence quenching, we investigated the fluorescence intensity of P1 DNA-AuNCs in the presence of different concentrations of 6G probe. Fig. 4(A) depicts the typical fluorescence emission spectra of P1 DNA-AuNCs with different concentrations of 6G probe. From Fig. 4(A), it could be clearly seen that the fluorescence signal decreased remarkably with the increase of the 6G probe concentration from 0 to 150 nM (curve (a) to curve (j)). These results suggested that the more the 6G probe was present, the more duplex DNA formed, resulting in more guanine proximity and the decrease of fluorescence intensity. Fig. 4(B) shows the relationship between the fluorescence signal and the 6G probe concentrations. The efficient fluorescence quenching might be attributed to the photoelectron transfer (PET) between the guanine bases and the P1 DNA-AuNCs, which was similar to the mechanism of fluorophores being quenched by guanines.21,22 The mechanism of the fluorescence quenching was also investigated by performing some additional experiments. Firstly, the UV-vis absorption spectra of the 6G probe and the fluorescence emission spectra of P1 DNA-AuNCs were recorded. From Fig. S1 (ESI),† it was observed that there was no overlap between the absorption spectra of the 6G probe and the emission spectra of P1 DNA-AuNCs, which weakened the fluorescence resonance energy transfer (FRET) as a possible mechanism for the fluorescence quenching of AuNCs. Secondly, it was found that the absorption spectra of P1 DNA-AuNCs showed no obvious change in the presence of 6G probe, thereby eliminating the possibility of surface reactions through non-covalent interactions as a possible mechanism. Thirdly, the zeta potential of P1 DNA-AuNCs in the absence and presence of 6G probe was also investigated. A significant reduction of the zeta potential of P1 DNA-AuNCs was obtained from −23.6 mV to −14.5 mV in the presence of 6G probe, indicating the strong electrostatic interaction between the P1 DNA-AuNCs and 6G probe. Therefore, the fluorescence quenching presumably resulted from the photoelectron transfer (PET) between the AuNCs and 6G probe, which was similar to some previously reported methods.22–24,32
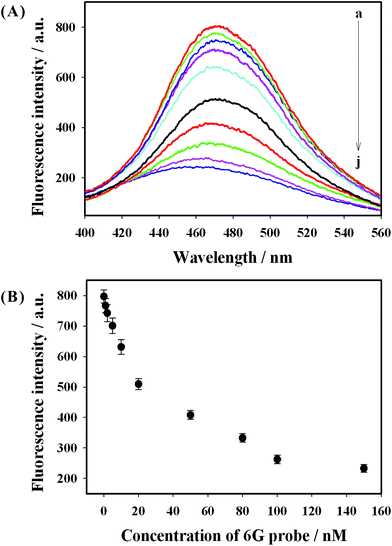 |
| | Fig. 4 (A) Fluorescence spectra of P1 DNA-AuNCs in the presence of increasing 6G probe concentrations: from curves (a) to (j), the concentration is 0, 1, 2, 5, 10, 20, 50, 80, 100, and 150 nM, respectively. (B) The relationship between the fluorescence intensity and the concentration of 6G probe. | |
3.4. Analytical performance of DNA assay
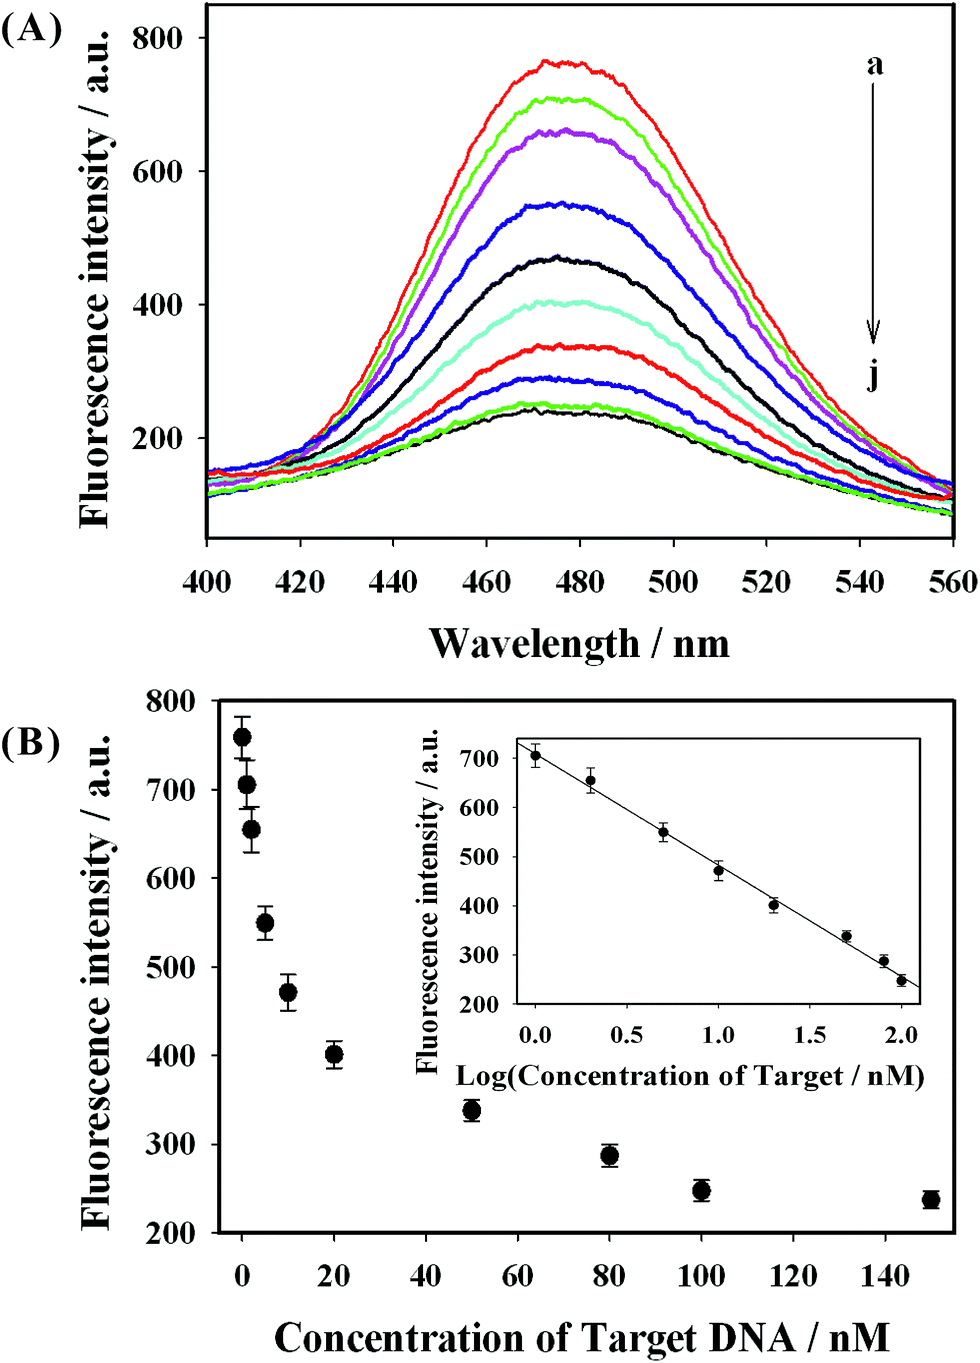
As shown in Fig. S2 (ESI),† the prepared P2 DNA-AuNCs exhibited strong fluorescence intensity at 475 nm (curve (a)). When 6G probe 2 was introduced, the fluorescence signal of P2 DNA-AuNCs showed no obvious change (curve (b) in Fig. S2†). When 100 nM of target DNA H1N1 was present in the sensing system, the fluorescence intensity at 475 nm decreased obviously (curve (c) in Fig. S2†) because the target DNA H1N1 could hybridize with the 6G probe 2 and P2 DNA-AuNCs, respectively. Hence, a “Y” junction structure formed and the G-rich sequences were close to the AuNCs, leading to the fluorescence intensity being quenched. Fig. 5(A) displays the fluorescence emission spectra of the label-free fluorescence strategy in the presence of different concentrations of H1N1. It was clearly observed that the fluorescence intensity decreased obviously along with the increase of the H1N1 concentration from 1 to 150 nM (from curve (a) to curve (j) in Fig. 5(A)). This result implied that when more target H1N1 was present, more G-rich sequences could be close to P2 DNA-AuNCs, leading to a decrease in fluorescence intensity. The inset in Fig. 5(B) shows a good linear relationship between fluorescence intensity (475 nm) and the logarithm of the H1N1 concentrations (from 1 to 100 nM). According to the rule (S/N = 3), the limit of detection (LOD) could be calculated to be 200 pM. The LOD was lower than that of other label-free fluorescence methods (shown in Table 2).13,19,22,36 In addition, the selectivity of the assay has been investigated by testing the fluorescence response of four kinds of DNA probes including complementary target DNA (H1N1), single-base mismatched DNA, three-base mismatched DNA and all mismatched (non-complementary) DNA. As indicated in Fig. 6, it can be seen that over a 3-fold fluorescence response was achieved in the presence of the complementary target DNA. However, single-base mismatched DNA, three-base mismatched DNA and all mismatched (non-complementary) DNA did not induce obvious fluorescence responses. The biosensing strategy showed high selectivity and possessed the ability to discriminate base-mismatched DNA. Thus, on the basis of guanine proximity-induced fluorescence quenching and proximity-dependent hybridization, a label-free fluorescent platform for the detection of DNA was constructed by designing appropriate DNA sequences.
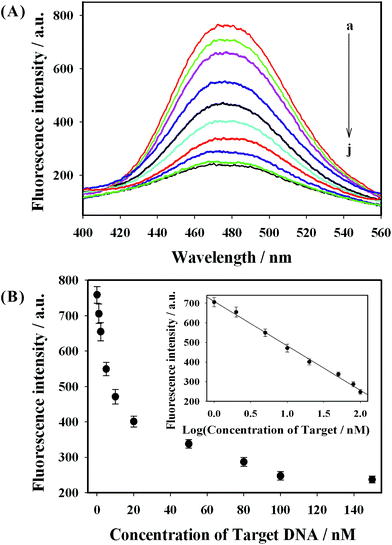 |
| | Fig. 5 (A) Fluorescence spectra of P2 DNA-AuNCs and 6G probe 2 in the presence of increasing target DNA concentrations: from curves (a) to (j), the concentration is 0, 1, 2, 5, 10, 20, 50, 80, 100, and 150 nM, respectively. (B) The relationship between the fluorescence intensity and the target DNA concentration. The inset in (B) shows the calibration curve. | |
Table 2 The comparison of different fluorescence methods for DNA detection
| Fluorescence analytical methods |
Linear range (nM) |
LOD (nM) |
References |
| DNA-AuNCs with SYBR Green I |
1–10 |
0.3 |
13
|
| DNA-AgNC probe |
Not given |
10 |
19
|
| AgNCs with G-quadruplex/hemin complex |
1–100 |
0.6 |
22
|
| AgNCs with hairpin DNA probes |
10–200 |
3 |
36
|
| DNA-AuNCs with G-rich DNA proximity |
1–100 |
0.2 |
This work |
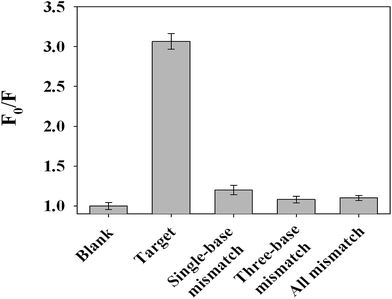 |
| | Fig. 6 Bar chart of the fluorescence responses of the blank, target DNA, single-base mismatched DNA, three-base mismatched DNA, and non-complementary DNA. F0 and F are the fluorescence intensity in the absence and presence of target DNA. | |
4. Conclusions
In summary, a label-free fluorescent platform has been developed for the sensitive detection of target nucleic acids on the basis of the good fluorescence properties of poly(A)-templated AuNCs coupled with proximity-dependent hybridization and the guanine proximity-induced fluorescence quenching. The fluorescence assay had some advantages. Firstly, the prepared AuNCs exhibited good fluorescence signals, low toxicity, favorable biocompatibility and good photo-stability. Secondly, G-rich DNA induced fluorescence quenching was low cost. Thirdly, a low background was obtained by using the proximity-dependent hybridization. More importantly, the method could be extended to determine other biomolecules by designing appropriate sequences of DNA-AuNC probes and G-rich DNA probes. Thus, it could provide a label-free sensing platform for biochemical assay and clinical diagnostics.
Conflicts of interest
There are no conflicts to declare.
Acknowledgements
This work was financially supported by the National Natural Science Foundation of China (No. U1704153 and 21305119), Plan for Young Excellent Teachers in Universities of Henan Province (No. 2017GGJS100), Plan for Scientific Innovation Talent of Henan Province (No. 2017JR0016), and Nanhu Scholars Program for Young Scholars of XYNU.
References
- Y. Tao, M. Q. Li, J. S. Ren and X. G. Qu, Chem. Soc. Rev., 2015, 44, 8636–8663 RSC.
- Y. M. Guo, F. P. Cao, X. L. Lei, L. H. Mang, S. J. Cheng and J. T. Song, Nanoscale, 2016, 8, 4852–4863 RSC.
- Q. F. Yao, T. K. Chen, X. Yuan and J. P. Xie, Acc. Chem. Res., 2018, 51, 1338–1348 CrossRef CAS PubMed.
- L. L. Zhang, J. J. Zhao, H. Zhang, J. H. Jiang and R. Q. Yu, Biosens. Bioelectron., 2013, 44, 6–9 CrossRef CAS PubMed.
- H. B. Wang, H. D. Zhang, Y. Chen and Y. M. Liu, Biosens. Bioelectron., 2015, 74, 581–586 CrossRef CAS PubMed.
- J. T. Petty, J. Zheng, N. V. Hud and R. M. Dickson, J. Am. Chem. Soc., 2004, 126, 5207–5212 CrossRef CAS PubMed.
- X. Tian, X. J. Kong, Z. M. Zhu, T. T. Chen and X. Chu, Talanta, 2015, 131, 116–120 CrossRef CAS PubMed.
- L. Y. Guo, T. Tang, L. S. Hu, M. H. Yang and X. Chen, Sens. Actuators, B, 2017, 241, 773–778 CrossRef CAS.
- A. Rotaru, S. Dutta, E. Jentzsch, K. Gothelf and A. Mokhir, Angew. Chem., Int. Ed., 2010, 49, 5665–5667 CrossRef CAS PubMed.
- Z. H. Qing, X. X. He, D. G. He, K. M. Wang, F. Z. Xu, T. P. Qing and X. H. Yang, Angew. Chem., Int. Ed., 2013, 52, 9719–9722 CrossRef CAS PubMed.
- N. Goswami, A. Giri, M. S. Bootharaju, P. L. Xavire, T. Pradeep and S. K. Pal, Anal. Chem., 2011, 83, 9676–9680 CrossRef CAS PubMed.
- J. Y. Lian, Q. Liu, Y. Jin and B. X. Li, Chem. Commun., 2017, 53, 12568–12571 RSC.
- Z. Y. Li, Y. T. Wu and W. L. Tseng, ACS Appl. Mater. Interfaces, 2015, 7, 23708–23716 CrossRef CAS PubMed.
- Y. L. Zhang, Y. Huang, J. H. Jiang, G. L. Shen and R. Q. Yu, J. Am. Chem. Soc., 2007, 129, 15448–15449 CrossRef CAS PubMed.
- Y. L. Zhang, Y. Wang, H. B. Wang, J. H. Jiang, G. L. Shen, R. Q. Yu and J. H. Li, Anal. Chem., 2009, 81, 1982–1987 CrossRef CAS PubMed.
- R. Hu, T. Fu, X. B. Zhang, R. M. Kong, L. P. Qiu, Y. R. Liu, X. T. Liang, W. H. Tan, G. L. Shen and R. Q. Yu, Chem. Commun., 2012, 48, 9507–9509 RSC.
- J. Y. Xu, M. Shi, W. T. Chen, Y. Huang, L. N. Fang, L. F. Yao, S. L. Zhao, Z. F. Chen and H. Liang, Chem. Commun., 2018, 54, 2719–2722 RSC.
- Z. M. Ying, H. Y. Xiao, H. Tang, R. Q. Yu and J. H. Jiang, Chem. Commun., 2018, 54, 8877–8880 RSC.
- H. C. Yeh, J. Sharma, J. J. Han, J. S. Martinez and J. H. Werner, Nano Lett., 2010, 10, 3106–3110 CrossRef CAS PubMed.
- Y. L. Zhang, P. F. Pang, J. H. Jiang, G. L. Shen and R. Q. Yu, Electroanalysis, 2009, 21, 1327–1333 CrossRef CAS.
- M. Torimura, S. Kurata, K. Yamada, T. Yokomaku, Y. Kamagata, T. Kanagawa and R. Kurane, Anal. Sci., 2001, 17, 155–160 CrossRef CAS PubMed.
- L. B. Zhang, J. B. Zhu, S. J. Guo, T. Li, J. Li and E. K. Wang, J. Am. Chem. Soc., 2013, 135, 2403–2406 CrossRef CAS PubMed.
- P. Hu, L. H. Jin, C. Z. Zhu and S. J. Dong, Talanta, 2011, 85, 713–717 CrossRef CAS PubMed.
- L. Wang, J. Q. Tian, H. L. Li, Y. W. Zhang and X. P. Sun, Analyst, 2011, 136, 891–893 RSC.
- D. P. Zhang, R. Fu, Q. Zhao, H. Q. Rong and H. L. Wang, Anal. Chem., 2015, 87, 4903–4909 CrossRef CAS PubMed.
- Y. Saito, E. Mizuno, S. S. Bag, I. Suzukaa and I. Saito, Chem. Commun., 2007, 4492–4494 RSC.
- D. S. Xiang, K. Zhai and L. Z. Wang, Analyst, 2013, 138, 5318–5324 RSC.
- W. J. Wang, C. L. Chen, M. X. Qian and X. S. Zhao, Sens. Actuators, B, 2008, 129, 211–217 CrossRef CAS.
- X. Y. Fan, F. B. Lin, Y. Y. Zhang, J. N. Zhao, H. T. Li and S. Z. Yao, New J. Chem., 2012, 36, 2260–2265 RSC.
- C. B. Ma, H. C. Chen, R. Han, H. L. He and W. M. Zeng, Anal. Biochem., 2012, 429, 8–10 CrossRef CAS PubMed.
- X. Su, X. C. Zhu, C. Zhang, X. J. Xiao and M. P. Zhao, Anal. Chem., 2012, 84, 5059–5065 CrossRef CAS PubMed.
- Y. C. Wang, L. Z. Yang, Y. J. Wang, W. Liu, B. X. Li and Y. Jin, Sens. Actuators, B, 2017, 252, 477–482 CrossRef CAS.
- H. B. Wang, Y. Li, H. Y. Bai and Y. M. Liu, Sens. Actuators, B, 2018, 259, 204–210 CrossRef CAS.
- H. B. Wang, Y. Li, H. Y. Bai, Z. P. Zhang, Y. H. Li and Y. M. Liu, Food Anal. Method., 2018, 11, 3095–3102 CrossRef.
- N. R. Markham and M. Zuker, Nucleic Acids Res., 2005, 33, W577–W581 CrossRef CAS PubMed.
- Y. Xiao, Z. J. Wu, K. Y. Wong and Z. H. Liu, Chem. Commun., 2014, 50, 4849–4852 RSC.
Footnote |
| † Electronic supplementary information (ESI) available. See DOI: 10.1039/c8na00278a |
|
| This journal is © The Royal Society of Chemistry 2019 |
Click here to see how this site uses Cookies. View our privacy policy here. 
 Open Access Article
 This Open Access Article is licensed under a Creative Commons Attribution-Non Commercial 3.0 Unported Licence
 *,
Hong-Yu
Bai
,
Gao-Li
Dong
and
Yan-Ming
Liu
*,
Hong-Yu
Bai
,
Gao-Li
Dong
and
Yan-Ming
Liu