
 Open Access Article
 This Open Access Article is licensed under a Creative Commons Attribution-Non Commercial 3.0 Unported Licence
One-pot synthesis of sub-10 nm LiNbO3 nanocrystals exhibiting a tunable optical second harmonic response†
Rana Faryad
Ali
 ,
Matthew
Bilton
and
Byron D.
Gates
*
,
Matthew
Bilton
and
Byron D.
Gates
*
Department of Chemistry and 4D LABS, Simon Fraser University, 8888 University Drive, Burnaby, BC V5A 1S6, Canada. E-mail: bgates@sfu.ca
First published on 24th April 2019
Abstract
Nanophotonics, dealing with the properties of light interacting with nanometer scale materials and structures, has emerged as a sought after platform for sensing and imaging applications, and is impacting fields that include advanced information technology, signal processing circuits, and cryptography. Lithium niobate (LiNbO3) is a unique photonic material, often referred to as the “silicon of photonics” due to its excellent optical properties. In this article, we introduce a solution-phase method to prepare single-crystalline LiNbO3 nanoparticles with average diameters of 7 nm. This one-pot approach forms well-dispersed LiNbO3 nanocrystals without additional organic additives (e.g., surfactants) to control growth and aggregation of the nanoparticles. Formation of these LiNbO3 nanocrystals proceeds through a non-aqueous sol–gel reaction, in which lithium hydroxide and niobium hydroxide species were generated in situ. The reaction proceeded through both a condensation and crystallization of these reactants to form the solid nanoparticles. These nanocrystals of LiNbO3 were active for optical second harmonic generation (SHG) with a tunable response from 400 to 500 nm. These nanoparticles could enable further development of non-linear optical techniques such as SHG microscopy for bioimaging, which requires the dimensions of nanoparticles to be well below 100 nm.
Introduction
This report demonstrates a solution-phase method to prepare single-crystalline lithium niobate (LiNbO3) nanoparticles with an average diameter of 7 nm. Lithium niobate is a technologically important material.1 Lithium niobate based materials are used in photonic devices and sought for a diverse range of applications including optical modulators, acoustic-wave transducers, optical filters in mobile telephones, and wavelength converters in fiber optic based telecommunication systems.2–7 Nanostructures of LiNbO3 with a well-defined size distribution, crystallinity, and phase are sought for use in a diverse range of applications that include optical sensors for chemical and biological analyses, waveguides and electro-optical ceramics.2,6,8–11 Properties of interest for LiNbO3 are its relatively high non-linear optical response, piezoelectric coefficient, acousto-optic response, and photoelastic activity.4,7,11–15 Recently, LiNbO3 nanoparticles have also been explored as second harmonic generation (SHG) imaging probes for their potential to expand SHG based microscopy techniques. For example, these nanoparticles have been used as probes to assist in imaging cells by taking advantage of the exceptional SHG properties of these particles. Efficient transport and cellular uptake of these SHG bio-imaging probes require their dimensions to be well below 100 nm.16 The non-linear optical (NLO) properties of these materials also depend on their size, shape, and chemical composition.1,17–19 The ferroelectric and piezoelectric properties of these nanomaterials are also strongly dependent upon their particle size and shape.20–22 To meet the demands of these applications, different synthetic routes have been sought to prepare uniform nanoparticles of LiNbO3.The preparation of single-crystalline LiNbO3 nanostructures, with well-defined dimensions and that exhibit minimal aggregation, is necessary for many of the targeted applications.23–27 Many solid state approaches, molten salt syntheses, and sol–gel methods have been reported for preparing nanomaterials of LiNbO3. These methods have been limited in their ability to tune the size of the nanoparticles and to overcome aggregation in the products, and often require high temperature treatment (>500 °C) that result in the inclusion of micron sized particles.26,28–30 In recent years, solution-phase approaches have attracted further attention to prepare nanomaterials with control over their shapes, sizes, and crystallinity, as well as to achieve minimal aggregation of these products. Solution-phase approaches include some relatively low temperature methods that are promising for the preparation of crystalline nanomaterials with dimensions below 100 nm.31,32 In the literature, crystalline nanoparticles of LiNbO3 with dimensions between 30 and 100 nm have been prepared using solvothermal techniques. These synthetic techniques can provide robust routes to prepare well-dispersed, crystalline, and pure nanoparticles of LiNbO3. Antonietti and coworkers reported the synthesis of LiNbO3 nanoparticles having an average size of 60 nm through a solution-phase synthesis.33 This method required an inert atmosphere for handling the reagents (e.g., lithium metal) and the product contained a wide range of particle sizes and non-uniform shapes. Wiley et al. prepared ∼50 nm diameter LiNbO3 nanoparticles through a solvothermal method using 1,4-butanediol, a controlled substance, as a solvent.34 Our group reported two different solution-phase methods for the synthesis of LiNbO3 nanoparticles. In our first report, we demonstrated the formation of anisotropic LiNbO3 nanoparticles with lengths and diameters around 100 nm and 7 nm, respectively, through a relatively high temperature solution-phase approach.35 An inert atmosphere was used when handling the reagents, and reaction temperatures above 350 °C were used to initiate decomposition of the precursor. In our second report, single-crystalline LiNbO3 nanoparticles with an average diameter down to 30 nm were prepared using a surfactant-assisted solvothermal method.36 This synthetic method provided a route to prepare LiNbO3 nanoparticles with a tuned diameter. It has, however, remained a challenge to further decrease in the diameter of single-crystalline LiNbO3 nanoparticles below 30 nm. Synthesis of LiNbO3 materials with these smaller dimensions has been of particular interest for their potential utilization in SHG microscopy techniques, ferroelectric memory materials, photonic devices, optical sensors and non-linear photo-catalysis.37–41 To meet the demands of these applications, a further decrease in the dimensions of the LiNbO3 nanoparticles was sought in this study.
Herein, we demonstrate a solution-phase method to prepare single-crystalline LiNbO3 nanoparticles with average diameters of 7 nm. An alternative preparation of LiNbO3 nanoparticles was sought through a non-aqueous sol–gel reaction, which involved the dissolution and condensation of reagents at high temperatures. The synthesis was carried out under ambient conditions without the need for an inert atmosphere or post-synthetic thermal annealing of the product. The size, dispersion, and crystallinity of the product were characterized by transmission electron microscopy (TEM) techniques. The composition, phase, and purity of the products were further characterized by X-ray diffraction and Raman spectroscopy techniques, which indicated the formation of crystalline LiNbO3 nanoparticles with a rhombohedral phase. The optical second harmonic response (or SHG) of these LiNbO3 nanocrystals was characterized and tuned over visible wavelengths by adjusting the incident wavelength of the laser.
Experimental section
Materials and supplies
All the chemicals were of analytical grade and were used as received without further purification. Niobium ethoxide [Nb(OC2H5)5, >90%] was obtained from Gelest Inc., and lithium acetylacetonate ([Li(acac)], 99.5%) and benzyl alcohol (99%) were purchased from Alfa Aesar and Acros Organics, respectively. Anhydrous ethanol and a crystalline lithium niobate powder (LiNbO3, 99.9%, to serve as a reference material) were obtained from Commercial Alcohols and Sigma Aldrich, respectively.Synthesis of lithium niobate nanoparticles
Lithium niobate nanoparticles having an average size of 7 nm were prepared through a solvothermal process. In brief, 40 mM of niobium ethoxide was dissolved in 10 mL of benzyl alcohol and stirred for 20 min. After this period of time, 70 mM of Li(acac) was added to the solution and stirred for another 6 h at room temperature. The resulting mixture was transferred to a 23 mL Teflon lined autoclave (Model No. 4749, Parr Instruments Co., Moline, IL USA) and heated at 220 °C for 96 h. After cooling to room temperature, white precipitates were isolated from the reaction mixture by centrifugation (Model No. accuSpin 400, Fisher Scientific) of the suspension at 8000 rpm for 30 min. The obtained solids were washed three times by re-suspending in 10 mL of ethanol and repeating the process of centrifugation and decanting of the solution. The purification process was repeated three more times with 10 mL of deionized water (18 MΩ cm, produced using a Barnstead NANOpure DIamond water filtration system). The purified product was dried at 70 °C for 10 h prior to further analyses to remove moisture present from the purification process.Characterization of the lithium niobate nanoparticles
The size, morphology, crystallinity, and phase of the LiNbO3 nanoparticles were each analyzed using an FEI Osiris X-FEG 8 scanning/TEM operated at an accelerating voltage of 200 kV. Samples for TEM analysis were prepared by dispersing the purified products in ethanol followed by drop casting 3 μL of the suspension onto separate TEM grids (300 mesh copper grid coated with formvar/carbon, or CVD Graphene TEM support on a Copper 2000 grid) purchased from Cedarlane Labs and Graphene Laboratories Inc. Each TEM grid was vacuum dried at ∼230 torr for at least 30 min prior to analysis. The TEM was calibrated using a thin film of aluminum before acquiring the selected area electron diffraction (SAED) patterns from the samples. The camera length was 220 mm and the TEM aperture used to acquire the SAED patterns from multiple nanoparticles was 40 μm.Phase and crystallinity of the products were further assessed using powder XRD. The XRD patterns of the samples were acquired with a Rigaku R-Axis Rapid diffractometer equipped with a 3 kW sealed tube copper source (Kα radiation, λ = 0.15418 nm) collimated to 0.5 mm. The samples were packed into a cylindrical recess drilled into glass microscope slides (Leica 1 mm Surgipath Snowcoat X-tra Micro Slides) for acquiring XRD patterns for the products.
Purity and phase of the product were further characterized using Raman spectroscopy techniques. A Renishaw inVia Raman microscope, equipped with a 50× LWD lens (Leica, 0.5 NA) and a 514 nm laser (e.g., argon ion laser, Model No. Stellar-Pro 514/50) set to 100% of the laser power, was used to acquire the Raman spectra. The Raman spectrometer was calibrated by collecting the static Raman spectra of a polished silicon (Si) standard at 520 cm−1. Raman spectra of the samples were measured from 100 to 950 cm−1 using a 1200 lines per mm grating and an exposure time of 30 s at a scan rate of 10 cm−1 s−1.
The second harmonic response of the LiNbO3 nanoparticles was analyzed using a Leica SP5 laser scanning confocal, two photon microscope equipped with a Coherent Chameleon Vision II laser (tunable from 680 to 1080 nm for two photon excitations) and a 20× objective lens (Leica, 1.0 NA). The average peak power of the laser was 3.0 W at a wavelength of 800 nm. Powdered samples of the LiNbO3 nanoparticles were mounted onto glass coverslips and brought into the focal point of the microscope. The excitation wavelengths were set to 800, 850, 900, 950 and 1000 nm, and the corresponding band-pass filters were centered at 400, 425, 450, 475, and 500 nm, respectively, to selectively collect the second harmonic response of the LiNbO3 nanocrystals.
Results and discussion
Mechanism for the formation of lithium niobate nanoparticles
In the solution-phase method reported herein, the formation of LiNbO3 nanoparticles proceeded through a mechanism of dissolution, condensation, and crystallization. In this non-aqueous sol–gel route, niobium ethoxide [Nb(OR)5, where R = –C2H5] and lithium acetylacetonate [Li(acac)] were first dissolved in benzyl alcohol (Fig. 1). A subsequent solvothermal treatment of this solution was performed in a Teflon lined autoclave at 220 °C for 96 h. Solvolysis of the precursors generated LiOH and NbOx(OH)y(OR)z species in situ. Formation of these hydroxyl based species within the reaction mixture was pursued to generate the necessary sol–gel precursors, which subsequently solidified through a condensation process in the solution. Condensation of the precursors formed a series of metal–oxygen–metal (M–O–M) bonds. Aging these species at the temperatures of the solvothermal process can result in the formation of crystalline LiNbO3 nanoparticles.42–45 We choose Li(acac) as a precursor for its acetylacetonate or β-diketone ligand. This bidentate “acac” ligand coordinates with the Li ions, and is believed to control the rate of solvolysis during formation of the LiOH in the reaction mixture, which helps to control the formation of the LiNbO3 nanoparticles.46,47 Regulating the rate of solvolysis of the precursors could provide control over the production of monomers in the solution and was sought to achieve a regulated growth of the nanoparticles at elevated temperatures. This controlled solvolysis of the precursors in solution could control the production of monomers and, therefore, the process involved in nucleation and growth of the nanoparticles, as well as to possibly minimize aggregation of the final product.48,49 Therefore, limiting the rate of solvolysis and the condensation of the Li and Nb precursors may lead to the formation of uniform, well-dispersed LiNbO3 nanoparticles.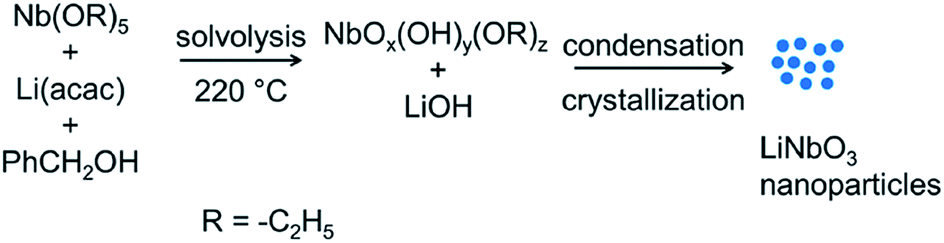 | ||
| Fig. 1 Formation of LiNbO3 nanoparticles through a non-aqueous sol–gel process, which were prepared through the condensation of LiOH and NbOx(OH)y(OR)z species generated in situ by a solvothermal treatment of Nb(OC2H5)5 and Li(acac) dissolved in benzyl alcohol. | ||
Morphology and structural characterization of the LiNbO3 nanoparticles
Size and shape of the products prepared through the solvothermal treatment at 220 °C for 96 h were characterized by TEM (Fig. 2 and S1†). The nanoparticles of LiNbO3 were relatively well dispersed with a semispherical shape (Fig. 2a and b). The mean diameter of these nanoparticles, calculated from the measurement of at least 230 individual nanoparticles, was 7 ± 2 nm (Fig. S2†). The error is reported here as one standard deviation from the calculated mean diameter. Crystallinity and phase of the nanoparticles were characterized by selected area electron diffraction (SAED) techniques. The SAED patterns indicated the formation of a crystalline product, and the observed ring patterns were indexed to the rhombohedral phase of LiNbO3 (Fig. 2c). The crystallinity of the nanoparticles was further confirmed through high resolution (HR) TEM analyses. A regular lattice structure was observed by HRTEM, which suggested the formation of single-crystals for individual nanoparticles (Fig. 2d). A typical analysis of the lattice spacing observed within the nanoparticles is shown in Fig. 2e. The average lattice spacing was 0.37 nm, which was indexed to the (012) planes of rhombohedral LiNbO3. A Fast Fourier Transform (FFT) pattern of this HRTEM image, obtained along the [42![[1 with combining macron]](https://www.rsc.org/images/entities/char_0031_0304.gif) ] zone axis, is shown in the inset of Fig. 2e. The FFT pattern indicated the presence of lattice spacings of 0.37 nm and 0.27 nm, which were indexed to the {012} and {104} facets of rhombohedral LiNbO3, respectively. The morphology and dominant facets for rhombohedral, single-crystal LiNbO3 nanoparticles were predicted using Bravais–Friedel–Donnay–Harker (BFDH) calculations (Fig. S3†) using Mercury software.50,51 According to the results of these calculations, the shapes of the crystals were determined by the facets with greatest inter-planar spacing. The shape of the resulting crystal is governed by the relative growth rates of each of the crystal facets. The most prominent facets of the crystal are those that are the slowest growing, while the smallest facets are the fastest growing and may absent in the final product.52,53 The BFDH calculations for a single crystal of LiNbO3 indicated the presence of {012} and {104} as major facets, which agreed with the FFT analyses of the HRTEM results. The HRTEM results and the BFDH calculations suggested the formation of single-crystalline nanoparticles of LiNbO3.
] zone axis, is shown in the inset of Fig. 2e. The FFT pattern indicated the presence of lattice spacings of 0.37 nm and 0.27 nm, which were indexed to the {012} and {104} facets of rhombohedral LiNbO3, respectively. The morphology and dominant facets for rhombohedral, single-crystal LiNbO3 nanoparticles were predicted using Bravais–Friedel–Donnay–Harker (BFDH) calculations (Fig. S3†) using Mercury software.50,51 According to the results of these calculations, the shapes of the crystals were determined by the facets with greatest inter-planar spacing. The shape of the resulting crystal is governed by the relative growth rates of each of the crystal facets. The most prominent facets of the crystal are those that are the slowest growing, while the smallest facets are the fastest growing and may absent in the final product.52,53 The BFDH calculations for a single crystal of LiNbO3 indicated the presence of {012} and {104} as major facets, which agreed with the FFT analyses of the HRTEM results. The HRTEM results and the BFDH calculations suggested the formation of single-crystalline nanoparticles of LiNbO3.
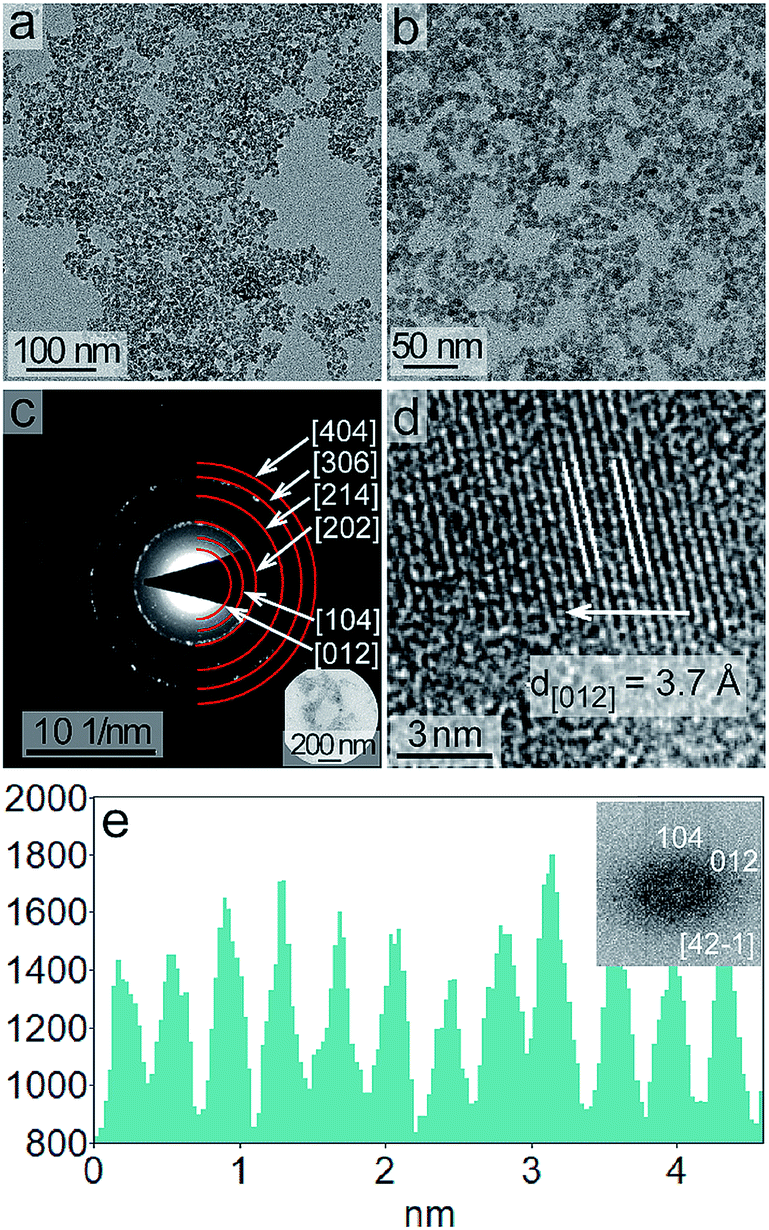 | ||
| Fig. 2 Lithium niobate nanoparticles characterized by: (a and b) transmission electron microscopy (TEM); (c) a selected area electron diffraction (SAED) analysis; and (d) a high resolution (HR) TEM analysis. (e) A detailed analysis of the d-spacing and the crystallographic orientation of the nanocrystal as observed in the HRTEM image. The inset in (e) depicts the results of a Fast Fourier Transformation (FFT) of the HRTEM image in (d). | ||
Further analyses of the phase and crystallinity of the LiNbO3 nanoparticles
Crystal structure and phase of the LiNbO3 nanoparticles were further characterized by powder X-ray diffraction (XRD) techniques (Fig. 3). For comparison, XRD patterns were also acquired for a commercial LiNbO3 powder purchased from Sigma Aldrich. The XRD patterns of this commercial sample were indexed to rhombohedral LiNbO3 in agreement with a reference material reported in the literature.54 The XRD patterns of the LiNbO3 nanoparticles were indexed, and the results correlated well with the commercial LiNbO3 powder and the reported LiNbO3 reference (space group R3c, JCPDS no. 020-0631). This further indicated the formation of a rhombohedral LiNbO3 product supporting the SAED analyses (Fig. 2c). Peak areas for the different XRD reflections relative to the (012) peak were determined to evaluate the presence of dominant facets in the product. It is worth noting that the ratio of the areas of the (104)/(012), (202)/(012), and (116)/(012) peaks exhibited relatively high values of 0.56, 0.75 and 0.41, respectively. These results indicated an enrichment of the {104}, {202}, and {116} facets in the LiNbO3 nanocrystals relative to those observed in larger crystals of LiNbO3 (Table S1†). The combined results of the SAED, HRTEM, and XRD analyses indicated that the major facets in the 7 nm nanocrystals of LiNbO3 were {012}, {104}, {116}, and {202}. The results of the HRTEM, SAED and XRD analyses also suggested that there was no single preferred growth direction for the nanocrystals, which resulted in the formation of semispherical nanoparticles of LiNbO3.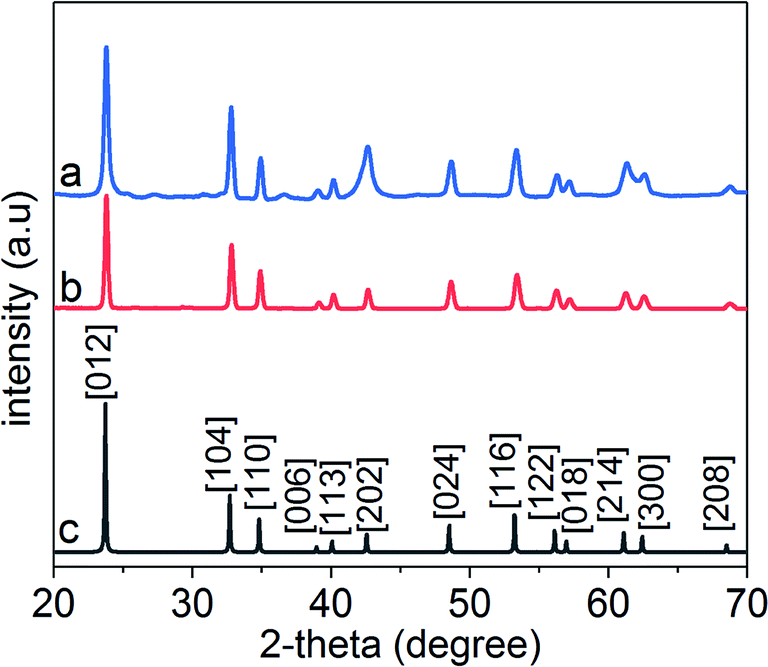 | ||
| Fig. 3 Powder X-ray diffraction patterns for: (a) LiNbO3 nanoparticles prepared by the described solution-phase synthesis; (b) a commercial LiNbO3 powder purchased from Sigma Aldrich; and (c) a reported LiNbO3 reference (JCPDS no. 020-0631). | ||
We also assessed the optimal reaction time to prepare crystalline LiNbO3 nanoparticles. Samples obtained at shorter reaction times (e.g., 72 h versus 96 h) resulted in the formation of semi-crystalline products as observed by XRD analyses (Fig. S4†). Several diffractions peaks for samples obtained at shorter reaction times were absent between 45° and 60° indicating an incomplete crystallization of the products when prepared at a reaction time of 72 h. Several of the diffraction peaks were also broader for these products, which indicated the presence of relatively small crystalline domains within these materials.
The composition, purity and phase of the LiNbO3 nanoparticles obtained by solvothermal treatment for 96 h were also characterized by Raman spectroscopy. Raman spectra of these samples were acquired over a spectral range from 100 to 950 cm−1 (Fig. 4). A Raman analysis of the commercial LiNbO3 powder purchased from Sigma Aldrich was also acquired to compare its phase and purity with the nanoparticles. The Raman spectrum of the LiNbO3 nanoparticles was in agreement with the spectrum observed for the commercial LiNbO3 sample, which further indicated the formation of a rhombohedral product.28 The Raman bands below 250 cm−1 (E-TO) were assigned to the deformation of the NbO6 framework, and the band centered at ∼600 cm−1 (A1-TO) corresponded to the symmetric stretching of Nb–O–Nb bonds in the rhombohedral LiNbO3 nanocrystals. Raman peaks at ∼430 cm−1 and ∼375 cm−1 (E-TO) were associated with the bending modes of the Nb–O–Nb bond, while the Raman band above 800 cm−1 was assigned to the antisymmetric stretching of the Nb–O–Nb bonds in the NbO6 octahedra of LiNbO3. The relative intensities and positions of the Raman bands can be strongly influenced by particle sizes smaller than 100 nm. A new and relatively intense peak ∼900 cm−1 was observed in the smaller nanocrystals of LiNbO3, which can be assigned to Nb![[double bond, length as m-dash]](https://www.rsc.org/images/entities/char_e001.gif) O stretching.55–57 This Raman band could be attributed to the enrichment of NbO bonds on the surfaces of the nanoparticles due to their relatively high surface to volume ratio and the presence of under-coordinated Nb atoms on their surfaces. The relative intensity of the Raman bands corresponding to the NbO stretch is inversely proportional to the diameter of the nanocrystals (e.g., nanocrystals of smaller diameters possess a relatively intense Raman band).36 It is worth noting that the A1-TO band centered around ∼600 cm−1 for the nanocrystals of LiNbO3 exhibited a red shift (∼37 cm−1) and an asymmetric broadening in comparison to those observed for the commercial LiNbO3 powder. This red shift and asymmetric broadening of the Raman bands can be attributed to a stronger influence of surface effects for the smaller diameter nanocrystals. This effect is due to the increased surface to volume ratio and the larger proportion of under-coordinated surface Nb atoms in the smaller LiNbO3 nanocrystals, which shift the vibrational density of states (VDOS) to lower frequencies.58,59 Raman spectroscopy techniques are also very sensitive to the symmetry of a material and can be used to assess compositional changes in a product. The physical and structural properties of LiNbO3 change linearly as a function of Li concentration due to the formation of Li rich (e.g., Li3NbO4) and Li poor (e.g., LiNb3O8) phases.60 The presence of Li poor or Li rich phases is undesirable due to their non-stoichiometric composition, which reduces the non-linear optical, electro-optical, and piezoelectric properties of the desired LiNbO3 product.18,60,61 Characteristic Raman bands for LiNb3O8 (e.g., 59, 79, 96, 542, 701 and 738 cm−1) and Li3NbO4 (e.g., 470, 520, 748 and 824 cm−1)60 were absent in the Raman spectra of the LiNbO3 nanoparticles prepared at 96 h through this solution-phase approach. In conclusion, these Raman spectroscopy results indicated the formation of pure nanocrystals of rhombohedral LiNbO3. Crystallinity of the product obtained by solvothermal treatment for 72 h was also investigated by Raman spectroscopy (Fig. S5†). This Raman spectrum indicated the formation of an semi-crystalline product as the characteristic E-TO Raman bands for rhombohedral LiNbO3 were absent in the product.62
O stretching.55–57 This Raman band could be attributed to the enrichment of NbO bonds on the surfaces of the nanoparticles due to their relatively high surface to volume ratio and the presence of under-coordinated Nb atoms on their surfaces. The relative intensity of the Raman bands corresponding to the NbO stretch is inversely proportional to the diameter of the nanocrystals (e.g., nanocrystals of smaller diameters possess a relatively intense Raman band).36 It is worth noting that the A1-TO band centered around ∼600 cm−1 for the nanocrystals of LiNbO3 exhibited a red shift (∼37 cm−1) and an asymmetric broadening in comparison to those observed for the commercial LiNbO3 powder. This red shift and asymmetric broadening of the Raman bands can be attributed to a stronger influence of surface effects for the smaller diameter nanocrystals. This effect is due to the increased surface to volume ratio and the larger proportion of under-coordinated surface Nb atoms in the smaller LiNbO3 nanocrystals, which shift the vibrational density of states (VDOS) to lower frequencies.58,59 Raman spectroscopy techniques are also very sensitive to the symmetry of a material and can be used to assess compositional changes in a product. The physical and structural properties of LiNbO3 change linearly as a function of Li concentration due to the formation of Li rich (e.g., Li3NbO4) and Li poor (e.g., LiNb3O8) phases.60 The presence of Li poor or Li rich phases is undesirable due to their non-stoichiometric composition, which reduces the non-linear optical, electro-optical, and piezoelectric properties of the desired LiNbO3 product.18,60,61 Characteristic Raman bands for LiNb3O8 (e.g., 59, 79, 96, 542, 701 and 738 cm−1) and Li3NbO4 (e.g., 470, 520, 748 and 824 cm−1)60 were absent in the Raman spectra of the LiNbO3 nanoparticles prepared at 96 h through this solution-phase approach. In conclusion, these Raman spectroscopy results indicated the formation of pure nanocrystals of rhombohedral LiNbO3. Crystallinity of the product obtained by solvothermal treatment for 72 h was also investigated by Raman spectroscopy (Fig. S5†). This Raman spectrum indicated the formation of an semi-crystalline product as the characteristic E-TO Raman bands for rhombohedral LiNbO3 were absent in the product.62
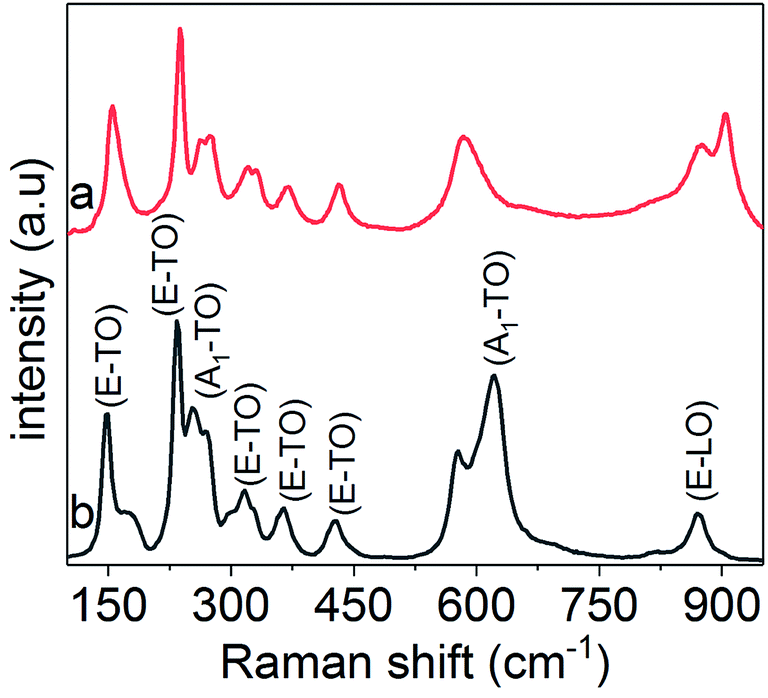 | ||
| Fig. 4 Analysis by Raman spectroscopy of: (a) LiNbO3 nanoparticles prepared after a period 96 h by the solution-phase synthesis; and (b) a commercial LiNbO3 powder purchased from Sigma Aldrich. | ||
Analysis of the optical second harmonic response of LiNbO3 nanoparticles
The optical second harmonic response of the LiNbO3 nanocrystals was also examined to evaluate their non-linear optical (NLO) properties. Non-linear optical materials have a wide range of important applications that include quantum light sources, frequency convertors, ultrafast optical switches, and memory storage devices.63–66 Non-linear optical processes, such as second harmonic and third harmonic generation, can be observed when a sufficiently intense light source interacts with the electric fields within a NLO medium. Distinct from linear optical materials, the properties of a NLO medium such as its refractive index and absorption coefficient are dependent on the intensity of the incident light. The non-linear interactions between the incident photons and electric fields of the NLO materials usually requires a relatively high intensity of these incident photons.66,67 Second harmonic generation is a second-order NLO process in which two incident photons of the same frequency (ω) are converted into a single photon having double the initial frequency (2ω).67 The SHG signal is produced when light of a sufficiently intensity interacts with a material lacking an inversion symmetry. The oscillating electric field of the incident photons at a particular frequency (ωi) results in a non-linear polarization of the NLO medium, which upon relaxation results in the emission of single photon at the twice incident frequency (2ωi).68,69 Unlike two-photon based excitation of fluorescence that involves the transition of electrons to a real excited state, the SHG process is a scattering process that involves the transition to a virtual excited state (Fig. S7†). The resulting SHG response can be tuned by changing the excitation wavelength.68 The SHG signal intensity does, however, depend on several factors that include the intensity, polarization, and wavelength of the incident light, the dimensions and non-linear susceptibility of the materials, and the numerical aperture (NA) of the optical lenses used in these measurements.66,68 Recently, nanometer sized materials have received interest for their potential use as probes in SHG based microscopy, with the absence of blinking and a flat frequency conversion response, contrary to quantum dots.69 The NLO materials have also been sought for their ability to generate coherent light emission and for exhibiting stability against bleaching, contrary to fluorescent dyes.70 Nanoscale NLO crystals are also beneficial for the preparation of hybrid materials by embedding these nanocrystals into easily processable polymers.71–73 Another advantage of nanoscale NLO materials is their ability to generate a second harmonic response without requiring phase-matching conditions. The intensity of the SHG in bulk NLO materials (e.g., where size of the crystals exceeds the wavelength of the incident light) is only appreciable if it obeys phase-matching conditions, which occurs if the second harmonic response moves in the material at the same velocity and in the same direction as the incident photons, resulting in a constructive interference. However, nanoscale NLO crystals do not require this phase-matching condition for producing an appreciable second harmonic response due to their relatively small diameters with respect to the wavelength of the incident photons. Due to the lack of phase-matching conditions, the SHG produced anywhere in the nanocrystal will be approximately in phase, allowing scattering to efficiently proceed along multiple directions.73–76Lithium niobate is a non-centrosymmetric material and is one of the most versatile NLO materials with a variety of interesting properties, such as its optical second harmonic response, ferroelectric response, electro-optic activity, and piezoelectric response. Lithium niobate based nanomaterials have attracted attention due to their relatively large second order susceptibilities (e.g., 41.7 pm V−1) and relatively wide window of optical transparency (e.g., 400 to 5000 nm).36 Lithium niobate is also a fairly stable SHG material and has a relatively large non-linear optical coefficient.77–79 The preparation of nanoscale LiNbO3 nanocrystals has been of particular interest due to their properties emerging from dimensional confinement, which have potential applications in bio-imaging, biological and chemical sensing, and NLO devices.67,70,80–82 Our nanocrystals of LiNbO3 were optically transparent between 400 and 1000 nm, and had a direct band gap 3.85 eV (Fig. S8 and S9†). The SHG activity and its tunability for the ∼7 nm diameter LiNbO3 nanoparticles were studied for different incident fundamental wavelengths (FW) using a tunable femtosecond (fs) pulsed laser. The incident FWs were generated using a mode-locked Ti:sapphire laser with a pulse width of ∼140 fs and a tunable output of FWs from 680 to 1080 nm. The repetition rate and tuning speed of the fs pulses were 80 MHz and >40 nm s−1, respectively. The SHG for a powdered sample of the LiNbO3 nanoparticles was assessed for a series of discrete FWs while maintaining a constant incident power. A second harmonic response was observed at 400, 425, 450, 475 and 500 nm when the LiNbO3 product was excited with FWs of 800, 850, 900, 950, and 1000 nm, respectively. These results correlated well to the anticipated frequency doubling of the FWs (Fig. 5). Pseudo-colored images were prepared corresponding to the intensity and wavelength of the second harmonic response from the powdered LiNbO3 product, as shown in Fig. 5. These pseudo-color images were prepared from grey-scale images through the use of Leica Application Suite X to match their color to the corresponding wavelength of the scattered SHG signal. These results indicated that the ∼7 nm diameter nanocrystals of LiNbO3 are SHG active and can generate a second harmonic response over a broad range of wavelengths by adjusting the wavelength of the incident fs pulsed laser. Due to limitations in the configuration of our source and detector, we were limited to studying the NLO properties of these materials over the range from 400 to 500 nm. The SHG of these LiNbO3 nanocrystals could be further extended and tuned to near- and far-infrared wavelengths by choosing appropriate incident wavelengths.71 Intensity of the SHG signals obtained from these samples decreased with increasing wavelength of the incident light (Fig. S10†). This decrease in the intensity of the SHG signals corresponded to a decrease in the peak power of the fs pulsed laser with increasing wavelength (Fig. S11 and eqn (S1)†). The observed decrease in power also correlated with an increase in the beam waist, which resulted a decreased intensity of the SHG signals (eqn (S2)†). The full width at half maximum (FWHM) of the measured second harmonic response should corresponded to 1/√2 of the bandwidth of the femtosecond pulsed laser used to generate the SHG response.82 An average FWHM of 7 nm was measured for the SHG from the ∼7 nm diameter LiNbO3 nanocrystals, which is significantly narrower than the FWHM of the emission signal reported for many fluorescent probes. Fluorescence markers, including quantum dots and organic dyes, have spectral bandwidths (e.g., FWHM) for their emission signals within the range of 20 to 50 nm.83,84 The tunable wavelength and narrow bandwidth of the SHG response from the LiNbO3 nanocrystals enable advantages that include generating multiplexed optical images, tuning the response to avoid autofluorescence, and increasing the penetration depth of the analysis by minimizing contributions from scattering and absorption.70 These SHG active LiNbO3 nanocrystals could be used as bio-imaging probes, and could open up new opportunities in SHG microscopy techniques.
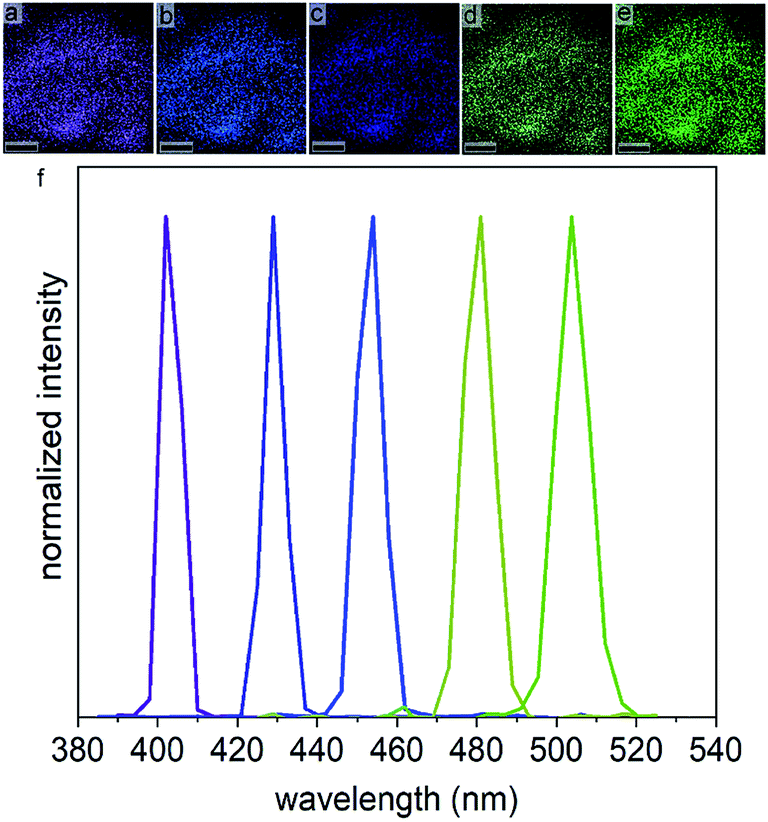 | ||
| Fig. 5 The pseudo-colored second harmonic generation (SHG) based images (scale bars = 5 μm) for powders of the LiNbO3 nanoparticles placed on a glass cover-slip and irradiated using a pulsed laser with an excitation wavelength of: (a) 800 nm; (b) 850 nm; (c) 900 nm; (d) 950 nm; and (e) 1000 nm. (f) Second harmonic response of the ∼7 nm diameter LiNbO3 nanoparticles indicate their tunable emission at 400, 425, 450, 475 and 500 nm when excited at the corresponding wavelengths reported for samples (a) to (e). | ||
Conclusions
In conclusion, we have successfully prepared single-crystalline LiNbO3 nanoparticles with average diameters of 7 nm using a solution-phase method. Advantages of this solution-phase method include the formation of crystalline nanoparticles without needing post-synthetic thermal processing of the product, and no need for an inert atmosphere to process the reagents or for the reaction. This solvothermal one-pot approach resulted in the formation of well-dispersed nanoparticles of LiNbO3 without requiring the addition of further organic additives (e.g., surfactants). The non-aqueous sol–gel processes of this solvothermal method resulted in the in situ formation of LiOH and NbOx(OH)y(OR)z species, followed by their condensation and aging at higher temperatures to form crystalline LiNbO3 nanoparticles. Structural characterization by TEM, HRTEM, SAED, and XRD indicated that the product contained single-crystalline, LiNbO3 nanoparticles with {012}, {104} {116} and {202} as major facets. The results of these analyses suggested that there was no single preferred growth direction for the nanoparticles. This reaction resulted in the formation of semispherical nanoparticles of LiNbO3. Composition and phase of the products were characterized using XRD and Raman spectroscopy techniques, which indicated the formation of rhombohedral nanocrystals of LiNbO3. The LiNbO3 nanoparticles were determined to be SHG active. Their optical second harmonic response was tuned from 400 to 500 nm by adjusting the wavelength of incident pulsed laser. The second harmonic response of the nanocrystals could be further tuned by choosing a suitable wavelength for the incident laser. These SHG active LiNbO3 nanoparticles could be used as optical imaging probes and for the fabrication of non-linear optical devices (e.g., electro-optical devices, biosensors).Conflicts of interest
There are no conflicts of interest to declare.Acknowledgements
This work was supported in part by the Natural Sciences and Engineering Research Council (NSERC) of Canada (Grant No. 1077758), and through the Collaborative Health Research Projects (CHRP) Partnership Program supported in part by the Canadian Institutes of Health Research (Grant No. 134742) and the Natural Science Engineering Research Council of Canada (Grant No. CHRP 462260), the Canada Research Chairs Program (B. D. Gates, Grant No. 950-215846) and MNT Financial Assistance (CMC Microsystems, MNT Grant No. 4279). This work made use of 4D LABS (http://www.4dlabs.com) and the Center for Soft Materials shared facilities supported by the Canada Foundation for Innovation (CFI), British Columbia Knowledge Development Fund (BCKDF), Western Economic Diversification Canada, and Simon Fraser University. We also thank Dr Saeid Kamal (4D LABS) for discussions and assistance in acquiring the SHG spectra for the samples.References
- M. Kösters, B. Sturman, P. Werheit, D. Haertle and K. Buse, Nat. Photonics, 2009, 3, 510–513 CrossRef.
- B. J. Ash, S. R. Worsfold, P. Vukusic and G. R. Nash, Nat. Commun., 2017, 8, 174 CrossRef CAS PubMed.
- M. Allgaier, V. Ansari, L. Sansoni, C. Eigner, V. Quiring, R. Ricken, G. Harder, B. Brecht and C. Silberhorn, Nat. Commun., 2017, 8, 14288 CrossRef CAS PubMed.
- K. Buse, A. Adibi and D. Psaltis, Nature, 1998, 393, 665–668 CrossRef CAS.
- W. Yang, P. G. Kazansky and Y. P. Svirko, Nat. Photonics, 2008, 2, 99–104 CrossRef CAS.
- A. Guarino, G. Poberaj, D. Rezzonico, R. Degl'Innocenti and P. Günter, Nat. Photonics, 2007, 1, 407–410 CrossRef CAS.
- M. Soljačić and J. D. Joannopoulos, Nat. Mater., 2004, 3, 211–219 CrossRef PubMed.
- A. Zaltron, G. Bettella, G. Pozza, R. Zamboni, M. Ciampolillo, N. Argiolas, C. Sada, S. Kroesen, M. Esseling and C. Denz, Proc. SPIE, 2015, 9506, 950601–950608 CrossRef.
- N. Segal, S. Keren-Zur, N. Hendler and T. Ellenbogen, Nat. Photonics, 2015, 9, 180–184 CrossRef CAS.
- K. Chen, B. Sun, F. Chen, Z. Hu and Y. Cao, Microw. Opt. Technol. Lett., 2012, 54, 421–423 CrossRef.
- C. Wang, Z. Li, M.-H. Kim, X. Xiong, X.-F. Ren, G.-C. Guo, N. Yu and M. Lončar, Nat. Commun., 2017, 8, 2098 CrossRef PubMed.
- A. S. Andrushchak, B. G. Mytsyk, H. P. Laba, O. V Yurkevych, I. M. Solskii, A. V Kityk and B. Sahraoui, J. Appl. Phys., 2009, 106, 73510 CrossRef.
- H. Ledbetter, H. Ogi and N. Nakamura, Mech. Mater., 2004, 36, 941–947 CrossRef.
- A. Rao, M. Malinowski, A. Honardoost, J. R. Talukder, P. Rabiei, P. Delfyett and S. Fathpour, in Frontiers in Optics, Optical Society of America, 2016, vol. 24, pp. 29941–29947 Search PubMed.
- Z. Chen, J. Huang, Y. Yang, Y. Wang, Y. Wu, H. He, X. Wei, Z. Ye, H. Zeng and H. Cong, RSC Adv., 2012, 2, 7380–7383 RSC.
- N. T. K. Thanh and L. A. W. Green, Nano Today, 2010, 5, 213–230 CrossRef CAS.
- A. Sergeyev, M. R. Escalé and R. Grange, J. Phys. D: Appl. Phys., 2016, 50, 44002 CrossRef.
- D. Xue and S. Zhang, J. Phys.: Condens. Matter, 1997, 9, 7515–7522 CrossRef CAS.
- R. Geiss, S. Saravi, A. Sergeyev, S. Diziain, F. Setzpfandt, F. Schrempel, R. Grange, E.-B. Kley, A. Tünnermann and T. Pertsch, Opt. Lett., 2015, 40, 2715–2718 CrossRef CAS PubMed.
- M. S. Majdoub, P. Sharma and T. Cagin, Phys. Rev. B: Condens. Matter Mater. Phys., 2008, 77, 125424 CrossRef.
- M. Algueró, J. M. Gregg and L. Mitoseriu, Nanoscale Ferroelectrics and Multiferroics: Key Processing and Characterization Issues, and Nanoscale Effects, 2 Volumes, John Wiley & Sons, 2016, pp. 473–501 Search PubMed.
- A. R. Hadjesfandiari, Int. J. Solids Struct., 2013, 50, 2781–2791 CrossRef.
- S. Wohlrab, M. Weiss, H. Du and S. Kaskel, Chem. Mater., 2006, 18, 4227–4230 CrossRef CAS.
- E. R. Camargo and M. Kakihana, Chem. Mater., 2001, 13, 1905–1909 CrossRef CAS.
- E. Lamouroux, L. Badie, P. Miska and Y. Fort, Inorg. Chem., 2016, 55, 2246–2251 CrossRef CAS PubMed.
- C. Yerlikaya, N. Ullah, A. R. Kamali and R. V. Kumar, J. Therm. Anal. Calorim., 2016, 125, 17–22 CrossRef CAS.
- R. Grange, F. Dutto and A. Radenovic, in Nanowires-Implementations and Applications, InTech, 2011, pp. 509–524 Search PubMed.
- A. C. Santulli, H. Zhou, S. Berweger, M. B. Raschke, E. Sutter and S. S. Wong, CrystEngComm, 2010, 12, 2675–2678 RSC.
- L. Li, J. Deng, J. Chen and X. Xing, Chem. Sci., 2016, 7, 855–865 RSC.
- H. C. Zeng and S. K. Tung, Chem. Mater., 1996, 8, 2667–2672 CrossRef CAS.
- N. T. K. Thanh, N. Maclean and S. Mahiddine, Chem. Rev., 2014, 114, 7610–7630 CrossRef CAS PubMed.
- J. D. Mackenzie and E. P. Bescher, Acc. Chem. Res., 2007, 40, 810–818 CrossRef CAS PubMed.
- M. Niederberger, N. Pinna, J. Polleux and M. Antonietti, Angew. Chem., 2004, 116, 2320–2323 CrossRef.
- D. Mohanty, G. S. Chaubey, A. Yourdkhani, S. Adireddy, G. Caruntu and J. B. Wiley, RSC Adv., 2012, 2, 1913–1916 RSC.
- B. D. Wood, V. Mocanu and B. D. Gates, Adv. Mater., 2008, 20, 4552–4556 CrossRef CAS.
- R. F. Ali and B. D. Gates, Chem. Mater., 2018, 30, 2028–2035 CrossRef CAS.
- J. Li, J. Qiu, W. Guo, S. Wang, B. Ma, X. Mou, M. Tanes, H. Jiang and H. Liu, Nanoscale, 2016, 8, 7416–7422 RSC.
- G. Liu, S. You, M. Ma, H. Huang and N. Ren, Environ. Sci. Technol., 2016, 50, 11218–11225 CrossRef CAS PubMed.
- M. Stock and S. Dunn, J. Phys. Chem. C, 2012, 116, 20854–20859 CrossRef CAS.
- V. Marchesano, O. Gennari, L. Mecozzi, S. Grilli and P. Ferraro, ACS Appl. Mater. Interfaces, 2015, 7, 18113–18119 CrossRef CAS PubMed.
- G. Poberaj, H. Hu, W. Sohler and P. Guenter, Laser Photonics Rev., 2012, 6, 488–503 CrossRef CAS.
- M. Niederberger, Acc. Chem. Res., 2007, 40, 793–800 CrossRef CAS PubMed.
- M. Niederberger, G. Garnweitner, N. Pinna and M. Antonietti, J. Am. Chem. Soc., 2004, 126, 9120–9126 CrossRef CAS PubMed.
- L. Z. Zhang, I. Djerdj, M. Cao, M. Antonietti and M. Niederberger, Adv. Mater., 2007, 19, 2083–2086 CrossRef CAS.
- N. Pinna, G. Garnweitner, P. Beato, M. Niederberger and M. Antonietti, Small, 2005, 1, 112–121 CrossRef CAS PubMed.
- L. Zhang, G. Garnweitner, I. Djerdj, M. Antonietti and M. Niederberger, Chem.–Asian J., 2008, 3, 746–752 CrossRef PubMed.
- J. Von Hoene, R. G. Charles and W. M. Hickam, J. Phys. Chem., 1958, 62, 1098–1101 CrossRef CAS.
- M. Cargnello, T. R. Gordon and C. B. Murray, Chem. Rev., 2014, 114, 9319–9345 CrossRef CAS PubMed.
- R. K. Sodhi and S. Paul, Catal. Surv. Asia, 2018, 22, 31–62 CrossRef CAS.
- J. H. Donnay and D. Harker, Am. Mineral., 1937, 22, 446–467 CAS.
- R. Docherty, G. Clydesdale, K. J. Roberts and P. Bennema, J. Phys. D: Appl. Phys., 1991, 24, 89–99 CrossRef CAS.
- R. A. Sullivan and R. J. Davey, CrystEngComm, 2015, 17, 1015–1023 RSC.
- D. Kumar, R. Thipparaboina and N. R. Shastri, J. Comput. Sci., 2015, 10, 178–185 CrossRef.
- P. M. Vilarinho, N. Barroca, S. Zlotnik, P. Félix and M. H. Fernandes, Mater. Sci. Eng., C, 2014, 39, 395–402 CrossRef CAS PubMed.
- J. M. Jehng and I. E. Wachs, Chem. Mater., 1991, 3, 100–107 CrossRef CAS.
- Y. Zhang, L. Guilbert, P. Bourson, K. Polgar and M. D. Fontana, J. Phys.: Condens. Matter, 2006, 18, 957–963 CrossRef CAS.
- Y. Repelin, E. Husson, F. Bennani and C. Proust, J. Phys. Chem. Solids, 1999, 60, 819–825 CrossRef CAS.
- C. C. Yang and S. Li, J. Phys. Chem. B, 2008, 112, 14193–14197 CrossRef CAS PubMed.
- K. H. Khoo, A. T. Zayak, H. Kwak and J. R. Chelikowsky, Phys. Rev. Lett., 2010, 105, 115504 CrossRef CAS PubMed.
- A. Bartasyte, V. Plausinaitiene, A. Abrutis, S. Stanionyte, S. Margueron, P. Boulet, T. Kobata, Y. Uesu and J. Gleize, J. Phys.: Condens. Matter, 2013, 25, 205901 CrossRef PubMed.
- Y. S. Luh, M. M. Fejer, R. L. Byer and R. S. Feigelson, J. Cryst. Growth, 1987, 85, 264–269 CrossRef CAS.
- P. Heitjans, M. Masoud, A. Feldhoff and M. Wilkening, Faraday Discuss., 2007, 134, 67–82 RSC.
- S. Tanzilli, W. Tittel, M. Halder, O. Alibart, P. Baldi, N. Gisin and H. Zbinden, Nature, 2005, 437, 116–120 CrossRef CAS PubMed.
- B. Corcoran, C. Monat, C. Grillet, D. J. Moss, B. J. Eggleton, T. P. White, L. O'Faolain and T. F. Krauss, Nat. Photonics, 2009, 3, 206–210 CrossRef CAS.
- K. Nozaki, A. Shinya, S. Matsuo, Y. Suzaki, T. Segawa, T. Sato, Y. Kawaguchi, R. Takahashi and M. Notomi, Nat. Photonics, 2012, 6, 248–252 CrossRef CAS.
- W. Nie, Adv. Mater., 1993, 5, 520–545 CrossRef CAS.
- L. Tong and J.-X. Cheng, Mater. Today, 2011, 14, 264–273 CrossRef CAS.
- D. Dini, M. J. F. Calvete and M. Hanack, Chem. Rev., 2016, 116, 13043–13233 CrossRef CAS PubMed.
- P. Pantazis, J. Maloney, D. Wu and S. E. Fraser, Proc. Natl. Acad. Sci. U.S.A., 2010, 107, 14535–14540 CrossRef CAS PubMed.
- L. Bonacina, Mol. Pharm., 2012, 10, 783–792 CrossRef PubMed.
- Y. Nakayama, P. J. Pauzauskie, A. Radenovic, R. M. Onorato, R. J. Saykally, J. Liphardt and P. Yang, Nature, 2007, 447, 1098–1101 CrossRef CAS PubMed.
- B. Knabe, K. Buse, W. Assenmacher and W. Mader, Phys. Rev. B: Condens. Matter Mater. Phys., 2012, 86, 195428 CrossRef.
- W. P. Dempsey, S. E. Fraser and P. Pantazis, BioEssays, 2012, 34, 351–360 CrossRef CAS PubMed.
- E. Kim, A. Steinbrück, M. T. Buscaglia, V. Buscaglia, T. Pertsch and R. Grange, ACS Nano, 2013, 7, 5343–5349 CrossRef CAS PubMed.
- F. Timpu, A. Sergeyev, N. R. Hendricks and R. Grange, ACS Photonics, 2016, 4, 76–84 CrossRef.
- A. Sergeyev, R. Geiss, A. S. Solntsev, A. A. Sukhorukov, F. Schrempel, T. Pertsch and R. Grange, ACS Photonics, 2015, 2, 687–691 CrossRef CAS.
- M. Manzo, F. Laurell, V. Pasiskevicius and K. Gallo, in Nano-Optics for Enhancing Light-Matter Interactions on a Molecular Scale, Springer, 2013, pp. 421–422 Search PubMed.
- F. Dutto, C. Raillon, K. Schenk and A. Radenovic, Nano Lett., 2011, 11, 2517–2521 CrossRef CAS PubMed.
- A. Rogov, Y. Mugnier and L. Bonacina, J. Opt., 2015, 17, 33001 CrossRef.
- I. V. Shadrivov, M. Lapine and Y. S. Kivshar, Nonlinear, Tunable and Active Metamaterials, Springer, 2015, vol. 1, pp. 89–129 Search PubMed.
- P. D. Schmitt, Mol. Pharm., 2017, 14, 555–565 CrossRef CAS PubMed.
- T. T. Tran, H. Yu, J. M. Rondinelli, K. R. Poeppelmeier and P. S. Halasyamani, Chem. Mater., 2016, 28, 5238–5258 CrossRef CAS.
- W. C. W. Chan and S. Nie, Science, 1998, 281, 2016–2018 CrossRef CAS PubMed.
- M. Bruchez, M. Moronne, P. Gin, S. Weiss and A. P. Alivisatos, Science, 1998, 281, 2013–2016 CrossRef CAS PubMed.
Footnote |
| † Electronic supplementary information (ESI) available. See DOI: 10.1039/c8na00171e |
| This journal is © The Royal Society of Chemistry 2019 |