
 Open Access Article
 This Open Access Article is licensed under a
 Creative Commons Attribution 3.0 Unported Licence
Liquid layer generators for excellent icephobicity at extremely low temperatures†
Feng
Wang
 a,
Senbo
Xiao
a,
Yizhi
Zhuo
a,
Wenwu
Ding
b,
Jianying
He
*a and
Zhiliang
Zhang
*a
a,
Senbo
Xiao
a,
Yizhi
Zhuo
a,
Wenwu
Ding
b,
Jianying
He
*a and
Zhiliang
Zhang
*a
aNTNU Nanomechanical Lab, Department of Structural Engineering, Norwegian University of Science and Technology (NTNU), Richard Birkelands vei 1A, Trondheim 7491, Norway. E-mail: jianying.he@ntnu.no; zhiliang.zhang@ntnu.no
bDepartment of Energy and Process Engineering, Norwegian University of Science and Technology (NTNU), Kolbjørn Hejes v 1B, Trondheim 7491, Norway
First published on 1st July 2019
Abstract
Promising progress in the field of icephobicity has been made in the recent years. However, a majority of the reported icephobic surfaces rely on static mechanisms, and they maintain low ice adhesion on surfaces at extreme temperatures (as low as −60 °C), which is highly challenging. Dynamic anti-icing surfaces, which can melt ice or change the ice–substrate interfaces from the solid to liquid phase after the formation of ice, serve as a viable alternative. In this study, liquid layer generators (LLGs), which can release ethanol to the ice–solid interface and convert the ice–substrate contact from the solid–solid mode to the solid–liquid–solid mode, were introduced. Excellent icephobicity on surfaces with an ethanol lubricating layer was found to withstand extremely low temperatures (−60 °C), which was proven by both molecular dynamics simulations and experiments. Two prototypes of LLGs, one by packing ethanol inside and the other by storing replenishable ethanol below the substrate, were fabricated. These LLGs could constantly release ethanol for a maximum of 593 days without source replenishment. Both these prototypes exhibited super-low ice adhesion strengths of 1.0–4.6 kPa and 2.2–2.8 kPa at −18 °C. For select samples, by introducing an interfacial ethanol layer, the ice adhesion strength on the same surfaces decreased in an unprecedented manner from 709.2–760.9 kPa to 22.1–25.2 kPa at a low temperature of −60 °C.
New conceptsState-of-the-art icephobic surfaces mainly rely on static solid–solid ice–substrate contact that fails at low temperatures with a threshold of around −50 °C. A new strategy for anti-icing at such low temperatures is required. Dynamic anti-icing surfaces, which can melt ice or change the ice–substrate interfaces from the solid to liquid phase after the formation of ice, serve as a viable alternative. In this study, durable polymeric materials, termed as liquid layer generators (LLGs), were designed and fabricated to target the achievement of low ice adhesion strengths at unprecedented low temperatures. These LLGs could constantly release interfacial ethanol for a maximum of 593 days, which dynamically converted the ice contact from a firm solid–solid mode to a weak solid–liquid–solid mode, thereby demonstrating super-low ice adhesion strength of ∼1 kPa. By introducing a porous layer below the substrate, the interfacial liquid layer could be controlled by replenishable ethanol. The LLG could also overcome the problems of surface roughness and hydrophilicity that fail other icephobic surfaces. At extremely low temperatures of −60 °C, these LLGs maintained low ice adhesion strengths (22.1–25.2 kPa), exhibiting encouraging potential for practical arctic anti-icing applications. |
Introduction
Unwanted ice formation and accretion is a common threat to road safety, aircrafts, electrical transmission cables, wind turbines, and many other devices,1–3 which requires a tremendous amount of energy input for traditional deicing.4 Consequently, designing and deploying materials and surfaces that can assist in the removal of ice have received growing interests.5 In the recent years, four main classes of anti-icing/icephobic surfaces have been developed. First, the lotus-leaf effect has inspired superhydrophobic surfaces that can delay or prevent ice formation.6,7 Unfortunately, such superhydrophobic surfaces can result in higher water-freezing rates than that in smooth surfaces in a highly humid environment,8 and its hierarchical surface structure can enable mechanical interlocking with strong ice adhesion.9,10 Second, lubricant-infused surfaces can repel incoming water and lower ice adhesion strength.11,12 For such types of icephobic surfaces, the depletion of the lubricants remains an unresolved problem, particularly in icing/deicing cycles.13,14 Third, interfacial slippage surfaces can imbibe oil into silicon elastomers and show low ice adhesion strength.15–17 However, the swelling of a polymer in oil may degrade the mechanical durability of such a composite. Finally, macrocrack initiators (MACI) and stress localization promote the development of surfaces that can facilitate crack generation through stiffness inhomogeneity and deformation incompatibility as well as achieve super-low ice adhesion strength without the use of any surface additives.18,19 Such MACI surfaces can be combined with other mechanisms to further reduce ice adhesion. Notably, other new strategies for anti-icing have emerged, particularly those that involve ice growth and patterns into the design of surface icephobicity.20–22The surfaces discussed above can be generally categorized as static anti-icing surfaces, implying that there is no dynamic change in the chemical/physical states of the ice–substrate interfaces on these surfaces after ice formation. In contrast, emerging dynamic anti-icing strategies focus on melting or altering the solid ice–substrate interfaces.23,24 One interesting example of these new dynamic anti-icing surfaces is the photothermal trap approach that utilizes solar illumination or near-infrared irradiation for the rapid melting of accumulated ice.23 Another notable dynamic anti-icing surface contains polymers with hydrophilic pendant groups that can absorb water from ice and generate an aqueous lubricating layer at the interface.21 These dynamic anti-icing surfaces hold the potential of gradually converting firm solid–solid ice–substrate contacts to a weak solid–liquid–solid characteristic, and they could maintain icephobicity in a broader temperature range.24 For instance, a photothermal trap can result in a temperature rise as high as 33 °C,23 and an aqueous lubricating layer shows great icephobicity before −53 °C.24
The ice adhesion strength on dynamic anti-icing surfaces with an aqueous lubrication layer was reported to be ∼27 kPa,24 which await optimization to achieve practical passive anti-icing application levels (lower than ∼12 kPa).18,25 The icephobicity of the dynamic anti-icing surface critically relies on generating an interfacial aqueous layer. When this crucial interfacial liquid layer freezes at lower temperatures (for example, close to −60 °C), the ice adhesion strength can sharply increase to higher than 400 kPa.24 Therefore, the ability of dynamic anti-icing surfaces to maintain icephobicity in an arctic environment with extremely lower temperatures (−60 °C or even lower) is still a formidable challenge.
The aim of this work is to fabricate dynamic icephobic surfaces that can function at extremely low temperatures. We focus on fabricating a coating, termed as a liquid layer generator (LLG), which can release ethanol at the ice–solid interface for generating a lubricating effect and yielding low ice adhesion strength. First, we used atomistic modeling and simulations to compare the ice adhesion force on substrates with and without a liquid lubricating layer at various temperatures (down to −60 °C) and investigated the reduction in atomistic ice adhesion by substituting the interfacial aqueous layer to a lubricating ethanol layer. On such a theoretical basis, we synthesized ethanol-contained polymers with various roughness levels and chemical components that can release ethanol to the ice–substrate interface, namely, generating an interfacial liquid layer. The fabricated LLGs were found to function at −60 °C with worthwhile icephobicity and significant lifespan. Our combined theoretical and experimental studies contribute toward the understanding of the novel dynamic anti-icing field. LLGs can provide a path to facilitate anti-icing applications in unprecedented low temperatures.
Materials and methods
Atomistic modeling and molecular dynamics (MD) simulations
Atomistic modeling and MD simulations were employed to investigate the lubricating effect of an ethanol layer of various thicknesses at different temperatures. For the sake of simplicity, graphene platelets (dimensions: 2.3 nm × 2.3 nm) were used to fabricate a carbon-based surface, as shown in Fig. S1 (ESI†). These graphene platelets were stacked on top of each other at an equilibrium distance of ∼0.6 nm at each edge and extended to a periodic area of 10.4 nm × 10.4 nm. Ice (thickness: 2 nm), with and without ethanol layers of 1 and 2 nm, was then modeled on the substrate, as shown in the photographs of the example system in Fig. S1a and S2 (ESI†). A simulation system with an interfacial aqueous layer (thickness: 2 nm) was also built for comparing the lubricating effect, as shown in Fig. S3(a) (ESI†). The water molecules used the TIP4P/ice model in this system. The OPLS force field was used for the graphene platelets and ethanol layer, and the TIP4P/ice model was used for modeling ice in all the MD simulations.26,27 The MD package, GROMACS 5.0.7, was employed to perform all the simulations.28 All the systems were equilibrated for 50 ns before subjected to ice adhesion and shearing simulations. In all the MD simulations, the time step used was 2 fs. The cutoff for nonbonded interaction was 1 nm. The graphene platelets were completely fixed at their position, providing a solid surface. The ice was maintained at a temperature of −93 °C, which is similar to a former study.29 The ethanol layers were maintained at various temperatures of −18, −35, and −60 °C in different simulations. The same simulation parameters were applied to the system with an aqueous lubricating layer for comparing the lubricating effect at these three temperatures. The Nosé–Hoover temperature coupling method was employed in the simulations,30,31 where the coupling constant was 0.4 ps. In order to determine the ice adhesion strength and shearing stress, the pulling force was subjected to the center of mass (COM) of the ice, which is similar to that done in earlier studies.29,32 For determining the vertical ice adhesion strength, the force constant of the pulling harmonic potential was 500 kJ mol−1 nm−2. Because of the limited space for horizontal shearing in the periodic simulation box, the harmonic potential was maintained at 2000 kJ mol−1 nm−2. The pulling speed for all the deicing simulations was 0.5 m s−1. The ice adhesion strength was calculated using the maximal force for vertical pulling normalized by the surface cross-section area, namely, σ = fmax/A, while the ice shearing stress was obtained by the shearing force normalized by the surface cross-section area, namely, τ = fshear/A.Fabrication of LLGs with ethanol inside the substrates
We used the silicon rubber Ecoflex™ 00-50 (Smooth-On, Inc.) as the matrix material. The silicon rubber was added in two steps. Silicon rubber part A was first mixed with absolute ethanol (Sigma-Aldrich) by mechanical stirring for 3 min. Part B was immediately added, and the entire mixture was stirred for another 3 min. The ethanol contents in the mixture were 10, 20, 30, and 40 vol%. The final mixtures were cast into plastic molds and cured at room temperature. After 3 h, LLG 1 was fabricated at various ethanol contents. The ethanol droplets initially trapped in the silicon rubber were spherical, as shown in Fig. S4 (ESI†), where the diameter ranged from 0.37 to 0.47 mm depending on the ethanol content (Fig. S5, ESI†). Ethanol droplets were formed in the silicone rubber curing process, which mostly resulted from the exclusion of the ethanol molecules by the cured polymer chains. The ethanol droplets were, therefore, firmly imprisoned in the polymer matrix at the initial state of LLG 1.Fabrication of LLGs with capacity below the substrates for replenishable ethanol
Firstly, 4 inch silicon wafers were successively cleaned with ethanol, acetone, and isopropanol. Then, mr-DWL 5 (micro resist technology GmbH) was spin-coated on the silicon wafer at 2000 rpm for 30 s, followed by prebaking at 50 and 90 °C (5 min for each process). The silicon wafer with mr-DWL5 was exposed to MLA150 (Maskless Photolithography, Heidelberg Instruments), followed by post-baking at 50 and 90 °C (5 min for each process). After developing in mr-Dev 600 (micro resist technology GmbH) for ∼35 min and hard-baking at 150 °C for 15 min, the silicon wafer with pillars of uniform sizes were fabricated. The patterned area was controlled to dimensions of 5 cm × 5 cm for all the wafers. The distance between the pillars varied from 5 μm to 30 μm, as shown in Fig. 4a–c and Fig. S8 (ESI†).The silicon wafers with pillars were silanized with trichloro(1H,1H,2H,2H-perfluoroocty)silane (Sigma-Aldrich) in a vacuum chamber for 8 h for facilitating peeling off of the polydimethylsiloxane (PDMS). PDMS prepolymer (Sylgard 184, Dow Corning) and curing agent were mixed in a weight ratio of 10![[thin space (1/6-em)]](https://www.rsc.org/images/entities/char_2009.gif) :1 and stirred for 5 min. The mixtures were degassed in a vacuum chamber for 30 min to remove air bubbles. The liquid was poured onto the patterned silicon wafer and held for 5 min and then spin-coated (WS-400B-6NPP-LITE/AS, Laurell Technologies) for 1 min at a speed of 500 rpm to obtain the PDMS film (thickness: 420 μm). After curing at 60 °C for 3 h, the PDMS films with subholes were carefully peeled off from the silicon substrates. The films were transferred to glass and prepared for the ice adhesion tests. To finalize LLG 2, ethanol was filled into the subpores using an injector.
:1 and stirred for 5 min. The mixtures were degassed in a vacuum chamber for 30 min to remove air bubbles. The liquid was poured onto the patterned silicon wafer and held for 5 min and then spin-coated (WS-400B-6NPP-LITE/AS, Laurell Technologies) for 1 min at a speed of 500 rpm to obtain the PDMS film (thickness: 420 μm). After curing at 60 °C for 3 h, the PDMS films with subholes were carefully peeled off from the silicon substrates. The films were transferred to glass and prepared for the ice adhesion tests. To finalize LLG 2, ethanol was filled into the subpores using an injector.
Silica nanoparticles and poly(vinyl alcohol) (PVA) were used as surface modifiers for the PDMS surfaces. SiO2 was synthesized through a facile method. Firstly, 5 ml ammonium hydroxide (28%, Sigma-Aldrich), 95 ml absolute ethanol (>99.8%, Sigma-Aldrich), and 5 ml deionized water were mixed and stirred in a three-necked flask for 10 min. Secondly, the mixture was heated to 60 °C and then 3 ml tetraethyl orthosilicate (TEOS, >99.8%, Sigma-Aldrich) was added. Finally, after stirring for another 12 h, the ethanoic suspension of silica nanoparticles (particle size: ∼222.7 nm) were obtained (particle size distribution is shown in Fig. S9, ESI†). The as-prepared suspension was dripped onto PDMS surfaces and spin-coated for 30 s at a speed of 800 rpm, which was repeated five times. PVA (fully hydrolyzed, Sigma-Aldrich) was dissolved in water at 100 °C to obtain a clear solution of 3 wt%. The as-prepared solution was dripped onto PDMS surfaces and spin-coated for 30 s at a speed of 800 rpm, which was also repeated five times. The modified films were heated at 60 °C for 3 h to finalize the treating of PDMS films. To obtain LLG, ethanol was filled into the subpores using an injector.
Characterizations
The chemical structures of the liquid layer at the ice–substrate interface were examined by NMR (Bruker Avance III 400 MHz). The surface morphologies were observed by a field-emission scanning electron microscope (FEI APREO SEM). All the samples were sputter-coated with a 5 nm gold layer. Microscopic photographs of the silicon wafers with different patterns were taken by a DIC microscope (Zeiss AxioScope A1 for reflected light BF-DIC/POL, Carl Zeiss). The surface morphology of the coatings was recorded by atomic force microscopy (AFM, Veeco Metrology) using PeakForce Quantitative NanoMechanics. The ice adhesion strength was measured by a universal mechanical tester (Instron Model 5944) equipped with lab-built cooling system and chamber, as described in earlier studies.18 A polypropylene centrifuge tube with a 1 mm-thick wall and an inner diameter of 20 mm was placed onto the coatings. Further, 1.5 ml deionized water was infused into each mold, and the samples were placed in a freezer at a constant temperature of −18 °C for 3 h to ensure complete freezing. Before the testing, the samples were transferred from the freezer to the cooling chamber of the test machine. For testing at −18 °C, the samples were stabilized in the cooling chamber of the test machine at −18 °C for 10 min before testing. For the test at −60 °C, the samples were stabilized in the cooling chamber of the test machine at −60 °C for 1 h to ensure total cooling before testing. During the ice adhesion test, a force probe (diameter: 5 mm) propelled the tube-encased ice columns at a velocity of 0.01 mm s−1, and the probe was located close to the tested coating surface (less than 1 mm) to minimize the torque on the ice cylinders. The loading curve was recorded, and the peak value of the shear force was divided by the contact area to obtain the ice adhesion strength. Four samples from each composition were measured to obtain the mean ice adhesion strength.Results and discussion
Lubricating effect of a nanoscale interfacial ethanol layer
The purpose of atomistic modeling and simulations was to verify the lubricating effect of the ethanol layer at the ice–solid interface at various temperatures. Simulation systems with and without the interfacial ethanol layers on a model carbon-based substrate were built for this purpose, as shown in Fig. 1 and Fig. S1, S2 (ESI†). Pulling force was utilized to determine the atomistic ice adhesion strength in the systems (details in the Methods section).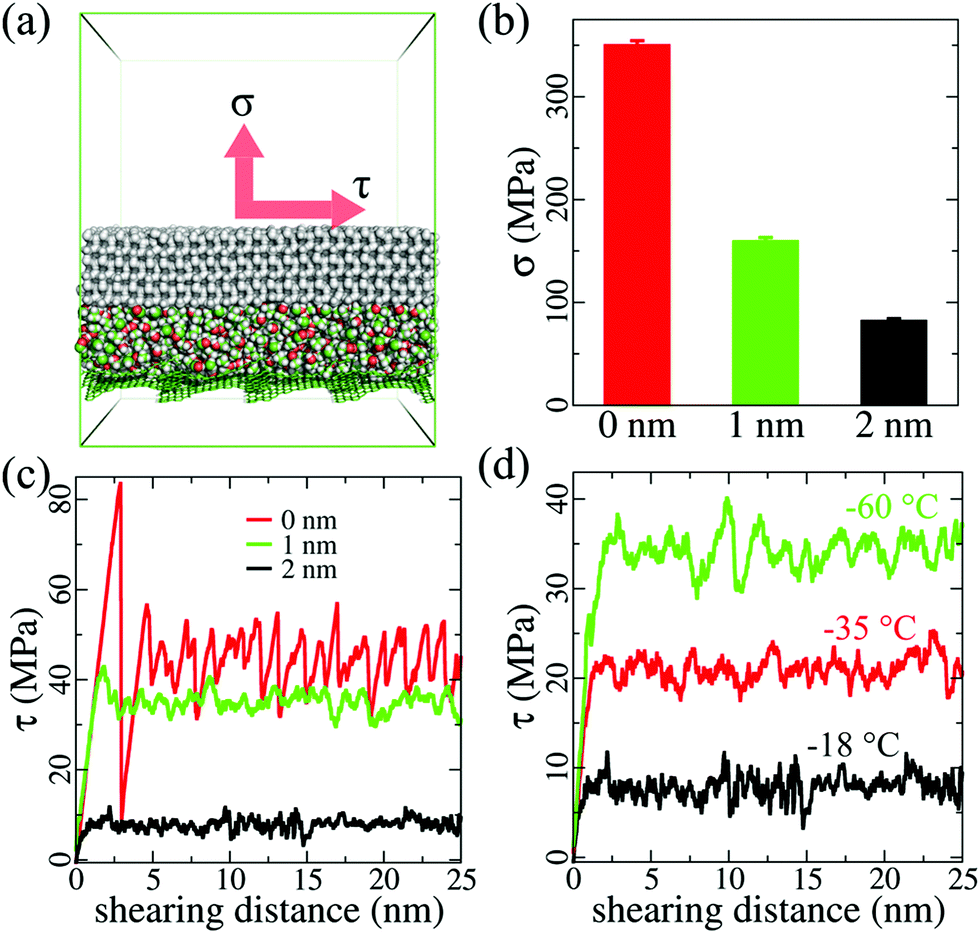 | ||
| Fig. 1 A thin lubricating ethanol layer for reducing ice adhesion strength. (a) Atomistic model of an ethanol lubricating layer at the ice–solid interface. The ice is shown in white and the carbon-based substrate is shown in green. Periodic boundary of the system is shown in green. Directions of pulling and shearing forces applied on the ice to determine ice adhesion (σ) and shearing (τ) stresses are indicated by red arrows. (b) σ values on the same substrate with ethanol layers of 0, 1, and 2 nm in thickness. (c) τ values with ethanol layers of 0, 1, and 2 nm in thickness at −18 °C. (d) τ values on a 2 nm-thick ethanol layer at various temperatures. | ||
A layer of lubricating ethanol can indeed considerably reduce the atomistic ice adhesion strength (σ) and shearing stress (τ). As shown in Fig. 1a, the ice adhesion strength can be defined as the highest stress needed to vertically detach the ice from the substrate, while the shearing stress was monitored in the horizontal shearing process using the shearing force normalized by the surface area. Without an ethanol layer, the ice adhesion strength obtained in 5 independent simulations was 351 ± 4 MPa. In comparison, a sandwiched ethanol layer of 1 nm reduced the ice adhesion strength down to 160 ± 3 MPa, showing a drastic reduction of ≥50%. When the thickness of the ethanol layer was 2 nm, the ice adhesion strength was further reduced to 83 ± 2 MPa, which was a reduction of ∼50%. This result not only confirmed the icephobic potential of the lubricating ethanol layer and its thickness effect, but also showed that the accumulation of ethanol (from 1 to 2 nm) at the ice–solid interface was highly beneficial for deicing operations.
The lubricating effect of the ethanol layer was also significant, and it reduced the ice shearing stress as the layer thickness increased at extremely low temperatures. As shown in Fig. 1c, without a lubricating layer, the ice shearing stress profile was in a typical stick–slip pattern, which is similar to that used in earlier studies,33,34 showing initial stress peak values exceeding 85 MPa. Such high peak values reveal that high stress is needed to initiate ice cracking during deicing processes. In comparison, an interfacial ethanol layer (thickness: 1 nm) can effectively smoothen the shearing stress profile and yield an average shearing stress value of 34.5 ± 4.5 MPa at −18 °C. When the ethanol layer thickness was 2 nm, the ice shearing stress further reduced to 7.8 ± 1.4 MPa. The lubricating effects of the ethanol layer were maintained even at lower temperatures, as shown in Fig. 1d. When the temperature decreased from −18 to −38 °C, the ice shearing stress obtained with the 2 nm-thick ethanol layer increased to 20.6 ± 2.7 MPa. At extremely low temperatures of −60 °C, the ice shearing stress further increased to 33.2 ± 4.8 MPa. All the ice shearing stress profiles obtained at various temperatures showed smoothening effects of the ethanol layer, and average values lower than the peak values of shearing ice without an ethanol layer, which suggested that generating an ethanol layer at the ice–solid interface could facilitate deicing at low temperatures. The lubricating effect of an ethanol layer outperformed that of an aqueous layer. As shown in Fig. S3 (ESI†), the ice shearing stress values for a 2 nm-thick aqueous layer were much higher than those for an equivalent ethanol layer, as shown in Fig. 1d, at −18 and −38 °C. The aqueous layer lost its lubricating effect completely at −60 °C, confirming the results from an earlier study regarding the deficiency of aqueous layers at low temperatures in anti-icing applications.24 It should be noted that the loading rate used in the simulations is orders of magnitude higher than those in the experiment, which results in considerably higher absolute ice adhesion strength values.35 However, the difference in the ice adhesion mechanics is significant under the same simulation parameters and protocol.
Design principles and fabrication of icephobic LLGs
The abovementioned atomistic modeling and simulation results indicate that an ethanol layer with increasing thickness at the ice–substrate interface can considerably reduce the ice adhesion strength. Most importantly, the lubricating effect, and therefore, the surface icephobicity by such an interfacial ethanol layer can function at temperatures as low as −60 °C as ethanol has a low freezing point of −115 °C. The experiments were devoted to designing LLGs that could dynamically accumulate ethanol molecules to form a lubricating layer between the substrate and ice. Two strategies were chosen for fabricating LLGs, as shown in Fig. 2a, namely, (1) packing ethanol inside the substrate (LLG 1) and (2) storing replenishable ethanol below the substrate (LLG 2). For LLG 1, ethanol was directly mixed into the polymer substrate during the synthesis. In contrast, lamellar structures with subpores were created under the substrate for LLG 2, which allowed ethanol to be readily refilled after synthesis.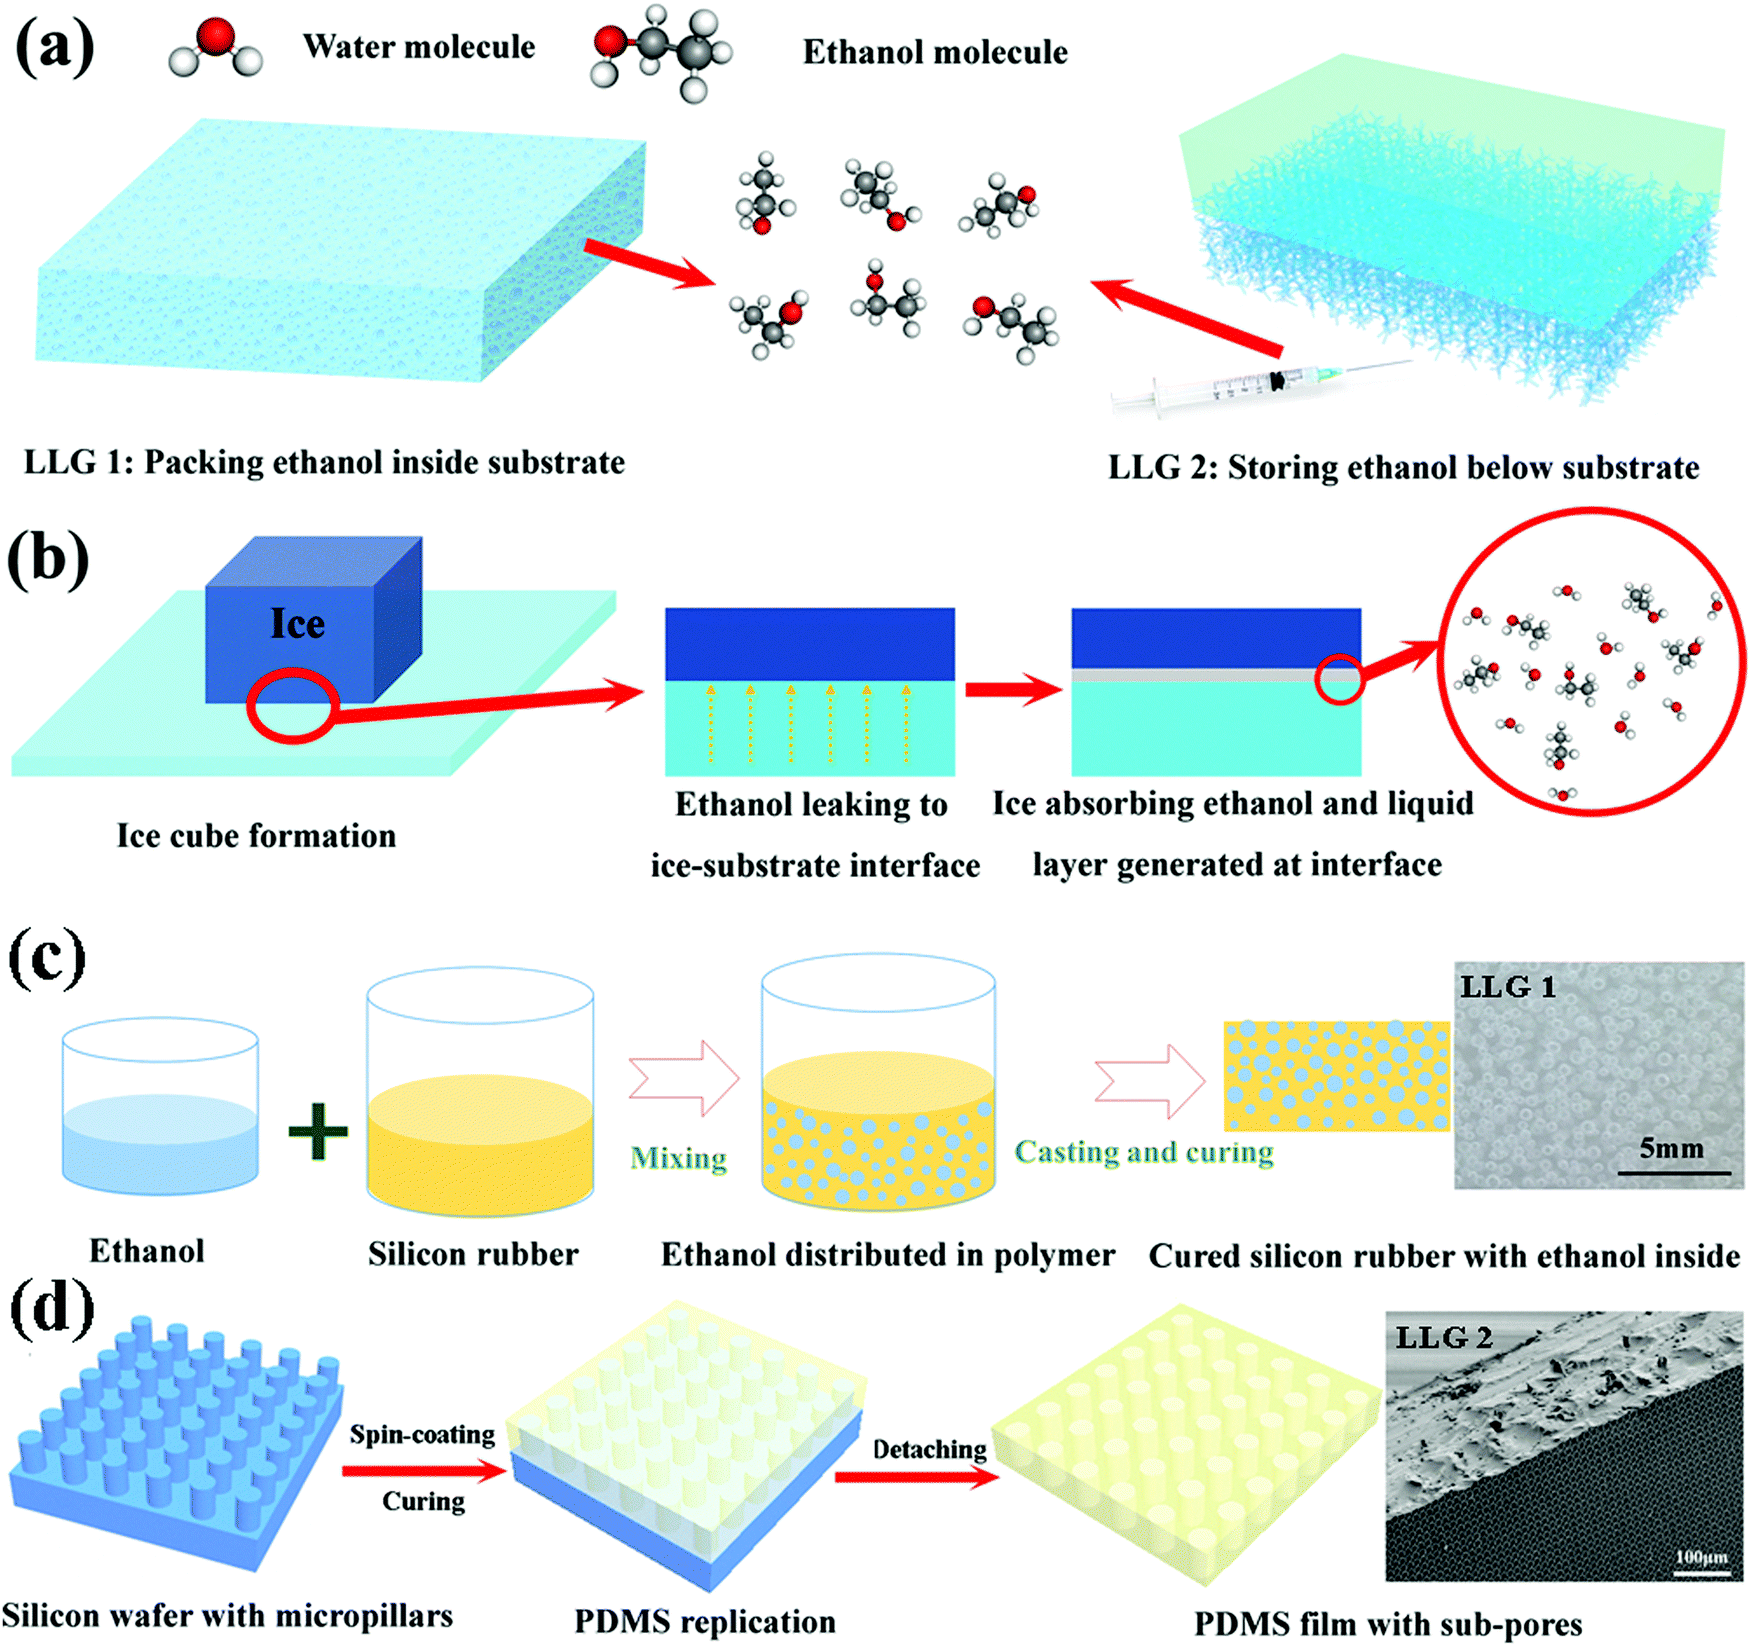 | ||
| Fig. 2 Schematic illustration of the strategies of generating a liquid layer at the ice–substrate interface. (a) Two strategies to create icephobic LLGs, namely, packing ethanol inside the substrate (left panel) and storing replenishable ethanol below the substrate (right panel). (b) Mechanism of generating a liquid ethanol layer at the ice–substrate interface. (c) Fabricating method of LLG 1: mixing ethanol with silicone rubber that can be quickly cured at room temperature, following which ethanol will be packed inside the substrate after curing. Optical image on the right shows the top view of LLG 1 (with 20 vol% ethanol); small bubbles indicate ethanol droplets inside the body. (d) Fabricating method of LLG 2: replica method for producing subpores for ethanol storage below the surface. SEM image on the right shows the side view of LLG 2 (distance between neighboring holes: 15 μm). Well-arranged small holes can be observed on the bottom surface. | ||
The icephobic mechanism of the LLG is shown in Fig. 2b. It was essential that LLG could release ethanol to the ice–substrate interface to generate an ethanol layer, as the quasi-liquid/liquid layer was the key for the low ice adhesion strength.24 By taking into account the fact that ethanol could absorb onto the ice surface for creating the quasi-liquid/liquid layer,36,37 as well as elastomer membranes were preferential for ethanol permeation,38,39 silicon rubbers were chosen as the matrix material for fabricating the two LLG substrates. It is evident that with such a design principle and material selection, ethanol molecules inside or below the LLG could dynamically permeate through the polymer matrix and reach the ice–substrate interface. It was expected that the accumulated interfacial ethanol would finally create a liquid layer that could convert the ice–substrate contact from a firm solid–solid mode to a weak solid–liquid–solid mode. The fabrication procedures of the two LLGs are shown in Fig. 2c and d; the experimental details are provided in the Materials and methods section. Samples with a series of ethanol contents were fabricated and characterized for two LLGs, and they were subjected to icephobicity investigations.
Icephobicity of LLGs with ethanol inside the substrate
LLG 1 was fabricated through a facile synthesis method, as shown in Fig. 2c. Ethanol with different volume contents (10–40%) was mixed with silicone rubber that could be quickly cured before a significant evaporation of ethanol. The thickness of the substrate was controlled at ∼2 mm. The morphology and size distribution of the ethanol droplets in LLG 1 are shown in Fig. S4 and S5 (ESI†). LLG 1 indeed released ethanol to the interface and demonstrated excellent icephobicity. As exemplified by LLG 1 with 20 vol% ethanol, ice cubes on LLG 1 surface spontaneously fell off in 3 h after vertical placement (Fig. 3a). A liquid layer was detected after the ice cubes were detached from LLG 1. As shown in Fig. 3b, visible dyestuff was observed to diffuse on the ice cube peeled off from LLG 1, which confirmed the secretion of ethanol by LLG 1. The liquid layer on the detached ice cube was carefully collected and transferred for investigation via1H NMR spectroscopy. As shown in the lower panel of Fig. 4b, the strong signal at 4.80 ppm resulted from –OH from both ethanol and water, and the signals from –CH2 and –CH3 of ethanol were also clearly detected. Therefore, the results from the 1H NMR agreed with the structure of ethanol (CH3CH2OH). The 1H NMR spectra confirmed the ethanol component in the liquid layer, which proved the ability of LLG 1 to release ethanol to the ice–substrate interface.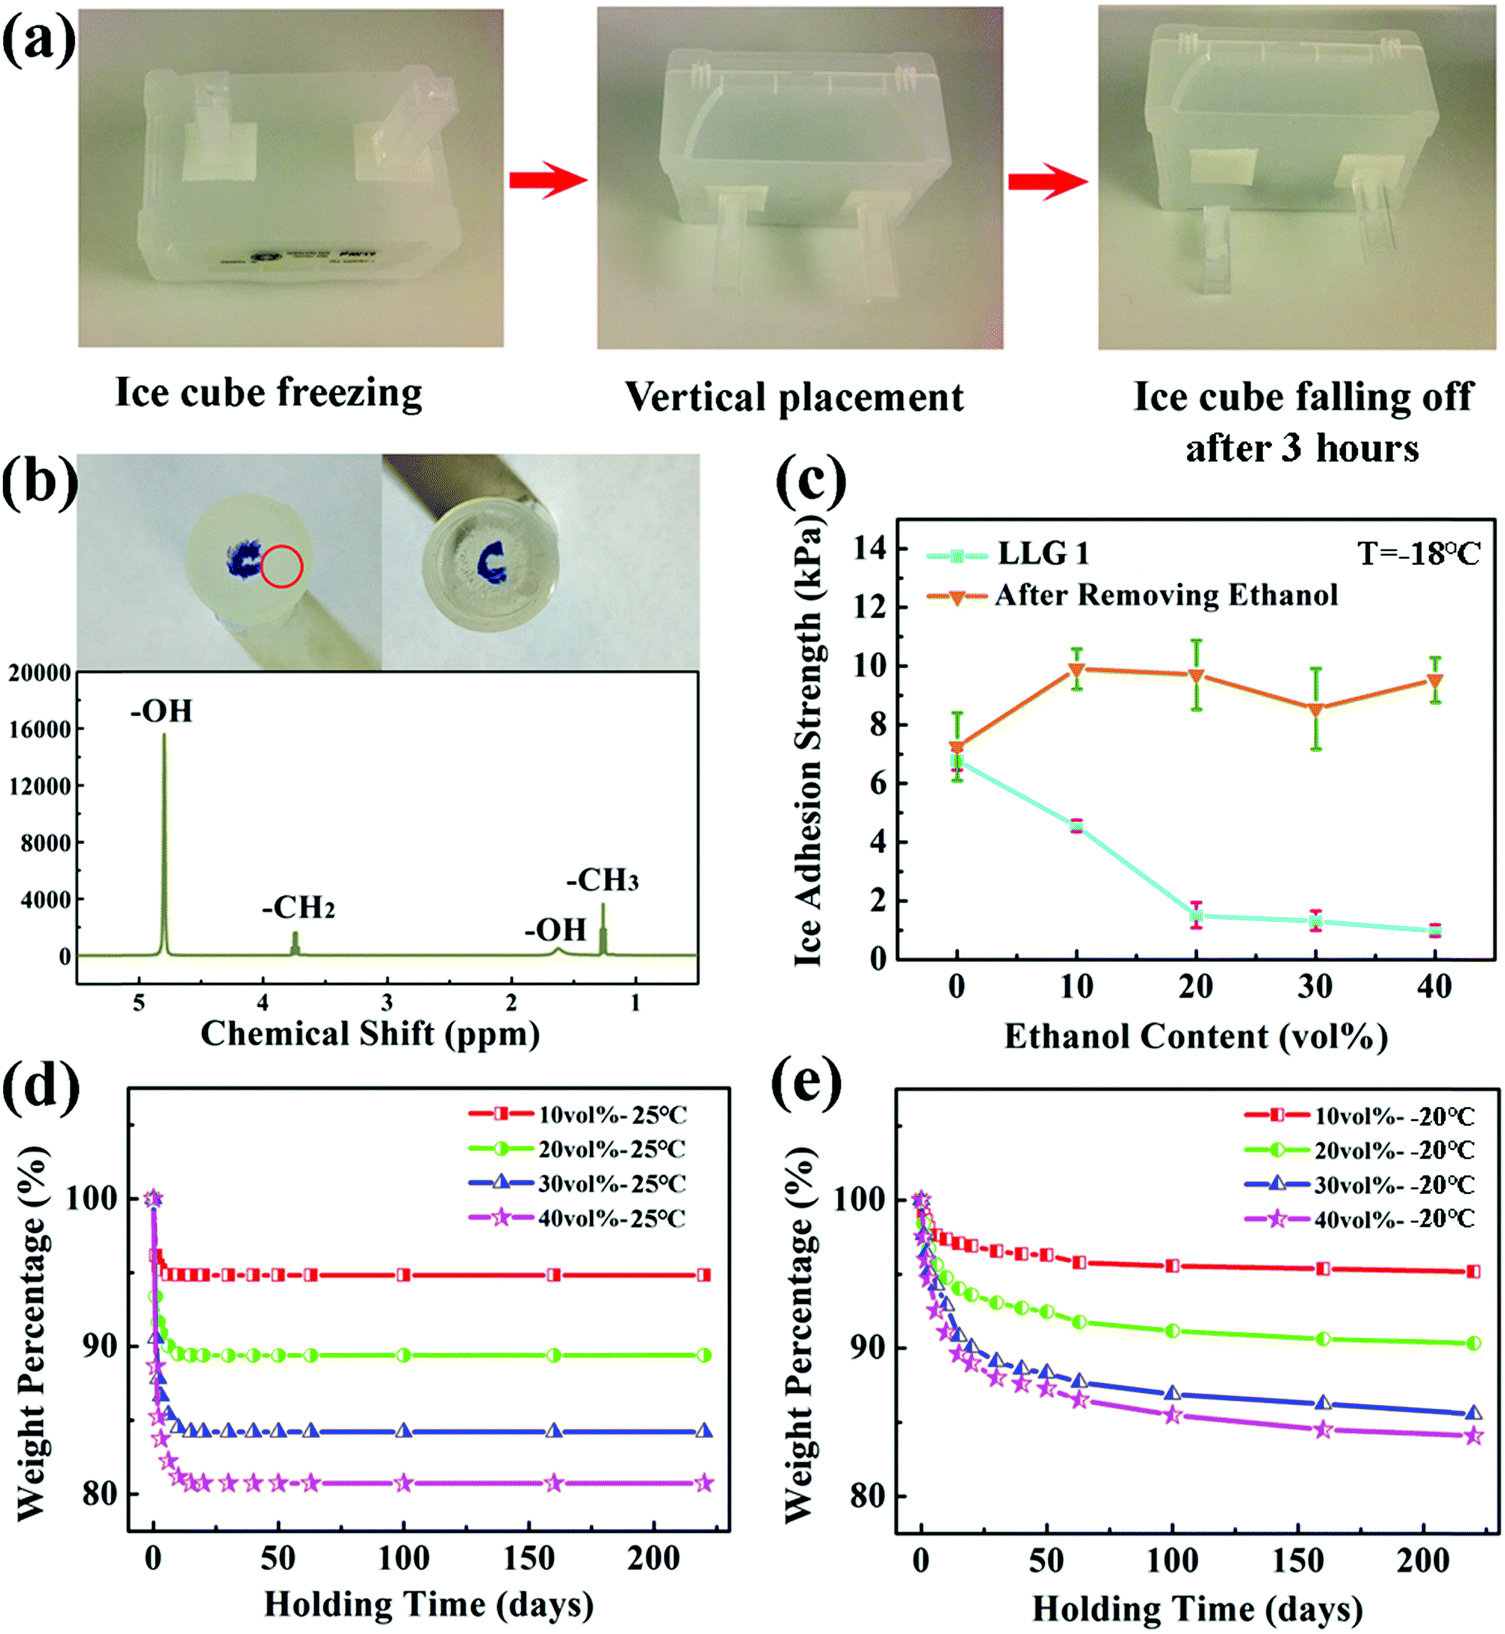 | ||
| Fig. 3 Icephobicity of LLGs fabricated by packing ethanol inside the substrate. (a) Comparison of ice cube adhesion on LLG 1 surface (left) and the same surface after fully removing the ethanol (right) at −18 °C. (b) Diffusivity of dyestuff on the surfaces of ice cubes that are peeled off from LLG 1 (left) and the one after removing ethanol (right). The 1H NMR spectra (bottom) of the liquid layer on the adhesion side of the ice cube (area marked with a red circle). (c) Comparison of ice adhesion strengths on LLG 1 with various ethanol contents and the same surfaces after ethanol removal at −18 °C. (d) Weight loss of LLG 1 as a function of time at room temperature. (e) Weight loss of the LLGs as a function of time at −20 °C. | ||
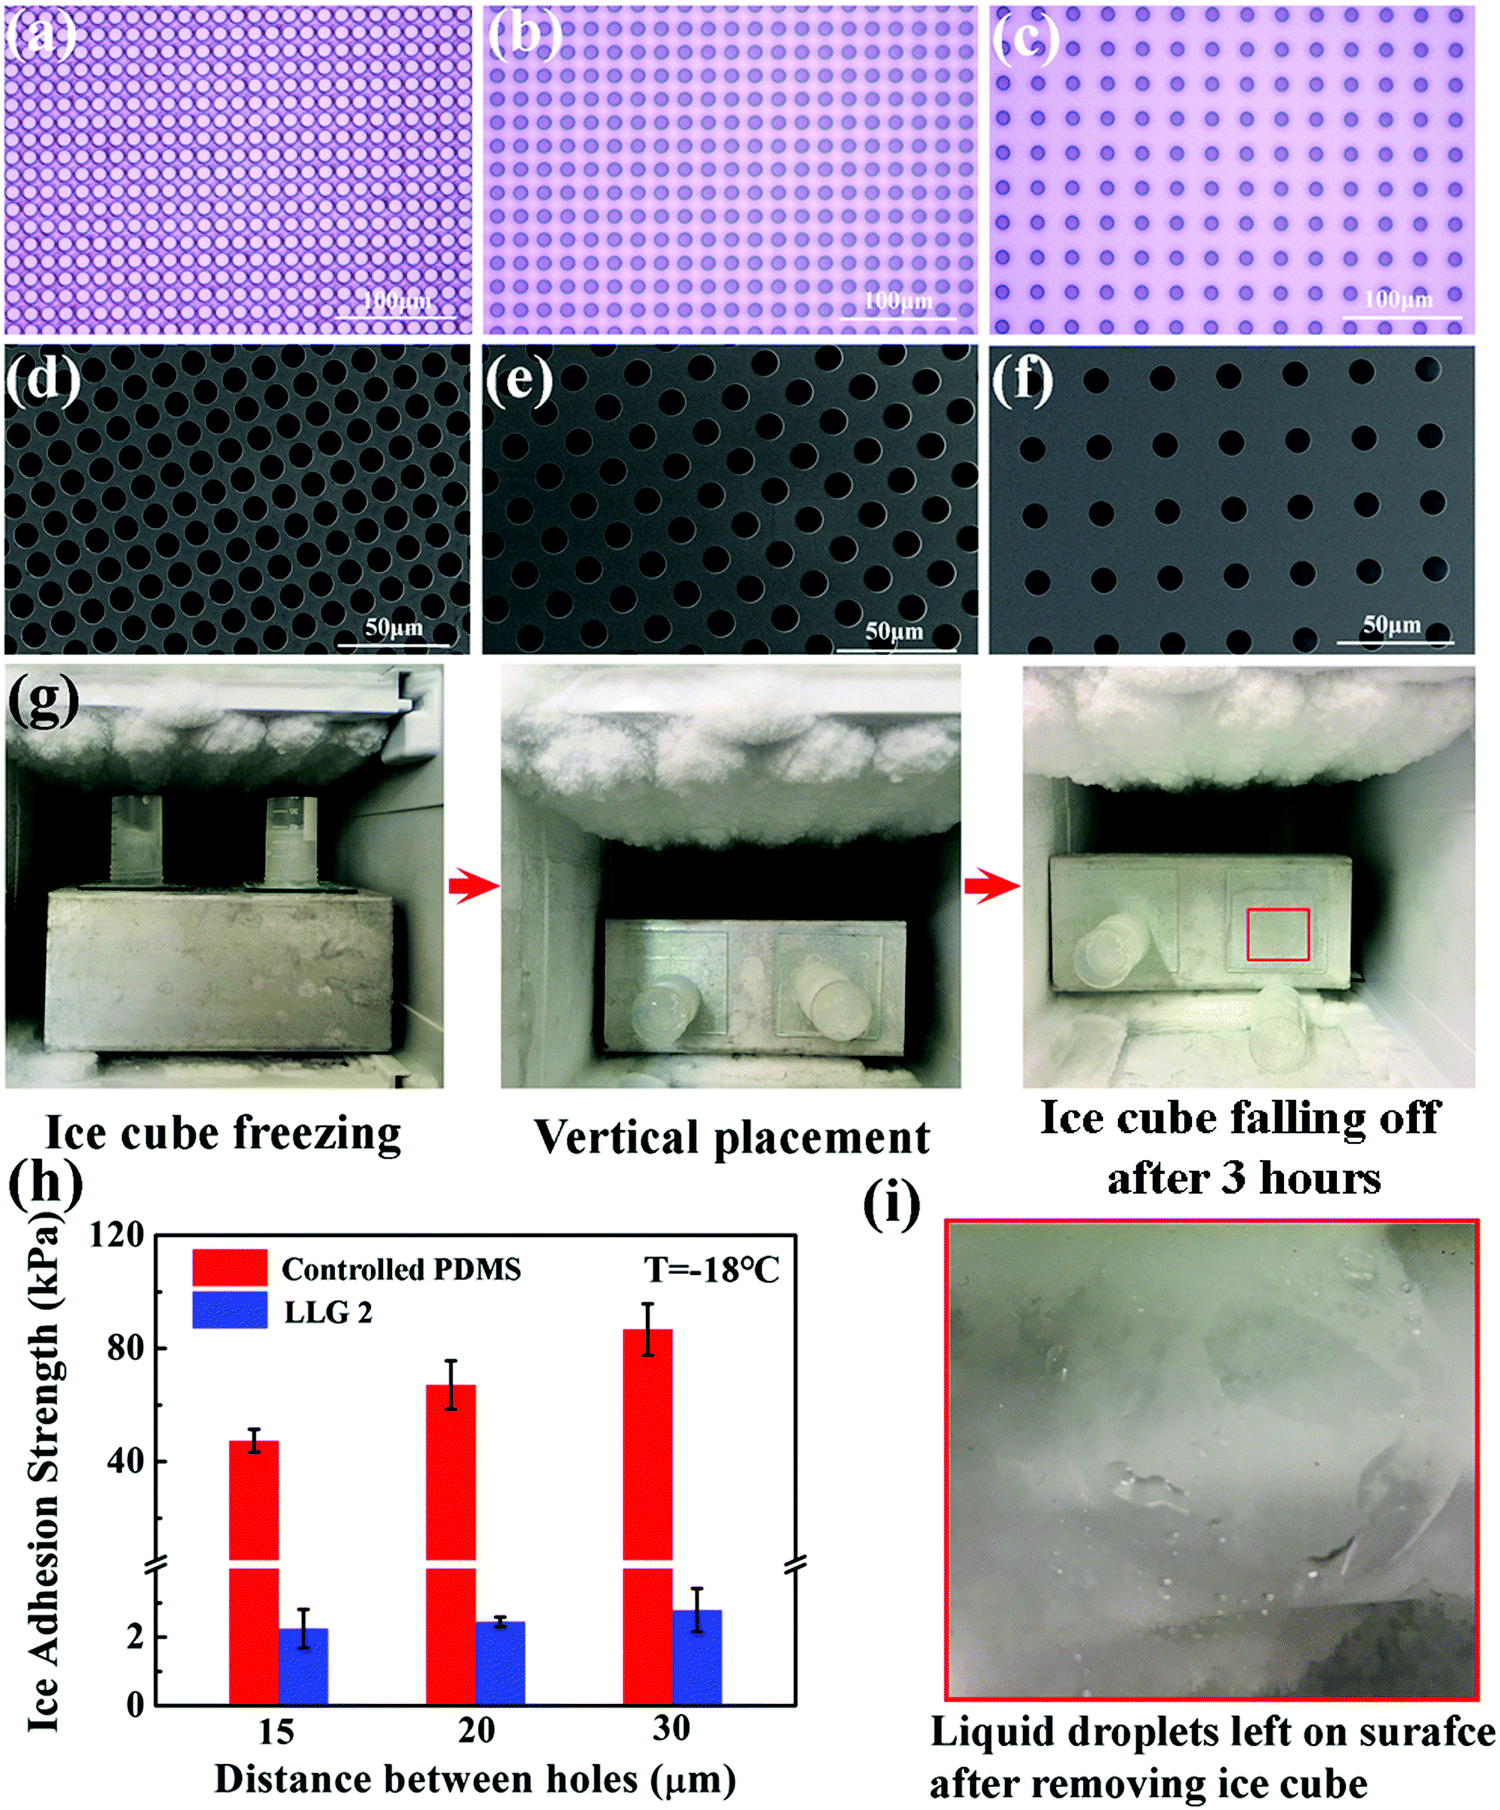 | ||
| Fig. 4 Icephobicity of LLGs with replenishable ethanol capacity. (a–c) Optical images showing silicon wafers with pillars of different densities; distance between neighboring pillars were 15, 20, and 30 μm, respectively. (d–f) SEM images showing the hole morphologies of PDMS films fabricated on the silicon wafer in (a–c), respectively. (g) Comparison of ice adhesion on the sample without infusing ethanol (left) and LLG surface (right) at a temperature of −18 °C. Distance between holes is 20 μm in both the samples. (h) Ice adhesion strength on the sample without ethanol (controlled PDMS) and LLG 2 with various hole densities obtained at −18 °C. (i) Liquid droplets on the surface of LLG (area marked with a red rectangle in (g)) after removing the ice cube. | ||
The ice adhesion strength on LLG 1 falls in the super-low region.18 As shown in Fig. 3c, the ice adhesion strength on LLG 1 ranged from 1.0 to 4.6 kPa, showing a steady decrease with an increase in the content of ethanol in the substrate, all of which were lower than those in the same sample after ethanol exhaustion (8.6–10.0 kPa). It should be noted that the ice adhesion strength on smooth pure silicon rubber was 7.2 kPa, which was lower than that on rough LLG 1 after ethanol exhaustion. Details regarding roughness formation on the LLG 1 surface are shown in Fig. S6 (ESI†). The thicker the interfacial ethanol layer, the lower is the ice adhesion strength, as confirmed by the atomistic modeling results mentioned above. LLG 1 with a higher ethanol content could release more ethanol to the ice–substrate interface, thereby thickening the interfacial liquid layer in the same given time, which accounts for the results shown in Fig. 3c (light blue curve). Such low ice adhesion strength is also lower than the value obtained for pure silicon rubber (detailed comparison and discussion are given in the ESI†). These results again verified the function of the ethanol layer in enhancing the icephobicity of the surfaces.
The ethanol release rate underlies the icephobic durability of the LLG samples, and therefore, the lifespan of LLGs. In order to evaluate the time needed for fully exhausting ethanol from the samples, the mass weights of LLG 1 at room temperature and at −20 °C were determined as a function of holding time after synthesis. At room temperature, ethanol in LLG 1 would completely run out in 15 days, as shown in Fig. 3d. The weight loss of LLG 1 was lower than the initial ethanol content. This was because the curing process of LLG 1 took 3 h. During this time, a certain amount of ethanol evaporated, which was not taken into account in the details shown in Fig. 3d. Surprisingly, the release of ethanol from LLG 1 maintained at −20 °C could still be observed to be steady even after 250 days (Fig. S7, ESI†). The release of ethanol molecules to the ice–solid interface was a spontaneous thermodynamics process. Because the freezing temperature of ethanol was extremely low, this spontaneous release could occur within a wide temperature range. There were multiple determinants of the ethanol release rate, including diffusion efficiency of ethanol in the polymer, vapor pressure, temperature, their coupling, and other factors.38 The lower the temperature, the poorer is the ethanol release efficiency and longer is the LLG lifetime. The dynamics of ethanol release from LLG 1 were analyzed, as shown in Fig. S7 (ESI†) (with a detailed discussion). The icephobic lifetime of LLG 1 was expected to be ≥250 days at a temperature of −20 °C, and it was even longer at lower temperatures. In particular, LLG 1 with 40 vol% ethanol was predicted to have a long lifespan of up to 593 days (Fig. S7, ESI†). It was, therefore, reasonable to anticipate long-term icephobicity of the LLGs at lower temperatures as long as the interfacial ethanol layer was not frozen.
Icephobicity of LLGs with replenishable ethanol below the substrate
LLG 1 effectively proved the ability of releasing ethanol to the ice–substrate interface, thereby achieving excellent icephobicity. By embedding a fixed amount of ethanol inside the substrate, LLG 1 suffered from icephobicity depletion with the exhaustion of ethanol, despite the observed lifetime of ≥250 days. Therefore, LLG 2 was designed to extend the durability along with capacity for easily replenishing ethanol, namely, creating a lamellar structure with a porous layer below the substrate, as shown in Fig. 2d. For the sake of mechanical robustness, PDMS with the same silicone base as that of silicon rubber was made for LLG 2, as it is one of the most common options for fabricating icephobic coatings.17–19,40–42 In particular, silicon wafers with pillars were used as templates for molding PDMS; an example is shown in Fig. S8 (ESI†). All the pillars have a fixed radius of 5 μm, with an interpillar distance varying from 15 to 30 μm, as shown in Fig. 4a–c, which led to complementing holes in the substrate for holding the replenishing ethanol (Fig. 4d–f).LLG 2 with ethanol replenishing capacity exhibited equally low ice adhesion strength. As shown in Fig. 4g, the ice cube on LLG 2 spontaneously fell off in 3 h at a temperature of −18 °C, while its counterpart was firmly adhered on the sample without storing ethanol in the holes. The ice adhesion strength obtained on LLG 2 with different hole density fell in the range of 2.2–2.8 kPa, as shown in Fig. 4h, which significantly decreased as compared to the same surface without an ethanol layer (47.3–86.7 kPa). After the detachment of the ice cube from the LLGs, visible liquid droplets were detected on the surface (Fig. 4i), which revealed the same mechanism of LLG as that shown in Fig. 2b. With the holes in the substrate and ethanol replenishing capacity, the extended durability of LLGs was expected, which could guarantee long-term practical anti-icing applications.
Further verification and extremely low temperature applications of LLGs
The icephobic basis of LLGs is to generate a liquid ethanol layer at the ice–substrate interface, as well as converting the ice contact from a strong solid–solid mode to a weak solid–liquid–solid mode. As long as ethanol continues to release from the substrates, surface roughness (possibly impurity) and chemistry would not hamper the functionality of LLGs. LLG 2 was chosen to further verify the icephobicity of LLGs with altered surface roughness and chemistry. SiO2 nanoparticles and hydrophilic PVA were used to coat the intrinsically hydrophobic PDMS on LLG 2 for separately altering the surface roughness and hydrophobicity. The nanoparticles had a mean diameter of 222.7 nm, with the size distribution shown in Fig. S9 (ESI†). This led to the surface topography of treated LLG 2, as shown in Fig. 5a. The PVA coating on LLG 2 had a thickness of 10 μm, as shown in Fig. 5b. The roughness values of LLG 2 with and without surface treatment were investigated, as shown in Fig. S10 (ESI†).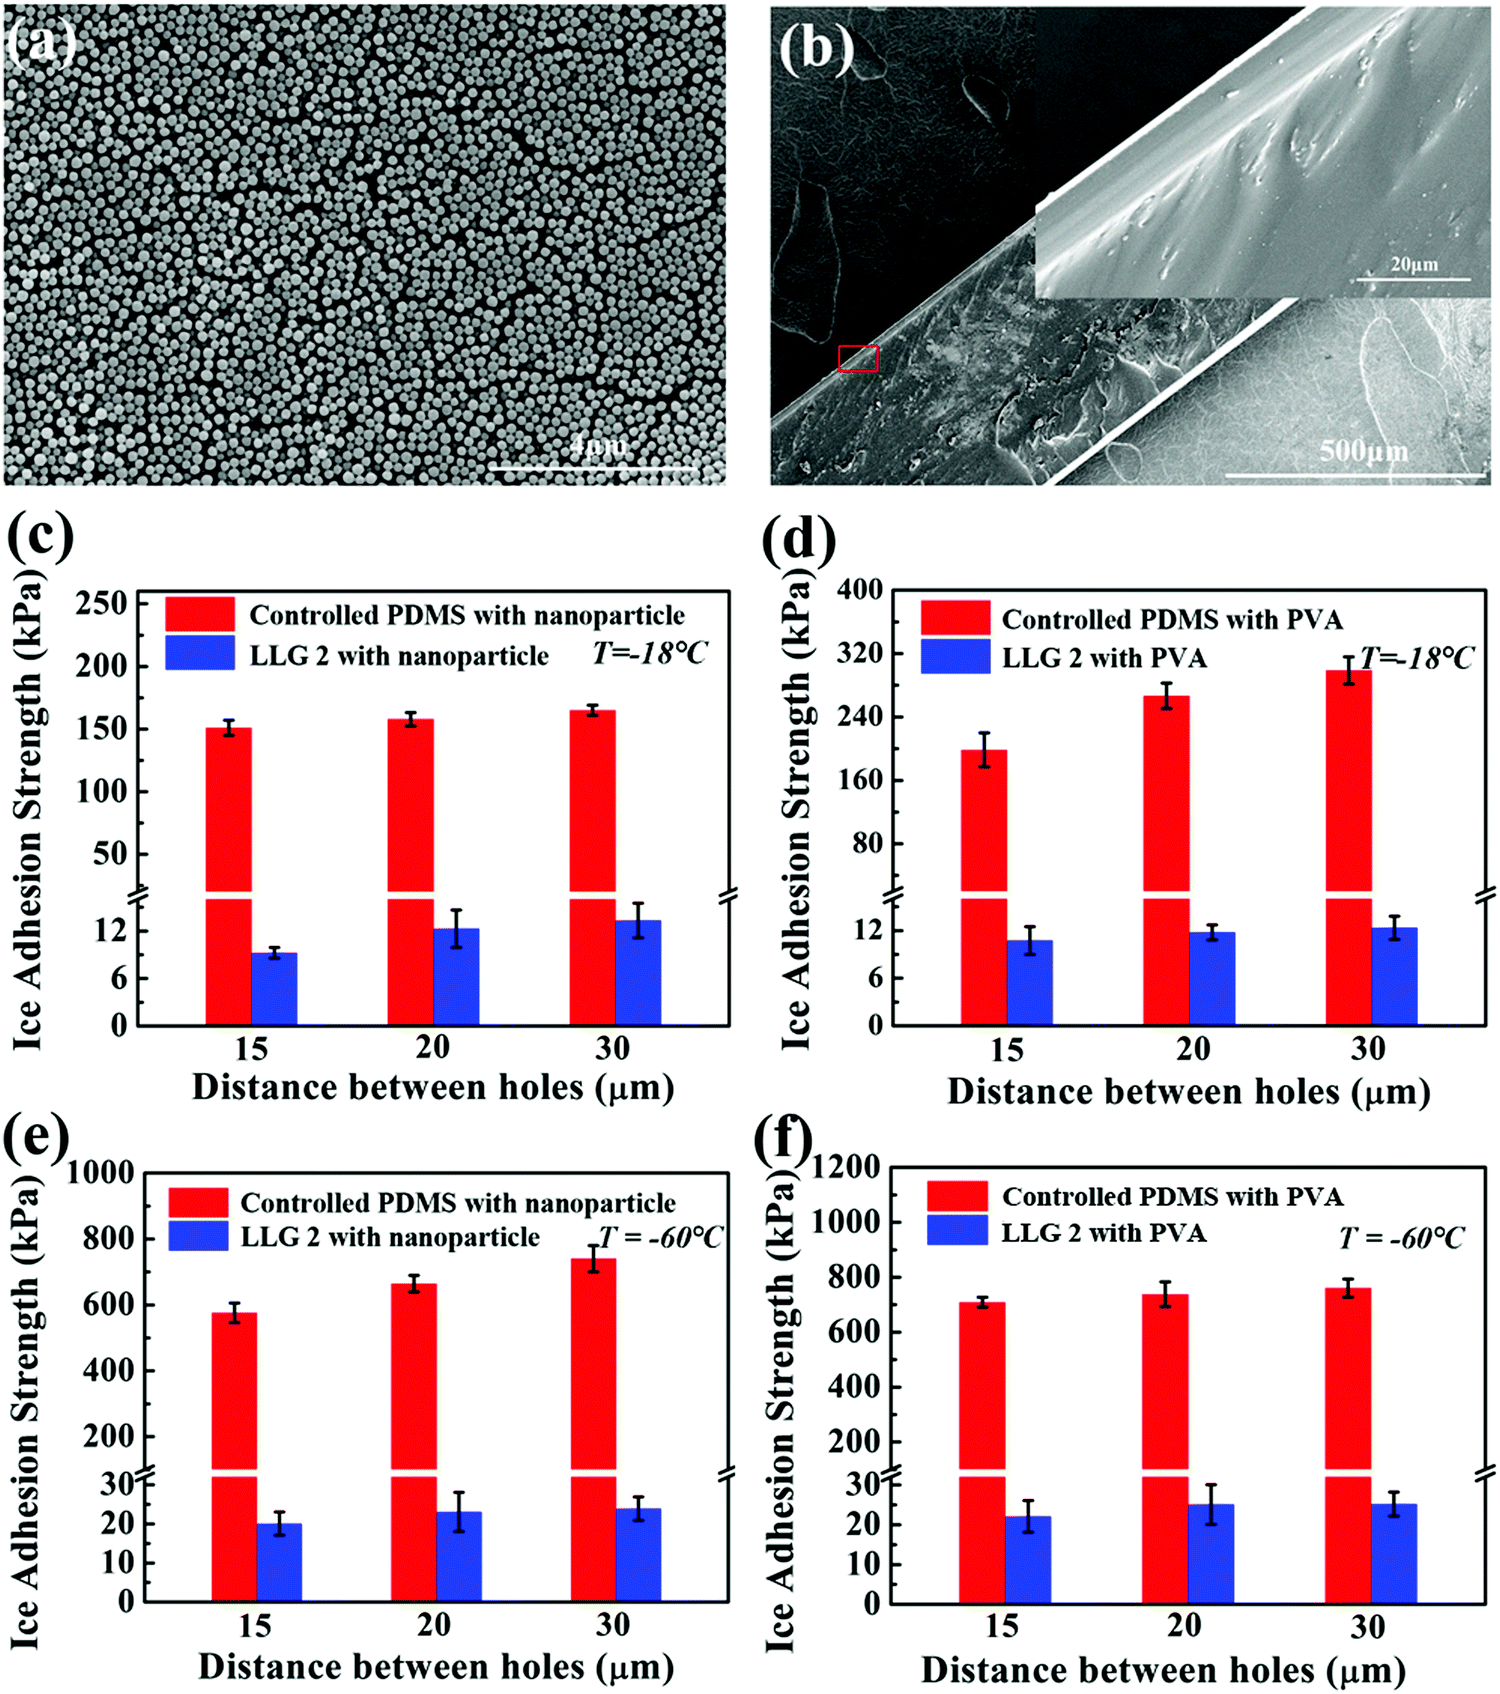 | ||
| Fig. 5 Icephobicity of LLG 2 with coated nanoparticles and hydrophilic PVA. (a) SEM images showing a homogenous nanoparticle coating on the LLGs. (b) SEM images of the cross-section of PVA-coated LLG 2. Inset shows the corresponding area highlighted by the red rectangle. (c and d) Comparison of ice adhesion strengths on LLG 2 coated with nanoparticles and PVA at −18 °C. (e and f) Comparison of ice adhesion strengths on LLG 2 coated with nanoparticles and PVA at −60 °C. | ||
Notably, the ice adhesion strength on the treated surfaces showed encouraging results. By introducing roughness and hydrophilicity into the PDMS samples, the ice adhesion strength was significantly raised from 47.3–86.7 (Fig. 4h) to 151.0–164.9 (Fig. 5c) and 198.6–298.7 (Fig. 5d) kPa, respectively. Such results were also in agreement with earlier studies in which an increase in surface roughness and hydrophilicity led to higher ice adhesion strengths.8,18,43 By infusing ethanol into subholes, after 3 h, the icephobicity of the treated surface was restored. As shown in Fig. 5c and d, the ice adhesion strength on LLG 2 coated with nanoparticles and PVA drastically decreased to 9.3–13.3 and 10.8–12.4 kPa, respectively. The nanostructures and coatings on the LLG surfaces can hinder the lubricant release rate.44 The ethanol release efficiency at the ice–solid interfaces was temperature-dependent, i.e., faster release at higher temperatures. These results suggest that the LLG effectively functioned on surfaces with different chemical components (both hydrophobic and hydrophilic surfaces) and on surfaces with different morphologies (both smooth and rough surfaces), demonstrating anti-icing potential for different application conditions.
It is well known that both properties of ice, namely, its adherence to surfaces and its interaction, obviously changed as the temperature decreased, which led to a significant increase in the ice adhesion strength.45 It was observed that the ice adhesion strength roughly increased by two orders of magnitude, from ∼55 to ∼1156 kPa, as the temperature decreased from −15 to −30 °C.46 The LLG could benefit from the low freezing point of ethanol, and the interfacial ethanol layer could maintain the solid–liquid–solid ice contact at very low temperatures. As shown in the simulation results in Fig. 1c, d and Fig. S3 (ESI†), the lubricating effect induced by ethanol could still act at a temperature of −60 °C. The ice adhesion test at such a low temperature was also carried out. Strikingly, the ice adhesion strength on LLG 2 was maintained at a low value at −60 °C. As shown in Fig. 5e and f, after maintaining for 4 h (3 h at −18 °C and 1 h at −60 °C), both nanoparticle- and PVA-coated PDMS samples demonstrated high ice adhesion strengths of 576.1–740.2 and 709.2–760.9 kPa, respectively, while the corresponding LLGs showed low ice adhesion strengths of 20.1–23.9 and 22.1–25.2 kPa. It should be noted that the lower ice adhesion on LLGs could be expected for longer holding times, as more ethanol and a thicker interfacial liquid layer could be generated by the LLGs. As compared to earlier experimental studies where a sharp increase in ice adhesion strength could be observed at −53 °C,24 the approach using LLGs was an outstanding dynamics icephobic/anti-icing strategy. Furthermore, considering the low freezing point of ethanol of −114.1 °C, as well as the vast coexisting space of liquid ethanol and ice/water (lowest to −124 °C observed in experiments), as shown in the phase diagram in Fig. S10 (ESI†),47–49 the liquid layer created by LLGs can function in a broader temperature range, including extremely cold arctic environments.
Conclusion
In summary, this work introduced the LLG, which dynamically secreted a lubricating ethanol layer at the ice–solid interface after ice formation, yielding low ice adhesion strength. Firstly, atomistic modeling and simulations were employed to depict the ice adhesion reduction effect of ethanol layers with different thicknesses at the ice–solid interface at various temperatures. Then, the fabrication of LLGs and ice adhesion test experiments of LLGs were carried out. Both the LLG prototypes, namely, embedding ethanol in the substrate and storing replenishable ethanol in holding capacities, exhibit excellent icephobicity with the lowest ice adhesion value of 1.0 kPa observed at −18 °C, which verified the function of the ethanol layer generated by LLG design. Owing to the ability of constant ethanol release and thickening of the interfacial lubricating layers, LLG could overcome the deficiency induced by surface roughness and hydrophilicity—the two critical factors that result in the failure of several other icephobic surfaces. The lifespan of the icephobicity of LLGs was highly encouraging, particularly with replenishable ethanol. Most importantly, LLG effectively functioned at low temperatures, covering the arctic anti-icing requirements, which outperformed other state-of-the-art icephobic surfaces. For select samples, by introducing an interfacial ethanol layer, the ice adhesion strength on the same surfaces decreased in an unprecedented manner from 709.2–760.9 to 22.1–25.2 kPa at a low temperature of −60 °C. All these properties enable LLGs to become a competitive candidate for practical anti-icing applications and provide an icephobic solution for extremely low temperatures in which other earlier published icephobic surfaces fail.Conflicts of interest
There are no conflicts to declare.Acknowledgements
The Research Council of Norway is acknowledged for the support to the FRINATEK project Towards Design of Super-Low Ice Adhesion Surfaces (SLICE, 250990), and the PETROMAKS 2 project Durable Arctic Icephobic Materials (AIM, 255507). The computational resources were provided by the Norwegian Metacenter for Computational Science (NOTUR NN9110 and NN9391K).References
- A. K. Andersson and L. Chapman, Accid. Anal. Prev., 2011, 43, 284–289 CrossRef PubMed.
- R. W. Gent, N. P. Dart and J. T. Cansdale, Philos. Trans. R. Soc., A, 2000, 358, 2873–2911 CrossRef.
- U. Björnstig, et al. , Accid. Anal. Prev., 1997, 29, 211–215 CrossRef.
- J. L. Laforte, et al. , Atmos. Res., 1998, 46, 143–158 CrossRef.
- M. J. Kreder, et al. , Nat. Rev. Mater., 2016, 1, 15003 CrossRef CAS.
- J. C. Bird, R. Dhiman, H. M. Kwon and K. K. Varanasi, Nature, 2013, 503, 385 CrossRef CAS PubMed.
- A. J. Meuler, et al. , ACS Nano, 2010, 4, 7048–7052 CrossRef CAS PubMed.
- S. Jung, et al. , Langmuir, 2011, 27, 3059–3066 CrossRef CAS PubMed.
- A. J. Meuler, et al. , ACS Appl. Mater. Interfaces, 2010, 2, 3100–3110 CrossRef CAS PubMed.
- K. K. Varanasi, et al. , Appl. Phys. Lett., 2010, 97, 234102 CrossRef.
- T. S. Wong, et al. , Nature, 2011, 477, 443–447 CrossRef CAS PubMed.
- P. Kim, et al. , ACS Nano, 2012, 6, 6569–6577 CrossRef CAS PubMed.
- J. S. Wexler, et al. , Phys. Rev. Lett., 2015, 114, 168301 CrossRef PubMed.
- K. Rykaczewski, et al. , Langmuir, 2013, 29, 5230–5238 CrossRef CAS PubMed.
- K. Golovin, et al. , Sci. Adv., 2016, 2, 1501496 CrossRef PubMed.
- C. Urata, et al. , J. Mater. Chem. A, 2015, 3, 12626–12630 RSC.
- K. Golovin, et al. , Science, 2019, 364, 371–375 CrossRef CAS PubMed.
- Z. He, et al. , Soft Matter, 2017, 13, 6562–6568 RSC.
- P. Irajizad and A. Al-Bayati, et al. , Mater. Horiz., 2019, 6, 758–766 RSC.
- J. Liu, C. Zhu and K. Liu, et al. , Proc. Natl. Acad. Sci. U. S. A., 2017, 114, 11285–11290 CrossRef CAS PubMed.
- S. F. Ahmadi, S. Nath and G. J. Iliff, et al. , ACS Appl. Mater. Interfaces, 2018, 10, 32874–32884 CrossRef CAS PubMed.
- C. Lin, G. Corem and O. Godsi, et al. , J. Am. Chem. Soc., 2018, 140, 15804–15811 CrossRef CAS PubMed.
- S. Dash, et al. , Sci. Adv., 2018, 4, 0127 Search PubMed.
- R. Dou, et al. , ACS Appl. Mater. Interfaces, 2014, 6, 6998–7003 CrossRef CAS PubMed.
- K. Golovin, et al. , Sci. Adv., 2017, 3, 1701617 CrossRef PubMed.
- W. L. Jorgensen, et al. , J. Am. Chem. Soc., 1996, 118, 11225–11236 CrossRef CAS.
- J. L. F. Abascal, et al. , J. Chem. Phys., 2005, 122, 234511 CrossRef CAS PubMed.
- M. J. Abraham, et al. , SoftwareX, 2015, 1, 19–25 CrossRef.
- S. Xiao, et al. , Nanoscale, 2016, 8, 14625–14632 RSC.
- S. Nosé, J. Chem. Phys., 1984, 81, 511–519 CrossRef.
- W. G. Hoover, Phys. Rev. A: At., Mol., Opt. Phys., 1985, 31, 1695 CrossRef PubMed.
- S. Xiao, et al. , Phys. Chem. Chem. Phys., 2018, 20, 24759–24767 RSC.
- M. Beeman, et al. , J. Geophys. Res.: Solid Earth, 1988, 93, 7625–7633 CrossRef.
- J. R. Blackford, et al. , Faraday Discuss., 2012, 156, 243–254 RSC.
- S. Xiao, W. Stacklies and M. Cetinkaya, et al. , Biophys. J., 2009, 96, 3997–4005 CrossRef CAS PubMed.
- C. Thierfelder, et al. , Phys. Rev. B: Condens. Matter Mater. Phys., 2007, 76, 195426 CrossRef.
- J. P. D. Abbatt, et al. , Environ. Res. Lett., 2008, 3, 045008 CrossRef.
- H. O. Karlsson, et al. , J. Membr. Sci., 1993, 76, 121–146 CrossRef CAS.
- L. Li, Z. Xiao and S. Tan, et al. , J. Membr. Sci., 2004, 243, 177–187 CrossRef CAS.
- F. Wang, et al. , Chem. Eng. J., 2019, 360, 243–249 CrossRef CAS.
- Y. Zhuo, et al. , ACS Appl. Mater. Interfaces, 2018, 10, 11972–11978 CrossRef CAS PubMed.
- Y. Zhuo, et al. , ACS Omega, 2018, 3, 10139–10144 CrossRef CAS.
- V. F. Petrenko, et al. , Can. J. Phys., 2003, 81, 387–393 CrossRef CAS.
- D. J. Preston, Y. Song and Z. Lu, et al. , ACS Appl. Mater. Interfaces, 2017, 9, 42383–42392 CrossRef CAS PubMed.
- H. H. G. Jellinek, Can. J. Phys., 1962, 40, 1294–1309 CrossRef.
- J. Chen, et al. , ACS Appl. Mater. Interfaces, 2013, 5, 4026–4030 CrossRef CAS PubMed.
- R. Anderson, et al. , J. Phys. Chem. C, 2009, 113, 12602–12607 CrossRef CAS.
- P. Boutron, et al. , J. Phys. Chem., 1978, 68, 5032–5041 CrossRef CAS.
- A. D. Potts, et al. , J. Phys. Chem., 1965, 69, 996–1000 CrossRef CAS.
Footnote |
| † Electronic supplementary information (ESI) available. See DOI: 10.1039/c9mh00859d |
| This journal is © The Royal Society of Chemistry 2019 |