
Hierarchically structured microchip for point-of-care immunoassays with dynamic detection ranges†
Lei
Mou
ac,
Ruihua
Dong
a,
Binfeng
Hu
ac,
Zulan
Li
d,
Jiangjiang
Zhang
ac and
Xingyu
Jiang
 *abc
*abc
aBeijing Engineering Research Center for BioNanotechnology, CAS Key Laboratory for Biomedical Effects of Nanomaterials and Nanosafety, CAS Center for Excellence in Nanoscience, National Center for NanoScience and Technology, No. 11 Zhongguancun Beiyitiao, Beijing, 100190, P. R. China
bDepartment of Biomedical Engineering, Southern University of Science and Technology, No. 1088 Xueyuan Rd, Nanshan District, Shenzhen, Guangdong 518055, P. R. China. E-mail: jiang@sustech.edu.cn; Fax: +86 0755 88015282; Tel: +86 0755 88015282
cUniversity of Chinese Academy of Sciences, No. 19 A Yuquan Road, Shijingshan District, Beijing 100049, P. R. China
dReproduction Center of the 306th Hospital of People's Liberation Army, No. 9, Anxiang Beili, Chaoyang District, Beijing 100101, P. R. China
First published on 13th July 2019
Abstract
Point-of-care (POC) medical assays provide critical information to guide clinical therapy for a broad range of medical scenarios, such as resource-poor settings and specialty departments in hospitals. Even though many types of POC assays can be done in automated devices, these POC assays typically cannot well accommodate the multiplexed detection of biomarkers where a large dynamic range is needed. Here, we report a POC assay, which is both automated and suitable for detecting multiple biomarkers with dynamic detection ranges. We call it a dynamic multiplexed immunoassay (DMI). We control the concentrations of capture antibodies and the intensity of the readout signal to dynamically modulate the detection range of immunoassays (pg mL−1 to μg mL−1), leading to the multiplexed detection of C-reactive protein (CRP), procalcitonin (PCT), and interleukin 6 (IL-6) simultaneously in undiluted human serum samples. The POC assay allows the rapid and accurate detection of infection in patients.
Introduction
In recent years, interest in and demands for automated and high-throughput detection of multiple biomarkers in clinical diagnosis have become huge.1–7 In previous studies, many immunoassay devices had the ability to detect multiple biomarkers, including chemiluminescence, electrochemical sensing, colorimetric methods and so forth.6–11 However, they still cannot meet demands for clinical use.12,13 Few of them address problems associated with simultaneous detection of multiple biomarkers which have broadly different concentrations. Our group has used click chemistry for controllably assembling enzymes on detection antibodies to adjust their detection ranges.8 There are also some instrument-free POC platforms that use distance-based signals to detect biomarkers, which also have wide dynamic detection ranges for multiple biomarkers.14,15 Examples where it is necessary to detect multiple biomarkers of broadly different concentrations: accurate diagnosis of infections, sepsis and multiple organ failure using a combination of C-reactive protein (CRP), procalcitonin (PCT), and interleukin 6 (IL-6).16–23 Concentrations of these biomarkers in human serum vary nearly six orders of magnitude: CRP is less than 10 μg mL−1; PCT is less than 0.5 ng mL−1; IL-6 is less than 75 pg mL−1.24–26 Studies have shown that simultaneous detection of PCT + IL-6 + CRP, PCT + IL-6, or PCT + CRP can help the clinical identification of early sepsis.18,21,27 Although PCT has been used as a biomarker to guide antibiotic therapy,28,29 it often leads to confusing diagnosis when drugs are used for treatment. Meanwhile, CRP still shows more accuracy in the diagnosis of pneumonia compared to that of PCT and can also guide the use of antibiotics for acute upper respiratory infections.30,31 Thus, the combined use of two or three kinds of biomarkers can overcome each other's disadvantages and timely help the clinician to give an accurate diagnosis and treatment.Our group previously proposed some automated and portable microfluidic immunoassays for the quantitative detection of biomarkers.8,32–34 However, their detection ranges cannot meet the demands of clinical diagnosis. Here, we report a hierarchically structured microchip (HMC) combined with an automated and portable device for dynamic multiplexed immunoassays (DMIs) in human serum samples where the concentrations of biomarkers varied broadly. To demonstrate the utility of the HMC-based DMI system, we automatically and simultaneously detect CRP, PCT and IL-6 within one drop of human serum with a broad, adjustable detection range (pg mL−1 to μg mL−1). The chip can be fabricated on a large scale. The portable device has passed the aerospace test at the Astronaut Center of China (it can stably operate in extreme environments such as microgravity, and has good mechanical stability, electromagnetic compatibility and thermal stability). All steps are done within our automated device which guarantees performance stability and reduces errors associated with human operations. The HMC-based DMI system allows the rapid, automated and multiplexed detection of biomarkers with a tunable detection range which will play a vital role in point-of-care testing (POCT) and precision medicine.
Experimental
Materials and apparatus
All reagents and solvents were of analytical grade and purchased from major suppliers such as Alfa, Sigma-Aldrich, and ACROS, and were used as received unless otherwise noted. Phosphate buffered saline (PBS) tablets were used to prepare all the PBS buffer solutions and then used to dissolve or dilute all proteins. CRP, PCT and IL-6 powders were from Shanghai YM Biotech. Co., LTD. (Shanghai, China). Capture antibodies and detection antibodies of CRP, PCT and IL-6 were from Beijing East Mo Biotechnology Co., LTD. (Beijing, China). Tween 20 from Amresco (U.S.A.) was used to prepare a 0.5% PBST washing solution. Immobilon Western chemiluminescent HRP substrates were from EMD Millipore (U.S.A.). Serum samples were from the Chinese PLA General Hospital (Beijing, China) and the 306th hospital of PLA (Beijing, China). All experiments were performed in compliance with the hospital guidelines (The Ethics Guidelines for Research Involving Human Subjects or Human Tissue from the Chinese PLA General Hospital).The portable instrument mainly has two functions: drive the fluid to complete the entire immunoassay; capture the chemiluminescence signals with a built-in CCD camera. A home-made electrospinning instrument with a built-in DC high-voltage generator (Spellman SL150) was used for producing electrospun membranes. Scanning electron microscopy (SEM) images were obtained using a Hitachi-SU8220. Fluorescence images of patterned antibodies were obtained by confocal microscopy (Zeiss LSM 710). UV-vis spectra were recorded with a UV2450 spectrophotometer (Shimadzu). Dynamic light scattering (DLS) and zeta potential (ζ) measurements were performed on a Zetasizer Nano ZS (Malvern Zetasizer 3000HS and He/Ne laser at 632.8 nm with a scattering angle of 90 degrees at 25 °C). Transmission electron microscopy (TEM) images were obtained by using a JEOL1400 model at an accelerating voltage of 200 kV. All photographs were recorded with a Nikon D90 camera.
Fabrication of PLC film of electrospun microfibers
The poly(L-lactide-co-ε-caprolactone) (PLC 70:30 RESOMER® LC 703 S) nanofibrous membranes were fabricated using a conventional electrospinning set-up. Briefly, PLC with Mn = 80![[thin space (1/6-em)]](https://www.rsc.org/images/entities/char_2009.gif) 000 were totally dissolved in hexafluoroisopropanol to achieve a concentration of 10% (w/v). An electrical field of 15 kV over a fixed spinning distance of 15 cm was applied. The flow rate of the pre-polymer solution was set at 0.2 mm min−1, and the time for electrospinning was 10 min to generate a PLC film of electrospun microfibers.
000 were totally dissolved in hexafluoroisopropanol to achieve a concentration of 10% (w/v). An electrical field of 15 kV over a fixed spinning distance of 15 cm was applied. The flow rate of the pre-polymer solution was set at 0.2 mm min−1, and the time for electrospinning was 10 min to generate a PLC film of electrospun microfibers.
Patterned protein on the PLC film of electrospun microfibers
The microfluidic chip for protein patterning consists of two layers, in which the top polydimethylsiloxane (PDMS) layer contains three parallel microchannels for injecting antibodies (the cross section of the channel has a rectangular shape 500 μm wide and 500 μm high; the distance between two adjacent microchannels is 2.0 mm), and the bottom layer is the PLC film of electrospun microfibers for the patterning of antibodies. For the detection of high concentrations of biomarkers, the electrospun microfibers on a tin foil layer were removed with a scalpel. After the chip was assembled, different kinds of capture antibodies (diluted in PBS buffer) were injected into the corresponding channels. After 60 minutes, the membrane was washed with PBS buffer three times to remove the unbound antibodies.Synthesis and modification of gold nanoparticles
All glassware and magnetic stirring bars were cleaned with aqua regia (HNO3:HCl = 1:3) and rinsed with ultrapure water and dried prior to use. 200 mL distilled water and 2 mL 1% sodium citrate were added into glassware and heated to reflux with rapid stirring. A chloroauric acid solution (1%, 2 mL) was added and boiled for an additional 30 min. The prepared gold nanoparticle (AuNP) solution was cooled down to room temperature and then filtered through a syringe (the orifice size of the filter membrane is 0.22 μm). The pH of the solution was adjusted to 8.5 with 0.01 M K2CO3. Different amounts of capture antibodies and HRP enzyme with different ratios (1:2, 1:4, 1:6 and 1:8) were added into 1 mL AuNP solution under slight stirring for 60 min. The final concentration of capture antibodies was 20 μg mL−1. 10 mg mL−1 BSA solution was added into the solution to reach a final BSA concentration of 2 mg mL−1 for blocking the unbound sites. After the mixture was centrifuged twice (14000 rpm, 4 °C) for 20 min, antibody-coated AuNPs were obtained by removing the supernatant. The antibody-coated AuNPs were resuspended in a 0.2 mL 0.2% BSA solution and stored at 4 °C for use.
Multiplexed biomarker detection with the microfluidic chip
Bovine serum powder and Tween 20 were added into PBS buffer to prepare a 3% BSA solution and a 0.5% PBST solution, respectively. All proteins and antibodies were diluted using the prepared BSA solution. 60 μL 3% BSA, a mixture of multiple biomarkers, 0.5% PBST, a mixture of capture antibodies, 0.5% PBST and a mixture of a chemiluminescent substrate (luminol and hydrogen peroxide solution) were added into reagent reservoirs 1 to 6, respectively. 3% BSA solution was loaded into the reaction channel to block the unbound sites for 45 minutes before use. After preparing the microfluidic chip, we slid the chip into the portable device and initiated the detection. After initiating the on-chip valves, a peristaltic pump could drive reagents into the reaction channel. Each reagent or sample solution was incubated in the zigzag reaction channel to complete the whole reaction: 20 minutes for serum samples and 30 minutes for detection antibodies. After opening the sixth valve, chemiluminescent reagents passed through the zigzag reaction channel to react with the HRP enzyme. The generated chemiluminescence signal was captured by the CCD camera (QHY21/22/23 camera with SONY's high-sensitivity EXview II CCD CMOS chips. Read noise: 5 electrons. Resolution: 2020 × 1476. Light Speed Vision Co., Ltd. Beijing, China) with an exposure time of 45 s. The whole microfluidic chemiluminescence immunoassay was completed automatically within 60 minutes.We also compared our HMC-based DMI system with a Roche immunoassay. Serum samples from patients with infection were directly injected into the microfluidic chips. Whole blood was not used to allow easy comparison with existing methods for the detection of these biomarkers (existing clinically used methods mostly employ serum samples instead of whole blood). The concentrations of CRP, PCT, and IL-6 were also detected with an Elecsys 2010 immunoassay analyser (Roche Diagnostics).
Results and discussion
Hierarchically structured microchip and automated portable device
The reason why we called our chip HMC is that it has three layers: the fluidic layer with a fluid pathway, the substrate layer with a waste recovery reservoir, and the antibody-patterned strip for immunoassay.5 Different antibodies are selectively modified on the film of electrospun poly(L-lactide-co-ε-caprolactone) (ES-PLC) microfibers with a PDMS chip (Scheme 1a). The electrospun microfibers have larger specific surface areas and can more easily absorb antibodies compared with a flat membrane. After cutting the antibody-patterned membrane into strips, the fluidic layer and substrate layer together with the antibody-patterned strip are assembled to form the HMC (Scheme 1b and c). The fully automated and portable device can complete all the steps required for immunoassay which fully meet the demands of POCT (Fig. S1†). After assembling the chip and adding the serum sample and reagents into the reservoirs, we can place the chip into the automated device and initiate the detection by pressing the buttons on the portable device (Fig. S2†). The readout signals have nine dots. Each biomarker has a triplicate of signal dots to yield reliable results (Scheme 1d). The chemiluminescence signals are analysed to calculate the concentrations of biomarkers. For different biomarkers, the dynamic range is adjusted to their natural range in human serum with the ES-PLC microfibers producing a porous three-dimensional reaction substrate and enzyme/antibody modified AuNPs to lower the limits of detection (LODs) (Scheme 1e).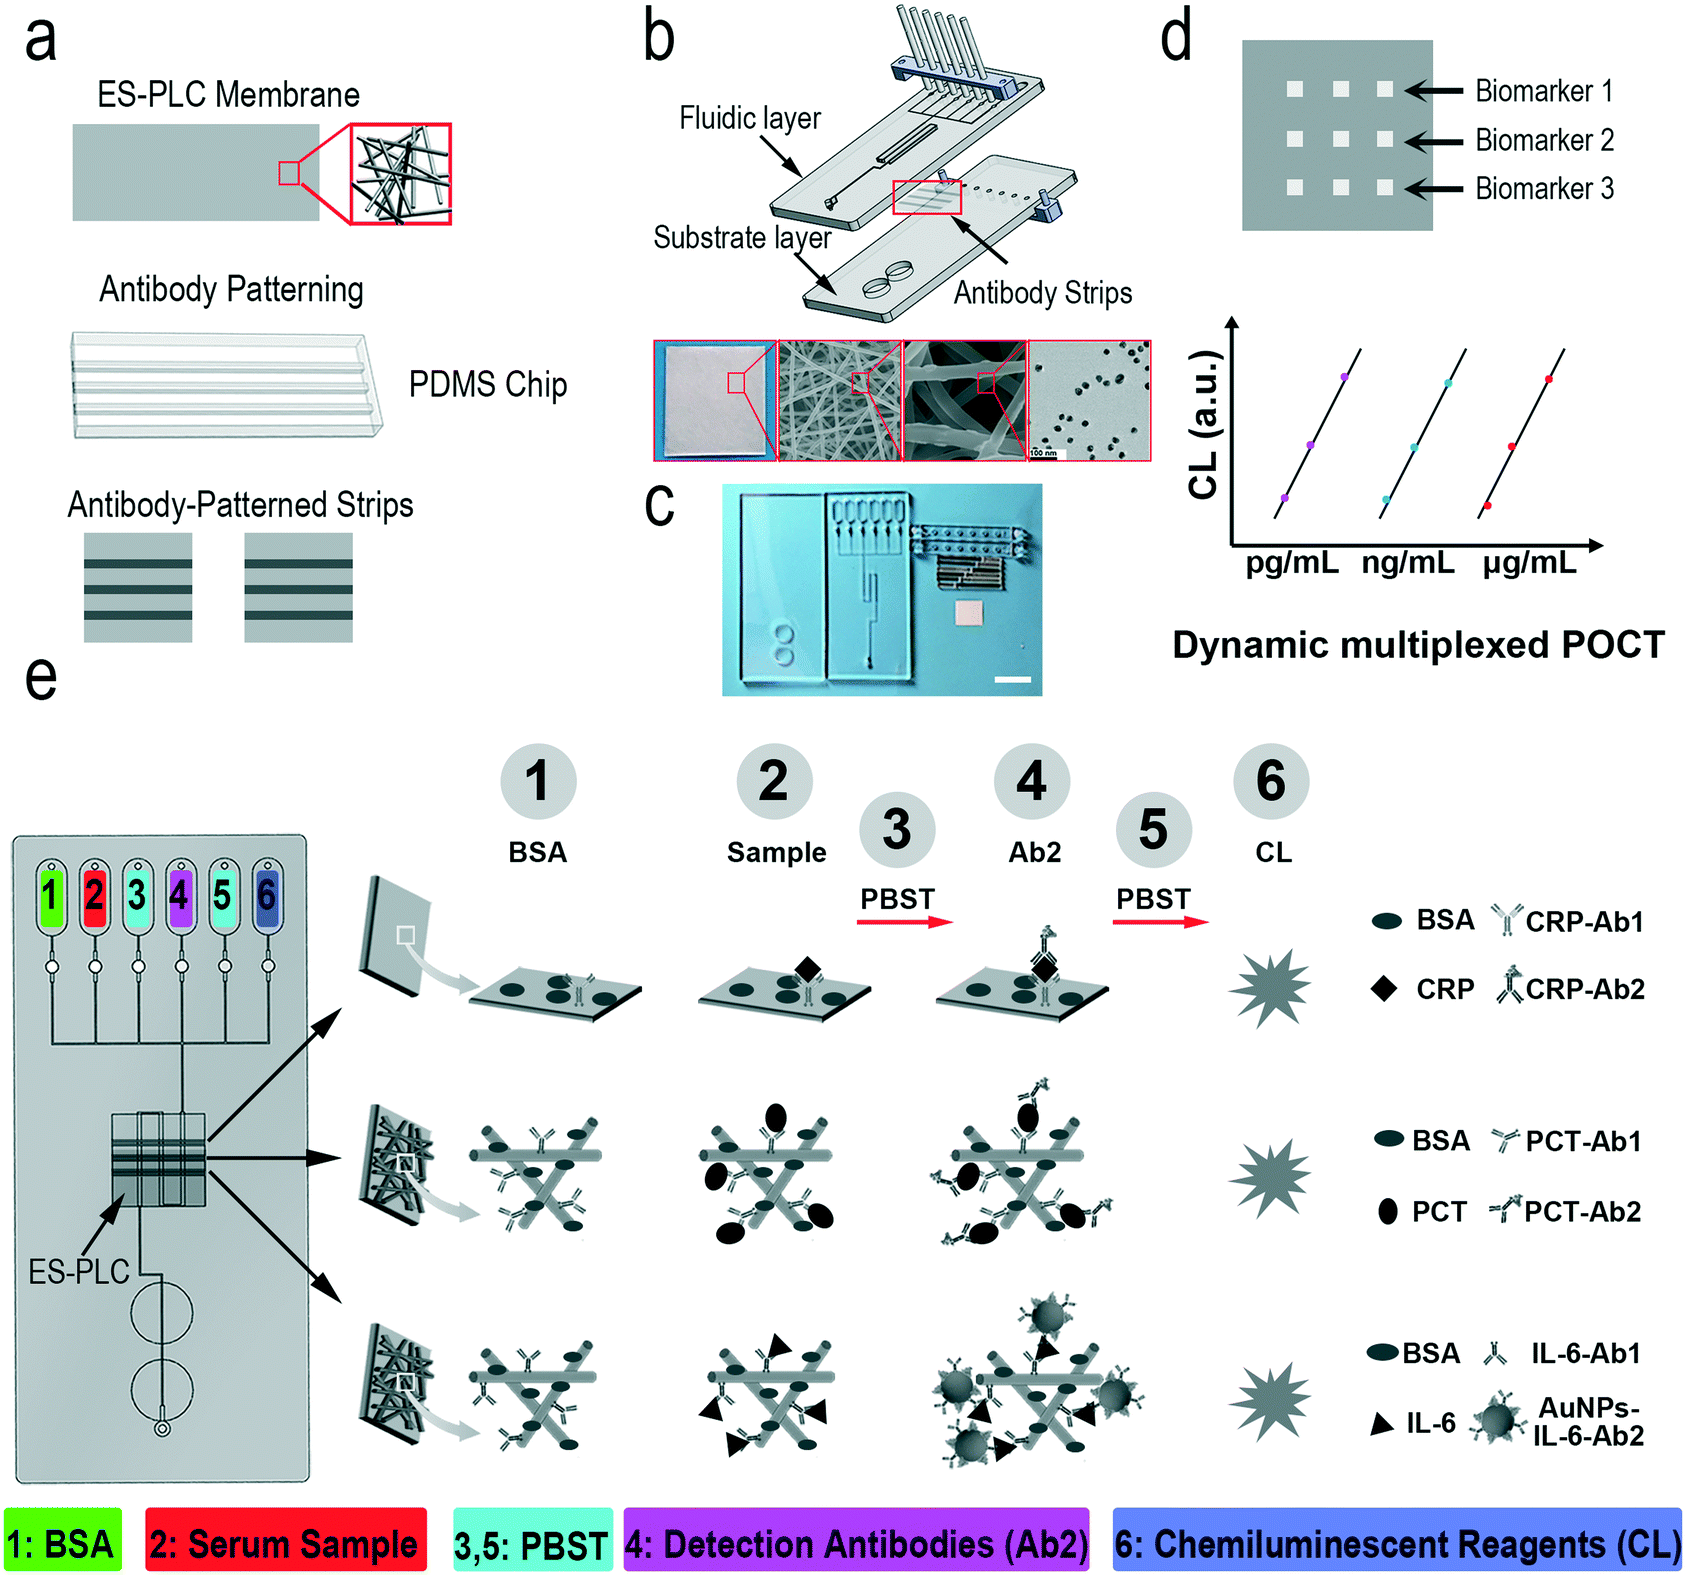 | ||
| Scheme 1 Schematic illustration of our HMC-based DMI system. a) Prepare the antibody-patterned ES-PLC membrane strip with the PDMS microfluidic chip. b) The prepared antibody-patterned strip is then assembled to the HMC. The inset photo/SEM/TEM images show the hierarchical structure of the antibody-patterned strip. c) Photo of our HMC. Scale bar: 1 cm. d) We can dynamically detect multiple biomarkers with only one drop of a sample using different amplified strategies. Signals comprise nine dots. Each biomarker has a triplicate of signal dots. Chemiluminescence signals are analyzed to calculate the concentration of each biomarker. e) The principle of the simultaneous detection of multiple biomarkers in serum with a broad concentration range. 60 μL 3% BSA, a mixture of sample solutions of multiple biomarkers, 0.5% PBST, a mixture of capture antibodies, 0.5% PBST and a mixture of a chemiluminescent substrate (luminol and hydrogen peroxide solution) are loaded into reagent reservoirs 1 to 6, respectively. BSA blocking, antigen capture, detection of antibody conjugation and chemiluminescence procedures are shown in this picture. | ||
We need to pre-pattern different types of capture antibodies on an electrospun film which is different from our previous approach of “wet pressing”.35 Electrospun microfibers must form a film easily and should not be damaged after patterning antibodies. By comparing different electrospun microfibers, we chose PLC as the electrospinning material to prepare ES-PLC microfibers for the HMC (Fig. 1a and S3†). Several other materials are typically more porous than PLC and have cotton-like appearances which are easy to be damaged when peeling off the antibody patterning chip. Microfibers with a diameter of about 1 micron are laid on top of the tin foil layer to form a porous and loose three-dimensional substrate for the adsorption of antibodies and for the immune-reaction (Fig. 1a). The Brunauer–Emmett–Teller specific surface area shows that the specific surface area of the ES-PLC film is 5.74 m2 g−1 which provides enough reaction sites for the immunoassay. The confocal microscopy images show that the antibodies are distributed more uniformly on the ES-PLC film and have a higher intensity than the traditional tin foil substrate after patterning fluorescein isothiocyanate- antibodies (Fig. 1b). The signal intensity shows that the fluorescence signal increases nearly 7 times (Fig. 1b and S5†). These results show that the electrospun microfibers improve the specific surface areas to absorb antibodies for the following immunoassay with lower LODs and higher detection efficiency. Citrate-stabilized AuNPs (about 27 nm in diameter) are prepared with good dispersion (Fig. S6†). The UV-vis spectra before and after modification with protein show that the AuNPs had a slight increase in size (Fig. 1c). Their ζ-potential and light-scattering properties can also prove it (Fig. S7†). The SEM images of the ES-PLC membrane after detecting IL-6 show the reaction sites of immunoassays. The structure of protrusions shows the presence of AuNPs (Fig. 1d).
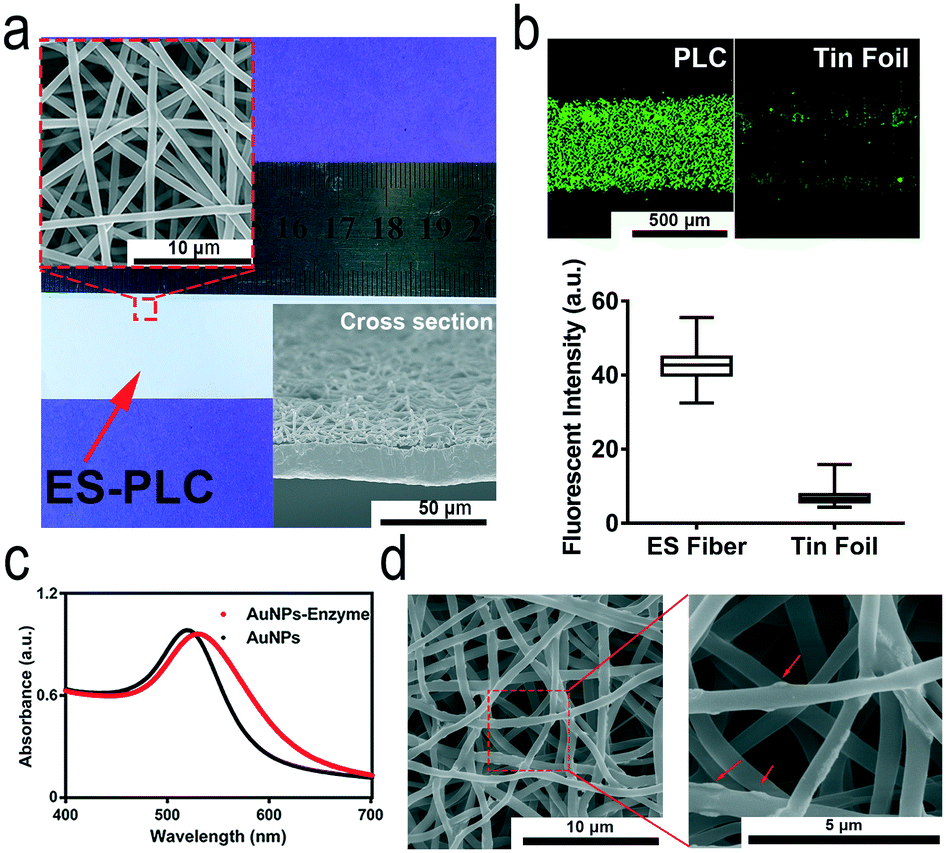 | ||
| Fig. 1 Structure of our HMC and its ability to lower LODs. a) Photograph of the prepared ES-PLC film. The 3D porous and loose structure is clearly shown in the cross-section SEM image. b) Confocal microscopy images of the antibody-patterned strip. The signal of the ES-PLC film is stronger (about 7 times) and more uniform compared to that of a tin foil membrane. c) The UV-vis absorption spectra of AuNPs before and after modification with the antibodies and enzyme. d) SEM images of the ES-PLC film after detecting IL-6 showing the reaction sites of immunoassays. | ||
Ultra-broad range CRP, PCT and IL-6 detection
The detection ranges for the different biomarkers are adjusted by using different signal amplification methods. The concentration of CRP (μg mL−1 level) is higher than those of PCT and IL-6. We remove the electrospun microfibers on the tin foil layer and reduce the concentration of the capture antibodies which enables the direct detection of CRP in undiluted serum samples using the HMC-based DMI system (Fig. S8†). Compared to that of CRP, the concentration of PCT in normal human serum is less than 0.5 ng mL−1. We use the ES-PLC microfibers to lower its detection range. The concentration of PCT can be detected directly on the film of ES-PLC microfibers (Fig. S9†). IL-6 (pg mL−1 level) has a lower concentration than both CRP and PCT. We use the AuNPs and ES-PLC microfibers to lower its LOD. By conjugating a large number of enzymes and antibodies on the AuNPs, we can detect IL-6 with the lowest LOD (Fig. S10†). In the following experiments, we set the concentrations of capture antibodies at 5 μg mL−1, 10 μg mL−1, and 20 μg mL−1 for CRP, PCT and IL-6, respectively. The time for patterning the capture antibodies is 60 minutes. The detection antibodies of CRP and PCT are diluted 250 times with final concentrations of 2.4 μg mL−1 and 3.8 μg mL−1, respectively. After optimizing the reaction conditions for each biomarker, we can automatically detect multiple biomarkers in one chip, even though their concentrations are quite different (Scheme 1e). After optimizing the chip design and the detection conditions, the detection can be completed in an automatic way. The operation of our HMC-based DMI system can be simplified to three steps (Fig. S2†). Step 1, add the serum sample and reagents into the reservoirs; step 2, place the chip into the device; step 3, press the buttons to start the detection.Under the optimized conditions, the chemiluminescence signals increase as the concentrations of these biomarkers increase (Fig. 2a). The resulting images have nine signal dots. The three chemiluminescent signal dots that show the same results at the left side are CRP, the middle three dots are PCT and the right three dots show the IL-6 chemiluminescence signals. A linear relationship between the chemiluminescence intensity and concentration of these biomarkers are obtained. For CRP, the dynamic range is 3.13–100 mg L−1 and the standard linear equation is Y = 3792log2(X) − 2059, R2 = 0.97. The standard linear equations for PCT and IL-6 are Y = 1594X + 1309, R2 = 0.99, and Y = 14.34X + 46.29, R2 = 0.98, respectively (Fig. 2b–d). The concentration of CRP is higher than those of PCT and IL-6 (over 1000 times). The chemiluminescence signal is easily saturated with increasing [CRP] and has crossed the linear relationship region of the chemical reaction. After detection of ten blank chips with no biomarkers in the sample, the LODs of CRP, PCT and IL-6 are calculated to be 1.87 μg mL−1, 0.17 ng mL−1, and 49.75 pg mL−1, respectively (LOD = M + 3S, S is the standard deviation and M is the mean value of the concentrations of the ten blank samples, Table S1†).
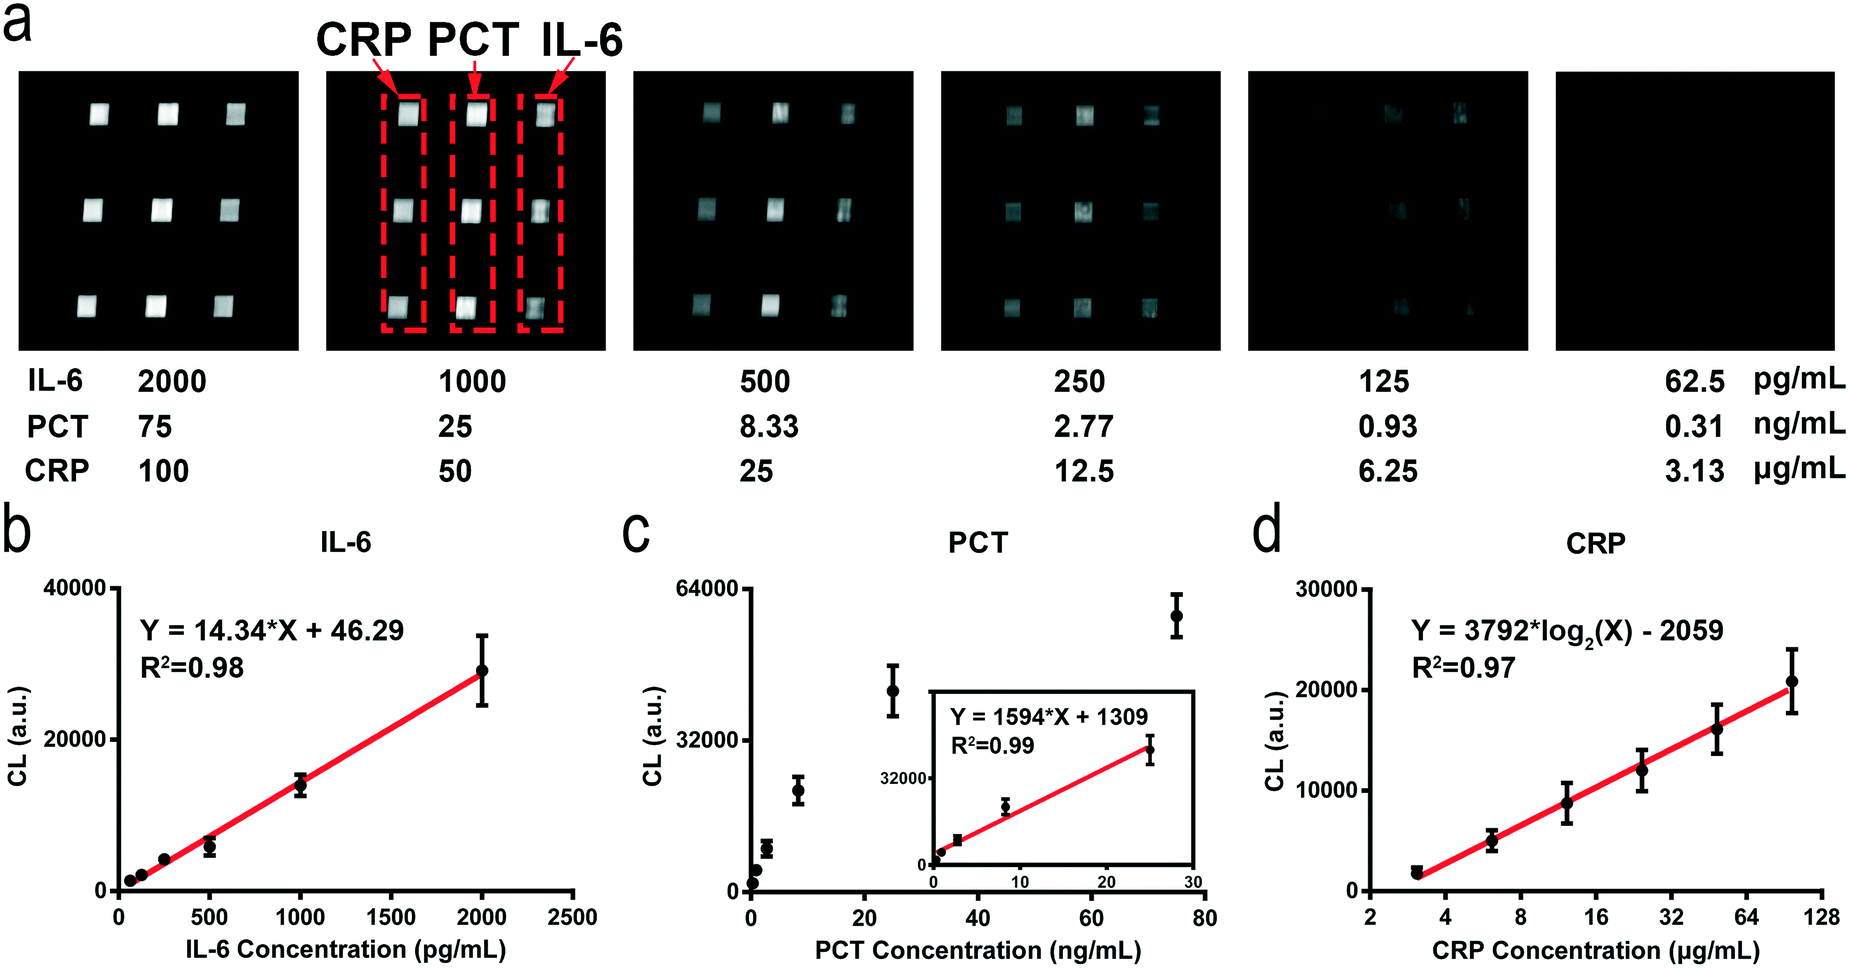 | ||
| Fig. 2 Simultaneous detection of CRP, PCT, and IL-6 with our portable and automatic HMC-based DMI system. a) Chemiluminescence images of different concentrations of these three inflammatory biomarkers captured by the automated device. Chemiluminescence signal analysis and standard curves of these biomarkers: b) IL-6, c) PCT and d) CRP. | ||
To realize the fully integrated detection of multiple biomarkers with the HMC-based autonomous DMI system, the cross-reactions between the biomarkers and capture/detection antibodies need to be completely avoided. Four kinds of immunoassay chips are used to quantify the anti-interference abilities. 60 μL 3% BSA, a sample solution of multiple biomarkers, 0.5% PBST, a mixture of capture antibodies, 0.5% PBST and a mixture of the chemiluminescent substrate (luminol and hydrogen peroxide solution) are loaded into the reagent reservoirs 1 to 6, respectively. Except for the difference in No. 2 reagent reservoir (Table S2†), all the other conditions are the same as before. The chemiluminescence images show that there is no interference between the proteins that could affect the detection. There is no difference in the signals between single biomarker detection (chip no. 2, 3 and 4) and multiple biomarker detection (chip no. 1) which indicates that there are no cross-reactions that affect the chemiluminescence signals (Fig. 3).
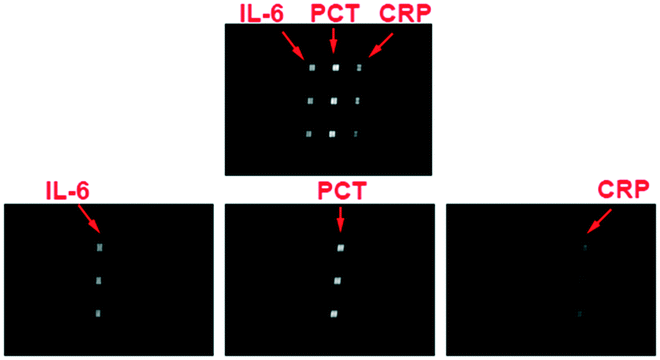 | ||
| Fig. 3 The cross-reactions between the biomarkers and capture/detection antibodies are minimal. The chemiluminescence images show that there is no interference between the proteins that could affect the detection. Meanwhile, there are no significant differences between the single and multi-protein signals which ensure the simultaneous detection of these biomarkers with our microfluidic chip. | ||
To investigate the accuracy and practical applications of the HMC-based DMI system, the concentrations of these biomarkers are detected using the HMC-based DMI system (Fig. 4a and Table S4†) and then compared with the commercial Elecsys 2010 immunoassay analyser (Roche Diagnostics). The quantitative results for IL-6 and PCT show a good consistency between the Roche chemiluminescence device and our HMC-based DMI system (Fig. 4c and d). The biggest advantage of our DMI system is that it allows the simultaneous detection of multiple biomarkers in POC settings. For CRP detection, we use commercialized ELISA kits to compare our results, because we cannot find a commercial CLIA kit to detect CRP (Fig. 4e). Both of these comparisons show that our HMC-based DMI system agrees well with the commercial products. Compared with traditional methods, our HMC-based DMI system can detect multiple biomarkers with an adjustable dynamic range (about 10 orders of magnitude) (Fig. 4b). In addition to the adjustable sensitivity, the repeatability is also evaluated by testing ten chips with the same concentration of standard samples (Table S3†). The inter-assay relative standard deviation (RSD) and the intra-assay RSD are below 15%. The storage stability of the patterned antibodies on ES-PLC is assessed by detecting standard PCT (20 ng mL−1) and IL-6 (2000 pg mL−1) samples after baking at 37 °C. The result shows that the patterned antibodies can remain viable after 10 days of baking (Fig. S11†), which indicates that the patterned antibodies can remain viable for at least 6 months at 4 °C.36 Owing to the HMC-based DMI system, the time and amount of sample consumed are also less than conventional ELISA especially when we want to detect multiple biomarkers with greatly varying concentrations.
 | ||
| Fig. 4 Simultaneous detection of CRP, PCT and IL-6 in serum samples with our portable and automatic HMC-based DMI system. a) Chemiluminescence images of the detection of these three inflammatory biomarkers captured by the automated device. The serum samples are divided into two groups which aims to make each sample a representative and cover a wide enough concentration range. The top five images show that the concentration of PCT is less than 1 ng mL−1, and bottom five images show that the PCT concentration is greater than 1 ng mL−1. b) The concentration detection range of our chip can be adjusted to a range of up to 10 orders of magnitude (pg mL−1 to μg mL−1). Correlation analysis of the calculated concentrations of these biomarkers according to the chemiluminescence signal analysis results compared with those of the commercial products: c) IL-6, d) PCT and e) CRP. | ||
It is misleading if we only use one of these biomarkers to indicate the state of inflammation in a number of cases. Fig. 5 shows the fold increase of these biomarkers which are calculated by dividing the measured concentration with the cut-off value of the corresponding biomarker (we set the cut-off value of CRP, PCT and IL-6 at 5 μg mL−1, 0.2 ng mL−1 and 145 pg mL−1, respectively). The cut-off value of a biomarker is not a constant value for different applications. The reason why we set a cut-off value here is that these three biomarkers have a broad concentration range which is hard to display in one figure. We can clearly see that a single biomarker often makes it difficult to make correct judgments, because their concentrations vary greatly and even do not show any abnormalities in some cases. Although PCT has been used as a biomarker to guide antibiotic therapy,28,29 this often leads to a confusing diagnosis when drugs are used for treatment. For patients No. 2 and 5, the concentrations of PCT are in the normal range, but the concentrations of IL-6 and CRP show that they are both seriously infected. From the perspective of patients No. 7 and 9, the concentration of CRP, commonly used in blood tests, cannot completely determine whether the patient is in an inflammatory state. Multiplexed immunoassays show advantages in providing results for multiple biomarkers such that one can accurately and timely determine the status of the patient. Our HMC-based DMI system can provide a way to solve this problem.
 | ||
| Fig. 5 Fold increase of these biomarkers in different patients. The numbers in the x-axis represent the different numbers assigned to each patient. Fold increase is calculated by dividing the measured concentration with the cut-off value of the corresponding biomarker (we set the cut-off value of CRP, PCT and IL-6 at 5 μg mL−1, 0.2 ng mL−1 and 145 pg mL−1, respectively). | ||
Conclusions
Rapidly quantitating the concentrations of multiple biomarkers is of great significance for the diagnosis of many diseases. In this work, we report an HMC-based DMI system for detecting multiple biomarkers simultaneously when their concentrations vary greatly. We can automatically detect CRP, PCT and IL-6 for accurately detecting infection in patients. From the results of clinical examination, the one-click operation mode completes the entire assay in a portable and automated device which truly meets the demands of POCT. From the serum test results, although CRP, PCT and IL-6 are broadly used in bioassays, it is easy to obtain erroneous judgments from only a single biomarker. Multiplexed detection of multiple biomarkers can greatly improve the accuracy of diagnosis and reduce the burden of diseases. We believe that this HMC-based DMI system can also detect multiple biomarkers for a series of applications, such as in community health centers, mobile clinics and even the patient's home.Author contributions
Xingyu Jiang and Lei Mou designed and completed most of the experiments and data analyses. Ruihua Dong prepared the electrospun membranes and took their SEM images. The automated portable instruments and immunoassay chips were designed by Binfeng Hu. Zulan Li collected all these serum samples and participated in the discussion of this part. Jiangjiang Zhang discussed and modified the experimental and technical details. All the authors read and approved the final manuscript. We are grateful to Xingyu Jiang for his expert technical and administrative assistance throughout the whole experiment.Conflicts of interest
There are no conflicts to declare.Acknowledgements
We thank the National Key R&D Program of China (2017YFA0205901), the National Natural Science Foundation of China (21535001, 81730051, and 21761142006) and the Chinese Academy of Sciences (QYZDJ-SSW-SLH039, 121D11KYSB20170026, and XDA16020902) for the financial support.Notes and references
- F. Fan, H. Shen, G. Zhang, X. Jiang and X. Kang, Clin. Chim. Acta, 2014, 431, 113–117 CrossRef CAS PubMed.
- H. Wang, J. Li, X. Zhang, B. Hu, Y. Liu, L. Zhang, R. Cha, J. Sun and X. Jiang, Analyst, 2016, 141, 815–819 RSC.
- C. D. Chin, T. Laksanasopin, Y. K. Cheung, D. Steinmiller, V. Linder, H. Parsa, J. Wang, H. Moore, R. Rouse, G. Umviligihozo, E. Karita, L. Mwambarangwe, S. L. Braunstein, J. van de Wijgert, R. Sahabo, J. E. Justman, W. El-Sadr and S. K. Sia, Nat. Med., 2011, 17, 1015–1019 CrossRef CAS PubMed.
- Y. Zhong, X. Tang, J. Li, Q. Lan, L. Min, C. Ren, X. Hu, R. M. Torrente-Rodríguez, W. Gao and Z. Yang, Chem. Commun., 2018, 54, 13813–13816 RSC.
- B. Hu, J. Li, L. Mou, Y. Liu, J. Deng, W. Qian, J. Sun, R. Cha and X. Jiang, Lab Chip, 2017, 17, 2225–2234 RSC.
- S. Laing, K. Gracie and K. Faulds, Chem. Soc. Rev., 2016, 45, 1901–1918 RSC.
- P. S. Pakchin, S. A. Nakhjavani, R. Saber, H. Ghanbari and Y. Omidi, TrAC, Trends Anal. Chem., 2017, 92, 32–41 CrossRef CAS.
- Y. Xianyu, J. Wu, Y. Chen, W. Zheng, M. Xie and X. Jiang, Angew. Chem., Int. Ed., 2018, 57, 7503–7507 CrossRef CAS PubMed.
- Y. Zhang, W. Liu, S. Ge, M. Yan, S. Wang, J. Yu, N. Li and X. Song, Biosens. Bioelectron., 2013, 41, 684–690 CrossRef CAS PubMed.
- J. F. Rusling, Anal. Chem., 2013, 85, 5304–5310 CrossRef CAS PubMed.
- C. Li, Y. Yang, D. Wu, T. Li, Y. Yin and G. Li, Chem. Sci., 2016, 7, 3011–3016 RSC.
- R. Tozzoli, C. Bonaguri, A. Melegari, A. Antico, D. Bassetti and N. Bizzaro, Clin. Chem. Lab. Med., 2013, 51, 129–138 CAS.
- P. J. Tighe, R. R. Ryder, I. Todd and L. Fairclough, Proteomics: Clin. Appl., 2015, 9, 406–422 CAS.
- Y. Li, J. Xuan, Y. Song, W. Qi, B. He, P. Wang and L. Qin, ACS Nano, 2015, 10(1), 1640–1647 CrossRef PubMed.
- Z. Zhu, Z. Guan, S. Jia, Z. Lei, S. Lin, H. Zhang, Y. Ma, Z. Tian and C. Yang, Angew. Chem., Int. Ed., 2014, 53, 12503–12507 CAS.
- B. Reddy, U. Hassan, C. Seymour, D. C. Angus, T. S. Isbell, K. White, W. Weir, L. Yeh, A. Vincent and R. Bashir, Nat. Biomed. Eng., 2018, 2, 640–648 CrossRef PubMed.
- A. Kasperska-Zajac, A. Grzanka, E. Machura, B. Mazur, M. Misiolek, E. Czecior, J. Kasperski and J. Jochem, Inflammation Res., 2013, 62, 309–312 CrossRef CAS PubMed.
- A. L. Vijayan, S. Ravindran, R. Saikant, S. Lakshmi and R. Kartik, J. Intensive Care, 2017, 5, 51 CrossRef PubMed.
- T. J. Graetz and R. S. Hotchkiss, Nat. Rev. Nephrol., 2017, 13, 5–6 CrossRef CAS PubMed.
- C. Wacker, A. Prkno, F. M. Brunkhorst and P. Schlattmann, Lancet Infect. Dis., 2013, 13, 426–435 CrossRef CAS PubMed.
- D. W. Jekarl, S.-Y. Lee, J. Lee, Y.-J. Park, Y. Kim, J. H. Park, J. H. Wee and S. P. Choi, Diagn. Microbiol. Infect. Dis., 2013, 75, 342–347 CrossRef CAS PubMed.
- E. L. Tsalik, L. B. Jaggers, S. W. Glickman, R. J. Langley, J. C. van Velkinburgh, L. P. Park, V. G. Fowler, C. B. Cairns, S. F. Kingsmore and C. W. Woods, J. Emerg. Med., 2012, 43, 97–106 CrossRef PubMed.
- T. Tanaka, M. Narazaki and T. Kishimoto, Cold Spring Harbor Perspect. Biol., 2014, 6(10) DOI:10.1101/cshperspect.a016295.
- M. B. Pepys and G. M. Hirschfield, J. Clin. Invest., 2003, 111(12), 1805–1812 CrossRef CAS PubMed.
- J. Whicher, J. Bienvenu and G. Monneret, Ann. Clin. Biochem., 2001, 38(5), 483–493 CrossRef CAS PubMed.
- T. Robak, A. Gladalska, H. Stepień and E. Robak, Mediators Inflammation, 1998, 7(5), 347–353 CrossRef CAS PubMed.
- D. W. Jekarl, J. Y. Kim, S. Lee, M. Kim, Y. Kim, K. Han, S. H. Woo and W. Lee, Clin. Chem. Lab. Med., 2015, 53, 575–581 CAS.
- P. Schuetz, Y. Wirz, R. Sager, M. Christ-Crain, D. Stolz, M. Tamm, L. Bouadma, C. E. Luyt, M. Wolff and J. Chastre, Lancet Infect. Dis., 2018, 18, 95–107 CrossRef CAS PubMed.
- D. T. Huang, D. M. Yealy, M. R. Filbin, A. M. Brown, C.-C. H. Chang, Y. Doi, M. W. Donnino, J. Fine, M. J. Fine and M. A. Fischer, N. Engl. J. Med., 2018, 379, 236–249 CrossRef CAS PubMed.
- S. F. van Vugt, B. D. Broekhuizen, C. Lammens, N. P. Zuithoff, P. A. de Jong, S. Coenen, M. Ieven, C. C. Butler, H. Goossens and P. Little, BMJ [Br. Med. J.], 2013, 346, f2450 Search PubMed.
- N. I. Shapiro, W. H. Self, J. Rosen, S. C. Sharp, M. R. Filbin, P. C. Hou, A. D. Parekh, M. C. Kurz and R. Sambursky, Ann. Med., 2018, 50(5), 420–429 CrossRef CAS PubMed.
- M. Yang, W. Zhang, J. Yang, B. Hu, F. Cao, W. Zheng, Y. Chen and X. Jiang, Sci. Adv., 2017, 3, eaao4862 CrossRef PubMed.
- L. Mou and X. Jiang, Adv. Healthcare Mater., 2017, 6, 1601403 CrossRef CAS PubMed.
- X. Jiang, J. M. K. Ng, A. D. Stroock, S. K. W. Dertinger and G. M. Whitesides, J. Am. Chem. Soc., 2003, 125, 5294–5295 CrossRef CAS PubMed.
- D. Yang, X. Niu, Y. Liu, Y. Wang, X. Gu, L. Song, R. Zhao, L. Ma, Y. Shao and X. Jiang, Adv. Mater., 2008, 20, 4770–4775 CrossRef CAS.
- P. Garidel, B. Pevestorf and S. Bahrenburg, Eur. J. Pharm. Biopharm., 2015, 97, 125–139 CrossRef CAS PubMed.
Footnote |
| † Electronic supplementary information (ESI) available. See DOI: 10.1039/c9lc00517j |
| This journal is © The Royal Society of Chemistry 2019 |