 Open Access Article
Microfluidic-controlled optical router for lab on a chip†
Jiri
Dietvorst‡
a,
Jeroen
Goyvaerts‡
ab,
Tobias Nils
Ackermann
a,
Erica
Alvarez
a,
Xavier
Muñoz-Berbel
 *a and
Andreu
Llobera
ac
aInstitut de Microelectrònica de Barcelona (IMB-CNM, CSIC), Campus UAB, 08193 Bellaterra, Barcelona, Spain. E-mail: xavier.munoz@imb-cnm.csic.es
bGhent University – Photonics Research Group, Zwijnaarde, Ghent 9052, Belgium
cCarl Zeiss Vision GmbH, ZEISS Group, Turnstrasse 27, 73430 Aalen, Germany
First published on 13th May 2019
Abstract
In multiplexed analysis, lab on a chip (LoC) devices are advantageous due to the low sample and reagent volumes required. Although optical detection is preferred for providing high sensitivity in a contactless configuration, multiplexed optical LoCs are limited by the technological complexity for integrating multiple light sources and detectors in a single device. To address this issue, we present a microfluidic-controlled optical router that enables measurement in four individual optical channels using a single light source and detector, and without movable parts. The optofluidic device is entirely fabricated in polydimethylsiloxane (PDMS) by soft-lithography, compatible with standard microfabrication technologies, enabling monolithic integration in LoCs. In the device, in-coupled light from an optical fiber is collimated by a polymeric micro-lens and guided through a set of four sequentially connected micro-chambers. When a micro-chamber is filled with water, light is transmitted to the next one. If it is empty of liquid, however, total internal reflection (TIR) occurs at the PDMS–air interface, re-directing the light to the output optical fiber. The router presents high performance, with low cross-talk (<2%) and high switching frequencies (up to 0.343 ± 0.006 Hz), and provides a stable signal for up to 91% of the switching time. With this miniaturized, low-cost, simple and robust design, we expect the current technology to be integrated in the new generation of multiplexed photonic LoCs for biomarker analysis, even at the point of care.
Introduction
In lab on a chip (LoC), multiplexed analysis provides a way to determine multiple analytes from a single sample of small volume.1,2 This is of particular importance in the case of clinical diagnostics, where an accurate diagnosis requires evidence from more than a single biomarker.3 Apart from multi-analyte analysis, multiplexed systems are also used to endow LoCs with reliability through statistical analysis,4 when requiring multiple control points5,6 or when the reliability of the assay is subjected to sequential analysis,7,8 among others.Commonly multiplexed LoCs combine individual tests separated by spots,9 wells,10 channels (channel networks)11 or electrodes (electrode arrays),12 the latter for electrochemical LoCs. In the case of photonic LoCs, most of them rely on complex architectures integrating many light sources and readouts in a single structure, frequently through expensive sub-micrometric precision fabrication technologies.13 The complexity and costs of such systems hamper their use and widespread implementation.
Among other alternatives, multiplexing while keeping the cost at a reasonable low level is possible by the implementation of optofluidic elements14 for light routing. One possibility is to take advantage of the laminar flow governing microfluidics to create liquid–liquid (L2) waveguides composed of two liquids of different refractive indices.15 These elements can be used to split, switch or guide the light from external light sources to one of the independent light outputs. Light switching is achieved by modulation of the hydrodynamic flow, either steering the liquid waveguide16 or modifying the reflection position.17 Their main limitations rely, precisely, on maintaining and controlling a constant liquid flow, which is an important drawback for applicability outside research labs. Alternatively, most optofluidic light routing devices are based on tuneable air-gaps used as mirrors. Inspired by the articles published by Mach et al. in 2002,18 the main differences between them lie in the strategies to control the formation and elimination of the air-gap mirrors. Thermal generation of air bubbles,19 electrowetting on dielectrics (EWODs)20–22 and pneumatic control based on the application of high pressures to collapse the air channel23 are the three reported strategies based on air mirrors, with the main limitation of requiring complex and bulky external elements to control the position or geometry of the air mirror. Additionally, in the case of EWODs, the high voltages required for air-gap mirror generation, and the associated energy consumption, limit the portability and low cost of these multiplexed LoCs.
In an attempt to solve these open issues, we present a cost effective and simple microfluidic-controlled optical router (μCOR) fabricated in polydimethylsiloxane (PDMS) by soft-lithography, where micro-optic and micro-opto-fluidic elements are monolithically integrated in a single structure. Air-gap mirrors are generated in this case by filling/emptying independent micro-chambers with water with an external pump. The μCOR does not require continuous flow and improves previous air-gap mirrors by being very robust and omitting the need for high-precision instrumentation. The latter is accomplished by the combination of phase-guides and meandering channels. Phase-guides enable a stepwise control of the liquid flow, guiding the liquid to fill the chamber homogeneously along the edge and pushing out air-bubbles as the liquid continues to flow. Once filled, the pressure build-up will overcome the barrier, allowing the liquid to cross until the next phase-guide is reached.24 Meandering channels, on the other hand, connect individual chambers and provide a time window during switching. That is, the liquid flow can be stopped and resumed between the micro-chambers, maintaining a constant signal output, without needing high precision instrumentation. The switching capacity and performance of such devices are evaluated in this paper using a 1 × 4 configuration.
Materials and methods
Design and simulation software
AutoCAD (Autodesk, California, US) was used to design the μCOR. A 3D model of the designs of individual components and the final device were analysed with the TracePro simulation software (Release 7.8, Lambda Research, Littleton, MA, USA). The 3D optimization tool is based on the downhill-simplex method, which is a commonly applied nonlinear optimization method to find the extrema in a multidimensional space. The optimization function was chosen to maximize light collection at typical distances (0–2 cm) considered in the μCOR design.The optical properties of each element in the 3D model were set according to previous studies, i.e. refractive index and absorption coefficients of PDMS25 and air.26 For consistency with experimental data, ray tracing simulations were performed considering the light source and detector connected to 0.5 m long optical fibers (cladding diameter 125 μm; core diameter 105 μm; numerical aperture 0.22). The optical power at the end facet of the output fiber is determined, given the same 0.22 NA. Fresnel reflection losses at various interfaces along the system were considered in the simulation. Total irradiance values were acquired at 635 nm. A total number of rays between 10![[thin space (1/6-em)]](https://www.rsc.org/images/entities/char_2009.gif) 000 and 100
000 and 100![[thin space (1/6-em)]](https://www.rsc.org/images/entities/char_2009.gif) 000 were analysed in each simulation.
000 were analysed in each simulation.
Fabrication protocol
The micro-lenses were fabricated following the earlier described protocol by our group.27 μCOR was fabricated by soft-lithography in PDMS28 using the technology previously developed in our group.29 This technique was used to provide the required smoothness for the fabrication of the lenses and channel walls.30 Briefly, a two-level master was fabricated using the negative tone SU-8 polymer (MicroChem, Corp., Newton, MA, USA). Over a 4 inch 100 oriented silicon wafer, a 400 nm silicon oxide was grown. Then, an SU-8 seed layer was added to ensure proper adhesion between the subsequent structures and the substrate and avoid delamination during their development. Micro-optical and other microfluidic elements were defined in the first level of the master (SU-8 50, total height = 135 μm). Phase-guides were implemented in the second layer (SU-8 25, total height = 50 μm). Masters were finally developed by immersion in propylene glycol methyl ether acetate solution (PGMEA, MicroChem Corporation, Newton, MA, USA) and hard baked for 2 h at 120 °C to enhance their robustness. PDMS (Sylgard 184 elastomer kit, Dow Corning, Midland, MI, USA) replicas of the master (prepared as indicated by the supplier) were cured for 20 min at 80 °C. The structured PDMS was irreversibly bonded to a soda-lime glass wafer after treatment with oxygen plasma and temperature (20 min, 60 °C). Finally, the bent metallic needles (lavender Optimum® steel tips, Nordson EFD, Westlake, OH, USA) were assembled in the lateral microfluidic inlet and outlet and sealed with biocompatible silicone rubber glue (RS Components 692-542, Germany).Optofluidic setup
Optical fibers with 125 μm cladding and 105 μm core (AFS105/125Y, Thorlabs, Dachau, Germany) were stripped, cleaved and inserted into the self-alignment elements using ethanol as a lubricant. A 635 nm-laser source (S1FC635, Thorlabs, Dachau, Germany) was connected to the inlet optical fiber. Outlet fibers were connected to a power-meter (Newport 1931-C, Newport Corporation, Irvine, CA, USA) and spectrometers (QEPro, Flame, Maya; Ocean Optics, Largo, FL, USA) for simultaneous light detection. A NeMESYS syringe-pump was used as the fluidic driver (Cetoni GmbH, Germany). PEEK tubing (Upchurch Scientific) was used to connect the optical router with a 2.5 mL gas-sealed glass syringe (Hamilton, Switzerland) implemented in the syringe pump and with the waste channel. A LabView Virtual Interface (VI) application (National Instruments, for the Austin, TX, EUA) was developed for simultaneous acquisition from multiple light detectors and synchronization of optical recordings with fluidic pumping.Results and discussion
Micro-lens system optimization
Micro-lens systems were designed and optimized separately with TracePro optical simulation software, with the main objective of having minimal optical losses. In these designs, each system was limited to two successive PDMS micro-lenses separated by an air gap to minimize the size, the dispersive optical losses and those associated with Fresnel reflections at air–PDMS interfaces.Three different micro-lens systems were designed depending on their functionality, namely collimation (input) and short-distance (<1 cm) and long-distance (>1 cm) focusing (output) systems. The collimation system was designed to reduce light dispersion from the input optical fiber and to turn it into parallel rays. Focusing systems, on the other hand, were designed to focus and match the angular acceptance angle of the output optical fibers (0.22 NA).
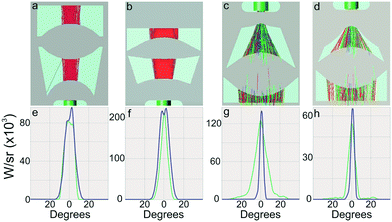
The collimation system consisted of a typical plano-convex micro-lens, for correction of input light dispersion, followed by a second convex micro-lens with soft spline curves for additional reduction of the dispersion angle. Compared to already published spherical micro-lenses29 (Fig. 1a and b), spline micro-lenses were superior for presenting better candela distribution profiles (sleeker profiles, Fig. 1e and f), higher intensities (5 × 10⁵vs. 5 × 10⁴ counts) and a quarter size reduction (650 vs. 925 μm2).
For the focusing systems, a highly convex micro-lens was chosen as the first element of the system to maximize incident light collection into the fiber. The second element was a concave micro-lens located right before the focal point of the first one, which collimated the light into a parallel beam. Two such lenses were designed based on the distance to the origin of the light, as shown in Fig. 1c and d. Considering the low numerical aperture of the fibers, this second micro-lens was small and with extreme high concave spline curvatures to reduce the numerical aperture to match with that of the output fiber. Candela distributions at the fiber input of the short-distance and long-distance focusing systems are illustrated in Fig. 1g and h. These plots show how the intensity maximum of the light is at the centre of the lenses, and drops to 0 within a 20 degrees deviation. The green lines represent the plot in the horizontal plane, whereas the purple ones represent the intensity profile along the vertical plane. The lenses were optimized along the horizontal plane to reduce spreading of the light, whereas the vertical plane was left unattended. This can be observed in the figures too, where the purple lines behave very similarly in all 4 systems, whereas the spread of the green line is reduced with the newer designs.
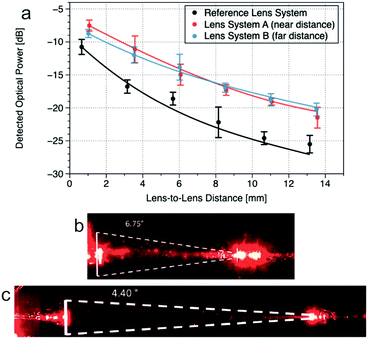
Spline-optimized systems combining collimation with either short-distance (lens system A) or long-distance (lens system B) focusing micro-lenses were fabricated and evaluated in propagation (lens-to-lens) distances from 0.5 to 13.5 mm. Experimental data and simulations, shown as points and lines in Fig. 2, respectively, were compared with those of a reference lens system consisting of spherical micro-lenses both as collimation and as focusing micro-lenses. Each experimental point corresponds to an average of 5–7 individual devices.
There was a good correlation between the experimental data and simulations in all cases, validating the theoretical model. Experimental results evidenced the superior performance of spline-optimized systems, with an improvement from 3 to 6 dB (depending on the propagation distance) when compared with the previously used micro-lens configuration. Additionally, the transition points predicted by simulation between far (lens system B) and near (lens system A) focusing configurations were also corroborated experimentally, providing a good representation of the dispersive losses along the propagation distance.
Finally, quantitative measurements, similar to those performed by Müller,20 confirmed the reduction of the numerical aperture in spline-optimized systems from 6.75° (in spherical-based systems) to 4.40° (Fig. 2b and c). Though the calculation method is not fully optimized, it enables a fast and reliable qualification of the improvement of the lenses. Therefore, spline-optimized micro-lens systems were implemented in the final μCOR.
Design and performance of the μCOR
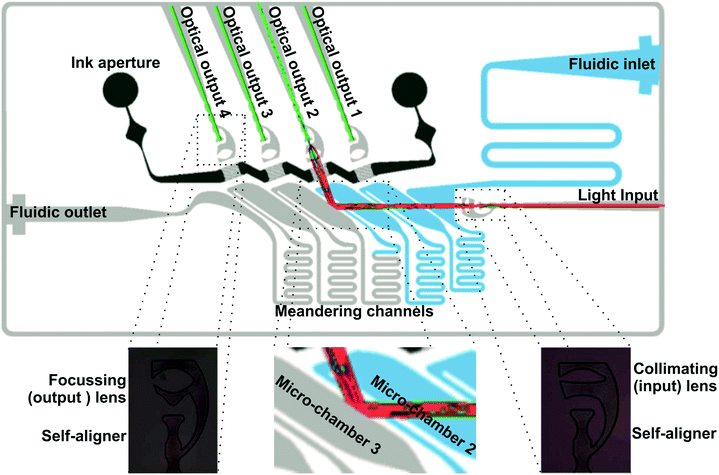
Fig. 3 illustrates the design and the performance of the μCOR device. It consisted of an advanced architecture integrating all micro-optical and microfluidic elements for in-coupling, guidance and out-coupling of light to four independent light outputs (optical channels). Micro-optical elements comprised self-alignment elements for fiber-optics positioning,29 pinholes based on liquid inks (see Fig. SI1 in the ESI†) to minimize cross-talk between channels, and the previously described optimized micro-lens. Microfluidic components included a fluidic inlet and outlet, micro-chambers, phase-guides24 for fluid management inside the micro-chambers and interconnecting meander-like micro-channels connecting the latter while introducing a time-delay between them. Importantly, all these elements were defined in a single master, and therefore, they are intrinsically self-aligned during the fabrication step, requiring little technological complexity. This monolithic fabrication allows the simultaneous integration of the router into another PDMS-based device. The number of optical channels was fixed to four for appropriate comparison with Müller's work,20 even though this can be expanded. The amount of possible channels depends on the desired light intensity and application, as more channels lead to longer optical paths, in turn resulting in bigger optical losses.Micro-chambers and the corresponding optical channels were numbered from 1 to 4 according to the liquid flow, 1 being the channel closer to the fluidic inlet (Fig. 3). They were the central elements in the μCOR. They were considered to operate as fluid-controlled micro-mirrors. The operation principle was based on the modulation of total internal reflection in the micro-chamber wall interface. Considering Snell's law, total internal reflection was reached at the PDMS–air interface of empty micro-chambers at angles above 45° (RIPDMS = 1.41; RIair = 1). However, it required angles above 71° when filled with water (RIwater = 1.33). Then, micro-chamber walls with an angle between 45° and 71° could reflect and redirect the light when empty, while enabling light transmission when filled with water. In order to reduce the design footprint and the optical losses due to lack of vertical confinement, the angle of the micro-chamber wall was set here at 55°. A more detailed explanation of how this angle was decided can be found in the ESI.†
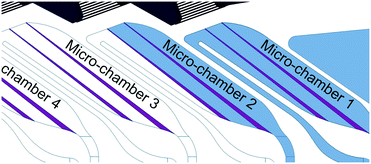
Two phase-guides were implemented in each micro-chamber structure to optimize the focusing behaviour of the switching liquid, as shown in Fig. 4. The liquid entered the bottom right corner of the micro-chamber and was pushed towards the top right side. Once filled, the liquid crosses the first phase-guide, filling the intermediate space, until the second phase guide. The same principle is repeated until breaching, after which the liquid was guided back down through the interconnecting meander structure and to the next micro-chamber. This configuration enabled a strict microfluidic control of the routing, without requiring highly-precise instrumentation and minimizing the risk of bubble formation or entrapment.
In the μCOR, this working principle is exploited in the development of a 1 × 4 optical router by sequentially connecting four independent micro-chambers. As demonstrated by simulation, with this design we could obtain a high control of the light flow. For example, light could be redirected to the first optical chamber when only the first micro-chamber was filled, to the second when micro-chambers one and two were filled, or to the output of the chip when the liquid was present in all micro-chambers. Importantly, since the micro-chambers generating the air-gap were fixed elements, the μCOR had no movable parts, which provided high mechanical robustness.
Characterization of the PDMS-based μCOR
Initially, to visualize the μCOR performance, 1 mM fluorescein solution (Sigma-Aldrich) was used to fill the system and a blue laser-source (nano-405-100, Linos) was coupled into the input fiber optics. In Fig. 5, it is shown how the input light was redirected to the second light output channel when the first micro-chamber was filled with fluorescein, or through the device when all micro-chambers were filled, enabling a strict control of the light flow and thus validating the working principle of the μCOR.In the characterization of the μCOR performance, three parameters were analysed, namely the switching frequency, lapse-time in the channel, and the cross-talk between channels under continuous flow conditions.
The switching frequency is defined by the time required to switch between two adjacent optical channels, whereas the lapse-time refers to the time during which a specific optical channel provides the maximal light output intensity at a constant flow. This second parameter is of huge importance for potential analytical applications of the presented router since it reports on the time where the light intensity is stable for performing measurements in each channel considering a constant flow. Clearly, both parameters depend on the flow rate and on geometrical features, which affect the flow in the device, e.g. the number of channels, the volume of the micro-chamber, the position, height and width of the phase-guides and the length and calibre of the interconnecting meander. Since all these geometric parameters did not differ between micro-chambers, only the fluidic sequence of the micro-chamber was considered to impact the performance. Nevertheless, depending on the application, the μCOR can be designed so as to have specific switching frequencies and lapse-times by modifying the parameters described above.
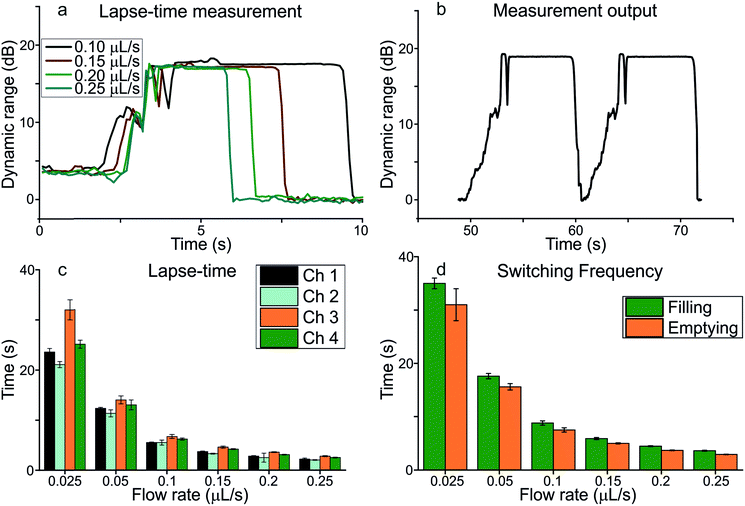
The behaviour of the measured signal at different flow rates can be used to analyse the lapse-times, as is shown in Fig. 6a, where the results of the dynamic range as a function of time at flow rates ranging from 0.025 to 0.250 μL s−1 are presented. As can be seen, the presented μCOR has a dynamic range close to 15 dB which is independent of the flow rate. The formal shape of the dynamic range is also independent of the flow: in the initial transient phase, the signal has a gradual increase towards its maximum light intensity due to the flow filling the space between the final phase guide and the meandering channel connection. The two short signal drops are attributed to the liquid meniscus propagating between the micro-chambers. Because of its shape and refractive index, reflection occurs at the air–meniscus interface, resulting in a temporal decrease of the output signal before stabilization. This exact time is the onset of the lapse-time measurement, which continues until the signal drops abruptly, corresponding to the filling of the next micro-chamber. As expected, the increase of the flow rate results in a shorter transient period, with less pronounced signal drops.
The continuous measurement of this behaviour through subsequent micro-chambers is depicted in Fig. 6b, where the signal is monitored at a constant flow rate of 0.1 μL s−1. As requested, two identical micro-chambers provide the exact same behaviour both in the transient phase and in the lapse-time, which confirms the validity of the proposed μCOR. Small variations are due to the filling, where the liquid reflects light at random towards the output. Fig. 6b allows us to measure the switching rate, which we defined as the time between the onset of the lapse in one micro-chamber and the next. Fig. 6c and d show the collection of all generated data using the methods shown in Fig. 6a and b, respectively. In all channels, the switching frequency increased with the flow rate until stabilization around 0.1 μL s−1. From 0.025 to 0.1 μL s−1, it was possible to modulate the switching frequency of the device in a range from 0.032 ± 0.003 to 0.343 ± 0.006 Hz. This frequency may be enough for an optical router implemented in a PhLoC for biological applications, where such types of assays often take minutes (enzymatic) up to hours (immunoreactions or susceptibility testing). Additionally, as mentioned above, this frequency can be tuned by modifying both the meandering micro-channels and the micro-chamber volume. Finally, these rates were in the same range as our previously developed EWOD router. No significant differences between channels were found (p < 0.05) for any of the flow rates. The data for all 4 channels were therefore grouped together and shown in Fig. 6d. However, differences can be found when either filling or emptying the μCOR. At lower flow rates emptying the device is significantly faster than filling. This is due to the reduced pressure build-up and beneficial cohesive force of water that are more dominant at lower flow rates. From flow rates of 0.2 μL s−1 and above, no differences were observed. There were no significant differences found between the different channels (p < 0.05) and the data shown are the average over all channels at the specified flow rate.
Thanks to its particular design, the lapse-time in the μCOR was always long when compared with the total time required for changing from channel to channel. In fact, the lapse-time covers between 56 and 91% of the total time required for changing between channels, meaning that the optical channel was active most of the time. Part of the reason for that may be attributed to the phase-guides that enabled a fast filling/emptying of the first section of the micro-chamber and thus the quick generation/elimination of the air-gap mirrors. Second, the design enables a continuous signal generation during switching, where only the final filling of the connecting channel between 2 micro-chambers disrupts the active signal output. In contrast to the switching frequency, the lapse-time in the optical channel depended on the flow rate and the position of the channel in the device. Regarding flow rates, the lapse-time decreased with the increasing flow rate in the range from 0.025 to 0.1 μL s−1, enabling the modulation of the measurement time. Contrary to before, there were some differences between channels, being those closer to the fluidic inlet the ones with shorter lapse-times. The differences were more evident at low flow rates, whereas above 0.1 μL s−1 the differences between channels were almost not significant. A minimum lapse-time of 2.03 s was reached in channel 2 at 0.25 μL s−1, whereas the maximum, 32 s, was obtained in channel 3 at 0.025 μL s−1.
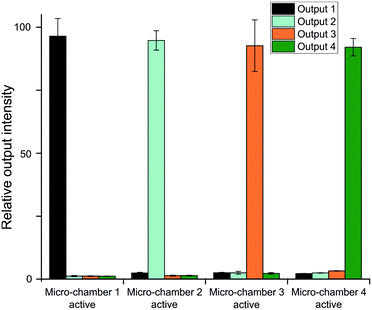
Cross-talk is a key parameter in PhLoC applications since it can dramatically alter the validity of the measurements taken. To verify this parameter, cross-talks between all channels were evaluated at a single flow rate of 0.2 μL s−1 and illustrated in Fig. 7. To reduce the cross-talk levels, the ink aperture was filled with crystal violet to absorb stray light. A further description of the working principle of the ink aperture can be found in the ESI.†
The figure shows the relative power intensity in each optical output during a single micro-chamber activation. The shown strengths are the relative outputs compared to the total output power measured over all 4 channels during the specified micro-chamber activation. Each of the 4 groups in turn corresponds to activation of each of the 4 micro-chambers. An average of 94% of the measured light goes to the designated output, signifying that a total of 6% is collected by the other channels combined which we see as cross-talk. Like with the switching rates, these results match the EWOD based router, confirming an overall equal performance, but removing the high energy requirements and improving usability.
The results show no significant differences between the intensities at the optical outputs when the corresponding micro-chamber is active. Nonetheless, differences can be found when measured at different outputs. For optical output 2, the signal is significantly lower (p < 1%) when chamber 1 is active compared to chambers 3 and 4. At both outputs 3 and 4 the signal is significantly higher when chamber 4 is active, compared to the other 2. For router 1 there are no such differences. The general trend shows higher output intensity when going further in the chip, implying higher cross-talk levels when a longer optical path is required. Additionally, there is a trend towards higher cross-talk levels at an optical output when the liquid has passed the corresponding micro-chamber. This increase is probably due to the water–PDMS interface, both having different refractive indices, with TIR conditions being fulfilled at angles above 71°. Some small discrepancies can thus reflect the light towards one of the corresponding outputs. However, when the liquid front has not yet reached the optical output light will be reflected away at the air–PDMS mirror before the output is reached.
Conclusions
In conclusion, microfluidic-control of sequential light routing is possible with a highly-integrated and miniaturized all-polymer optical router characterized in the current study, without the need for integrated movable parts, constant continuous flow or the requirement of precise external instrumentation. The device is capable to redirect to four independent optical output channels with switching frequencies between 0.03 and 0.3 Hz, which is well suitable for most biological assays. More importantly, thanks to its particular design, the optical router remains active for optical measurements up to 91% of the total time required for changing between channels and enables the modulation of the measurement time from 32 to 2 seconds by adjusting the flow rate. For the simplicity and robustness of the technology, the monolithic fabrication and the compatibility with microfabrication techniques, we expect the current routing strategy to impact largely in the development of future advanced multiple analyte biosensing LoC platforms.Conflicts of interest
There are no conflicts to declare.Acknowledgements
The research leading to these results has received funding from the European Research Council under the European Community's ERC grant agreement no 209243 and the Horizon 2020 (H2020) project ND4ID (grant agreement no 675412). Dr. X. M.-B. was supported by the “Ramón y Cajal” program from the Spanish Government. We acknowledge support of the publication fee by the CSIC Open Access Publication Support Initiative through its Unit of Information Resources for Research (URICI).References
- M. Díaz-González, X. Muñoz-Berbel, C. Jiménez-Jorquera, A. Baldi and C. Fernández-Sánchez, Electroanalysis, 2014, 26, 1154–1170 CrossRef.
- C. Dincer, R. Bruch, A. Kling, P. S. Dittrich and G. A. Urban, Trends Biotechnol., 2017, 35, 728–742 CrossRef CAS PubMed.
- F. Berhane, A. Fite, N. Daboul, W. Al-Janabi, Z. Msallaty, M. Caruso, M. K. Lewis, Z. Yi, M. P. Diamond, A. B. Abou-Samra and B. Seyoum, Diabetes Res. Clin. Pract., 2014, 103, S8 CrossRef.
- M. Gutiérrez, A. Llobera, A. Ipatov, J. Vila-Planas, S. Mínguez, S. Demming, S. Büttgenbach, F. Capdevila, C. Domingo and C. Jiménez-Jorquera, Sensors, 2011, 11, 4840–4857 CrossRef.
- S. Demming, J. Vila-Planas, S. Aliasghar Zadeh, A. Edlich, E. Franco-Lara, R. Radespiel, S. Büttgenbach and A. Llobera, Electrophoresis, 2011, 32, 431–439 CrossRef CAS PubMed.
- A. Weltin, K. Slotwinski, J. Kieninger, I. Moser, G. Jobst, M. Wego, R. Ehret and G. A. Urban, Lab Chip, 2014, 14, 138–146 RSC.
- C. Dongre, J. van Weerd, N. Bellini, R. Osellame, G. Cerullo, R. van Weeghel, H. J. W. M. Hoekstra and M. Pollnau, Biomed. Opt. Express, 2010, 1, 729–735 CrossRef CAS.
- H. Jiang, X. Weng and D. Li, Lab Chip, 2013, 13, 843 RSC.
- J. H. Lee, H. S. Seo, J. H. Kwon, H. T. Kim, K. C. Kwon, S. J. Sim, Y. J. Cha and J. Lee, Biosens. Bioelectron., 2015, 69, 213–225 CrossRef CAS.
- F. Shen, W. Du, E. K. Davydova, M. A. Karymov, J. Pandey and R. F. Ismagilov, Anal. Chem., 2010, 82, 1–9 CrossRef.
- T. Tian, X. Wei, S. Jia, R. Zhang, J. Li, Z. Zhu, H. Zhang, Y. Ma, Z. Lin and C. J. Yang, Biosens. Bioelectron., 2016, 77, 537–542 CrossRef CAS PubMed.
- Y. Wang, W. Wang, L. Yu, L. Tu, Y. Feng, T. Klein and J. P. Wang, Biosens. Bioelectron., 2015, 70, 61–68 CrossRef CAS.
- C. F. Carlborg, K. B. Gylfason, A. Kaźmierczak, F. Dortu, M. J. Bañuls Polo, A. Maquieira Catala, G. M. Kresbach, H. Sohlström, T. Moh, L. Vivien, J. Popplewell, G. Ronan, C. A. Barrios, G. Stemme and W. van der Wijngaart, Lab Chip, 2010, 10, 281–290 RSC.
- C. Monat, P. Domachuk and B. J. Eggleton, Nat. Photonics, 2007, 1, 106–114 CrossRef CAS.
- D. B. Wolfe, R. S. Conroy, P. Garstecki, B. T. Mayers, M. A. Fischbach, K. E. Paul, M. Prentiss and G. M. Whitesides, Proc. Natl. Acad. Sci. U. S. A., 2004, 101, 12434–12438 CrossRef CAS.
- N. T. Nguyen, T. F. Kong, J. H. Goh and C. L. N. Low, J. Micromech. Microeng., 2007, 17, 2169–2174 CrossRef.
- Y. C. Seow, S. P. Lim and H. P. Lee, Appl. Phys. Lett., 2009, 95, 93–96 CrossRef.
- P. Mach, M. Dolinski, K. W. Baldwin, J. A. Rogers, C. Kerbage, R. S. Windeler and B. J. Eggleton, Appl. Phys. Lett., 2002, 80, 4294–4296 CrossRef CAS.
- J. E. Fouquet, in Optical Fiber Communication Conference. Technical Digest Postconference Edition. Trends in Optics and Photonics Vol. 37 (IEEE Cat. No. 00CH37079), Opt. Soc. America, vol. 1, pp. 204–206 Search PubMed.
- P. Müller, D. Kopp, A. Llobera and H. Zappe, Lab Chip, 2014, 14, 737–743 RSC.
- J. H. Wang, L. Li, R. Y. Yuan and Q. H. Wang, J. Soc. Inf. Disp., 2017, 25, 583–588 CrossRef CAS.
- D. Witters, K. Knez, F. Ceyssens, R. Puers and J. Lammertyn, Lab Chip, 2013, 13, 2047–2054 RSC.
- W. Song and D. Psaltis, Lab Chip, 2011, 11, 2397 RSC.
- P. Vulto, S. Podszun, P. Meyer, C. Hermann, A. Manz and G. A. Urban, Lab Chip, 2011, 11, 1596 RSC.
- M. C. Bélanger and Y. Marois, J. Biomed. Mater. Res., 2001, 58, 467–477 CrossRef PubMed.
- A. Llobera, V. J. Cadarso, K. Zinoviev, C. Domínguez, S. Büttgenbach, J. Vila and J. A. Plaza, IEEE Photonics Technol. Lett., 2009, 21, 79–81 CAS.
- J. Vila-Planas, E. Fernández-Rosas, B. Ibarlucea, S. Demming, C. Nogués, J. A. Plaza, C. Domínguez, S. Büttgenbach and A. Llobera, Nat. Protoc., 2011, 6, 1642–1655 CrossRef CAS PubMed.
- Y. N. Xia and G. M. Whitesides, Annu. Rev. Mater. Sci., 1998, 37, 551–575 Search PubMed.
- X. Muñoz-Berbel, R. Rodríguez-Rodríguez, N. Vigués, S. Demming, J. Mas, S. Büttgenbach, E. Verpoorte, P. Ortiz and A. Llobera, Lab Chip, 2013, 13, 4239–4247 RSC.
- A. Llobera, S. Demming, R. Wilke and S. Büttgenbach, Lab Chip, 2007, 7, 1560–1566 RSC.
Footnotes |
| † Electronic supplementary information (ESI) available: Ink aperture function. See DOI: 10.1039/c9lc00143c |
| ‡ Both authors contributed equally. |
| This journal is © The Royal Society of Chemistry 2019 |

