
 Open Access Article
 This Open Access Article is licensed under a Creative Commons Attribution-Non Commercial 3.0 Unported Licence
Gradient in the electric field for particle position detection in microfluidic channels†
Miguel
Solsona‡
 *,
Eiko Y.
Westerbeek‡
,
Johan G.
Bomer
,
Wouter
Olthuis
and
Albert
van den Berg
*,
Eiko Y.
Westerbeek‡
,
Johan G.
Bomer
,
Wouter
Olthuis
and
Albert
van den Berg
BIOS Lab on a Chip Group, MESA+ Institute for Nanotechnology, University of Twente, Drienerlolaan 5, Enschede, The Netherlands. E-mail: m.solsona@utwente.nl
First published on 15th February 2019
Abstract
In this work, a new method to track particles in microfluidic channels is presented. Particle position tracking in microfluidic systems is crucial to characterize sorting systems or to improve the analysis of cells in impedance flow cytometry studies. By developing an electric field gradient in a two parallel electrode array the position of the particles can be tracked in one axis by impedance analysis. This method can track the particle's position at lower frequencies and measure the conductivity of the system at higher frequencies. A 3-D simulation was performed showing particle position detection and conductivity analysis. To experimentally validate the technique, a microfluidic chip that develops a gradient in the electric field was fabricated and used to detect the position of polystyrene particles in one axis and measure their conductivity at low and high frequencies, respectively.
1 Introduction
Microfluidic single cell analysis has become an important tool in biology. The high throughput and better control that microfluidics enables can provide more precise information about microstructures such as cells.1–4 Single cell microfluidic analysis is divided into two areas: cell separation and characterization. Many techniques have been developed to sort cells/particles during the last two decades, from passive methods as pinched and Dean flow fractionation (PFF) and (DFF) respectively,5–8 to active methods that use magnetic,9–11 electric12,13 or acoustic fields14,15 to push or pull cells/particles or liquids in microfluidic channels. The initial position of those cells before the separation process is of great importance for the final result and there is still very little literature on the study of the separation effectiveness.Amongst others, impedance flow cytometry, which is the study of the electrical properties of cells, has become a widely used label-free analysis method. This method consists of applying an alternating voltage to a pair of electrodes and measuring the resulting current and its dependence on frequency. This impedance-based technique provides high throughput which is necessary when dealing with samples of thousands of cells.16–29 In cell impedance flow cytometry, the position of the cell between the electrodes is very important due to inhomogeneities in the electric field.30 This could be avoided by flow-focusing the particles in the centre of the electrodes, however, this requires the use of more equipment and larger electrolyte volumes.31,32 Also, external forces that use electric, magnetic or acoustic fields can manipulate cells/particles,17 however this involves more complex systems. Sometimes, for simplicity, impedance flow cytometry studies avoid particle focusing systems, lowering the quality of the information obtained. A solution to this problem consists of measuring the position of particles in microfluidic systems. By doing so, the measured impedance can be corrected for the cell/particle's position providing more accurate information.33–35 In general, new methods are needed to track the position of cells/particles inside microfluidic channels.
Traditional cell/particle position detection in microfluidic channels is done by optical means,36–38 however, sometimes this can be very computer power consuming.39 Another method that enables high throughput is microfluidic impedance spectrometry. When used in impedance flow cytometry studies, this technique doesn't require new equipment. Various impedimetric systems able to detect the particle's position in one axis of the microchannel have been developed.33–35,40–42 More recently, a combination of these techniques has been used to detect the position of particles in channels in two axes using 10 electrodes.43
In this study we developed a new technique that uses microfluidic impedance spectrometry to detect the position of micro-particles in one axis. Previous work in our group demonstrated that a non-homogeneous capacitance that generated a gradient in the electric field in a two parallel electrode array could detect the position of objects in one axis.44 However, this first approach was tested in a big (2 × 2 × 3 cm) electrochemical cell and under no-flow conditions. Our aim is to use the same method to detect the position of microparticles in microchannels under flow conditions. The technique consists of creating a gradually increasing effective area on the electrodes by increasing the electrodeposited area of a conductive material and, hence, generating a non-homogeneous electric field. Fig. 1a shows a simplified electrical equivalent circuit of the system consisting of different parallel branches with an increasing electrodeposited area. As can be observed, the particle increases the resistance of the cell in that region, and due to the electric field gradient its position can be detected. Fig. 1b shows a 2-D Comsol simulation where the electrodes on both sides have an increasing linear electrodeposited area in the same direction, from bottom to top. The benefit of this technique is the double information that can be obtained at two different frequencies. At low frequencies, when most of the current flows through the larger electrodeposited areas, a gradient in the electric field is formed and the position of the microparticles can be detected. At these frequencies both the impedance of the medium and the capacitors are of the same range, thus providing an electric field gradient. On the other hand, at higher frequencies, the impedance of all the capacitors is much lower than the impedance of the medium. Here, the current density is homogeneous throughout the whole electrochemical cell, therefore the conductivity of the system and thus, those of the particles, can be measured. In this work, a finite element model (FEM) was developed to demonstrate the frequency range at which the position and conductivity of the particles can be detected and measured. Also, to validate the FEM, a microfluidic chip with linearly increasing electrodeposited areas perpendicular to the flow direction was fabricated and experimental results are shown.
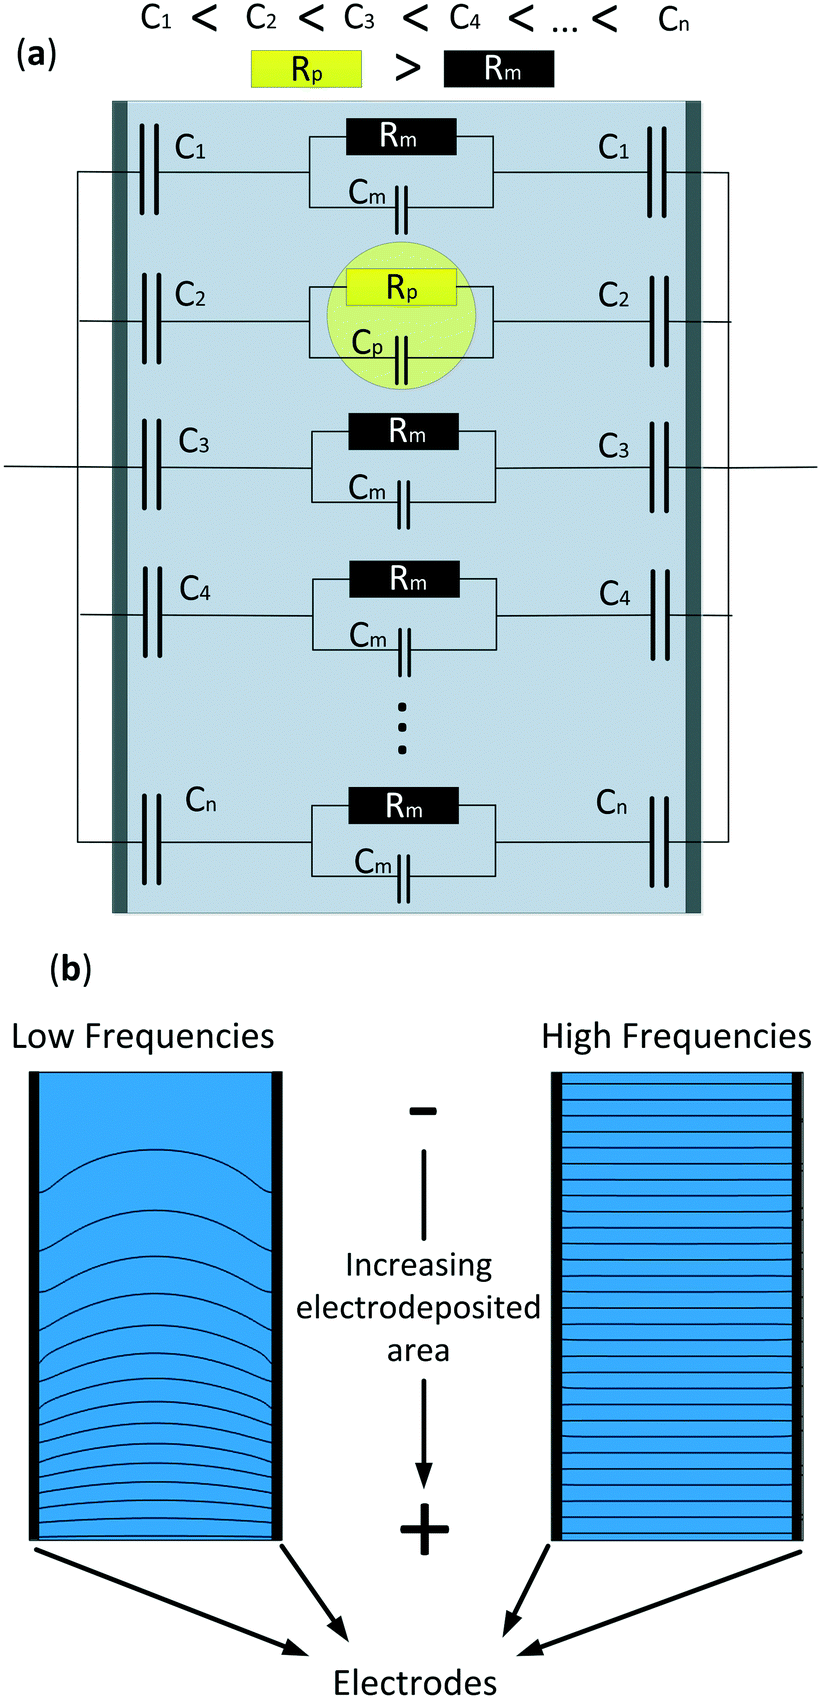 | ||
| Fig. 1 (a) Simplified electrical equivalent circuit of a parallel electrode array with an increasing electrodeposited area at both electrodes and a particle placed in the cell. (b) Current density simulation of a two platinum electrodes with an increasing electrodeposited area at lower and higher frequencies. | ||
2 Experimental setup
A 3-D FEM simulation was performed using the electrochemistry package of Comsol Multiphysics. A microfluidic glass-SU-8-glass chip was developed using standard photo-lithographic techniques, Fig. S1.† The parallel electrodes were fabricated by patterning a photoresist, wet etching 140 nm and sputtering 10 nm of tantalum, as an adhesion layer, and 130 nm of gold on both wafers, and lifting-off the resist. Thereafter, another positive photoresist pattern was applied to uncover specific areas on the electrodes, those to be electrodeposited, which decreased in size along the x-direction (Fig. 2). These areas were thereafter cleaned, performing cyclic voltammetry from −500 to 800 mV with a scan rate of 10 mV s−1, using a Ag/AgCl reference electrode and 0.1 M H2SO4 solution, Fig. S2.† Subsequently, the exposed areas were electrodeposited with a 2.4 mM chloroplatinic acid (H2PtCl4) and 0.8 mM lead acetate (Pb(C2H3O2)2) solution. The electrodeposition was performed in an ultrasonic bath45 using a platinum sputtered 10 cm in diameter wafer as a counter electrode, a Ag/AgCl electrode as a reference and applying 50 cycles of pulses consisting of 6 seconds at 500 mV followed by 0.5 seconds at −100 mV. Fig. 2a presents a gold electrode after electrodeposition showing an increasing electrodeposited area which causes a gradient in the electric field along the x-direction. Fig. 2b presents scanning electron microscopy (SEM) images of the electrodeposited electrode showing the typical cauliflower shape of platinum black.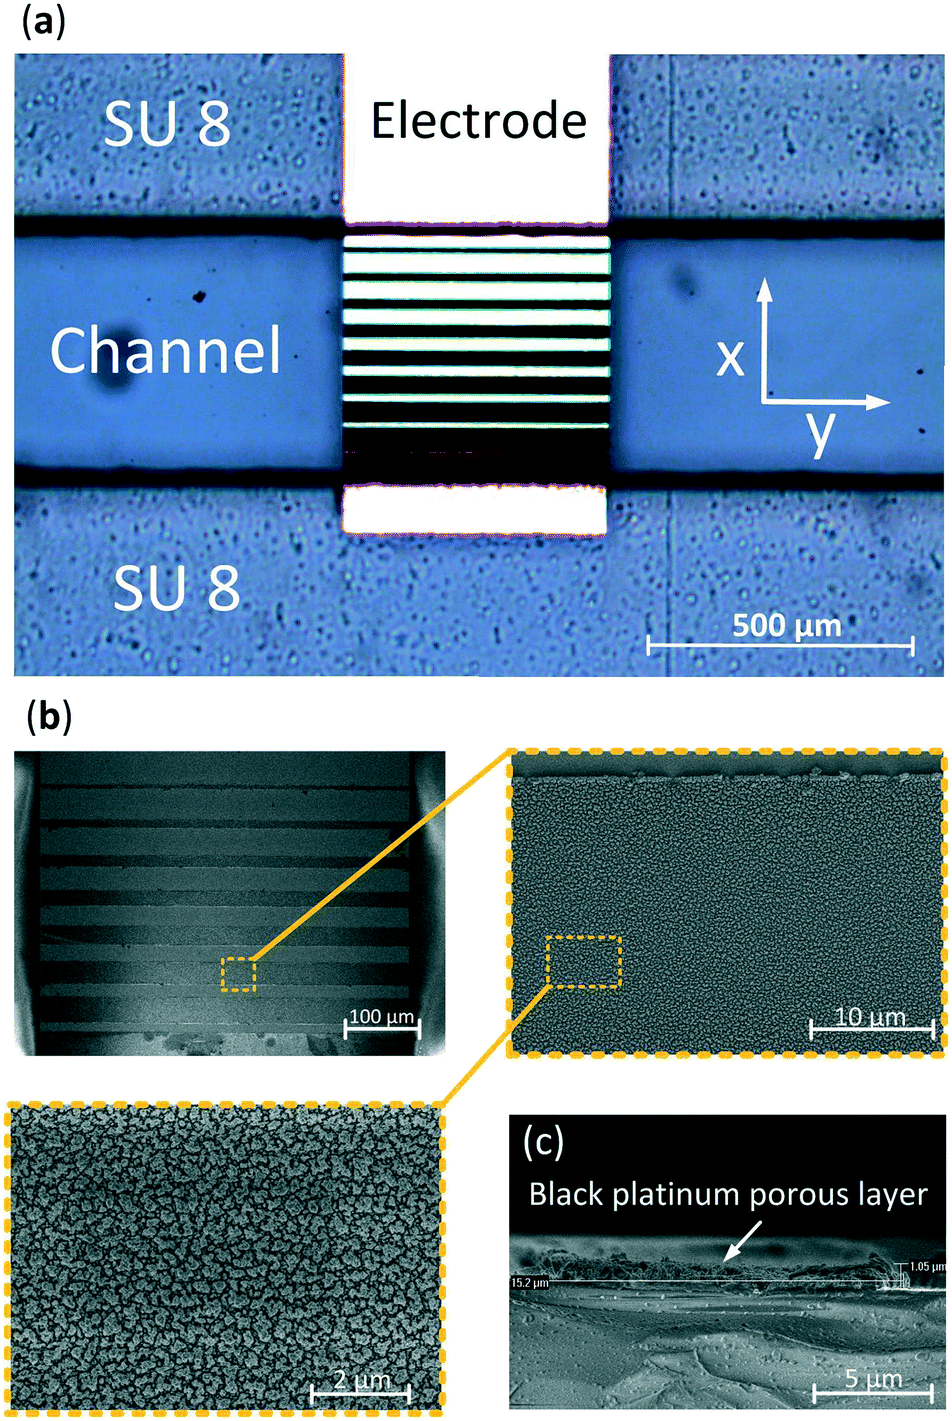 | ||
| Fig. 2 (a) Optical image of a microfluidic channel with a gold electrode that has an increasing area from bottom to top electrodeposited with platinum black. (b) Scanning electron microscopy (SEM) images of the electrodeposited areas and (c) the thickness of the platinum black layer. | ||
To determine the thickness of the electrodeposited layer, a cross section of the SEM image was made, Fig. 2c, showing a thickness of 1 μm which is less than 0.5% of the total height (z-direction) of the channel. In order to bond the 2 wafers, 2 layers of SU-8 were used. First a 180 μm followed by a 35 μm SU-8 thick layer were spun on top of each other in order to decrease the roughness of the SU-8 layer and, therefore, accomplish a better and more homogeneous bonding. Both wafers were manually aligned and consequently bonded by applying a pressure of 4000 N at 120 °C.
A Micronit sideconnect chip-holder was used to perform the experiments, Fig. S3.† The impedance of the system was measured using a Zurich Instruments HF2IS potentiostat with an HF2TA amplifier. The particles were observed and recorded using a high speed camera Grasshopper 3 and flow-focused in the chip using 2 Harvard microfluidic pumps. The electrolyte conductivity was measured with a Mettler Toledo conductivity meter. Polystyrene beads 83 μm in diameter were purchased from Microspheres-Nanospheres and their sizes were measured with Leica DM6000M microscope LAS V4.12 software.
3 Results and discussion
3.1 FEM simulation
Fig. 3a shows the design of the electrochemical cell where the gradient (x-direction) is perpendicular to the channel flow (y-direction). Both side walls are made of SU-8. Top and bottom glass layers are not shown but taken into account in the simulation. To simulate the system, 4 fitting parameters were experimentally measured: the double layer capacitance, the electrolyte conductivity, the microfluidic channel dimensions (see Fig. S4†) and the polystyrene particle size. The double layer capacitance of the system was obtained by measuring the impedance at very low frequencies (10 Hz), knowing the high and low capacitance areas and that, at this frequency, the impedance of the system is governed by the double layer capacitance of the electrodes. This resulted in 770 μF cm−2 for the electrodeposited areas and 36 μF cm−2 for the plane electrode areas. The conductivity of the electrolyte was measured and set at 1.06 S m−1, the microfluidic channel dimensions were 219 μm in height and 477 μm wide, Fig. S4,† and the average particle's diameter was 83 μm (see Fig. S5†). Fig. 3b shows three simulated Bode plots of the system with three different electrolyte conductivities, 0.1, 1 and 10 S m−1 where the typical impedance can be seen, dominated by the double layer capacitance at lower frequencies (<10 Hz) and by the electrolyte resistivity at higher frequencies (>10![[thin space (1/6-em)]](https://www.rsc.org/images/entities/char_2009.gif) 000 Hz).
000 Hz).
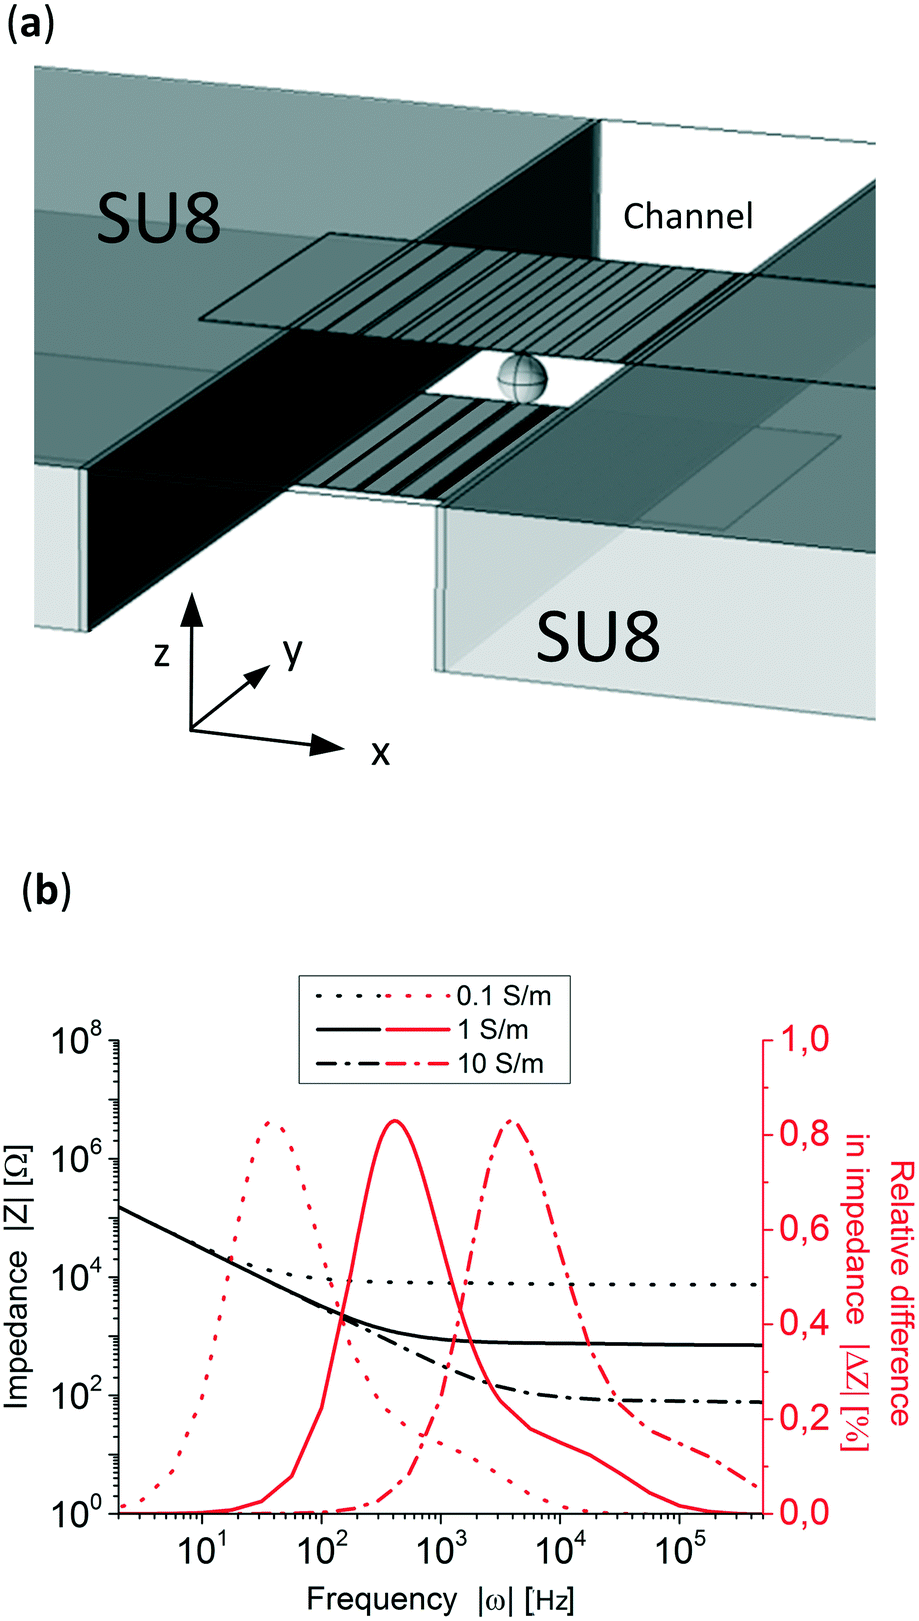 | ||
| Fig. 3 (a) Schematic of the FEM design used to simulate the increasing electrodeposited area system. On both sides 2 layers of SU-8 are simulated and 2 layers of glass at the top and bottom of the channel are simulated but not shown. (b) Three simulated Bode plots and difference in relative impedance with conductivities of 0.1, 1 and 10 S m−1 of two polystyrene particles 83 μm in diameter at the top and bottom positions in the x-direction in the microfluidic channel. | ||
In order to know in which frequency range the particle position has the largest difference in relative impedance due to their position three Bode plots with a particle at two extreme x-positions in the channel, x = 50 μm and x = 440 μm, were simulated. Fig. 3b presents the difference in impedance over the total impedance of the system without a particle, see eqn (S1) in the ESI,† for both positions showing peaks close to their respective RC (resistance–capacitance) time constant frequency. To know the impedance dependence on the particle's position, the simulated particle was placed at 40 different x-direction positions and the impedance was simulated at 800 Hz and 100 kHz, low and high frequencies, respectively. The z and y-positions, see Fig. 3a, remained constant at the middle of the channel and electrodes. Fig. 4a shows that at 800 Hz, the impedance of the system is dependent on the particles' position in the x-direction. On other hand, as can be seen in Fig. 4b, at 100 kHz the total impedance of the system becomes independent of the position of the particle, as expected from Fig. 3b. It is worth mentioning that 100 kHz was arbitrarily chosen as the high frequency but any other frequency higher and far from the position detection frequency could be used.
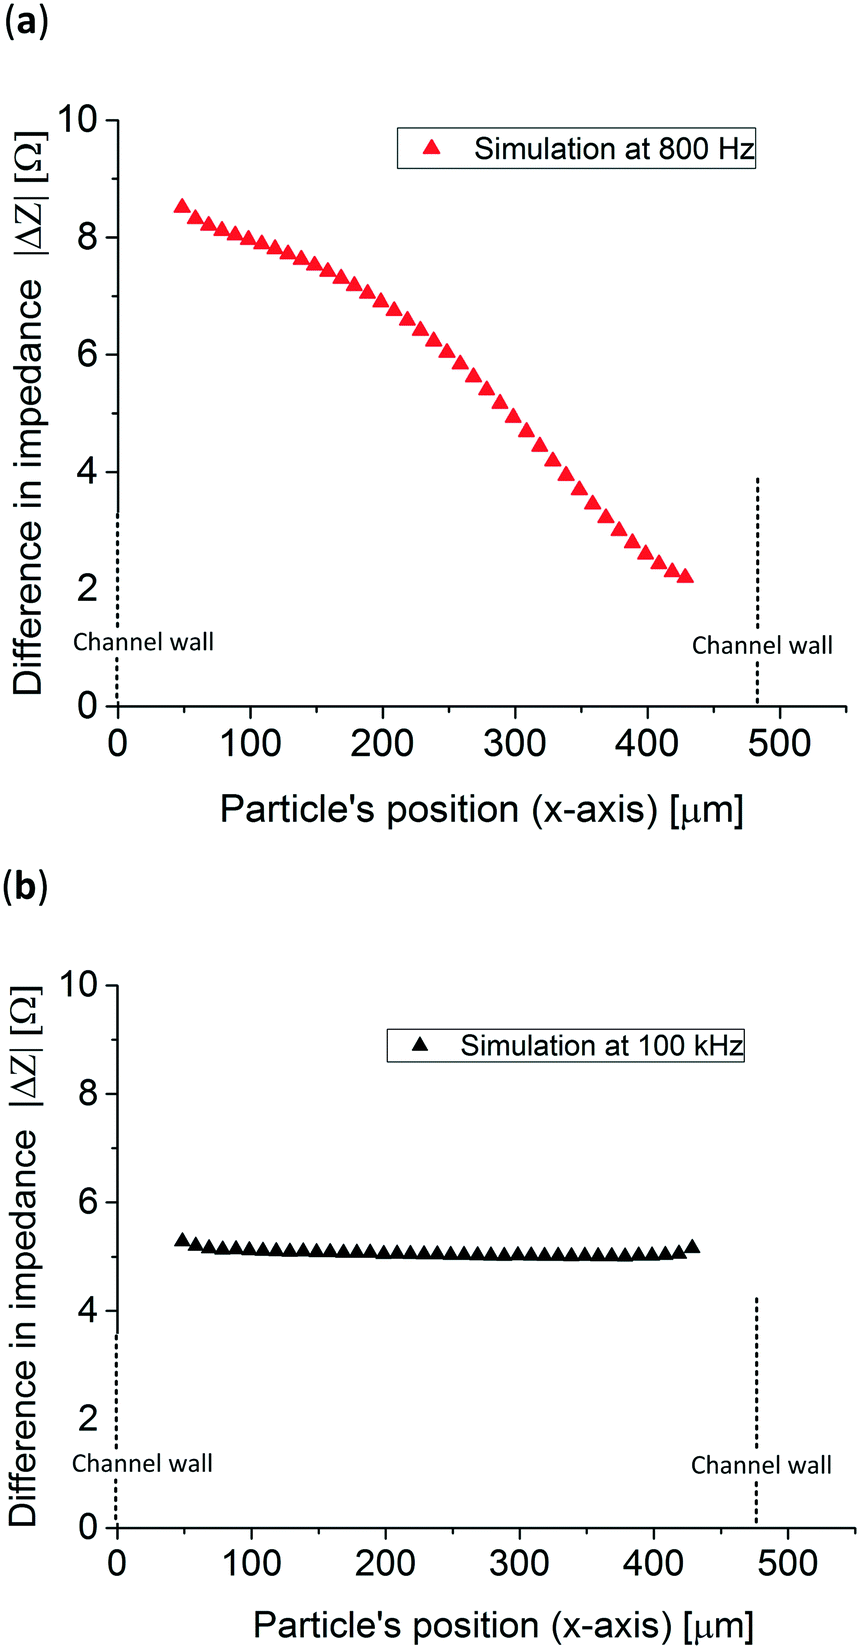 | ||
| Fig. 4 Simulated impedance difference of 83 μm in diameter polystyrene particles at both (a) 800 Hz and (b) 100 kHz throughout the whole electrochemical cell (x-direction). | ||
3.2 Experimental validation
Fig. 5 shows the typical data obtained at 800 Hz of 2 polystyrene particles passing at 2 different positions, top and bottom, in the microfluidic chip using an electrolyte conductivity of 1.06 S m−1. The peak heights and width of the signal are related to the position and velocity of the particle, respectively. The impedance sample rate was high and particle throughput was low enough to ensure maximum impedance.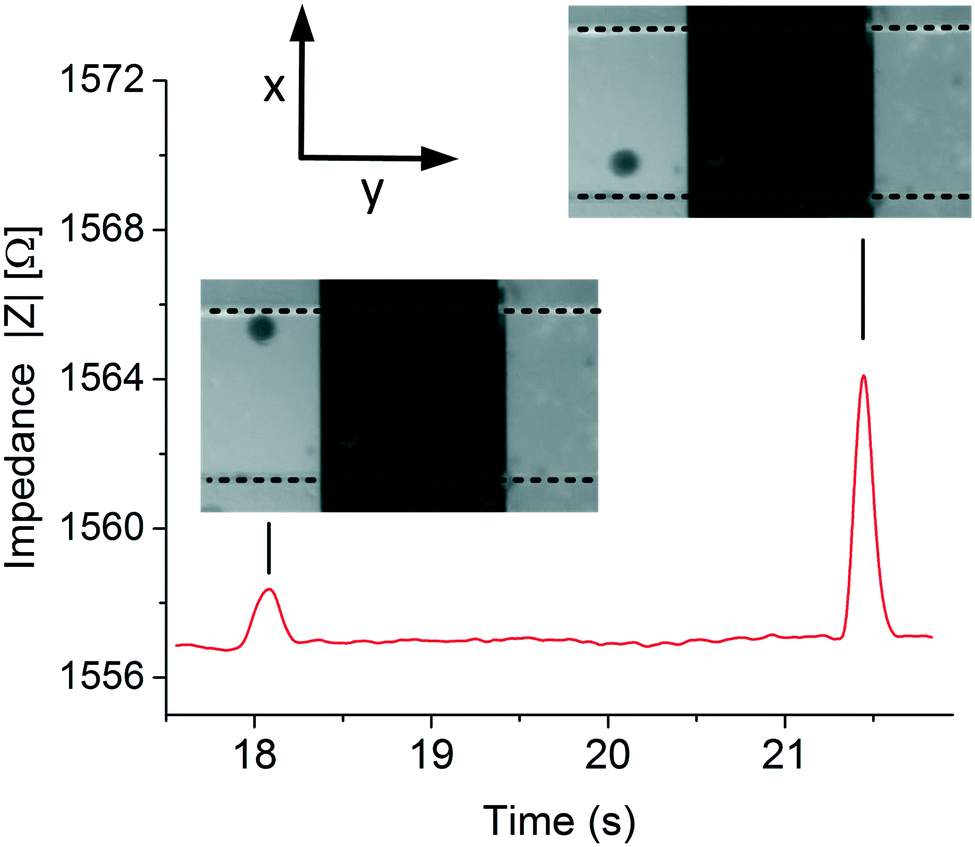 | ||
| Fig. 5 Typical experimental data. Images from a video and impedance recorded obtained when measuring the position of the particles at low frequencies, 800 Hz. | ||
Fig. 6 presents the measured impedance difference of polystyrene particles at various positions optically determined in the x-direction in the microfluidic channel at both frequencies. Also, for comparison purposes, the simulation previously shown is presented. At both frequencies the experimental and simulated data are similar, experimentally demonstrating that the particle's position can be tracked at low frequencies while at higher frequencies the conductivity of the system can still be measured. However, when comparing both simulated and experimental data at higher frequencies, 100 kHz, an approximately 2 Ω difference in absolute impedance is observed which is 0.2% of the total impedance measured. Also, the experimental data show a 2 Ω spread in impedance difference which could be caused by the broad size distribution of the polystyrene particles resulting in a coefficient of variation of 0.3. To prove this, 5 simulations with 5 different particle sizes, taken from Fig. S5,† at high frequencies were performed showing impedance differences up to ⋍3 Ω, Table S1.† Moreover, particles flowing in different positions in the z-direction, which were not tracked in this study, can account for up to ⋍0.2 Ω, Fig. S6.† The error of the experimental data was calculated by measuring the average distance to a linear trend line of the experimental data and it resulted in 56.86 μm, see Fig. S7.† This resulted in 8 different positions that can be tracked without overlapping data which is comparable to the work of Wang et al.,40 where the authors were able to distinguish between 5 positions in a 188 μm wide channel using 6 and 11 μm in diameter particles. The method presented in this work can determine both the position and the conductivity of the system, however it also requires an extra fabrication step compared to other studies.33,34,40 Other similar studies determined the position of the particle in the z-direction (height of the channel), where the analytical derivation fitted the experimental data along all the z-axes between the electrodes.
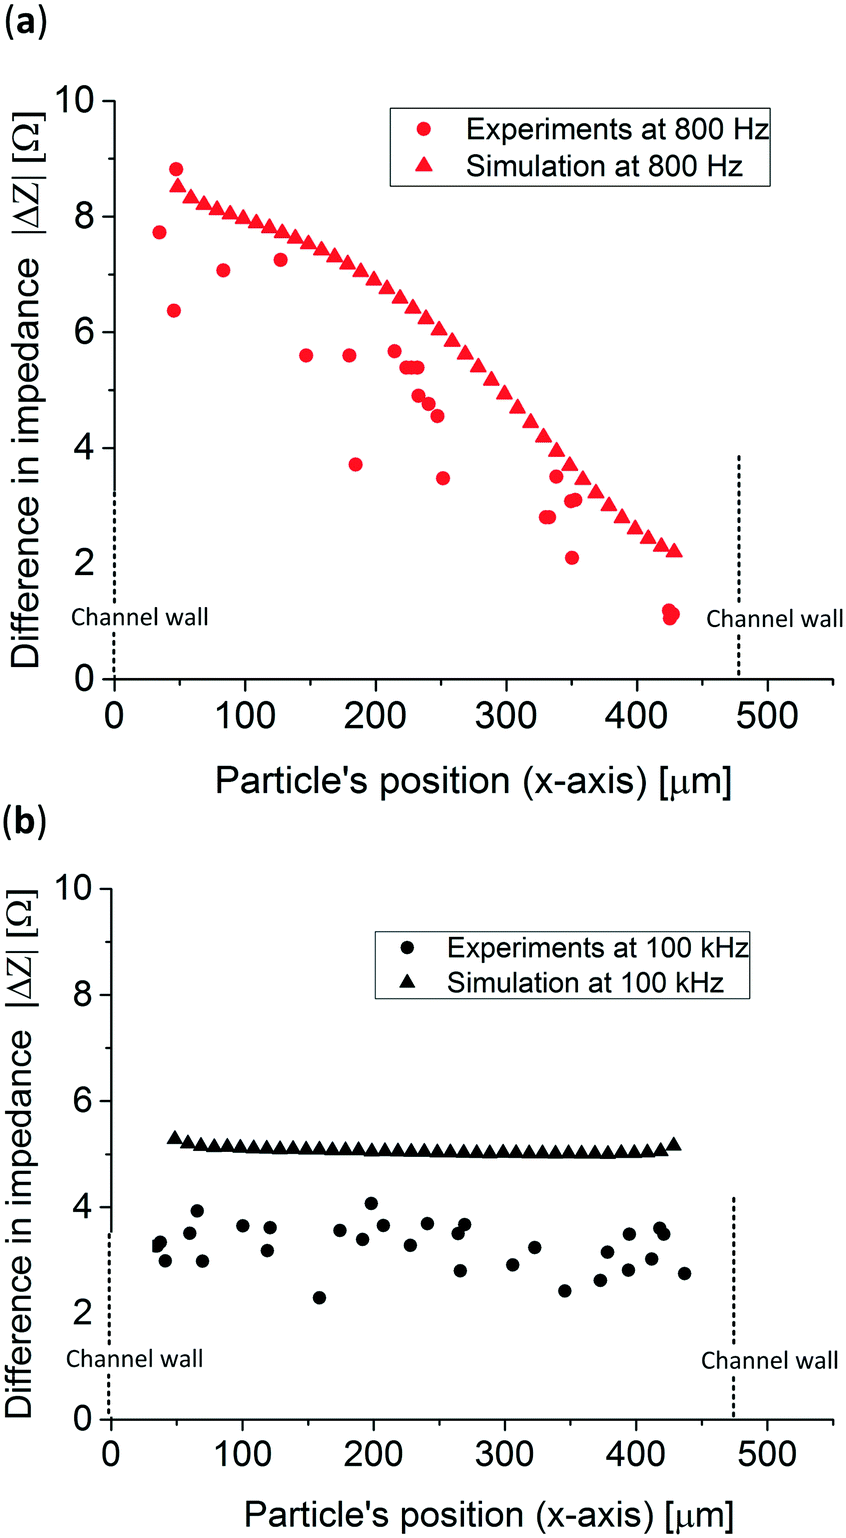 | ||
| Fig. 6 Experimental results and simulation of the impedance difference obtained from 83 μm polystyrene particles at (a) 800 Hz and (b) 100 kHz. | ||
In order to use the gradient in the electric field for cell position detection, the system should be scaled down. In addition, the detection accuracy could be enhanced by measuring the conductivity, which would allow correction of the position detection due to differences in height (z-direction) and size of the cell. It is worth mentioning that the high frequency to measure the conductivity of the system for the correction of the position should be low enough to avoid current flow through the cell, which would disrupt the correction itself.
4 Conclusions and outlook
In conclusion, we report a new method to track particles in microfluidic devices by using a gradient in the electric field at low frequencies (⋍800 Hz) and measure the conductivity of the system at higher frequencies (⋍100 kHz). 80 μm polystyrene particles were optically tracked and correlated to their impedance difference. The experimental results and the FEM at low and high frequencies are similar however the experimental data show a spread of 2 Ω resulting in a coefficient of variation of ⋍0.3. We believe that this technique could be extended to develop a 3-D tracker to detect the position of cells/particles and measure their conductivity at high throughput.Conflicts of interest
The authors declare no conflicts of interest.Acknowledgements
This work was supported by the Netherlands Centre for Multiscale Catalytic Energy Conversion (MCEC), an NWO Gravitation programme funded by the Ministry of Education, Culture and Science of the government of the Netherlands.References
- A. M. Klein, L. Mazutis, I. Akartuna, N. Tallapragada, A. Veres, V. Li, L. Peshkin, D. A. Weitz and M. W. Kirschner, Cell, 2015, 161, 1187–1201 CrossRef CAS PubMed.
- V. Sanchez-Freire, A. D. Ebert, T. Kalisky, S. R. Quake and J. C. Wu, Nat. Protoc., 2012, 7, 829–838 CrossRef CAS PubMed.
- J. S. Marcus, W. F. Anderson and S. R. Quake, Anal. Chem., 2006, 78, 3084–3089 CrossRef CAS PubMed.
- B. de Wagenaar, D. J. Geijs, H. de Boer, J. G. Bomer, W. Olthuis, A. van den Berg and L. I. Segerink, Fertil. Steril., 2016, 106, 773–780 CrossRef PubMed.
- N. Nivedita, P. Ligrani and I. Papautsky, Sci. Rep., 2017, 7, 1–10 CrossRef PubMed.
- T. Morijiri, S. Sunahiro, M. Senaha, M. Yamada and M. Seki, Microfluid. Nanofluid., 2011, 11, 105–110 CrossRef.
- H. Amini, W. Lee and D. Di Carlo, Lab Chip, 2014, 14, 2739–2761 RSC.
- A. A. S. Bhagat, S. S. Kuntaegowdanahalli and I. Papautsky, Lab Chip, 2008, 8, 1906–1914 RSC.
- N. Pamme and A. Manz, Anal. Chem., 2004, 76, 7250–7256 CrossRef CAS PubMed.
- E. P. Furlani, J. Appl. Phys., 2006, 99, 1–35 CrossRef.
- M. Solsona, A.-E. Nieuwelink, F. Meirer, L. Abelmann, M. Odijk, W. Olthuis, B. M. Weckhuysen and A. van den Berg, Angew. Chem., Int. Ed., 2018, 57, 10589–10594 CrossRef CAS PubMed.
- S. Fiedler, S. G. Shirley and T. Schnelle, Science, 1998, 70, 1909–1915 CAS.
- A. Valero, T. Braschler, N. Demierre and P. Renaud, Biomicrofluidics, 2010, 4, 1–9 CrossRef PubMed.
- P. Li, Z. Mao, Z. Peng, L. Zhou, Y. Chen, P.-H. Huang, C. I. Truica, J. J. Drabick, W. S. El-Deiry, M. Dao, S. Suresh and T. J. Huang, Proc. Natl. Acad. Sci. U. S. A., 2015, 112, 4970–4975 CrossRef CAS PubMed.
- J. Shi, H. Huang, Z. Stratton, Y. Huang and T. J. Huang, Lab Chip, 2009, 9, 3354–3359 RSC.
- S. Gawad, K. Cheung, U. Seger, A. Bertsch and P. Renaud, Lab Chip, 2004, 4, 241–251 RSC.
- G. Mernier, E. Duqi and P. Renaud, Lab Chip, 2012, 12, 4344–4349 RSC.
- J. S. McGrath, C. Honrado, D. Spencer, B. Horton, H. L. Bridle and H. Morgan, Sci. Rep., 2017, 7, 1–11 CrossRef CAS PubMed.
- M. Xavier, M. C. De Andrés, D. Spencer, R. O. C. Oreffo and H. Morgan, J. R. Soc., Interface, 2017, 14, 20170233 CrossRef PubMed.
- Y. Zhao, K. Wang, D. Chen, B. Fan, Y. Xu, Y. Ye, J. Wang, J. Chen and C. Huang, Biosens. Bioelectron., 2018, 111, 138–143 CrossRef CAS PubMed.
- S. C. Bürgel, C. Escobedo, N. Haandbæk and A. Hierlemann, Sens. Actuators, B, 2015, 210, 82–90 CrossRef.
- B. De Wagenaar, S. Dekker, H. L. De Boer, J. G. Bomer, W. Olthuis, A. Van Den Berg and L. I. Segerink, Lab Chip, 2016, 16, 1514–1522 RSC.
- L. I. Segerink, A. J. Sprenkels, P. M. Ter Braak, I. Vermes and A. Van Den Berg, Lab Chip, 2010, 10, 1018–1024 RSC.
- J. C. Chien, A. Ameri, E. C. Yeh, A. N. Killilea, M. Anwar and A. M. Niknejad, Lab Chip, 2018, 18, 2065–2076 RSC.
- J. Chung, Y. Chen and S. J. Kim, Sens. Actuators, B, 2018, 266, 106–114 CrossRef CAS.
- N. Manaresi, A. Romani, G. Medoro, L. Altomare, A. Leonardi, M. Tartagni and R. Guerrieri, IEEE J. Solid-State Circuits, 2003, 38, 2297–2305 CrossRef.
- K. Mohammad, D. A. Buchanan, K. Braasch, M. Butler and D. J. Thomson, Sens. Actuators, B, 2017, 249, 246–255 CrossRef CAS.
- Y. Chen, C. C. Wong, T. S. Pui, R. Nadipalli, R. Weerasekera, J. Chandran, H. Yu and A. R. A. Rahman, Sens. Actuators, B, 2012, 173, 903–907 CrossRef CAS.
- A. Y. Chang and M. S. Lu, Biosens. Bioelectron., 2013, 45, 6–12 CrossRef CAS PubMed.
- D. Spencer and H. Morgan, Lab Chip, 2011, 11, 1234 RSC.
- L. Spielman and S. L. Goren, J. Colloid Interface Sci., 1968, 26, 175–182 CrossRef.
- J. Zhao and Z. You, J. Micromech. Microeng., 2015, 25, 125006 CrossRef.
- F. Caselli, A. De Ninno, R. Reale, L. Businaro and P. Bisegna, Sens. Actuators, B, 2018, 256, 580–589 CrossRef CAS.
- D. Spencer, F. Caselli, P. Bisegna and H. Morgan, Lab Chip, 2016, 16, 2467–2473 RSC.
- B. Brazey, J. Cottet, A. Bolopion, H. Van Lintel, P. Renaud and M. Gauthier, Lab Chip, 2018, 18, 818–831 RSC.
- S. Y. Yoon and K. C. Kim, Meas. Sci. Technol., 2006, 17, 2897–2905 CrossRef CAS.
- Y. Fang, N. Yu, Y. Jiang and C. Dang, Micromachines, 2018, 9, 1–13 Search PubMed.
- D. Vercruysse, A. Dusa, R. Stahl, G. Vanmeerbeeck, K. De Wijs, C. Liu, D. Prodanov, P. Peumans and L. Lagae, Lab Chip, 2015, 15, 1123–1132 RSC.
- M. H. Winer, A. Ahmadi and K. C. Cheung, Lab Chip, 2014, 14, 1443–1451 RSC.
- H. Wang, N. Sobahi and A. Han, Lab Chip, 2017, 17, 1264–1269 RSC.
- A. De Ninno, V. Errico, F. R. Bertani, L. Businaro, P. Bisegna and F. Caselli, Lab Chip, 2017, 17, 1158–1166 RSC.
- V. Errico, A. D. Ninno, F. R. Bertani, L. Businaro, P. Bisegna and F. Caselli, Sens. Actuators, B, 2017, 247, 580–586 CrossRef CAS.
- R. Reale, A. De Ninno, L. Businaro, P. Bisegna and F. Caselli, Microfluid. Nanofluid., 2018, 22, 1–13 CrossRef CAS.
- M. Solsona, W. Olthuis and A. Van Den Berg, Procedia Eng., 2016, 168, 1446–1449 CrossRef CAS.
- S. A. Desai, J. D. Rolston, L. Guo and S. M. Potter, Front. Neuroeng., 2010, 3, 1–11 Search PubMed.
Footnotes |
| † Electronic supplementary information (ESI) available. See DOI: 10.1039/c8lc01333k |
| ‡ Contributed equally to this work. |
| This journal is © The Royal Society of Chemistry 2019 |