
 Open Access Article
 This Open Access Article is licensed under a Creative Commons Attribution-Non Commercial 3.0 Unported Licence
Development of a multicellular pancreatic tumor microenvironment system using patient-derived tumor cells†
Daniel
Gioeli
 *acd,
Chelsi J.
Snow
d,
Michael B.
Simmers
d,
Stephen A.
Hoang
d,
Robert A.
Figler
d,
J. Ashe
Allende
a,
Devin G.
Roller
a,
J. Thomas
Parsons
ac,
Julia D.
Wulfkuhle
e,
Emanuel F.
Petricoin
e,
Todd W.
Bauer
bc and
Brian R.
Wamhoff
*d
*acd,
Chelsi J.
Snow
d,
Michael B.
Simmers
d,
Stephen A.
Hoang
d,
Robert A.
Figler
d,
J. Ashe
Allende
a,
Devin G.
Roller
a,
J. Thomas
Parsons
ac,
Julia D.
Wulfkuhle
e,
Emanuel F.
Petricoin
e,
Todd W.
Bauer
bc and
Brian R.
Wamhoff
*d
aDepartments of Microbiology, Immunology, and Cancer Biology, Virginia, USA. E-mail: dgg3f@virginia.edu
bDepartment of Surgery, Virginia, USA
cCancer Center Member, University of Virginia, Charlottesville, Virginia, USA
dHemoShear Therapeutics, Charlottesville, Virginia, USA. E-mail: wamhoff@hemoshear.com
eCenter for Applied Proteomics and Molecular Medicine, George Mason University, Manassas, Virginia, USA
First published on 6th March 2019
Abstract
The development of drugs to treat cancer is hampered by the inefficiency of translating pre-clinical in vitro monoculture and mouse studies into clinical benefit. There is a critical need to improve the accuracy of evaluating pre-clinical drug efficacy through the development of more physiologically relevant models. In this study, a human triculture 3D in vitro tumor microenvironment system (TMES) was engineered to accurately mimic the tumor microenvironment. The TMES recapitulates tumor hemodynamics and biological transport with co-cultured human microvascular endothelial cells, pancreatic ductal adenocarcinoma, and pancreatic stellate cells. We demonstrate that significant tumor cell transcriptomic changes occur in the TMES that correlate with the in vivo xenograft and patient transcriptome. Treatment with therapeutically relevant doses of chemotherapeutics yields responses paralleling the patients' clinical responses. Thus, this model provides a unique platform to rigorously evaluate novel therapies and is amenable to using patient tumor material directly, with applicability for patient avatars.
Introduction
Cancer remains a leading cause of death, despite enormous efforts to find cures. One of the significant challenges in cancer therapy is the development and application of models that recapitulate in vivo biology and are predictive of clinical outcomes. Traditional in vitro systems do not accurately predict efficacy or safety of anticancer therapies in humans.1 Retrospectively, this is unsurprising given the difference between the environment of cancer cells grown in 2-dimensional space and those within the complex tumor microenvironment. New in vitro models are being developed to address the deficiencies in current systems, including spheroids, organoids, organotypic tumor models, and novel ex vivo systems, all of which have significant promise. However, as with all model systems, there are limitations; these systems do not capture the full complement of tumor biology, including vascular hemodynamics or shear forces and transport.In vivo mouse xenograft systems remain the gold standard for pre-clinical studies. However, in vivo xenografts from long-cultured tumor cell lines have significant limitations and historically have a poor correlation with human clinical outcomes.2 New models of patient-derived xenografts (PDXs) may have predictive value, having shown some success in predicting the clinical response of drugs in development.3 PDXs preserve the histopathology, tumor heterogeneity, gene expression, and genetic mutant tumor drivers.4,5 However, PDXs have significant limitations, including the time and cost to generate, as well as low tumor take rates and the selection for the most aggressive tumor subtypes.6 Recently, it has also been shown that PDXs can undergo significant selection of preexisting subclones driven by the mouse microenvironment.7
3D in vitro systems for cancer, derived from murine or human-induced pluripotent stem cells (iPSCs) and patient tumors, have been used for drug screens and to effectively identify molecular pathways involved in disease progression.8,9 3D spheroids are the most widely used 3D culture system, and have been used as a preclinical cancer therapy screening tool. While these systems have clear advantages over standard 2D static tissue culture, these models do have limitations, including the lack of vascular systems that regulate oxygenation, as well as nutrient and waste removal.10 Some 3D systems use microvessel fabrication to generate a vascular system using either a predefined ECM scaffold or enabling microvessel self-assembly.11 These systems often have restricted vessel size and random vessel networks, creating disordered and non-physiologic flow.
Ex vivo explant systems preserve the tumor microenvironment by histologic analysis.9,12 However, the explants survive only for a few days and the most sophisticated ex vivo systems require autologous and exogenous serum and growth factor supplementation. Recent results with patient explants are encouraging and indicate that the responses may reflect responses in the clinical setting.13 These ex vivo systems improve retention of the cancer tumor microenvironment; however, they still lack integration of vascular shear stress and biological transport, which have been shown to be critical elements for preclinical models of tissue and organ behavior.14,15
Herein we describe the development and validation of a novel tumor microenvironment system (TMES). We have developed a multi-cellular 3D in vitro system for pancreatic ductal adenocarcinoma (PDAC). This system combines microvascular endothelial cells exposed to tumor capillary hemodynamics, stromal cells, and low passage, patient-derived PDAC cells. We demonstrate through transcriptomic analysis that PDAC cells in the TMES are similar to the in vivo xenograft transcriptome and the patient transcriptional program. Previous work indicated that the FAK inhibitor, PF-562271, distinguished between the 2D and in vivo PDX states; PF-562271 inhibited growth only in in vivo xenografts and not in 2D in vitro PDAC cultures. Here we show that PF-562271 effectively inhibited PDAC growth in the TMES indicating in vivo-like drug responses. Additionally, PDAC tumor cells from patients were inhibited by a human therapeutically relevant dose of gemcitabine to levels paralleling the patients' clinical responses. Finally, we demonstrate that protein–protein interaction networks representing differential expression states between the patient tumor and the TMES are more similar than the networks between the patient tumor and either PDXs or 2D cultures. In sum, the TMES provides a unique platform to rigorously test the contributions of the cellular and molecular components of the TMES to therapeutic responses.
Results
We applied a technology that recapitulates in vivo-like hemodynamics and transport of a multicellular microenvironment in an in vitro system15,16 to the development of an in vitro tumor microenvironment system (TMES). As shown in Fig. 1A, primary human microvascular endothelial cells were plated above a synthetic membrane and primary pancreatic stellate cells and PDAC cells were co-plated below the membrane. Physiological hemodynamics derived from tumor sinusoidal flow rates were applied to the endothelial cells (ECs) through a cone- and -plate viscometer while medium was continuously and independently perfused on the upper and lower sides of the membrane. The shear stress and flow used in the TMES induce significant changes in endothelial cell morphology, orientation in the direction of the shear forces, and upregulation of flow responsive genes.16 This is illustrated in Fig. 2. In this study, four waveforms were tested: 1) constant shear of 2 dyne per cm2 found in many microfluidic models, 2) tumor terminal arteriole derived from Doppler ultrasound of a solid tumor,17,18 3) common carotid artery, and 4) internal carotid sinus. ECs elongated in the direction of shear stress with the tumor terminal arteriole and common carotid artery waveforms. Elongation was quantified by shape factor (SF), which is often referred to as circularity and is a tool to quantify endothelial cell elongation.19 There were no significant differences between the static, constant shear stress, or the internal carotid sinus conditions. The differences between the common carotid artery and internal carotid sinus waveforms indicate that the system is able to reproduce the same changes in EC morphology previously observed.16 The significant difference between the SF from the terminal arteriole and the constant 2 dyne per cm2 conditions suggests that the terminal arteriole waveform improves upon microfluidic models that lack high, pulsatile shear stress.20–22 The pulsatile shear stress can vary in different regions of a tumor, particularly when comparing the periphery to the central region.17,23 We chose the shear stress waveform representing a tumor terminal arteriole since the vascularity represented by color Doppler US signals of the tumor terminal arteriole waveform and histologic specimens correlate well.17,18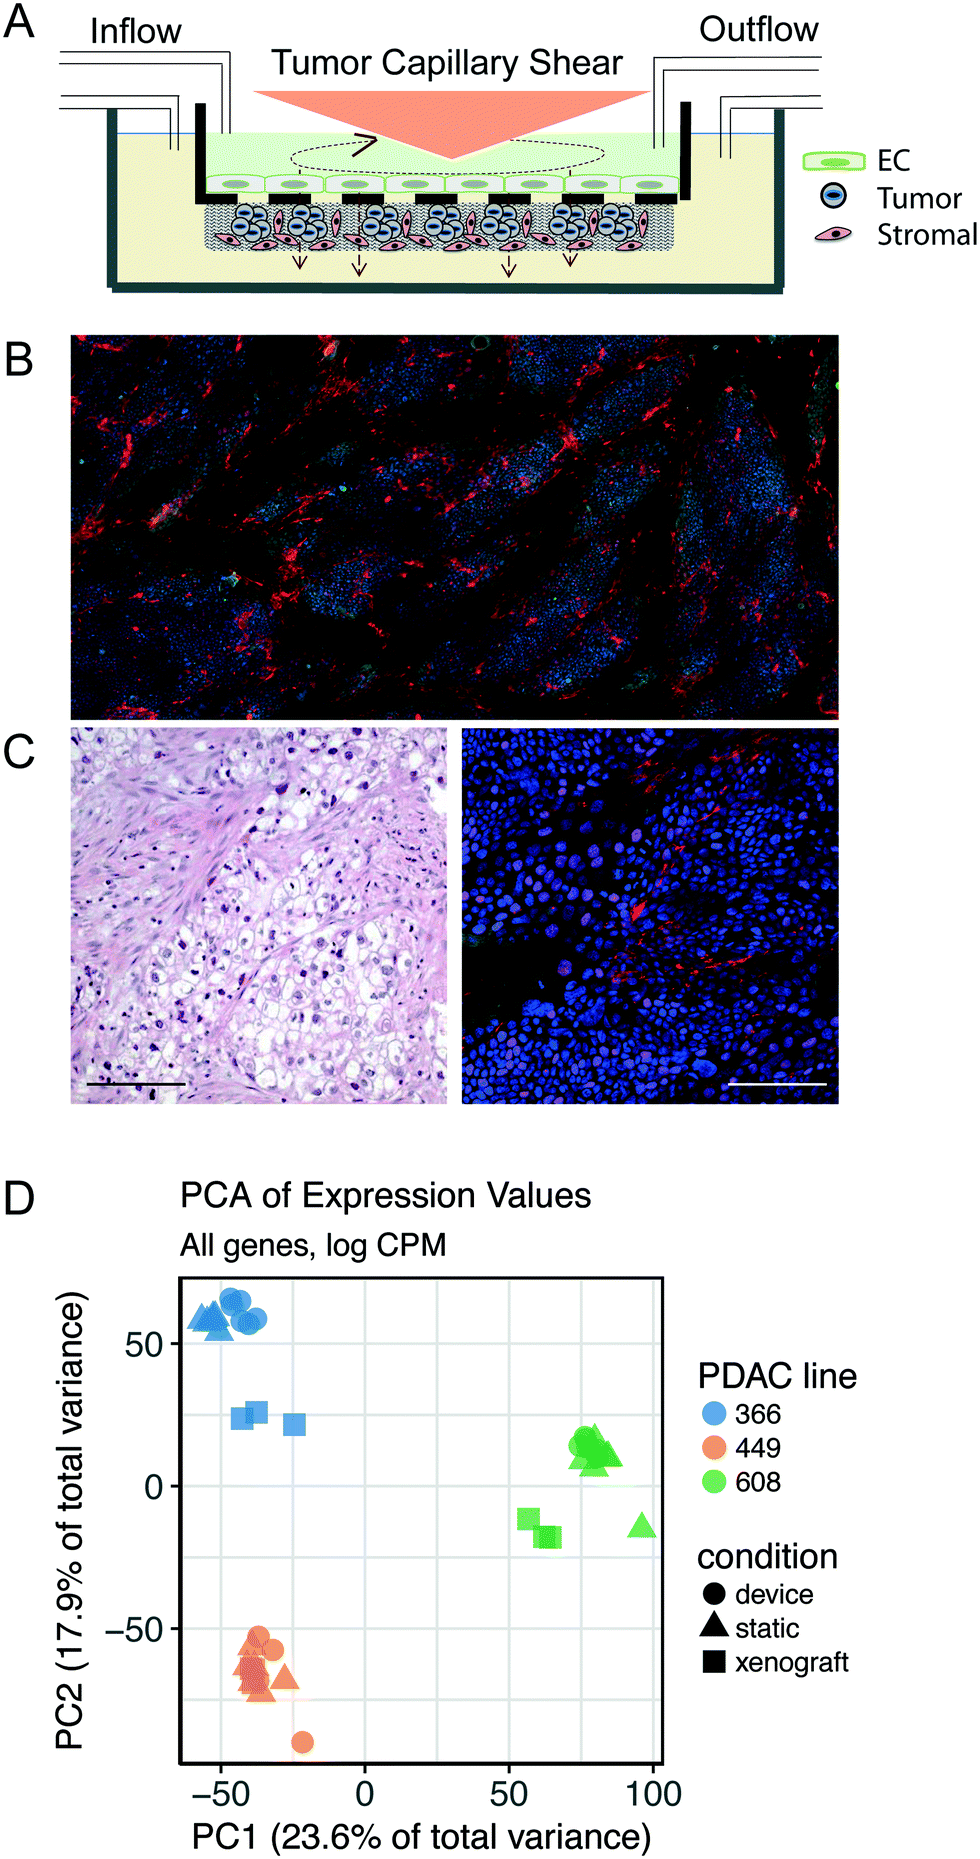 | ||
| Fig. 1 Development of an in vitro tumor microenvironment system (TMES) to mimic human in vivo tumor biology. (A) Schematic of TMES. Endothelial cells are plated above the transwell and pancreatic stellate cells and pancreatic ductal adenocarcinoma cells are plated below the transwell. Tumor-derived hemodynamic force is applied above the transwell to the endothelial cells through rotation of the cone. The upper and lower chambers are independently perfused with media to recapitulate interstitial flow. (B) PDX PDAC 366 cells (green; anti-cytokeratin 18) were grown in the TMES for 7 days with pancreatic stellate cells (red; anti-fibroblast), nuclei stained with DAPI. 4× composite image. (C) Left panel is IHC of PDAC 366 clinical sample, right panel is immunofluorescence stained as in (B) of PDAC 366. 20× images. Scale bar 100 microns. (D) Principal component analysis of RNAseq data from pancreatic tumor cells grown in the TMES, xenografts, and static 2D cultures. | ||
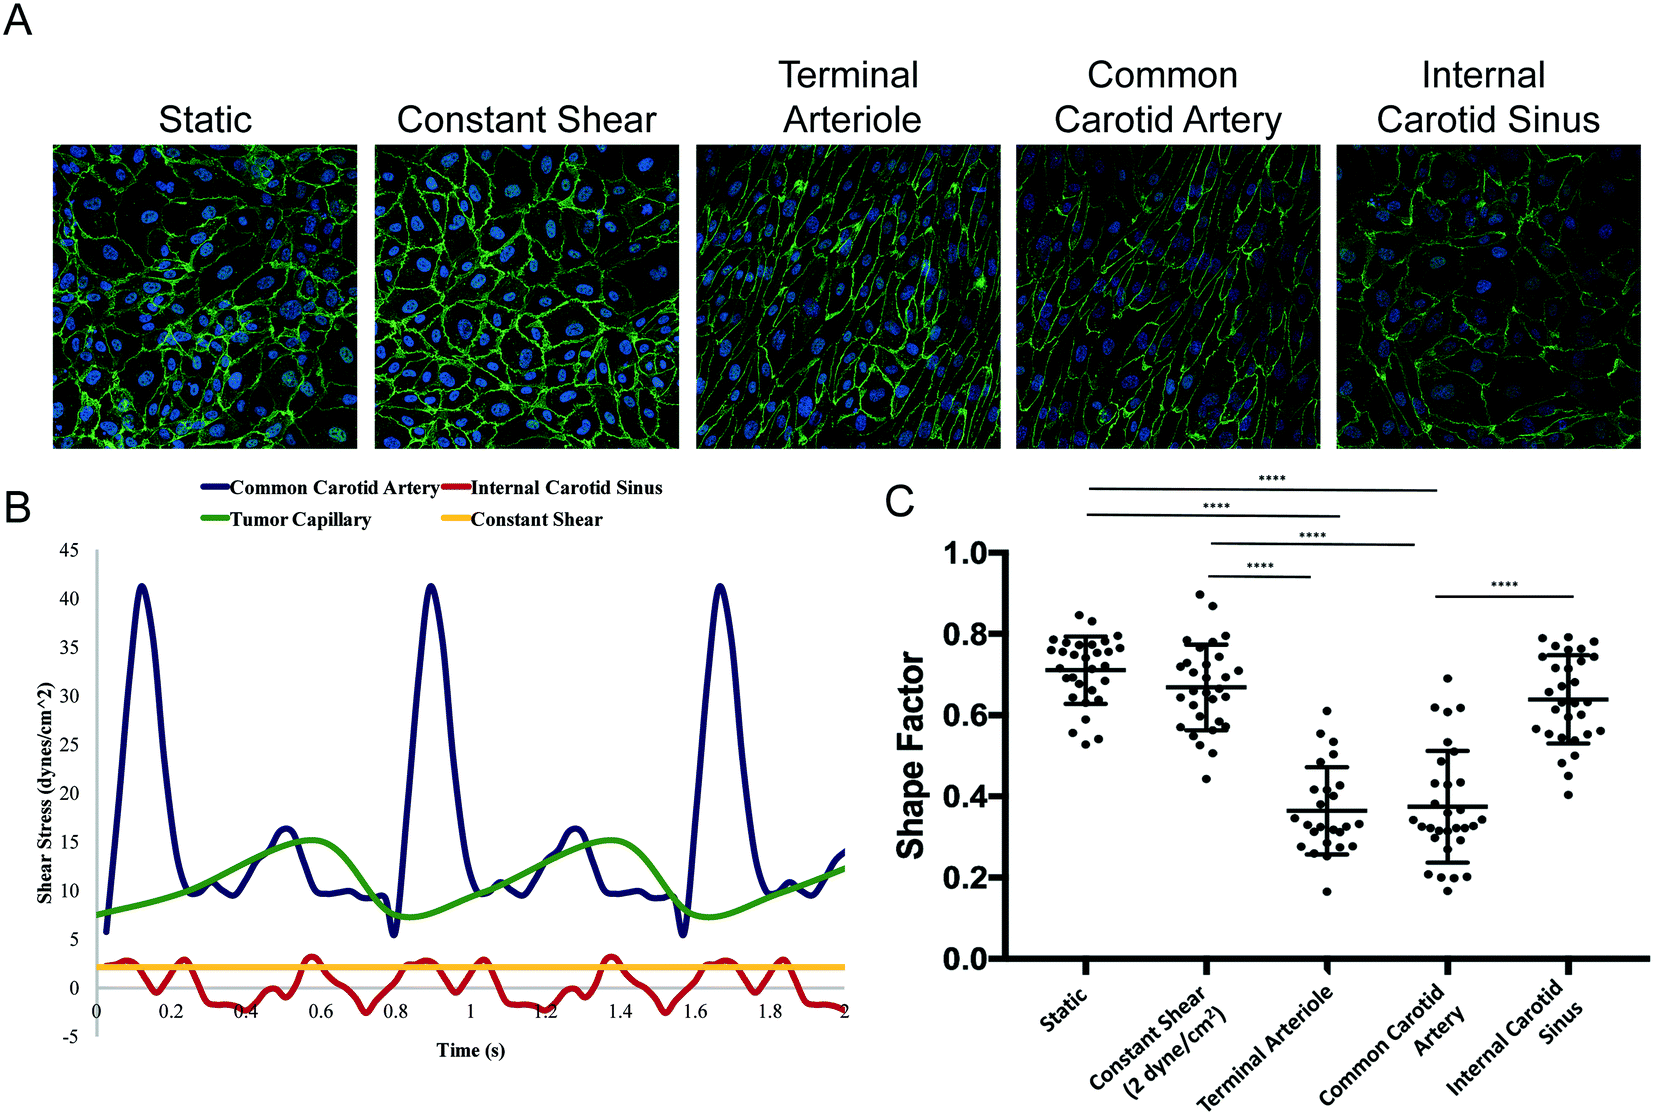 | ||
| Fig. 2 Shear stress regulates endothelial cell morphology. (A) Representative images for each condition. (B) Two seconds of each waveform, or shear pattern, used in the experiments. (C) A histogram of the shape factor of each cell measured separated by condition. Significance is indicated by the bars (****p < 0.0001). | ||
For our initial studies, we used cells cultured from PDAC PDXs 366, 608, and 449 (ref. 4 and 5) along with human primary stellate cells and human microvascular ECs under tumor arteriole shear and flow. After seven days in the TMES, PDAC and pancreatic stellate cells organize and grow into multi-cell layers and display a disordered acinar structure similar to the histopathology of pancreatic cancer (Fig. 1B). When the original H&E-stained patient sample for PDAC 366 was compared to immunofluorescence of PDAC 366 donor cells grown in the TMES (Fig. 1C), there was a similar disordered growth of tumor and stromal cells.
To determine in an unbiased manner if tumor cells grown in the TMES are more like tumor cells grown in 2D static culture or the in vivo patient-derived mouse xenografts, we performed next-generation sequencing of RNA (RNAseq) to compare the transcriptome of three PDAC tumor donors grown under three different conditions: 1) static 2D cultures, 2) orthotopic xenografts in athymic mice,5 and 3) the TMES. To enrich for tumor cells from the TMES, we developed a negative plating mask that enables plating of pancreatic stellate cells on 64% of the membrane but occludes the stellate cells from 9 precise 15 mm diameter areas representing 36% of the membrane that can then be cut at the end of an experiment (Supplemental Fig. S1†). This technique allows enrichment for tumors cells of >95% for subsequent analysis.
We first explored the underlying structure of the RNAseq data using principal component analysis to determine the relationships between the different tumor growth conditions (Fig. 1D). The PCA revealed that the patient donor overwhelmingly determines the transcriptome, independent of the environment in which the tumor cells are grown. To identify aspects of common and shared differential biology seen across the multiple experimental growth conditions (2D, TMES, PDX), we employed a statistical intersection-union test to identify both the excess of similarity in differential expression exhibited between the contrasts of TMES to 2D and xenograft to 2D (the response similarity index, or RSI). The RSI demonstrates (Fig. 3A and B) that the PDX and the TMES models showed strong concordance and relatively little discordance relative to the 2D model, even though the tumor cells in the TMES were first passaged in 2D before introduction into the TMES. In Fig. 3A and B, purple indicates transcripts that are concordantly regulated and green indicates discordance; there are many more concordant (purple) transcripts than discordant (green). This indicates that, relative to 2D culture, the TMES confers many of the same molecular attributes as the PDX.
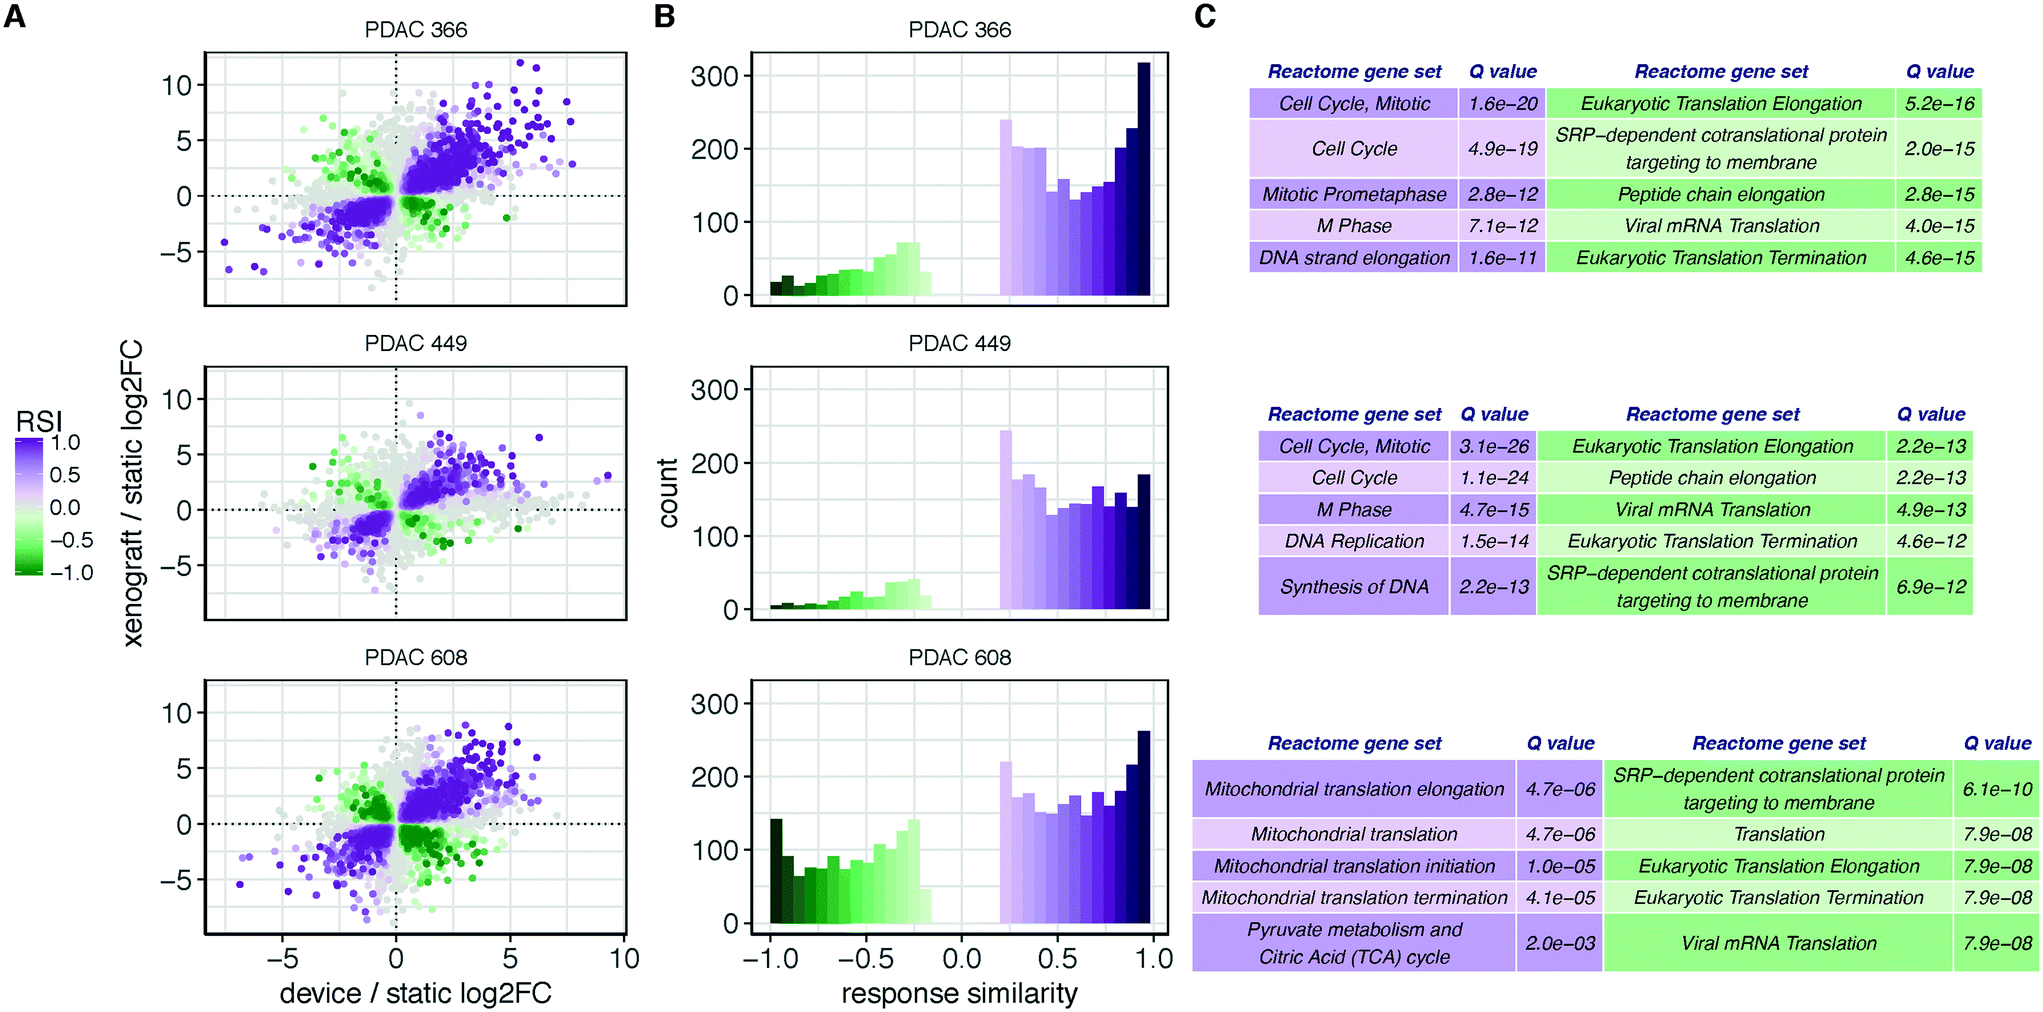 | ||
| Fig. 3 The PDAC TMES transcriptome resembles the xenograft transcriptome. (A) Xenograft vs. TMES scatterplots of significant (p < 0.01) log2 fold changes relative to static cell culture. Points are colored by their response similarity (RSI), where darker, more saturated colors indicate transcripts that show greater evidence for joint differential expression on both axes. Purple indicates transcripts that are concordantly regulated between the two conditions, whereas green indicates discordance. (B) Histograms of RSI values (>0.2 and ≤0.2) in (a). n = 6 for TMES and 2D static samples and n = 3 for xenografts. The asymmetry between concordant and discordant RSI values indicates that expression changes in xenografts and the TMES tend to be concordant. This demonstrates that the TMES recapitulates much of the transcriptional profile of a xenograft model. (C) Functional profiling of the concordantly (purple) and discordantly (green) regulated transcripts. | ||
Functional profiling of the concordant and discordant transcripts reveals that for PDAC 366 and PDAC 449, the TMES and PDXs regulate the cell cycle and associated processes similarly, whereas for PDAC 608 the TMES and PDX regulate mitochondrial biology and metabolic processes similarly (Fig. 3C). Interestingly, all three PDAC patient donor tumor cells showed the same discordant biological processes around gene translation, largely due to differences in the expression of ribosomal protein mRNAs. To explore the differences between the PDAC donor cells revealed by the RSI analysis, we examined the molecular subtypes of the PDAC cells in the TMES as defined in ref. 24 (Fig. 4A). PDAC 366 and 449 samples are best classified as squamous subtype. PDAC 608 is classified as pancreatic progenitor although it is not strongly distinguished from the immunogenic subtype. The similarity of the concordant biological process reflected in the transcriptome of PDAC 366 and 449 is driven by the underlying molecular subtype: squamous. PDAC 608, being a different molecular subtype, yields different concordant biological processes between the TMES and PDX conditions. This is supported by functional phosphoprotein and total protein based analysis of tumor cells from the TMES (Fig. 4B). Reverse phase protein array (RPPA) pathway activation analysis of PDAC 366, 449, and 608 under conditions identical to the RNAseq show that the signaling architecture of PDAC 366 and 449 are more similar than 608, consistent with PDAC 608 being a different molecular subtype.
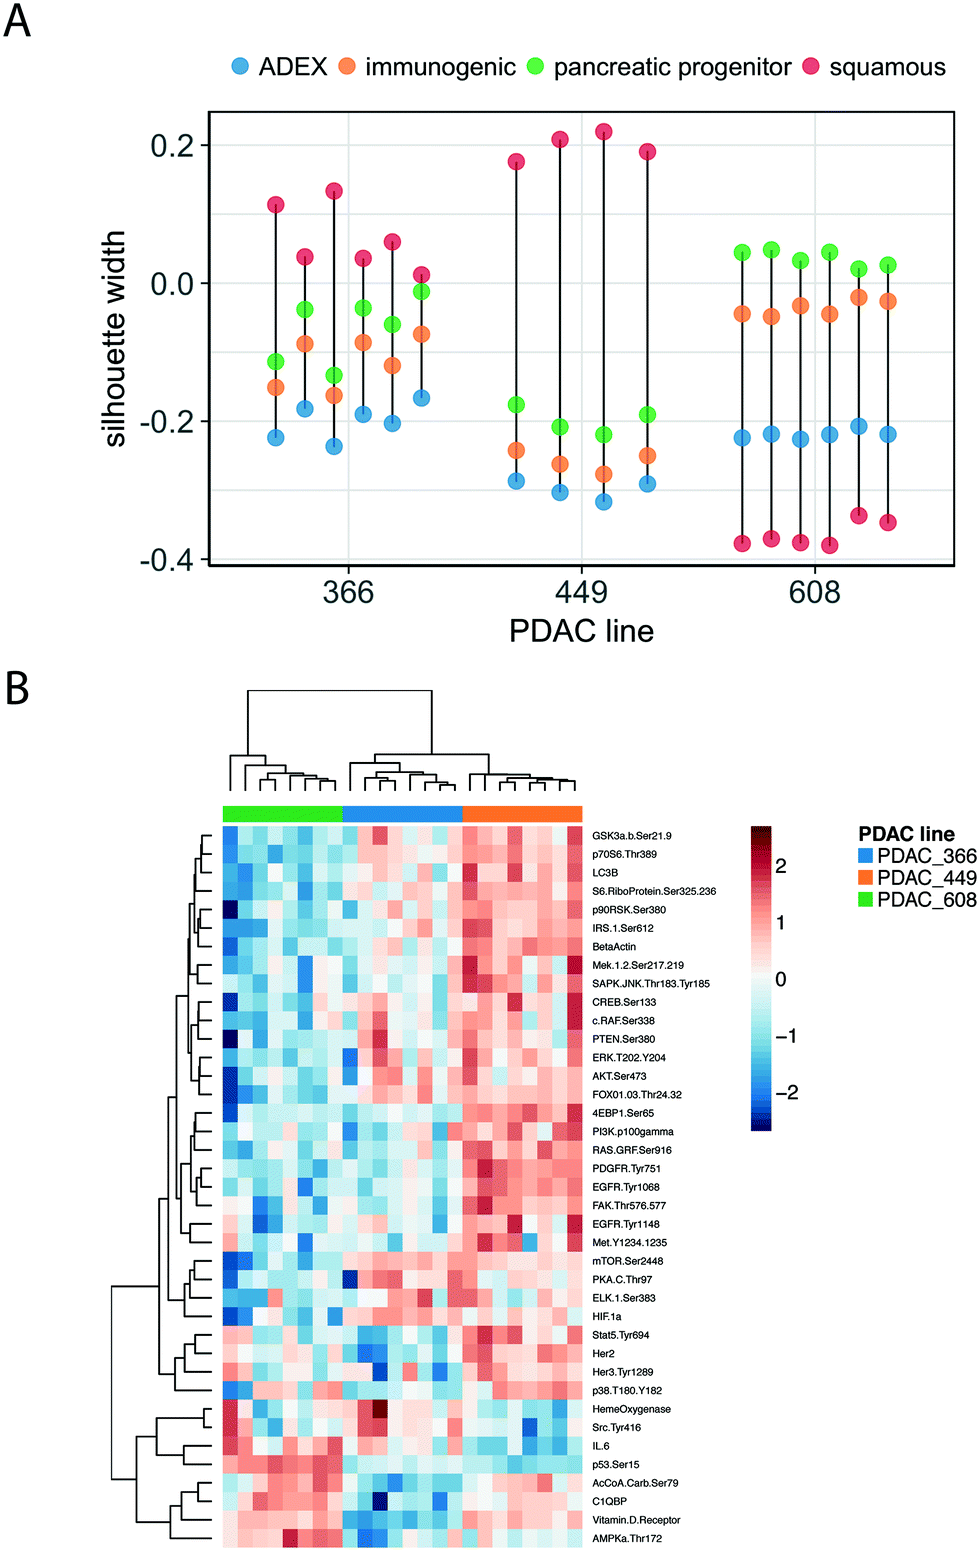 | ||
| Fig. 4 The PDAC TMES reveals molecular subtypes. (A) The silhouette width of each PDAC PDX line in the TMES system when clustered with data from Bailey et al. Each vertical line represents a sample (some lines contain technical replicates), and each point within a line represents a categorization of that sample with respect to the Bailey et al. data. Positive silhouette widths (values greater than 0) indicate that a sample is well categorized, whereas negative widths indicate poor categorization. (B) Cluster analysis of RPPA data from PDAC PDX tumor cells grown in the TMES. 366 and 449 cluster together. | ||
The role of FAK (Focal Adhesion Kinase) in PDAC, as both a driver of progression and metastasis as well as a therapeutic target, is established.4 Importantly, these studies showed that the FAK inhibitor, PF-562271, was effective at reducing the tumor volume of the PDX PDAC 608 but not proliferation of PDAC 608 cells grown in 2D static conditions even though in vitro FAK was completely inhibited.4 Thus, FAK inhibition with PF-562271 provides us with a drug response that distinguishes the in vitro-state from the in vivo-state. We examined the ability of PF-562271 to inhibit the growth of PDAC 608 cells in the TMES (Fig. 5A) using a concentration of PF-562271 equivalent to the Cave plasma concentrations following in vivo dosing in mice.25 Consistent with PF-562271 inhibiting PDX PDAC 608 growth, growth in the TMES was inhibited by 49% when tumor cells were measured by unit area and inhibited by 67% by EdU incorporation indicating that the TMES response to the FAK inhibitor paralleled the response observed in the in vivo PDXs and not the 2D in vitro cultures. Interestingly, FAK expression is significantly elevated in PDAC 608 in the TMES when compared to 2D static culture (Supplemental Fig. S2†). This data may suggest that elevated FAK expression may account for the increased sensitivity to PF-562271. However, it is important to note that FAK was effectively inhibited in 2D cultures and xenografts in the previous study4 and in the TMES in this study, indicating that FAK expression and inhibition alone is insufficient to account for the in vivo-like inhibition of growth observed in the TMES with PF-562271.
 | ||
| Fig. 5 The PDAC TMES reproduces in vivo drug responsiveness. (A and B) Cells were grown in the TMES for four days and then dosed for 3 days with DMSO (0.058%) or 5.8 μM PF-562271 (FAKi) and (A) cell number was determined using Picogreen signal as a surrogate with a standard curve (*p = 0.0004) or (B) EdU positive tumor cells were scored to determine proliferating fraction (*p = 0.00005). Picogreen measures total cells (tumor and stellate) and EdU was co-imaged with anti-cytokeratin 18 to measure EdU incorporation only in tumor cells. (C and D) Cells were grown in the TMES for four days and then dosed for 3 days with DMSO (0.058%) or 4.2 μM lapatinib (L), 36 nM trametinib (T), or the combination of the two (L + T) and (C) cell number was determined using luciferase signal as a surrogate with a standard curve (*p < 0.007 compared to DMSO; **p ≤ 0.001 compared to either lapatinib or trametinib alone) or (D) EdU positive tumor cells were scored to determine proliferating fraction (*p < 0.0002 compared to DMSO; **p < 0.004 compared to lapatinib alone; ***p = 0.001 compared to trametinib alone). n = 3, with 5 independent measurements across the transwell from each replicate. | ||
To expand on these observations, we tested additional drugs that showed efficacy in the PDAC PDX models.26 In prior studies, trametinib (singly, or in combination with lapatinib) was shown to inhibit growth of PDAC PDX 608 and 366. Treatment with either lapatinib or trametinib alone or in combination using a concentration equivalent to the Cave in mice27,28 significantly inhibited tumor cell number and DNA synthesis in the TMES when compared to control. The combination of lapatinib and trametinib inhibited growth in the TMES for both endpoints when compared to lapatinib alone (Fig. 5B and C). When the combination was compared to trametinib alone, PDAC 366 in the TMES exhibited no significant differences in either cell number or EdU incorporation. This result was mirrored in PDAC 366 grown as a PDX (Fig. 5B and C).26 The combination of lapatinib and trametinib differed from trametinib alone in the TMES compared to the PDX for PDAC 608; however, the efficacy differed depending on the endpoint.26 Cell number was increased while EdU incorporation was decreased. Thus, response achieved with these targeted therapeutics in the TMES was highly similar to that achieved in an orthotopic PDX mouse model.
To determine if tumor control could be observed in the TMES using a clinical standard of care chemotherapeutic for PDAC, we treated PDAC 366 and PDAC 608 in the TMES with 5.31 μM gemcitabine, the concentration equivalent to the typical Cave concentration attained in patients (Fig. 6A).29 This treatment was chosen since gemcitabine was the treatment the PDAC patients were receiving at the time the 366 and 608 PDXs were generated from their tissue. At this dose in 2D static cultures, there was identical inhibition of growth and tumor cell killing of both PDAC 366 and 608 (data not shown). In the TMES, gemcitabine significantly inhibited tumor cell growth in both PDAC 366 and 608. Inhibition of PDAC 608 with gemcitabine was significantly greater than PDAC 366 (p = 0.00276), even though PDAC 366 grew better in the TMES than PDAC 608. These data are particularly interesting when considering the patient outcomes.5 The patient whose tumor established PDAC 366 survived less than 3 months whereas the patient whose tumor established PDAC 608 survived nearly 12 months. Thus, the patient survival data paralleled both tumor cell growth and gemcitabine response in the TMES.
 | ||
| Fig. 6 The PDAC TMES responds to drugs at human patient doses. (A) Cells were grown in the TMES for four days and then dosed for 3 days with 5.31 μM gemcitabine, the dose equivalent to the Cave of gemcitabine or DMSO (0.058%). Tumor cell number was determined using luciferase signal as a surrogate with a standard curve. *p ≤ 0.00003. n = 3, with 5 independent measurements across the transwell from each replicate. (B) Cells were grown in 3D static culture for four days and then dosed for 3 days with 5.31 μM gemcitabine, the dose equivalent to the Cave of gemcitabine or DMSO (0.058%). Media and vehicle or drug was replenished every other day. Tumor cell number was determined using luciferase signal as a surrogate for cell number with a standard curve. n = 3, with 5 independent measurements across the transwell from each replicate. | ||
To verify that the primary unique features of the TMES, physiologic shear stress and flow, were drivers of the gemcitabine drug response that paralleled patient outcomes, we reproduced the above gemcitabine experiment omitting both tumor terminal arteriole shear stress and media inflow and outflow. (Fig. 6B). We plated microvascular endothelial cells, pancreatic stellate cells, and either PDAC 366 or PDAC 608 identically to our TMES experiments except we did not load the transwells onto the flow devices and instead maintained them under normal tissue culture conditions. In the absence of shear stress and flow, the majority of endothelial cells did not survive and those that did, survived in patches and remained cuboidal (data not shown). This indicates that shear stress and flow are required for endothelial cell survival in the TMES, consistent with previous observations.30 The number of tumor cells in the 3D static cultures was quantitatively lower than in the TMES, and the data was noisy and showed significant batch variability. This is consistent with the tumor cells not growing as uniformly in the absence of shear stress and flow. No effect of gemcitabine was observed in PDAC 608, and with PDAC 366, gemcitabine paradoxically led to an increase in tumor cells when accounting for batch variation in the replicates. These data indicate that consistency in the system and the generation of a stable biological state requires shear stress and flow.
To explore a possible mechanism underlying the difference in gemcitabine response in the TMES between PDAC 366 and 608, we analyzed the relative expression levels of the family of nucleoside transporters which are required for gemcitabine transport across the plasma membrane (Fig. 7).31 Highlighted in Fig. 7 are the four SLC transporters known to import gemcitabine.32 Significantly, analysis of these four SLCs in the provisional TCGA data on cBioPortal are amplified or have elevated mRNA expression in 21% of tumors.33SLC28A3 was elevated more than 400-fold in PDAC 608 relative to PDAC 366 whereas SLC28A2 was decreased 5-fold. Neither SLC29A1 nor SLC29A2 were significantly altered between PDAC 608 and 366. Since levels of SLC28A3 have been shown to positively correlate with survival after gemcitabine therapy,32,34 these data suggest that the relative sensitivity of PDAC 608 to gemcitabine may be explained by increased cellular uptake of gemcitabine mediated by the high expression of SLC28A3 in PDAC 608 grown in the TMES. However, analysis of SLC levels in static 2D culture compared to the TMES show no difference in SLC28A3, and SLC29A1 and SLC29A2 are both upregulated in static 2D for PDAC 608 (Supplemental Fig. S3†). This indicates that additional aspects of the TMES contribute to the differential sensitivity of gemcitabine between PDAC 366 and PDAC 608.
 | ||
| Fig. 7 Transcriptome analysis reveals mechanisms of gemcitabine sensitivity. Solute carrier family mRNAs are strongly regulated between the 608 and 366 PDAC lines. The magnitude of differential expression of the SLC transporters range roughly 500-fold in either direction. Four SLC transporters known to import gemcitabine are labeled. SLC28A3 is upregulated over 400-fold in PDAC 608 compared to PDAC 366 in the TMES. | ||
RSI analysis of the RNAseq data from PDAC 366, 449, and 608 suggested that the transcriptome of tumor cells grown in the TMES is in vivo-like, demonstrating broad transcriptomic regulation that is similar to PDX cells. (Fig. 3). For PDAC 449, we were able to obtain patient material from the time of surgery. RNAseq of patient tumor PDAC 449 enables comparison of PDAC 449 from four conditions: patient tumor, 2D culture, PDX, and the TMES. For this analysis, we generated protein–protein interaction (PPI) networks35 that represent the differences between the patient tumor and the static 2D, PDX, or TMES conditions (Fig. 8). The static condition induces the largest differential PPI network, suggesting that of the three culture conditions, it is globally the most dissimilar to the patient tumor. A large number of proteins involved in cell cycle are dysregulated in the static condition, but not in the xenograft or TMES conditions. Together with the observation that the xenograft and TMES conditions show high similarity in the regulation of cell cycle-associated transcripts, this suggests that both xenografts and the TMES recapitulate in vivo growth better than static cell culture. The TMES induces the smallest differential PPI network suggesting that tumor cells cultured in the TMES are most similar to the patient tumor, even more so than the PDX.
 | ||
| Fig. 8 The PDAC TMES is most similar to the patient transcriptome. Protein–protein interaction networks representing differential expression states between the patient biopsy and each culture condition. Each node represents collections of densely connected proteins (i.e., communities). The number of proteins in each community is proportional to the node size, and the proportion of up- (red) and down-regulated (blue) genes is encoded in the node color. | ||
Discussion
It has long been appreciated that cancer is in part a result of complex interactions between tumor cells and normal host tissue within the tumor microenvironment; however, accurate in vitro models to study these complex interactions are still being developed. In this study, we describe the development and validation of a novel in vitro tumor microenvironment system that reflects the in vivo pancreatic cancer state. Our work suggests that this tumor microenvironment system (TMES) recreates multiple aspects of cancer biology, including tumor growth, the in vivo xenograft and patient transcriptional program, and response to chemotherapeutics at concentrations that correspond to human therapeutic plasma levels. Additionally, tumor growth and chemotherapeutic efficacy in our TMES appears to parallel patient's responses.3D in vitro systems for cancer have been used effectively to uncover mechanisms of disease progression and for evaluating drug responses.8,9 3D spheroids are the most widely used 3D culture system. While these systems have clear advantages over standard 2D static tissue culture, they do have shortcomings. The generation of these spheroids will often use exogenous extracellular matrix, typically Matrigel, which has known problems, including batch to batch variability and contamination with lactate dehydrogenase-elevating virus.36 Furthermore, the selection of matrix can significantly alter the biology. Depending on the 3D system, the media formulation is often complex and may require the addition of multiple growth factors, the ROCK inhibitor, or autologous serum, any of which may alter the biology of tumor cells and potentially affect translatability to patients.12 These limitations notwithstanding, in vitro 3D organoid models for pancreatic cancer have been developed and enabled significant advances in our understanding of PDAC.8In vitro 3D organoid PDAC models have also incorporated pancreatic stellate cells and uncovered the heterogeneity of cancer-associated fibroblasts in PDAC.37 The TMES developed in this study incorporates human primary microvascular endothelial cells experiencing tumor hemodynamic shear forces, human primary pancreatic stellate cells, and human pancreatic cancer cells from patient-derived xenografts. The application of mechanical shear force to endothelial cells, with a magnitude and periodicity based on blood flow through tumor vasculature, has the established effect of recapitulating the in vivo phenotypes of vascular endothelium.16 The application of the flow device used herein has previously been successfully applied to developing models of cardiovascular health and disease, as well as models of normal and diseased liver.14–16
We recognize the immense potential of immunotherapies for the treatment of cancer.38 While the TMES currently lacks immune cell components, a liver model using the same platform has included immune cell components.14 Thus, the TMES creates a unique opportunity to expressly interrogate the contributions of immune cells on tumor cell survival, proliferation, and response to therapy in a manner that incorporates immune cell interactions with the vasculature. The TMES also provides a platform to interrogate how hemodynamic variations inherent to blood vessel geometries impact drug response. We know these variations are critical determinants of the endothelial cell inflammatory phenotype and can alter vascular permeability.39,40
The role of the tumor vasculature in PDAC is understudied and poorly understood, underscoring the need for a model PDAC system that incorporates vascular biology. PDAC is typically characterized by hypovascularity, vascular collapse, hypoxia, excessive dense ECM, and poor drug delivery. However, this characterization is overly simplified and has created misconceptions on the role and function of tumor associated endothelial cells and blood vessels in PDAC. The concept that PDAC is hypovascular is driven by 1) clinical imaging data (i.e. CT, MRI) showing PDAC tumors as low density masses, and 2) immunohistochemistry data evaluating microvascular vessel density (MVD) in patients' tumors relative to normal or uninvolved pancreas.41,42 The interpretation that PDAC is hypovascular is technically correct, but fails to consider that the pancreas is one of the most highly vascularized organs in the human body, with higher blood flow rates than other gastrointestinal organs. Thus, imaging will show less contrast in tumors, due to the relatively lower vascularity. However, PDAC still possesses a MVD comparable to other solid tumors. For example, colon cancer has a MVD of 3 to 35 for a 200× field,43 melanoma has a MVD of 32 ± 21 for a 200× field,44 and PDAC has a MVD of 57.1 ± 20.4 for a 200× field in one study42 and 3.7 to 28.3 in another.45 This should not be surprising since it is well established that the diffusion limit of oxygen and nutrients is a driver of tumor vascularization. Indeed, one widely referenced study used to support the hypovascularity of PDAC also showed that PDAC tumor cells were on average 100 microns from blood vessels.41 Moreover, the concept of vascular distortion in PDAC due to high tumor interstitial pressure being a barrier to drug delivery is controversial.46,47 PDAC vascularity is a critical driver of disease; a number of studies indicate that a higher MVD in PDAC correlates with higher grade and a poorer prognosis.45,48 Thus, the widely-accepted view that PDAC is a hypovascular tumor has led to the mischaracterization that there are few blood vessels in PDAC. The creation of an in vitro model of PDAC such as that described herein that encompasses the microvasculature creates the opportunity to address this deficiency in understanding.
The introduction of physiologically relevant tumor hemodynamics and biological transport into an in vitro tumor model generates an in vivo-like biology demonstrated by the similarity of the transcriptional program to both the PDX and patient tumor. This raises the exciting potential that the TMES could be used for patient avatars. It is vitally important that we develop functional assays predictive of individual patient responses. The molecular and genetic revolution that is currently driving personalized medicine is limited since the presence of a driver mutation does not dictate a clinical response, and when there is a clinical response to a drug targeting a driver mutation, that response is often not durable.49,50 However, we do not yet know if the TMES will fully capture the heterogeneity of patients' tumors. This is a challenge facing all ex vivo model systems.
Interestingly, while all patient cells tested in the TMES showed significant transcriptional concordance with in vivo PDXs, the concordant transcripts of squamous molecular subtype PDAC 366 and 449 is driven by their shared squamous molecular subtype. PDAC 608, being a different molecular subtype, yields different concordant biological processes between the TMES and PDX conditions. It is thus possible that the TMES may model different molecular subtypes to various degrees.
Our TMES incorporates a 3D scaffold, multiple cell types, patient-derived cells, physiological matrices, hemodynamic mechanical shear stress, and perfusion in an orientation that recreates many aspects of the in vivo architecture and supports recapitulation of in vivo biological transport and tumor-specific hemodynamics. This engineered tumor microenvironment for pancreatic cancer has the potential to advance the discovery and development of effective anticancer agents and identify appropriate agents for individual patients. The system has applications for 1) patient avatars, 2) drug discovery, validation, lead drug development, de-risking, and 3) interrogating mechanisms of tumor stromal interactions.
Methods
Cell culture
Primary human microvascular endothelial cells (ECs) were purchased from Lonza (USA) and maintained in EGM-2 BulletKit (Lonza CC-3162) up to 8 passages. Primary human pancreatic stellate cells (HuPaSteC) were purchased from ScienCell (Carlsbad, CA) and grown according to the manufacturer's directions up to 8 passages. Patient-derived luciferase expressing PDAC cell lines 366, 449, and 608 were cultured as previously described,4,5 maintained for a maximum of 10 passages, and authenticated against the patient samples by the University of Virginia Biomolecular Research Facility with DNA profiling, cytogenetic analysis, flow cytometry, and immunocytochemistry.26Tumor microenvironment system
The transwell coculture plating and hemodynamic flow device setup is explained in detail in ref. 16 and in Fig. 1A. Briefly, a porous polycarbonate 75 mm transwell membrane (Corning Inc., NY) was coated with 500 μl of 0.1% gelatin on the top and 2 mg ml−1 collagen on the bottom surface of the membrane prior to cell plating. This coating is minimal and only provides a surface for the cells to adhere. Additional exogenous matrix hinders the in vivo-like biology generated in the TMES (data not shown). HuPaSteC cells were plated on the underside of the membrane at 2 × 10⁴ cells per cm2 and allowed to adhere overnight. The following day, PDAC cells were plated at 4 × 10⁴ cells per cm2 on the underside of the membrane, allowed to adhere for 4 hours and then ECs were plated on the upper side of the membrane at a density of 5 × 10⁴ cells per cm2. These cell numbers create a confluent monolayer of ECs, which elongate in the direction of flow with appropriate shear force (Fig. 2). Tumor and stellate cells are initially a sub-confluent monolayer that grows in the TMES into multiple cell layers into disordered acini-like structures (Fig. 1B). All cells were plated in DMEM (Gibco 21063), high glucose, sodium pyruvate, 10% FBS, 2 mM L-glutamine, 100 U ml−1 penicillin–streptomycin, and 1% NEAA. Transwells were placed in flow media containing reduced serum (M199 supplemented with 2% FBS, 2 mM L-glutamine, 100 U ml−1 penicillin–streptomycin, and dextran) for flow experiments. Tumor hemodynamic flow modeled from tumor terminal arterioles18 was imparted by the rotating cone above the EC layer. Tumor terminal arteriole hemodynamics was modeled with the following waveform: at 0.000 seconds 7.47 dynes per cm2, 0.235 seconds 9.81 dynes per cm2, 0.588 seconds 15.15 dynes per cm2, and then returning to 7.47 dynes per cm2 at 0.800 seconds and repeating thereafter. Inflow and outflow tubing accessing the upper and lower chambers of the transwell allowed for continual perfusion of media to both the EC and tumor/stellate sides as previously described;16 the inflow of media at 52.0 μL min−1 and outflow at 62.0 μL min−1 provide continuously exchanging media and creates an equilibrium of 4 ml in the upper chamber and 9 ml in the lower chamber. Cells were grown under tumor hemodynamics for 7 days. For drug studies, all drugs were added on day 4. Growth assays, luciferase and Picogreen (ThermoFisher Scientific), were performed according to the manufacturer's instructions. Using luciferase to measure growth yielded a dynamic range of 4 orders of magnitude and a sensitivity to read less than 100 cells. EdU was pulsed 2 hours prior to the end of the experiment.Xenografts
Tumors were generated orthotopically on the pancreata of immunocompromised mice as previously described4,5 and were performed in compliance with the relevant laws and institutional guidelines with the approval of the University of Virginia Animal Care and Use Committee.Immunofluorescence
Immunofluorescence was performed as described previously.14 In brief, TMES transwells were fixed in 4% paraformaldehyde for 15 minutes, permeabilized in 0.2% Triton X-100 in PBS for 5 minutes, and incubated with primary antibody for 2 hours at room temperature. Primary antibodies used were anti-keratin 18 (1![[thin space (1/6-em)]](https://www.rsc.org/images/entities/char_2009.gif) :100) and anti-fibroblast surface protein (1:50) purchased from Abcam (ab24561 and ab11333, respectively). Goat anti-mouse Alexa Flour 546 and goat anti-rabbit Alexa Fluor 488 (Life Technologies; A11003, and A11008, respectively) were used as secondary antibodies at 1:300. EdU incorporation was visualized with the Click-iT EdU Alexa Fluor 647 imaging kit (ThermoFisher, CI10340). Nuclei were stained with DAPI (Thermo Fisher Scientific, D1306) or TO-PRO-3 (LifeTechnologies, T3605).
:100) and anti-fibroblast surface protein (1:50) purchased from Abcam (ab24561 and ab11333, respectively). Goat anti-mouse Alexa Flour 546 and goat anti-rabbit Alexa Fluor 488 (Life Technologies; A11003, and A11008, respectively) were used as secondary antibodies at 1:300. EdU incorporation was visualized with the Click-iT EdU Alexa Fluor 647 imaging kit (ThermoFisher, CI10340). Nuclei were stained with DAPI (Thermo Fisher Scientific, D1306) or TO-PRO-3 (LifeTechnologies, T3605).
RNA-seq quantification
For each PDAC (366, 449, and 608), n = 6 for TMES and 2D static samples and n = 3 for PDXs. All raw RNA-seq datasets were pseudoaligned to the human (GRCh38) and mouse transcriptomes (GRCm38) simultaneously using kallisto v0.42.4.57 The mouse transcriptome was included to account for mouse RNA present in the xenograft-derived samples. Gene-level quantifications were calculated using the Tximport tool58 with the “LengthScaledTPM” option, and Ensembl gene and transcript annotations.51 Mouse transcripts were excluded from the gene-level quantification procedure; thus, the resultant quantifications were human-specific.Differential expression analysis
Genes with low transcript abundance were removed from further analysis based on a minimum threshold value of 2 counts per million in at least three samples (i.e., the minimum replicate number). We then adjusted library sizes using the TMM normalization method,59 and applied the voom procedure to the normalized data.52 We identified extra-experimental heterogeneity in the data using the surrogate variable analysis (SVA) algorithm.60 This technique was applied to the voom-transformed data, using the combination of cell line and culture condition as the predictor variable. We then constructed a set of linear models with shrunken variance using the limma Bioconductor package. In these models, cell line, culture condition, and the surrogate variables were included as fixed effects, while technical variation was estimated as a random effect using limma's “duplicateCorrelation” function, blocking on technical replicates. Differentially expressed genes were identified by calculating contrast p-values derived from limma's moderated t-statistic, followed by false discovery rate calculation using the Benjamini–Hochberg procedure for multiple hypothesis testing. In addition, for every gene in a given contrast we calculated the Bayesian posterior probability that the null hypothesis is false (i.e., the posterior probability that the gene is differentially expressed).53Response similarity analysis
When comparing two different contrasts we calculate a value referred to as the response similarity index (RSI) for each gene. It is defined as the Bayesian joint posterior probability of differential expression, signed by the sign of the product of the log fold changes in the two contrasts.14 Thus, values near +1 indicate joint differential expression in the same direction (concordance), values near −1 indicate joint differential expression in opposite direction (discordance), and values near 0 indicate lack of joint differential expression. Enrichment of concordantly or discordantly regulated gene sets was determined using the rank-based gene set enrichment analysis in the limma package.Molecular subtype analysis
Expression data and molecular subtype labels for various pancreatic tumors were obtained from Bailey et al.24 We calculated a mean silhouette score for each gene in this dataset based on the subtype classification reported by Bailey et al. The top 500 genes by mean silhouette score were selected, representing the 500 genes that best distinguish the four molecular subtypes reported. Focusing the analysis on these 500 genes, we quantile-normalized our data with the Bailey et al. data. For each of our samples we calculated a silhouette score for each of the four possible classifications. Classifications that generated the largest silhouette score thus correspond to the best molecular subtype classification of our data.Reverse phase protein array
Reverse phase protein array (RPPA) was performed as previously described.54 For each PDAC (366, 449, and 608), n = 6 for the TMES. Briefly, cell lysates were diluted with 2× Tris-glycine SDS sample buffer (Life Technologies Corporation, Carlsbad, CA, USA) before printing on nitrocellulose slides (Grace Bio-Labs, Bend, OR, USA) and were spotted in triplicate with the Aushon 2470 contact pin arrayer (AushonBioSystems Inc., Billerica, MA, USA), in 4-point twofold dilution curves.Analysis of protein–protein interaction networks
Protein–protein interaction networks were obtained from the STRING database (v10) and the STRINGdb Bioconductor package.35 Low-confidence edges (edges with a confidence score >0.7) were removed from the network, resulting in a high-confidence interaction network. To extract a differentially regulated portion of the global network for a given contrast, we mapped the posterior probabilities of differential expression onto each node in the network. The edges were then weighted as the product of their incident nodes (i.e., the joint probability that the incident nodes are differentially expressed). Edges with weights below a given threshold (0.9) were then removed, and the giant component of the resulting network was extracted. The result is a connected network representing the portion of the global network that is differentially regulated for a given contrast. These networks were then partitioned into communities using the Louvain algorithm.55 The functional profile for each community was obtained by performing gene set enrichment analysis using Fisher's exact test and Reactome gene sets.56Other statistical analysis
Differences in growth data were assessed with the Mann–Whitney U test. Multiple hypothesis testing corrections were applied using the Bonferroni method when applicable. The shape factor measurements were compared using a Kruskal–Wallis test with multiple comparisons.Conflicts of interest
All HemoShear affiliates are employed or were employed by HemoShear, and have stock in the company.Acknowledgements
Grant Support: NIH/NCI SBIR program (HHSN261201300024C; HHSN261201500023C), University of Virginia Cancer Center Technology Partnership Initiative (138812.108), the Virginia Bioscience Health Research Corporation (146175).References
- J. L. Wilding and W. F. Bodmer, Cancer Cell Lines for Drug Discovery and Development, Cancer Res., 2014, 74(9), 2377–2384 CrossRef CAS PubMed.
- L. M. Ellis and I. J. Fidler, Finding the tumor copycat. Therapy fails, patients don't, Nat. Med., 2010, 16(9), 974–975 CrossRef CAS PubMed.
- D. Siolas and G. J. Hannon, Patient-Derived Tumor Xenografts: Transforming Clinical Samples into Mouse Models, Cancer Res., 2013, 73(17), 5315–5319 CrossRef CAS PubMed.
- J. B. Stokes, S. J. Adair, J. K. Slack-Davis, D. M. Walters, R. W. Tilghman and E. D. Hershey, et al. Inhibition of focal adhesion kinase by PF-562, 271 inhibits the growth and metastasis of pancreatic cancer concomitant with altering the tumor microenvironment, Mol. Cancer Ther., 2011, 10(11), 2135–2145 CrossRef CAS PubMed.
- D. M. Walters, J. B. Stokes, S. J. Adair, E. B. Stelow, C. A. Borgman and B. T. Lowrey, et al. Clinical, molecular and genetic validation of a murine orthotopic xenograft model of pancreatic adenocarcinoma using fresh human specimens, PLoS One, 2013, 8(10), e77065 CrossRef CAS PubMed.
- J. W. Cassidy, C. Caldas and A. Bruna, Maintaining Tumor Heterogeneity in Patient-Derived Tumor Xenografts, Cancer Res., 2015, 75(15), 2963–2968 CrossRef CAS PubMed.
- U. Ben-David, G. Ha, Y.-Y. Tseng, N. F. Greenwald, C. Oh and J. Shih, et al. Patient-derived xenografts undergo mouse-specific tumor evolution, Nat. Genet., 2017, 49(11), 1567–1575 CrossRef CAS PubMed.
- S. F. Boj, C.-I. Hwang, L. A. Baker, I. I. C. Chio, D. D. Engle and V. Corbo, et al. Organoid models of human and mouse ductal pancreatic cancer, Cell, 2015, 160(1–2), 324–338 CrossRef CAS PubMed.
- L. Huang, A. Holtzinger, I. Jagan, M. BeGora, I. Lohse and N. Ngai, et al. Ductal pancreatic cancer modeling and drug screening using human pluripotent stem cell- and patient-derived tumor organoids, Nat. Med., 2015, 21(11), 1364–1371 CrossRef CAS PubMed.
- R. Edmondson, J. J. Broglie, A. F. Adcock and L. Yang, Three-Dimensional Cell Culture Systems and Their Applications in Drug Discovery and Cell-Based Biosensors, Assay Drug Dev. Technol., 2014, 12(4), 207–218 CrossRef CAS PubMed.
- M. I. Bogorad, J. DeStefano, J. Karlsson, A. D. Wong, S. Gerecht and P. C. Searson, Review: in vitro microvessel models, Lab Chip, 2015, 15(22), 4242–4255 RSC.
- B. Majumder, U. Baraneedharan, S. Thiyagarajan, P. Radhakrishnan, H. Narasimhan and M. Dhandapani, et al. Predicting clinical response to anticancer drugs using an ex vivo platform that captures tumour heterogeneity, Nat. Commun., 2015, 6, 6169 CrossRef CAS PubMed.
- D. Roife, B. Dai, Y. Kang, M. V. Rios Perez, M. Pratt and X. Li, et al. Ex Vivo Testing of Patient-Derived Xenografts Mirrors the Clinical Outcome of Patients with Pancreatic Ductal Adenocarcinoma, Clin. Cancer Res., 2016, 6021–6030 CrossRef CAS PubMed.
- R. E. Feaver, B. K. Cole, M. J. Lawson, S. A. Hoang, S. Marukian and B. R. Blackman, et al. Development of an in vitro human liver system for interrogating nonalcoholic steatohepatitis, JCI Insight, 2016, 1(20), e90954 CrossRef PubMed.
- A. Dash, M. B. Simmers, T. G. Deering, D. J. Berry, R. E. Feaver and N. E. Hastings, et al. Hemodynamic flow improves rat hepatocyte morphology, function, and metabolic activity in vitro, Am. J. Physiol., Cell Physiol., 2013, 304(11), C1053–C1063 CrossRef CAS PubMed.
- N. E. Hastings, M. B. Simmers, O. G. McDonald, B. R. Wamhoff and B. R. Blackman, Atherosclerosis-prone hemodynamics differentially regulates endothelial and smooth muscle cell phenotypes and promotes pro-inflammatory priming, Am. J. Physiol., Cell Physiol., 2007, 293(6), C1824–C1833 CrossRef CAS PubMed.
- W. H. Hsu, J. Ikezoe, C. Y. Chen, P. C. Kwan, C. P. Hsu and N. Y. Hsu, et al. Color Doppler ultrasound signals of thoracic lesions. Correlation with resected histologic specimens, Am. J. Respir. Crit. Care Med., 1996, 153(6 Pt 1), 1938–1951 CrossRef CAS PubMed.
- C. Görg, U. Seifart, K. Görg and G. Zugmaier, Color Doppler sonographic mapping of pulmonary lesions: evidence of dual arterial supply by spectral analysis, J. Ultrasound Med., 2003, 22(10), 1033–1039 CrossRef.
- G. S. Peh, K.-P. Toh, H.-P. Ang, X.-Y. Seah, B. L. George and J. S. Mehta, Optimization of human corneal endothelial cell culture: density dependency of successful cultures in vitro, BMC Res. Notes, 2013, 6, 176 CrossRef PubMed.
- S. Bersini, J. S. Jeon, G. Dubini, C. Arrigoni, S. Chung and J. L. Charest, et al. A microfluidic 3D in vitro model for specificity of breast cancer metastasis to bone, Biomaterials, 2014, 35(8), 2454–2461 CrossRef CAS PubMed.
- J. S. Jeon, S. Bersini, M. Gilardi, G. Dubini, J. L. Charest and M. Moretti, et al. Human 3D vascularized organotypic microfluidic assays to study breast cancer cell extravasation, Proc. Natl. Acad. Sci. U. S. A., 2015, 112(1), 214–219 CrossRef CAS PubMed.
- M. Moya, D. Tran and S. C. George, An integrated in vitro model of perfused tumor and cardiac tissue, Stem Cell Res. Ther., 2013, 4(Suppl 1), S15 CrossRef PubMed.
- A. Yuan, D. B. Chang, C. J. Yu, S. H. Kuo, K. T. Luh and P. C. Yang, Color Doppler sonography of benign and malignant pulmonary masses, AJR, Am. J. Roentgenol., 1994, 163(3), 545–549 CrossRef CAS PubMed.
- P. Bailey, D. K. Chang, K. Nones, A. L. Johns, A.-M. Patch and M.-C. Gingras, et al. Genomic analyses identify molecular subtypes of pancreatic cancer, Nature, 2016, 531(7592), 47–52 CrossRef CAS PubMed.
- J. R. Infante, D. R. Camidge, L. R. Mileshkin, E. X. Chen, R. J. Hicks and D. Rischin, et al. Safety, Pharmacokinetic, and Pharmacodynamic Phase I Dose-Escalation Trial of PF-00562271, an Inhibitor of Focal Adhesion Kinase, in Advanced Solid Tumors, J. Clin. Oncol., 2012, 30(13), 1527–1533 CrossRef CAS PubMed.
- D. M. Walters, J. M. Lindberg, S. J. Adair, T. E. Newhook, C. R. Cowan and J. B. Stokes, et al. Inhibition of the growth of patient-derived pancreatic cancer xenografts with the MEK inhibitor trametinib is augmented by combined treatment with the epidermal growth factor receptor/HER2 inhibitor lapatinib, Neoplasia, 2013, 15(2), 143–155 CrossRef CAS PubMed.
- Home - MICROMEDEX® [Internet]. [cited 2018 Mar 26]. Available from: http://www.micromedexsolutions.com/micromedex2/librarian.
- Application number:204114 Pharmacology/Toxicology NDA Review and Evaluation for Trametinib, FDA Center for Drug Evaluation and Research, 2013 Search PubMed.
- J. L. Abbruzzese, R. Grunewald, E. A. Weeks, D. Gravel, T. Adams and B. Nowak, et al. A phase I clinical, plasma, and cellular pharmacology study of gemcitabine, J. Clin. Oncol., 1991, 9(3), 491–498 CrossRef CAS PubMed.
- S. Dimmeler, J. Haendeler, V. Rippmann, M. Nehls and A. M. Zeiher, Shear stress inhibits apoptosis of human endothelial cells, FEBS Lett., 1996, 399(1–2), 71–74 CrossRef CAS PubMed.
- J. R. Mackey, R. S. Mani, M. Selner, D. Mowles, J. D. Young and J. A. Belt, et al. Functional nucleoside transporters are required for gemcitabine influx and manifestation of toxicity in cancer cell lines, Cancer Res., 1998, 58(19), 4349–4357 CAS.
- J. García-Manteiga, M. Molina-Arcas, F. J. Casado, A. Mazo and M. Pastor-Anglada, Nucleoside transporter profiles in human pancreatic cancer cells: role of hCNT1 in 2′,2′-difluorodeoxycytidine- induced cytotoxicity, Clin. Cancer Res., 2003, 9(13), 5000–5008 Search PubMed.
- E. Cerami, J. Gao, U. Dogrusoz, B. E. Gross, S. O. Sumer and B. A. Aksoy, et al. The cBio Cancer Genomics Portal: An Open Platform for Exploring Multidimensional Cancer Genomics Data, Cancer Discovery, 2012, 2(5), 401–404 CrossRef PubMed.
- R. Maréchal, J. R. Mackey, R. Lai, P. Demetter, M. Peeters and M. Polus, et al. Human equilibrative nucleoside transporter 1 and human concentrative nucleoside transporter 3 predict survival after adjuvant gemcitabine therapy in resected pancreatic adenocarcinoma, Clin. Cancer Res., 2009, 15(8), 2913–2919 CrossRef PubMed.
- A. Franceschini, D. Szklarczyk, S. Frankild, M. Kuhn, M. Simonovic and A. Roth, et al. STRING v9.1: protein-protein interaction networks, with increased coverage and integration, Nucleic Acids Res., 2013, 41(Database issue), D808–D815 CAS.
- A. D. Celiz, J. G. W. Smith, R. Langer, D. G. Anderson, D. A. Winkler and D. A. Barrett, et al. Materials for stem cell factories of the future, Nat. Mater., 2014, 13(6), 570–579 CrossRef CAS PubMed.
- D. Öhlund, A. Handly-Santana, G. Biffi, E. Elyada, A. S. Almeida and M. Ponz-Sarvise, et al. Distinct populations of inflammatory fibroblasts and myofibroblasts in pancreatic cancer, J. Exp. Med., 2017, 214(3), 579–596 Search PubMed.
- G. A. Manji, K. P. Olive, Y. M. Saenger and P. Oberstein, Current and Emerging Therapies in Metastatic Pancreatic Cancer, Clin. Cancer Res., 2017, 23(7), 1670–1678 CrossRef PubMed.
- R. E. Feaver, B. D. Gelfand and B. R. Blackman, Human haemodynamic frequency harmonics regulate the inflammatory phenotype of vascular endothelial cells, Nat. Commun., 2013, 4, 1525 CrossRef PubMed.
- A. W. Orr, R. Stockton, M. B. Simmers, J. M. Sanders, I. J. Sarembock and B. R. Blackman, et al. Matrix-specific p21-activated kinase activation regulates vascular permeability in atherogenesis, J. Cell Biol., 2007, 176(5), 719–727 CrossRef CAS PubMed.
- K. P. Olive, M. A. Jacobetz, C. J. Davidson, A. Gopinathan, D. McIntyre and D. Honess, et al. Inhibition of Hedgehog signaling enhances delivery of chemotherapy in a mouse model of pancreatic cancer, Science, 2009, 324(5933), 1457–1461 CrossRef CAS PubMed.
- S.-H. Wang, Y.-F. Sun, Y. Liu, Y. Zhou and Y. Liu, CT contrast enhancement correlates with pathological grade and microvessel density of pancreatic cancer tissues, Int. J. Clin. Exp. Pathol., 2015, 8(5), 5443–5449 CAS.
- A. Giatromanolaki, M. I. Koukourakis, E. Sivridis, K. C. Gatter, T. Trarbach and G. Folprecht, et al. Vascular density analysis in colorectal cancer patients treated with vatalanib (PTK787/ZK222584) in the randomised CONFIRM trials, Br. J. Cancer, 2012, 107(7), 1044–1050 CrossRef CAS PubMed.
- T. Vlaykova, P. Laurila, T. Muhonen, M. Hahka-Kemppinen, A. Jekunen and K. Alitalo, et al. Prognostic value of tumour vascularity in metastatic melanoma and association of blood vessel density with vascular endothelial growth factor expression, Melanoma Res., 1999, 9(1), 59–68 CrossRef CAS PubMed.
- T. Nishida, H. Yoshitomi, S. Takano, S. Kagawa, H. Shimizu and M. Ohtsuka, et al. Low Stromal Area and High Stromal Microvessel Density Predict Poor Prognosis in Pancreatic Cancer, Pancreas., 2016, 45(4), 593–600 CrossRef CAS PubMed.
- P. P. Provenzano, C. Cuevas, A. E. Chang, V. K. Goel, D. D. Von Hoff and S. R. Hingorani, Enzymatic targeting of the stroma ablates physical barriers to treatment of pancreatic ductal adenocarcinoma, Cancer Cell, 2012, 21(3), 418–429 CrossRef CAS PubMed.
- V. P. Chauhan, Y. Boucher, C. R. Ferrone, S. Roberge, J. D. Martin and T. Stylianopoulos, et al. Compression of pancreatic tumor blood vessels by hyaluronan is caused by solid stress and not interstitial fluid pressure, Cancer Cell, 2014, 26(1), 14–15 CrossRef CAS PubMed.
- A. Barău, A. Ruiz-Sauri, G. Valencia, M. D. C. Gómez-Mateo, L. Sabater and A. Ferrandez, et al. High microvessel density in pancreatic ductal adenocarcinoma is associated with high grade, Virchows Arch., 2013, 462(5), 541–546 CrossRef PubMed.
- A. B. Cortot and P. A. Janne Resistance to targeted therapies as a result of mutation(s) in the target, in Targeted Therapies: Mechanisms of Resistance, Humana Press, 2011, pp. 1–31 (Molecular and Translational Medicine) Search PubMed.
- D. Gioeli The dynamics of the cell signaling network, implications for targeted therapies, in Targeted Therapies: Mechanisms of Resistance, ed. D. Gioeli, Humana Press, 2011 Search PubMed.
- B. L. Aken, S. Ayling, D. Barrell, L. Clarke, V. Curwen and S. Fairley, et al. The Ensembl gene annotation system, Database, 2016, 2016 Search PubMed.
- C. W. Law, Y. Chen, W. Shi and G. K. Smyth, voom: Precision weights unlock linear model analysis tools for RNA-seq read counts, Genome Biol., 2014, 15(2), R29 CrossRef PubMed.
- D. B. Allison, G. L. Gadbury, M. Heo, J. R. Fernandez, C.-K. Lee and T. A. Prolla, et al. A mixture model approach for the analysis of microarray gene expression data, Comput. Stat. Data Anal., 2002, 39, 1–20 CrossRef.
- D. Gioeli, W. Wunderlich, M. Dunlap-Brown, V. Gordon, J. Wulfkuhle and E. Petricoin, et al. Compensatory Signaling in Response to Targeted Therapeutics: The Case of MEK Inhibition in Prostate Cancer, in Molecular Targets for Cancer, Whistler BC, 2007 Search PubMed.
- V. D. Blondel, J.-L. Guillaume, R. Lambiotte and E. Lefebvre, Fast unfolding of communities in large networks, J. Stat. Mech.: Theory Exp., 2008, 2008(10), P10008 CrossRef.
- A. Fabregat, S. Jupe, L. Matthews, K. Sidiropoulos, M. Gillespie and P. Garapati, et al. The Reactome Pathway Knowledgebase, Nucleic Acids Res., 2018, 46(D1), D649–D655 CrossRef CAS PubMed.
- N. L. Bray, H. Pimentel, P. Melsted and L. Pachter, Near-optimal probabilistic RNA-seq quantification, Nat. Biotechnol., 2016, 34, 525–527 CrossRef CAS PubMed.
- M. E. Ritchie, B. Phipson, D. Wu, Y. Hu, C. W. Law, W. Shi and G. K. Smyth, Limma powers differential expression analyses for RNA-sequencing and microarray studies, Nucleic Acids Res., 2015, 43(7), e47 CrossRef PubMed.
- M. D. Robinson and A. Oshlack, A scaling normalization method for differential expression analysis of RNA-seq data, Genome Biol., 2010, 11, R25 CrossRef PubMed.
- J. T. Leek, W. E. Johnson, H. S. Parker, E. J. Fertig, A. E. Jaffe, J. D. Storey, Y. Zhang and L. C. Torres, sva: Surrogate Variable Analysis. R package version 3.30.1, 2019 Search PubMed.
Footnote |
| † Electronic supplementary information (ESI) available. See DOI: 10.1039/c8lc00755a |
| This journal is © The Royal Society of Chemistry 2019 |