 Open Access Article
Acoustophoretic focusing effects on particle synthesis and clogging in microreactors†
Zhengya
Dong
 a,
David
Fernandez Rivas
 b and
Simon
Kuhn
 *a
*a
aKU Leuven, Department of Chemical Engineering, Celestijnenlaan 200F, 3001 Leuven, Belgium. E-mail: simon.kuhn@kuleuven.be
bMesoscale Chemical Systems Group, MESA+ Institute, University of Twente, 7500 AE Enschede, The Netherlands
First published on 18th December 2018
Abstract
The handling of solids in microreactors represents a challenging task. In this paper, we present an acoustophoretic microreactor developed to manage particles in flow and to control the material synthesis process. The reactor was designed as a layered resonator with an actuation frequency of 1.21 MHz, in which a standing acoustic wave is generated in both the depth and width direction of the microchannel. The acoustophoretic force exerted by the standing wave on the particles focuses them to the channel center. A parametric study of the effect of flow rate, particle size and ultrasound conditions on the focusing efficiency was performed. Furthermore, the reactive precipitation of calcium carbonate and barium sulfate was chosen as a model system for material synthesis. The acoustophoretic focusing effect avoids solid deposition on the channel walls and thereby minimizes reactor fouling and thus prevents clogging. Both the average particle size and the span of the particle size distribution of the synthesized particles are reduced by applying high-frequency ultrasound. The developed reactor has the potential to control a wide range of material synthesis processes.
I. Introduction
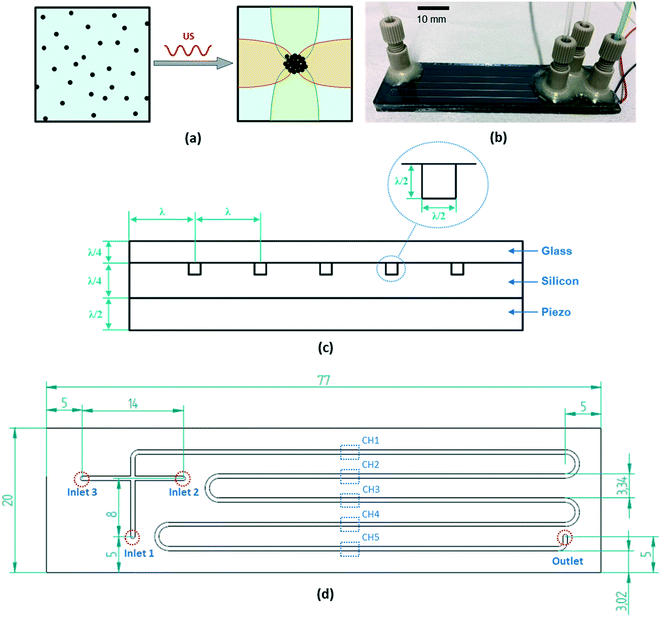
Reactors with structured elements on the micro- and milli-scale are increasingly used for the continuous manufacturing of chemicals and pharmaceuticals,1–4 due to their advantages like large specific surface area, enhanced heat/mass transfer, intrinsic safety and fast scale-up.5–7 Despite these advantages, one major drawback greatly limiting their application is their susceptibility to channel clogging for flows containing solid particles.8–10 This problem needs to be addressed as a significant portion of industrial processes involves solids (e.g. catalysts, solid reactants, products or by-products).11,12 For example, about 80% of pharmaceuticals and 60% of fine chemicals are manufactured in crystalline form.13 Several strategies have been proposed to circumvent the clogging issue, such as using multi-phase flow,14,15 modifying the wettability of the channel surface,8,11 and ultrasound (US) actuation.16–18 Low frequency (18–200 kHz) US has been proven as an effective method to prevent channel clogging by exploiting its strong cavitation effect, which stirs the fluid in the channel19,20 and leads to breakup of particle agglomerates.16,21 However, continuous sonication with low frequency US leads to a considerable temperature increase (from a few tens to a hundred degrees centigrade) inside the fluidic channels, due to the high acoustic power input (usually in the range of 10–1000 W).16,19 Consequently, controlling the temperature in these ultrasonic microreactors is crucial to enable their application to temperature sensitive reactions.High frequency US, using frequencies in the order of MHz, is a more energy effective way to manipulate particles. It is known as acoustophoresis or acoustofluidics and has been widely studied in microfluidics, as reviewed in a series of 23 tutorials in Lab on a Chip.22 An ultrasonic standing wave is formed in these chips and the generated acoustic radiation force pushes particles to the pressure node.23–25 Acoustophoresis is proven to be a simple, generic and robust strategy to separate,26 concentrate,27 position and trap28 biological cells and micro-particles.29,30 However, besides these bio/chemical analysis and clinical applications, the effect of acoustophoresis on material synthesis and clogging in microreactors has not been studied. In this paper, an acoustophoretic microreactor is built and applied to particulate material synthesis by utilizing the standing wave to focus the produced particles in the channel center, thereby avoiding solid deposition on the channel walls (as depicted in Fig. 1). This focusing effect would not only prevent solid clogging in the channel, but also result in a more uniform residence time distribution of the particles. The latter is very important as microreactors are usually characterized by laminar flow, with the corresponding parabolic velocity profile resulting in a wide residence time distribution,31 which is also reflected in a broad particle size distribution.32,33 As we show in this work, applying acoustophoretic focusing results in a more uniform residence time distribution and correspondingly narrower particle size distribution.
In conclusion, we apply the acoustophoretic force to manage solid particles and control the material synthesis process in a microreactor. For this, an energy efficient ultrasonic microreactor limiting the fluid temperature increase during sonication was built. Compared to acoustofluidic chips for bio/chemical applications where the sonicated channel has a simple structure and relatively small volume (normally below 5 μL, see details in ESI† section 1), our reactor has a large liquid volume (105 μL) and a complex channel geometry, which is sonicated in its entirety, and therefore provides high throughput. At first, inert polystyrene particles were injected into the reactor to characterize the acoustic focusing efficiency depending on particle size, flow rate and applied ultrasound power. Then two model material synthesis processes, the reactive precipitation of calcium carbonate (CaCO3) and barium sulfate (BaSO4), were performed. The effect of ultrasound focusing on the pressure drop (which reflects channel clogging) and the particle size distribution was studied.
II. Materials and methods
A. Acoustophoresis microreactor design
An acoustofluidic system is usually fabricated by simply gluing a piezoelectric transducer to a microfluidic chip. However, to achieve maximum energy efficiency of the device, the choice of the material and the design of the geometrical parameters are extremely important as the acoustic field in the device is very sensitive to them.34–37 Here, we follow the design principle of a layered acoustic resonator, as introduced in Lenshof et al.'s tutorial review.34 A standing wave (with a half or quarter wavelength) is formed in the thickness direction of each reactor layer, thus minimizing the acoustic energy loss and maximizing the acoustic pressure amplitude in the channel. As shown in Fig. 1(c), the piezo plate layer has a thickness of a half wavelength, which means it works at its first thickness resonance mode, producing a strong electromechanical coupling with large displacement amplitude. Both the matching layer (the silicon reactor plate) and the cover layer (glass plate) have a thickness of a quarter wavelength, which maximizes the acoustic energy transmitted to the fluid channel.38 In the transversal direction, there is also a resonance mode in the silicon reactor, whose width matches 6 wavelengths. These resonance modes in both the thickness and transversal direction of the reactor generate a strong two-dimensional half standing wave in the square channel. In this way, the particles suspended in the fluid can be focused to the center point of the channel, as shown in Fig. 1(a). To maximize the resonance efficiency, the reactor material should have a much larger acoustic impedance compared to the fluid (to facilitate wave reflection at the channel wall) and also a high-quality factor value representing a low acoustic loss.34 Therefore, silicon was chosen for the reactor layer and glass for the cover layer, with their material properties listed in Table 1.| Layer | Material | Acoustic impedance (106 Ω) | Wave-length (mm) | Designed thickness (λ) | Designed thickness (mm) | Actual thickness (mm) |
|---|---|---|---|---|---|---|
| Cover | Glass | 12.6 | 4.62 | 1/4 | 1.16 | 1.10 |
| Fluid | Water | 1.49 | 1.23 | 1/2 | 0.61 | 0.60 |
| Reactor | Silicon | 19.8 | 6.95 | 1/4 | 1.74 | 1.79 |
| Transducer | PZ26 | 31.4 | 3.34 | 1/2 | 1.67 | 1.67 |
During the design process, the area and thickness of the piezoelectrical transducer (80 × 20 × 1.67 mm3, Pz26, Ferroperm, Denmark) was selected first. The fundamental resonance frequency of this piezo plate is 1.22 MHz, which was chosen as the design frequency of our resonant reactor. The thickness of the silicon, fluid and glass layer was then determined by the fraction of the wavelength corresponding to this frequency, as shown in Table 1. However, due to the difficulty of purchasing commercial silicon and glass plates with this exact thickness, the fabrication process was continued with plate thicknesses close to the designed values (Table 1). The square fluidic channel (0.6 × 0.6 mm2) was fabricated in the silicon plate by plasma etching. The glass cover plate was then anodically bonded to seal the channel. The piezoelectric transducer was coupled to the back of the silicon plate by using epoxy glue (301, Epotek) cured at room temperature for one day. Two wires were soldered to the piezo plate for electrical actuation, as shown in Fig. 1(b). The configuration of the microchannel on the silicon plate is shown in Fig. 1(d). The meandering main channel consists of five parallel straight channel sections (labeled as CH1, CH2, CH3, CH4 and CH5), which are connected by semicircular bends (radius 1.67 mm), resulting in a total channel length of 292 mm and a volume of 105 μL. The reactor has three inlets and one outlet. A nanoport was glued to each inlet/outlet, which was then connected to PTFE tubing (OD 1/16′′, ID 1000 μm for the inlets and ID 500 μm for the outlet).
To characterize the resonance modes of the reactor, the admittance curve of the fabricated reactor was measured, along with that of the piezo transducer, as depicted in Fig. 2. In the admittance curve of the transducer, significant resonance peaks were observed around 1.20 MHz, which is close to its theoretical fundamental resonance frequency (98%). After coupling the transducer to the silicon/glass reactor, the main resonance peak shrinks, but still stays at around 1.20 MHz. This indicates that the resonance frequency of the whole reactor closely matches the one of the transducer, which validates the layered resonator design. It is worth noting that the resonance peaks are slightly changed when the reactor is connected to the entire setup via nanoports and tubing, as also shown in Fig. 2. As discussed in the later sections, it was found that the optimum operating frequency for particle focusing is 1.21 MHz, which is close to this measured resonance frequency (99%).
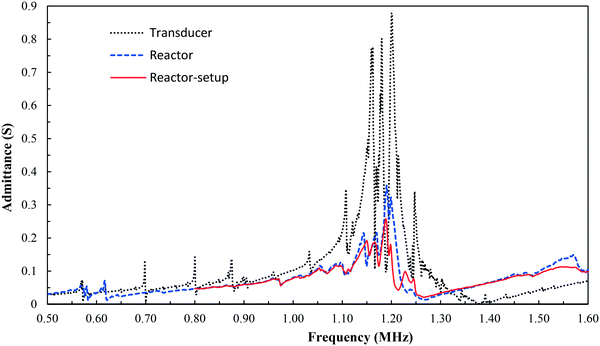 | ||
| Fig. 2 Admittance curves for the piezoelectric transducer, the stand-alone reactor, and the reactor with fluidic connections (nanoports and tubing). | ||
B. Experimental setup and procedures
The piezoelectrical transducer was actuated by a power amplifier (1040L Bell Electronics) driven with a sinusoidal wave from a signal generator (33500B, Keysight). A digital oscilloscope (DSOX1102A, Keysight) was used to monitor the applied voltage and the working frequency. The applied net power on the reactor was measured by a power coupler (E&I CPL-LF). For the applied voltage range of 9–25 Vpp (peak-to-peak voltage) in our experiment, the measured input power is 0.3–3.3 W, which is nearly one order of magnitude lower than that of most low frequency ultrasonic reactors.16,18,19 It is worth noting that no cavitation was observed due to the low applied power and high US frequency. Microscopy images of the particles in the microchannel were acquired by using a multifunctional stereo microscope (SZ25 Nikon) equipped with a controller to accurately position the objective vertically (Z-position) and a high-speed camera (Mini UX100, Photron). The reactor was placed horizontally on the microscope base, which is illuminated from the top of the glass cover plate by an epi-illumination system.39 During the experiment, the objective focus was adjusted to the center of the fluidic channel using the Z-position controller. For imaging of the fluorescent polystyrene particles (Nile Red, Spherotech), a P2-EFL RFP Filter Cube was used. The typical position of the images taken at the five channel sections is indicated by the dashed rectangles in Fig. 1(d).For the experiments using the inert polystyrene particles, a suspension of polystyrene spheres (average size: 2, 3 and 10 μm, Spherotech) in deionized water was injected into the microchannel through inlet 1 by a syringe pump. Tween20 (0.01 wt%) was added to the solution as a surfactant to reduce the adhesion of the microspheres to the channel wall. Before injection into the microreactor, the microsphere suspension was first sonicated in an ultrasonic bath and then continuously stirred to prevent settling. After each experiment, the reactor channel was washed first with ethanol and then deionized water.
For the synthesis of CaCO3, two aqueous solutions of CaCl2 and Na2CO3 were injected into the reactor through inlets 1 and 2. The molar concentrations (12 mM or 32 mM) and flow rates (0.2–1.2 ml min−1) of the two solutions were identical. To measure the pressure drop across the channel length, a microfluidic pressure sensor (PS2-15 psi, Elveflow) was connected to the PTFE tube at inlet 2. The pressure sensor has an accuracy of 2 mbar and the data was recorded at a frequency of 1 Hz. To measure the particle size distribution a semi on-line method was used. The slurry at the outlet of the reactor was directly delivered to the dispersion cell (Hydro SV, Malvern) of a Malvern 3000 laser sizer. The collected sample (with a volume of 1 ml) was then measured immediately. The cell was filled with 6 ml ethanol to dilute the sample and to minimize the continued reaction in the cell. Before collecting the sample, the system was run for 5 reactor volumes to ensure steady-state. Each condition was measured three times and only the average result was used. After each experiment, the reactor was washed first with diluted hydrochloric acid and then deionized water to ensure complete removal of the particles. In a subsequent step we investigated the synthesis of BaSO4, which follows an analogous experimental procedure as for CaCO3. Aqueous solutions of BaCl2 and Na2SO4 (at equal concentrations of 5 mM) were injected into the reactor. For the determination of the particle size distribution samples of 0.8 ml were collected at the reactor outlet using the dispersion cell (Hydro SV, Malvern), which was initially filled with 6 ml pure water. After each experiment, the reactor was first flushed with water and then thoroughly washed with Na4EDTA (0.2 M), which chelates BaSO4 and forms a soluble barium-EDTA complex, thus removing any remaining particles from the channel.40
III. Results and discussion
A. Inert particle focusing
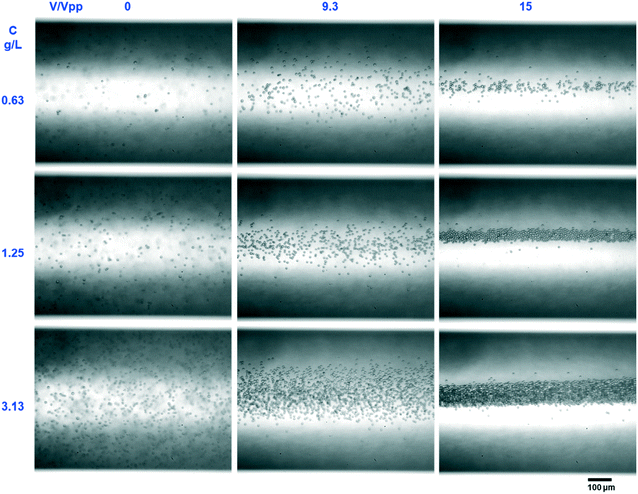
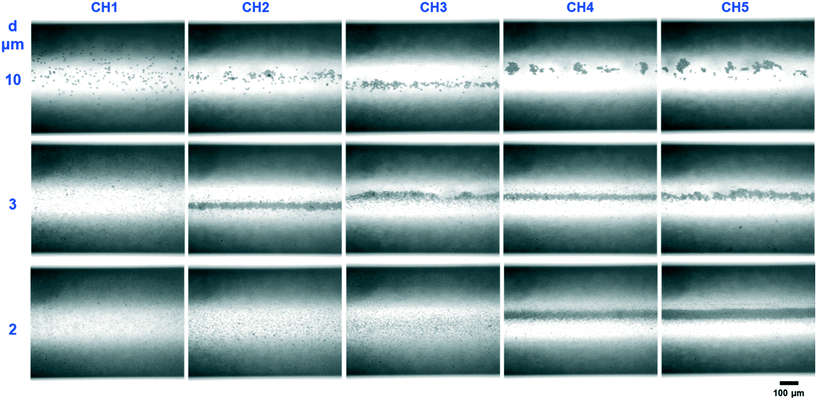
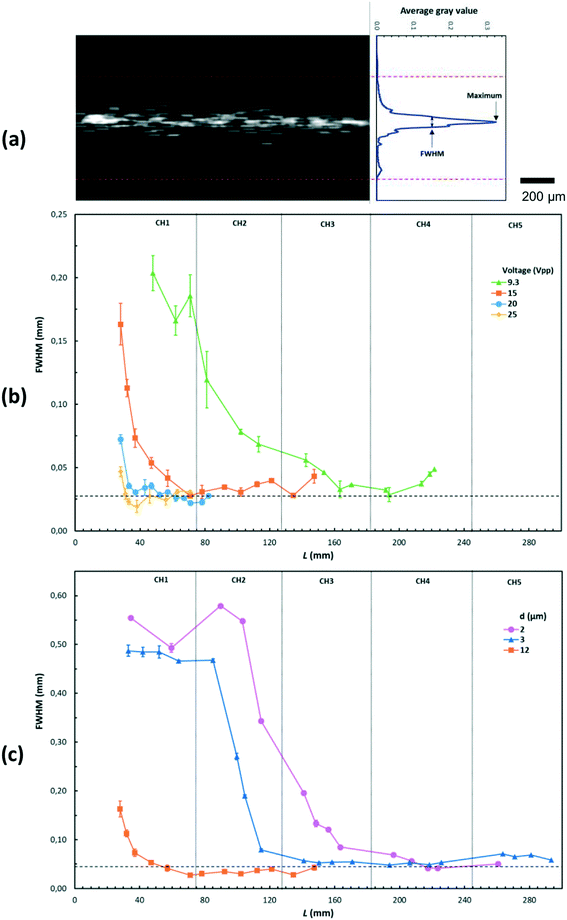
The acoustophoretic focusing effect of the ultrasonic microreactor was first investigated with inert polystyrene particles. At the beginning, a suspension of 10 μm particles (1,25 g L−1) was continuously fed into the microchannel. Subsequently, the actuation frequency of the piezoelectric transducer was swept in a value range centered around the design frequency to identify the optimum condition. The strongest particle focusing effect was observed at a frequency of 1.21 MHz, which was then chosen for all experiments. The effect of ultrasound on particle focusing is shown in Fig. 3, which depicts microscopy images taken in the center of the first channel (CH1). Without US actuation, the particles are randomly distributed in both the width and depth direction. Upon US irradiation the particles are pushed towards the channel centerline by the acoustophoretic force. The acoustophoretic force magnitude scales with the applied voltage, at 9.3 Vpp the particles are focused in the depth direction, but not yet fully in width direction, while at 15 Vpp a distinct focusing band is observed which indicates strong focusing in both directions. As it is also observed in Fig. 3, the focusing extent does not change when increasing the particle concentration from 0.63 g L−1 to 3.13 g L−1, which indicates that the acoustic focusing method is applicable to a range of particle concentrations. Fig. 4 shows images of polystyrene particles of different mean sizes (d = 2, 3, and 10 μm) at different positions in the microchannel. It is observed that the length needed to focus the particles depends on their size, for the smallest considered particles of 2 μm the focusing band is only observed from the 4th straight channel section (CH4) on. This is expected, as the acoustophoretic force changes linearly with the particle volume, which means the smaller the particle size, the weaker the acoustic force (see also ESI† section 5).23,41 Consequently, the acoustic force is the strongest for the 10 μm particles, which leads to cluster formation in the focusing band for long US exposure, visible in the channel sections CH4 and CH5 in Fig. 4. This cluster formation is caused by the combined action of the primary and secondary acoustic radiation forces, the latter attracting particles to each other when they are close enough.23,42 This phenomenon has been widely reported in acoustic trapping systems which are usually operated at low flow rates (or stagnant conditions) with long US exposure time.28,34To quantitively characterize the particle focusing extent, images of fluorescent polystyrene particles were taken along the microchannel. These images were post-processed in MATLAB by averaging the gray value along the length of the captured channel section, generating a fluorescence intensity profile in the channel width direction, as shown in Fig. 5(a). The particle focus band is then represented by the gray value peak in the profile. The full width at half maximum (FWHM) of the peak was then chosen to quantify the width of the focusing band, with lower values representing higher focusing extent. The development of the focusing extent along the microreactor for different applied voltages (9.3–25 Vpp) and mean particle sizes (d = 2,3, and 12 μm) is shown in Fig. 5(b) and (c). For all investigated conditions, the FWHM decreases with increasing channel length, reaching a final width of 20–40 μm (indicated by the dashed horizontal lines in Fig. 5(b) and (c)). The quantified focusing extent confirms the observations from Fig. 4, a higher applied voltage and larger particle sizes result in lower FWHM, in other words, stronger focusing extent. Furthermore, the particle focusing time, tF, can be calculated as:
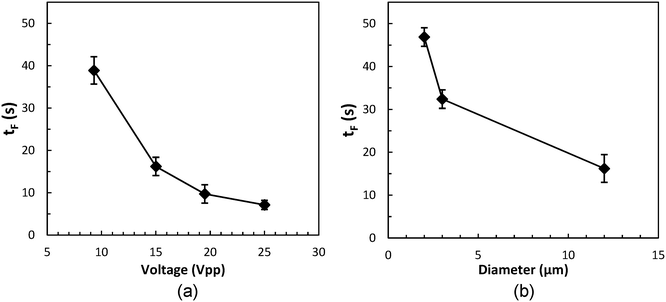 | ||
| Fig. 6 Influence of (a) applied US voltage and (b) mean particle size on the focusing time tF. The particle size in Fig. 6(a) is 12 μm. The applied voltage in Fig. 6(b) is 15 Vpp. | ||
In summary, these inert particle experiments validate the layered resonator design, where the two-dimensional standing wave focuses the particles to the channel centerline. The parametric study of particle size, concentration, flow rate and applied voltage offers guidelines for the subsequent application to particle synthesis. Furthermore, it is worth noting that due to the high energy efficiency and low power input of this ultrasonic reactor, the temperature increase is limited to a maximum of 6 °C for long-term experiments (see ESI† Fig. S1).
B. CaCO3 synthesis
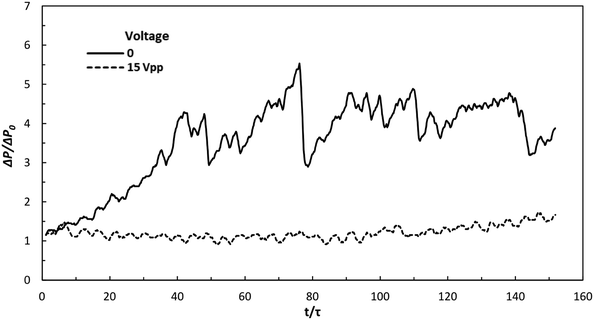
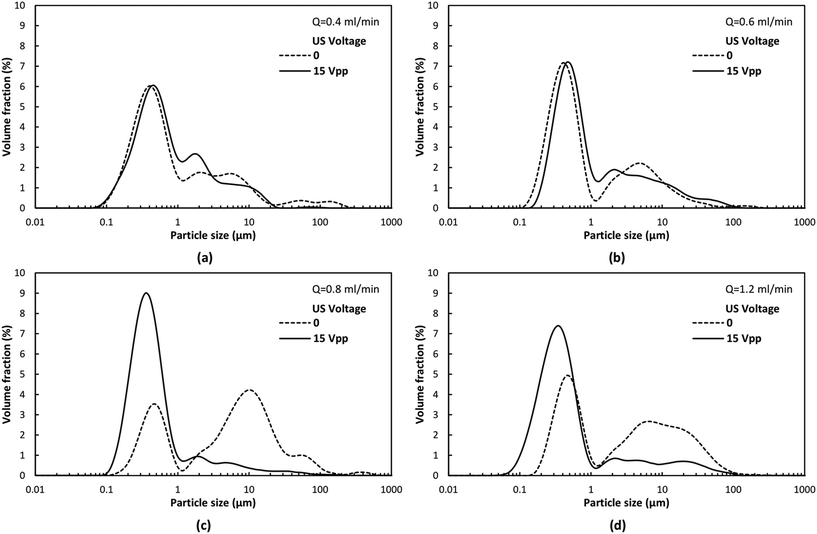
To evaluate the influence of this acoustophoretic focusing effect on particulate material synthesis, the precipitation of calcium carbonate (CaCO3) was chosen as a model process. In fact, CaCO3 is a very important product and has been widely used amongst others as filler material for paint, plastic, paper and bio-ceramic.43,44 Such industrial applications always require well-defined CaCO3 powders with uniform shape and size.45–47 As revealed by the inert particle focusing experiments, the designed ultrasonic microreactor focusses the particles on the centerline of the microchannel, from which a more uniform particle residence time distribution and correspondingly narrower particle size distribution is expected. Furthermore, particle focusing will also prevent solid deposition on the channel walls, thus preventing clogging. To address the latter, the pressure drop across the microreactor was measured during the particle synthesis process in silent and sonicated conditions, see Fig. 7. With no US applied, the pressure drop increases rapidly and reaches a level of approximately 4.5 times of the single phase (pure solvent) pressure drop after a time corresponding to 40 reactor volumes, and afterwards fluctuates around this level. While no complete channel clogging was observed, the flow rate was found to fluctuate and sometimes leakage was induced at the inlet of the reactor. When applying US at 15 Vpp the pressure drop is stable for a long time. Only a slight increase (about 25%) is observed after 140 reactor volumes. The rapid increase of the pressure drop without US is caused by particles adhering to the channel wall, which bridge with flowing particles in the fluid to form large agglomerates, resulting in more particles accumulated in the channel, as shown in Fig. S3(a).† The fluctuation of pressure drop is due to the periodic build up of agglomerates and their subsequent removal once the pressure reaches a large enough value. When US is applied, the acoustophoretic force focuses the particles to the center, preventing particle attachment to the channel wall, as shown in Fig. S3(b).† Thus, fewer agglomerates are formed and no particles are retained in the microchannel, resulting in stable pressure over time.The size distribution of the produced particles was then analyzed using laser diffraction, as shown in Fig. 8. The average size (D50) and the span (D90–D10) of the distribution is depicted in Fig. 9. It is observed that the particle size distribution is multimodal, and consists of a population of primary particles in the nanometer range and a population of aggregates in the size of 1–100 μm (which can also be seen in the SEM images of Fig. S4†). Without sonication, the amount of aggregates increases with increasing flow rate, leading to larger average size and span at higher flow rate, as shown in Fig. 9. This observation agrees with another study reporting the precipitation of CaCO3 particles in a segmented flow tubular mini-reactor.45 Increased flow rates leads to improved mixing, which will result in an increased particle concentration and thus an increased probability for particle agglomeration.
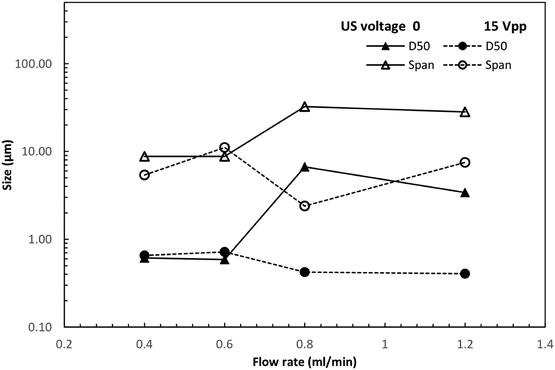 | ||
| Fig. 9 Effect of US on average CaCO3 particle size (D50) and span (D90–D10) at different flow rates. | ||
Upon ultrasound actuation, a similar mean particle size and span of the size distribution is observed independent of the applied flow rate (see Fig. 9). The reduction in mean particle size and span is especially pronounced at increased flow rates (0.8 and 1.2 ml min−1). At these flow rates, the number of primary particles is remarkably increased and only a limited amount of micro-sized aggregates are formed. The size range of the primary particles is also reduced by sonication, with the minimum size approaching 50 nm at a flow rate of 1.2 ml min−1. The significant reduction of average particle size and span under sonication at higher flow rate can be explained by the acoustophoretic focusing effect. As discussed earlier, when the reacting particles are focused to the channel centerline, they will experience a higher velocity and a narrower velocity distribution (compared to the original parabolic velocity profile without sonication), resulting in a shorter growth time and more uniform residence time distribution. It is also worth noting that the acoustophoretic force and hence the desired focusing effect experienced by the CaCO3 particles is larger compared to polystyrene particles (see ESI† section 5).
For the lowest flow rates of 0.4 and 0.6 ml min−1 no significant difference between the size distribution with and without sonication is observed in Fig. 8 and 9. This is due to two reasons: firstly, the lower flow rates also result in reduced mixing in the T-junction of the microreactor, and thus, as outlined above, reducing the particle concentration and therefore also the probability of forming agglomerates. Secondly, when no US is applied clusters of particles are formed in the microchannel (see ESI† Fig. S5), which are not observed under sonication. However, these clusters are not fully aggregated yet, and therefore break-up during stirring in the laser-diffraction measurement, and are thus not captured in Fig. 8 and 9. This visual observation of a favorable US effect even at lower flow rates indicates that acoustophoretic focusing enables the synthesis of smaller particles with narrower size distribution in a wide flow rate range.
C. Application potential
The developed acoustophoretic microreactor has the potential to be applied to a wide range of material synthesis processes. However, special attention has to be paid to its operational window with respect to parameters like particle size, particle concentration and applied ultrasound voltage. It is reported that the acoustophoretic focusing effect mainly works for particles in the size range of 0.2–100 μm.23,34 For sizes below this range, the radiation force is too small to obtain efficient focusing as it scales linearly with the particle volume (see ESI† section 5). For sizes above this range, the effect of gravity will increase and sedimentation may occur, especially for particles with large density.34With respect to the particle concentration, acoustic focusing is not significantly affected up to a particle volume fraction of 1%.48 Increased void fractions will lead to a significant local change of the suspension density (and therefore its speed of sound). In turn, it will have detrimental effects on the acoustic field and can suppress the formation of a stable standing acoustic wave in the channel cross-section.48,49 Furthermore, large particle void fractions will also increase the effect of the secondary radiation force,28 which results in attractive particle–particle interaction and therefore increased agglomeration. As outlined above, agglomeration might increase the particle size outside the range where the acoustophoretic force can be applied successfully. In our focusing experiments with polystyrene particles we varied the concentration between 0.63–3.13 g L−1 (see Fig. 3), which corresponds to void fractions between 0.06–0.3%, and therefore well below the threshold of 1%.
The applied ultrasound voltage for acoustofluidic focusing applications is in the range of 10–50 Vpp. When exceeding these values the influence of acoustic streaming (which scales with the applied US voltage) might become significant.50 Besides, operating microreactors with large applied voltages requires active cooling measures to control the reactor and fluid temperature.
The synthesis of BaSO4 was investigated to further prove the applicability of the developed acoustophoretic microreactor. This particle synthesis process is chosen because the particle sizes reported in literature and used in industry is in the range of 1–20 μm,51,52 which falls in the operating size range of acoustic focusing outlined above. More importantly, BaSO4 is a very dense material (4.5 g cm−3), which corresponds to a 66% increase compared with the density of CaCO3 (2.71 g cm−3). However, the strength of the acoustophoretic force for BaSO4 is only 13% higher than that for CaCO3 particles of the same size (see ESI† section 5). Therefore, this system allows to evaluate the efficiency of acoustophoretic focusing acting against gravity for high density particles.
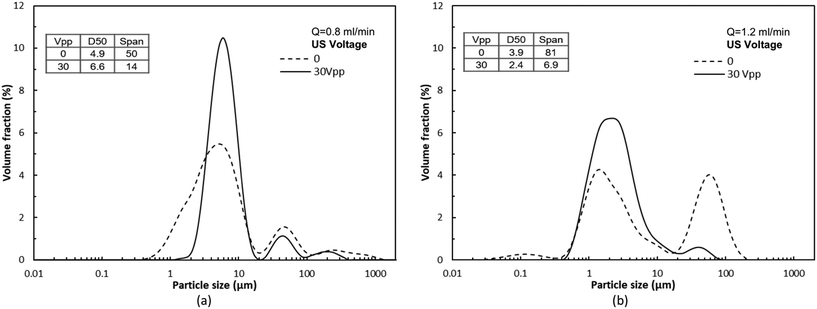
The experimental procedure for the BaSO4 synthesis is similar to CaCO3, with an applied US voltage of 30 Vpp. The resulting particle size distribution at flow rates of 0.8 ml min−1 and 1.2 ml min−1 is shown in Fig. 10. The size distribution without sonication consists of a population of primary particles in the size range 0.1–20 μm, and a population of aggregates in the range 20–500 μm. Upon the application of US, narrower particle size distributions were observed, with more primary particles and only a limited amount of large aggregates formed due to acoustophoretic focusing, as was observed for the synthesis of CaCO3.
The acoustic focusing effect is more distinct for the flow rate of 1.2 ml min−1 where the amount of aggregates without sonication is larger compared to 0.8 ml min−1. Furthermore, for the flow rate of 0.8 ml min−1, a remarkable decrease in the width of the primary particle size distribution was observed under sonication. Small particles in the range 0.5–2 μm, which are present when no US is applied, are no longer observed under sonication, but a larger number of particles in the range 2–20 μm was observed. This observation can be explained by the fact that the acoustophoretic focusing effect can cause particles to interact and to form clusters or aggregates. It is reported that primary BaSO4 particles in the range of 0.1–1 μm have a large adhesive interaction potential, and thus form stable aggregates of a few micrometers, especially at high particle concentrations.53,54
As a result of the acoustophoretic focusing, the span of the particle size distribution for both flow rates is significantly reduced. The span under sonication is only 28% and 8% of that without sonication for a flow rate of 0.8 and 1.2 ml min−1 respectively. These results clearly indicate that the developed acoustophoretic microreactor is also able to control the synthesis of denser particles.
IV. Conclusions
A high frequency ultrasonic microreactor was developed to manage particles in flow and control the material synthesis process. The reactor was designed as a layered resonator, in which a standing wave is generated in both the depth and width direction of the channel, focusing particles to the channel centerline by the acoustophoretic force. Inert particle experiments show that the focusing effect exists in the entire channel, which has a large volume and a complex geometry, compared to the single straight channel used in most acoustofluidic chips. This focusing effect not only prevents clogging of the microchannel, but also leads to smaller particle sizes and a narrower size distribution. The reactive precipitation of calcium carbonate (CaCO3) was first studied as a model system. It was found that both the average size and span of the size distribution for the produced particles are reduced by one order of magnitude by sonication at higher flow rate. Furthermore, the application of US resulted in a stable pressure drop for long operation times, which conclusively illustrates that high frequency US effectively prevents channel fouling and clogging. The synthesis of BaSO4 was also investigated to further prove the applicability of the developed acoustophoretic microreactor. Narrower particle size distributions with a span of only 8–28% of the obtained span without sonication are observed, indicating that this method is also able to control the synthesis of denser particles. Another advantage of the developed ultrasonic microreactor is its high energy efficiency and the resulting low temperature rise, especially compared with low frequency reactors.Conflicts of interest
There are no conflicts to declare.Acknowledgements
We acknowledge funding from the European Research Council under the ERC Starting Grant Agreement n. 677169–MicroParticleControl. We thank Dr. Vahid Kazemi Kamyab for discussions on the acoustophoretic effect, Senne Fransen for contributions to the Matlab code for image analysis, and Naghmeh Fatemi and Claire Delacour for discussions on the analysis of pressure drop and particle size distribution data. The support of S. Schlautmann with the reactor fabrication is highly regarded by all authors.References
- K. P. Cole and J. M. Groh, et al. , Science, 2017, 356, 1144–1150 CrossRef CAS PubMed.
- A. Adamo and R. L. Beingessner, et al. , Science, 2016, 352, 61–67 CrossRef CAS PubMed.
- N. Kockmann, Chim. Oggi, 2017, 35, 33–35 CAS.
- A. Ghaini, M. Balon-Burger, A. Bogdan, U. Krtschil and P. Löb, Chem. Eng. Technol., 2015, 38, 33–43 CrossRef CAS.
- R. L. Hartman and K. F. Jensen, Lab Chip, 2009, 9, 2495–2507 RSC.
- J. Yoshida, H. Kim and A. Nagaki, ChemSusChem, 2011, 4, 331–340 CrossRef CAS PubMed.
- K. S. Elvira, X. Casadevall i Solvas, R. C. R. Wootton and A. J. de Mello, Nat. Chem., 2013, 5, 905–915 CrossRef CAS PubMed.
- R. L. Hartman, Org. Process Res. Dev., 2012, 16, 870–887 CrossRef CAS.
- R. L. Hartman, J. R. Naber, N. Zaborenko, S. L. Buchwald and K. F. Jensen, Org. Process Res. Dev., 2010, 14, 1347–1357 CrossRef CAS.
- M. Schoenitz, L. Grundemann, W. Augustin and S. Scholl, Chem. Commun., 2015, 51, 8213–8228 RSC.
- K. Wu and S. Kuhn, Chim. Oggi, 2014, 32, 62–66 Search PubMed.
- D. M. Roberge, L. Ducry, N. Bieler, P. Cretton and B. Zimmermann, Chem. Eng. Technol., 2005, 28, 318–323 CrossRef CAS.
- I. Houson, Process understanding: For scale-up and manufacture of active ingredients, John Wiley & Sons, 2011 Search PubMed.
- S. L. Poe, M. A. Cummings, M. P. Haaf and D. T. McQuade, Angew. Chem., Int. Ed., 2006, 45, 1544–1548 CrossRef CAS PubMed.
- M. Rhee, P. M. Valencia, M. I. Rodriguez, R. Langer, O. C. Farokhzad and R. Karnik, Adv. Mater., 2011, 23, H79–83 CrossRef CAS PubMed.
- S. Kuhn, T. Noel, L. Gu, P. L. Heider and K. F. Jensen, Lab Chip, 2011, 11, 2488–2492 RSC.
- T. Horie, M. Sumino, T. Tanaka, Y. Matsushiat, T. Ichimura and J. Yoshida, Org. Process Res. Dev., 2010, 14, 405–410 CrossRef CAS.
- D. F. Rivas, P. Cintas and H. J. G. E. Gardeniers, Chem. Commun., 2012, 48, 10935–10947 RSC.
- Z. Dong, C. Yao, X. Zhang, J. Xu, G. Chen, Y. Zhao and Q. Yuan, Lab Chip, 2015, 15, 1145–1152 RSC.
- Z. Dong, S. Zhao, Y. Zhang, C. Yao, Q. Yuan and G. Chen, AIChE J., 2017, 63, 1404–1418 CrossRef CAS.
- F. Castro, S. Kuhn, K. Jensen, A. Ferreira, F. Rocha, A. Vicente and J. A. Teixeira, Chem. Eng. J., 2013, 215, 979–987 CrossRef.
- H. Bruus, Lab Chip, 2011, 11, 3579–3580 RSC.
- L. A. Kuznetsova and W. T. Coakley, Biosens. Bioelectron., 2007, 22, 1567–1577 CrossRef CAS PubMed.
- I. Leibacher, S. Schatzer and J. Dual, Lab Chip, 2014, 14, 463–470 RSC.
- L. Gao, C. W. Shields IV, L. M. Johnson, S. W. Graves, B. B. Yellen and G. P. Lopez, Biomicrofluidics, 2015, 9, 014105 CrossRef PubMed.
- E. J. Fong, A. C. Johnston, T. Notton, S. Y. Jung, K. A. Rose, L. S. Weinberger and M. Shusteff, Analyst, 2014, 139, 1192–1200 RSC.
- D. Carugo, T. Octon, W. Messaoudi, A. Fisher, M. Carboni, N. R. Harris, M. Hill and P. Glynne-Jones, Lab Chip, 2014, 14, 3830–3842 RSC.
- M. Evander and J. Nilsson, Lab Chip, 2012, 12, 4667–4676 RSC.
- A. Lenshof, C. Magnusson and T. Laurell, Lab Chip, 2012, 12, 1210–1223 RSC.
- B. W. Drinkwater, Lab Chip, 2016, 16, 2360–2375 RSC.
- S. R. L. Gobert, S. Kuhn, L. Braeken and L. C. J. Thomassen, Org. Process Res. Dev., 2017, 21, 531–542 CrossRef CAS.
- A. Gunther, S. A. Khan, M. Thalmann, F. Trachsel and K. F. Jensen, Lab Chip, 2004, 4, 278–286 RSC.
- F. Castro, S. Kuhn, K. Jensen, A. Ferreira, F. Rocha, A. Vicente and J. A. Teixeira, Chem. Eng. Sci., 2013, 100, 352–359 CrossRef CAS.
- A. Lenshof, M. Evander, T. Laurell and J. Nilsson, Lab Chip, 2012, 12, 684–695 RSC.
- P. Glynne-Jones, R. J. Boltryk and M. Hill, Lab Chip, 2012, 12, 1417–1426 RSC.
- M. Bora and M. Shusteff, Lab Chip, 2015, 15, 3192–3202 RSC.
- P. Hahn, O. Schwab and J. Dual, Lab Chip, 2014, 14, 3937–3948 RSC.
- M. Ohlin, Ultrasonic fluid and cell manipulation, PhD thesis, KTH Royal Institute of Technology, 2015 Search PubMed.
- M. Wiklund, H. Brismar and B. Onfelt, Lab Chip, 2012, 12, 3221–3234 RSC.
- K. Dunn and T. F. Yen, Environ. Sci. Technol., 1999, 33, 2821 CrossRef CAS.
- H. Bruus, Lab Chip, 2012, 12, 1578–1586 RSC.
- M. Groschl, Acustica, 1998, 84, 432–447 Search PubMed.
- Y. Boyjoo, V. K. Pareek and J. Liu, J. Mater. Chem. A, 2014, 2, 14270–14288 RSC.
- G. Trippa and R. Jachuck, Chem. Eng. Res. Des., 2003, 81, 766–772 CrossRef CAS.
- R. Vacassy, J. Lemaitre and H. Hofmann, AIChE J., 2000, 46, 1241 CrossRef CAS.
- S. K. Kurt, M. Akhtar, K. D. P. Nigam and N. Kockmann, Ind. Eng. Chem. Res., 2017, 56, 11320–11335 CrossRef CAS.
- A. Yashina, F. Meldrum and A. deMello, Biomicrofluidics, 2012, 6, 022001 CrossRef PubMed.
- M. W. H. Ley and H. Bruus, Lab Chip, 2016, 16, 1178–1188 RSC.
- S. Karthick and A. K. Sen, Phys. Rev. E, 2017, 96, 052606 CrossRef CAS PubMed.
- M. Wiklund, R. Green and M. Ohlin, Lab Chip, 2012, 12, 2438–2451 RSC.
- D. C. Y. Wong, Z. Jaworski and A. W. Nienow, Chem. Eng. Sci., 2001, 56, 727–734 CrossRef CAS.
- M. Kucher, D. Babic and M. Kind, Chem. Eng. Process., 2006, 45, 900–907 CrossRef CAS.
- J. Baldyga, M. Jasinska and W. Orciuch, Chem. Eng. Technol., 2003, 26, 334–340 CrossRef CAS.
- D. L. Marchisio, A. A. Barresi, M. Garbero, M. Vanni and G. Baldi, Proceedings of the 15th International Symposium on Industrial Crystallization, Sorrento, Italy, 2002, pp. 171–176 Search PubMed.
Footnote |
| † Electronic supplementary information (ESI) available. See DOI: 10.1039/c8lc00675j |
| This journal is © The Royal Society of Chemistry 2019 |

