
 Open Access Article
 This Open Access Article is licensed under a Creative Commons Attribution-Non Commercial 3.0 Unported Licence
238U/235U measurement in single-zircon crystals: implications for the Hadean environment, magmatic differentiation and geochronology†
François L. H.
Tissot
 *ab,
Mauricio
Ibanez-Mejia
c,
Patrick
Boehnke
de,
Nicolas
Dauphas
d,
David
McGee
a,
Timothy L.
Grove
a and
T. Mark
Harrison
f
*ab,
Mauricio
Ibanez-Mejia
c,
Patrick
Boehnke
de,
Nicolas
Dauphas
d,
David
McGee
a,
Timothy L.
Grove
a and
T. Mark
Harrison
f
aDepartment of the Earth, Atmospheric and Planetary Sciences, Massachusetts Institute of Technology, Cambridge, MA 02139, USA
bThe Isotoparium, Division of Geological and Planetary Sciences, California Institute of Technology, Pasadena, CA 91125, USA. E-mail: tissot@caltech.edu
cDepartment of Earth and Environmental Sciences, University of Rochester, Rochester, NY 14608, USA
dDepartment of the Geophysical Sciences, The University of Chicago, Chicago, IL 60637, USA
eChicago Center for Cosmochemistry, Chicago, IL, USA
fDepartment of Earth, Planetary, and Space Sciences, University of California, Los Angeles, CA 90095, USA
First published on 26th July 2019
Abstract
Owing to the challengingly small amounts of uranium (U) they contain, the isotopic composition (238U/235U) of single zircon grains has never been measured. Leveraging methods we designed for analysis of small sample amounts and modern MC-ICPMS instruments, we show that precise (±0.04 to ±0.25‰) single-zircon 238U/235U measurements are now possible. We report data for 31 single grains from the Jack Hills conglomerate, and 3 reference zircon localities (FC-1, R33 and Temora). Consistent with the reducing conditions implied by the small Ce anomalies of many Hadean zircon, Jack Hills grains display only small δ238U variations (from −0.60 to −0.12‰). The distribution is centered on the average chondritic and bulk continental crust value, arguing against the widespread existence of Oklo-type reactors in the early Earth. The subtle δ238U variations in Jack Hills zircons are more plausibly explained by a small (∼0.10%) mass-dependent equilibrium isotope fractionation between at least one U-bearing accessory mineral and silicate melts, during magmatic differentiation under reducing conditions. In contrast, the large δ238U difference between pooled titanite and pooled zircon fractions from the Fish Canyon Tuff sample suggests larger isotope effects during igneous fractional crystallization under oxidizing conditions (∼QFM+2), with preferential removal of 235U from the melt and into zircon, and/or other accessory phases. We estimate that ∼50% of zircon dated by the CA-ID-TIMS method would be amenable to single-grain U isotope measurements, making this method widely applicable to future studies. This would enable (i) improvements in precision and accuracy of U–Pb and Pb–Pb dates, (ii) accurate investigation of U-series disequilibrium contribution to U–Pb discordance, and (iii) accurate re-evaluation of U decay constants.
1. Introduction
Earth's known rock record only extends to ∼4.05 Ga (ref. 1). As the only older lithic record, detrital zircons are thus key to understanding the development of crustal rocks and surface environments during the Hadean,2,3 an eon which presumably saw the waning of the extraterrestrial bombardment,4,5 the emergence of life,6,7 and the establishment of continents.2,8 Numerous chemical and isotopic proxies have therefore been investigated in Hadean zircons and their inclusions (review in ref. 3) but owing to the small size of typical zircon crystals (<10–50 μg), and the even smaller size of Hadean grains (∼1 μg), geochemical studies are limited to the main constituents of, and minor/trace elements partitioning strongly into, zircons. While uranium (U) concentrations are routinely measured in zircons for U–Pb geochronology, the U isotopic composition of single-zircon grains has never been measured. Indeed, significant analytical challenges are associated with the analysis of the small amounts of U contained by individual crystals, which are invariably regarded as insufficient to allow for the precise determination of 238U/235U ratios.9–12Building on and improving upon methodologies we developed to precisely and accurately determine the 238U/235U of small samples,13 we show that modern Multi-Collector ICPMS instruments provide sufficient precision to resolve U isotopic differences between single zircon grains. We present a detailed description of these analytical methods, and report data for 31 single grains from the Jack Hills conglomerate (Western Australia) and 3 reference zircon localities. Using data obtained on Jack Hills zircons we assess whether natural nuclear reactors were present in the Hadean, the possible causes of fractionation in magmatic settings, and the implications for high-precision U–Pb and Pb–Pb geochronology. Finally, we discuss the current limitations and future improvements that could help make single-zircon 238U/235U determinations more accurate, precise, and practical for a variety of applications in geochemistry and geochronology.
2. Motivations
There are several reasons why quantifying the 238U/235U of single zircons, and Hadean ones in particular, is important:(1) Oklo-type natural nuclear reactors may have been more prevalent in the Hadean,14 when 235U abundance was above the ∼3% threshold required for self-sustained neutron-induced fission (∼17% at 4 Ga and ∼25% at 4.5 Ga). So far, the Oklo U ore deposit (Gabon), which reached criticality ∼1.78 Ga, is the only known natural reactor. In the reactor zones, neutron-induced 235U fission led to 238U/235U increases that often reached +100 to +475‰ (ref. 15). These isotopic variations are 100× larger than those documented in other geological settings, which only range from −4.1 to +4.8‰ (ref. 16 and 17). It is thus conceivable that if Oklo-type reactors were common in the Hadean, even small amounts of highly anomalous U isotope composition could have contaminated sediments and igneous rocks and potentially be recorded in Hadean zircons.
(2) While stable isotopic variations were originally thought to be confined to low-T settings and light elements, many studies have now documented variations in high-T settings for heavy elements, reflecting both equilibrium and kinetic processes (review in ref. 18). For U, mass-dependent isotope fractionations (∝1/T2) should be small at magmatic temperatures (∼−0.07‰ at 850 °C), but nuclear volume effects19 (∝1/T) could induce larger U isotopic fractionations (∼+0.61‰ at 850 °C). At this writing, the U isotopic systematics of igneous rocks is still in its infancy (review in ref. 17), but the available data suggests the existence of mineral specific U isotope effects,9,11,12 which can result in magmatic differentiation trends, as observed in angrite meteorites.20 Based on studies of different isotopic systems, the potential drivers of U isotope fractionation in magmatic settings would be temperature, the nature of the minerals sequestering U, the redox state of the melt, and the extent of crystallization.
(3) Uranium isotopic variations can affect the accuracy and precision of U–Pb and Pb–Pb dates.9,16,20,21 Establishing a timeline for the dramatic biological/environmental changes that punctuated Earth's history relative to their potential triggers (e.g., asteroid impacts, large igneous province emplacements) requires, however, highly precise and accurate absolute ages.22–26 These ages are typically obtained using U–Pb and/or Pb–Pb dates of zircons found within ash layers/lavas associated with the events of interest. Based on the limited U isotope variability (∼0.7‰) observed in pooled zircons (i.e., multi-grain dissolutions) of different ages and localities, a recommended 238U/235U was established for accessory-phase geochronology.9,12 This approach assumes that the recommended value encompasses all 238U/235U variability in natural zircon, such that age accuracy after uncertainty propagation is not compromised. The central limit theorem, however, predicts that pooled zircons should display less scatter in their 238U/235U than single zircon grains (Fig. 1). Therefore, the only robust way to quantify 238U/235U variability in natural zircons is via single-grain U isotope analysis, without which sub-permil accuracy and precision in U–Pb and Pb–Pb geochronology is, a priori, not possible.
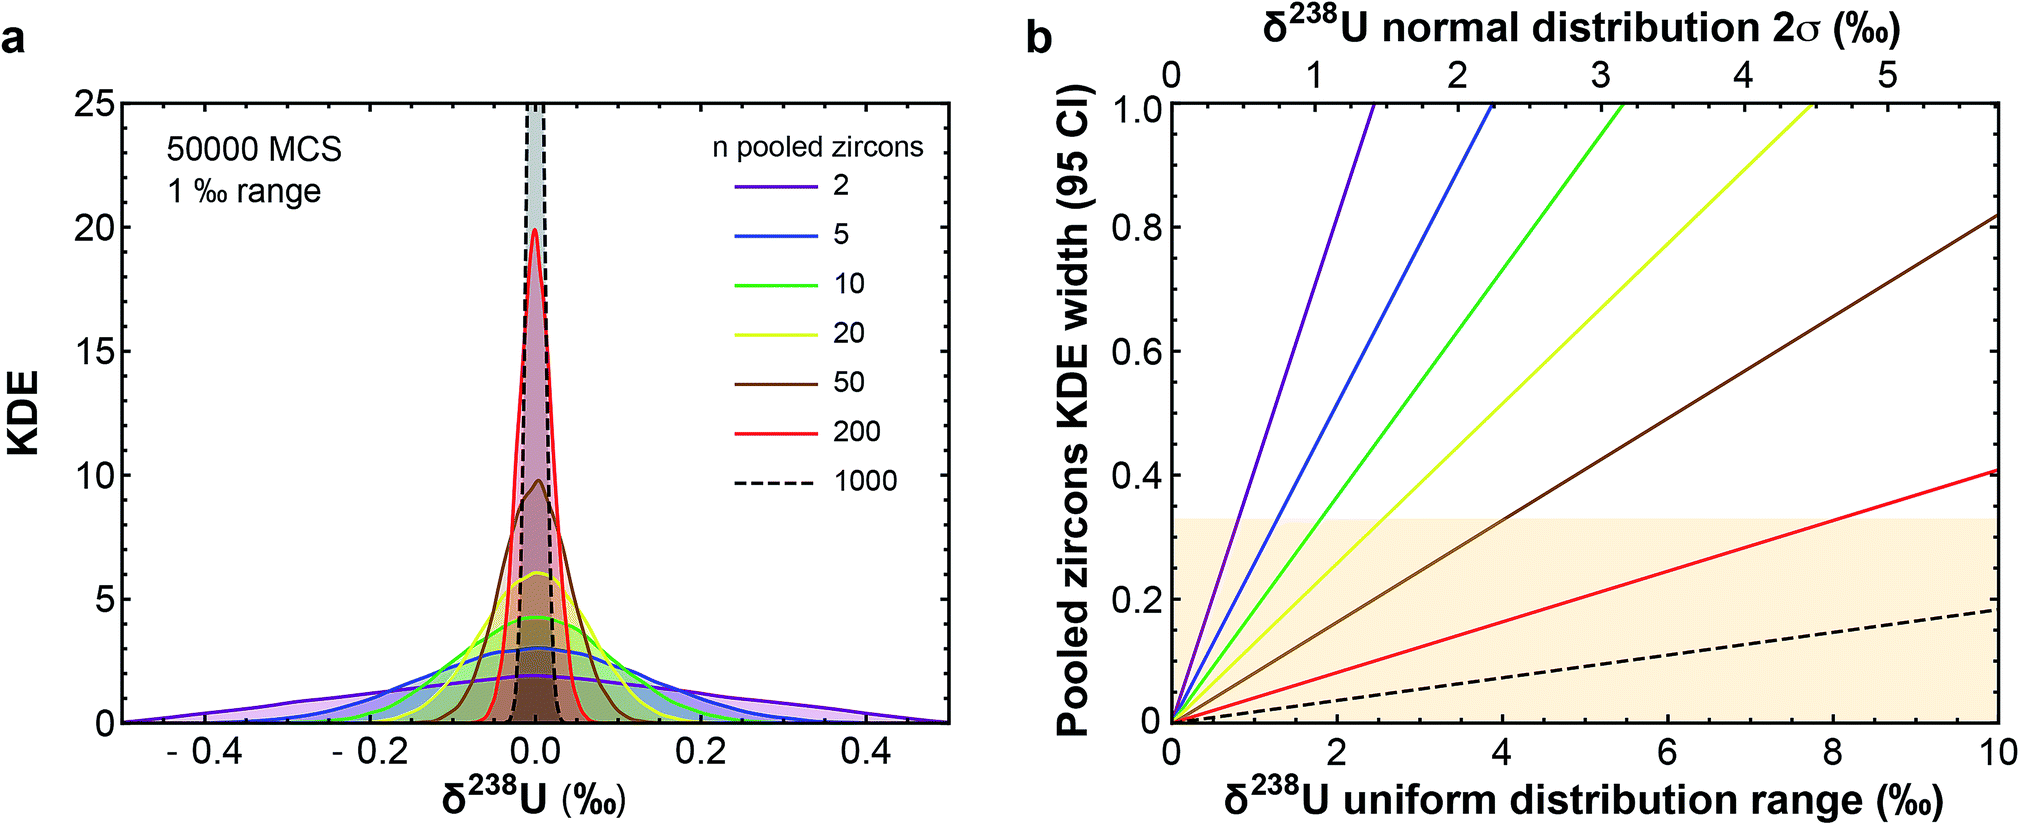 | ||
Fig. 1 (a) Kernel Density Estimator (KDE) of the U isotope composition of n pooled zircons randomly picked from a uniform distribution centered on δ238U = 0 and of total range, 1‰. KDEs are built using 50![[thin space (1/6-em)]](https://www.rsc.org/images/entities/char_2009.gif) 000 randomly generated sets (Monte-Carlo Simulations, MCS) of n zircons, with n between 2 and 1000. (b) Width (95% confidence interval) of the KDE of n pooled zircons predicted by the central limit theorem as a function of the dispersion in the δ238U distribution from which the grains are randomly picked (lower x-axis, range covered by a uniform distribution; upper x-axis, 2σ of a normal distribution). For n zircons picked within a distribution of variance σ2, the variance of the mean δ238U of the n zircons tends toward 000 randomly generated sets (Monte-Carlo Simulations, MCS) of n zircons, with n between 2 and 1000. (b) Width (95% confidence interval) of the KDE of n pooled zircons predicted by the central limit theorem as a function of the dispersion in the δ238U distribution from which the grains are randomly picked (lower x-axis, range covered by a uniform distribution; upper x-axis, 2σ of a normal distribution). For n zircons picked within a distribution of variance σ2, the variance of the mean δ238U of the n zircons tends toward  . The uncertainty on the recommended 238U/235U for use in geochronology (yellow horizontal band) is based on the analysis of hundreds to thousands of pooled zircons9,12 and could theoretically hide a true δ238U variability of greater than 10‰ in individual zircons. . The uncertainty on the recommended 238U/235U for use in geochronology (yellow horizontal band) is based on the analysis of hundreds to thousands of pooled zircons9,12 and could theoretically hide a true δ238U variability of greater than 10‰ in individual zircons. | ||
3. Samples
To explore 238U/235U variability between single zircon grains, we selected 3 reference zircon localities (FC-1, R33 and Temora; 206Pb/238U ages between 418 and 1095 Ma; ref. 27) and 31 Jack Hills zircon crystals with apparent 207Pb/206Pb dates between ∼3.3 and 4.2 Ga (ref. 28). As all Jack Hills crystals formed before oxidative conditions could solubilize U in water as UVI (ref. 29), their composition should be purely controlled by magmatic processes and/or U contributions from Oklo-type reactors. Resolvable U isotope variations in such samples would thus imply that systematic investigation of 238U/235U ratios could provide further insight into the magmatic history of individual detrital zircons, which otherwise lack geological context.4. Methods
All Teflon labware (i.e., PFA vials and beakers from Savillex) was pre-cleaned 3× with boiling aqua regia (3:1 mixture of HCl:HNO3), followed by boiling Milli-Q water. Glass vials were cleaned with acetone and MQ water. Centrifuge tubes were leached with 50% (vol) HCl overnight and/or rinsed 3× with MQ water.
4.1. Direct zircon dissolution
Zircon dissolution followed a protocol adapted from those used in geochronology studies.30,31 Single zircon crystals were pipetted into clean Teflon beakers and cleaned by successive leaching in HCl (16 drops of 6.2 M) and HNO3 (16 drops of 5 M) on a hotplate at ∼90–100 °C for 30–60 min. These steps aimed at removing any iron oxide coatings, secondary alteration products and/or adsorbed U present at the surface of the grains or in small factures within them. After each leaching step, the grains were sonicated in a hot water bath for 10 min, and the acid solution was transferred to a 2 mL plastic vial. The solution recovered was used to check the amount of U released in each step (Table S1†). Each grain was further rinsed with 10 drops of MQ, which were also collected and added to the leachate solution, before complete dry-down of the grains at 130 °C on hotplate. After cleaning, the grains were transferred to Teflon micro-capsules and immersed in 3 drops (∼75 μL) of 28 M HF. The micro-capsules were then placed on a Teflon holder accommodating up to 18 capsules, itself placed inside a high-volume Parr® acid digestion vessel and into an oven at 210 °C for 48 h. After the HF dissolution step, the samples were dried and converted to HCl by addition of 3 drops of 6.2 M HCl and placed back in the Parr vessel and in the oven at 180 °C for 24 h.4.2. Zircon chemical abrasion followed by dissolution
To assess the effects of thermal annealing and chemical abrasion on 238U/235U ratios, six of the Jack Hills samples were treated with the chemical abrasion method,30 which selectively dissolves radiation damaged subdomains that have may have not remained closed systems for U and Pb isotopes (as leachates), and leaves behind crystalline domains more likely to have remained in closed-systems (as residues). After the HCl and HNO3 cleaning steps, zircons were annealed in quartz vials at 900 °C for 62 h using a Thermolyne benchtop muffle furnace, transferred to Teflon micro-capsules, and chemically abraded with 28 M HF at 210 °C for 7 h 45 min (in a Parr vessel). The abrasion solutions were collected in clean 7 mL Teflon beakers and the grains were rinsed twice with 8 drops of MQ, which was also collected and added to the leachate solution. The undigested part of the zircons (i.e., residues) were again covered with 3 drops (∼75 μL) of concentrated HF and placed back in the Parr vessel and in the oven at 210 °C for 48 h to achieve complete digestion of the residues. After the HF dissolution step, conversion to a chloride matrix was done by adding 3 drops of 6.2 M HCl and placing the Parr vessel at 180 °C for 24 h. The solutions containing the fully digested residue thus obtained were finally transferred to clean 7 mL Teflon beakers.4.3. Uranium concentration measurements and spiking
After digestion, all sample solutions (from cleaning, direct dissolution, chemical abrasion and residue digestion) were dried down completely and re-dissolved in 3 mL of 3 M HNO3. A 2% aliquot (60 μL) was spiked with ∼0.65 ng of IRMM-3636 double-spike (50.46% of 233U and 49.51% of 236U; ref. 32), diluted with 0.3 M HNO3 to a total volume of 750 μL, and measured using a Nu-Plasma II MC-ICPMS (McGee lab) to determine the amount of U in each sample (Table S1†). Enough IRMM-3636 was then added to each sample to obtain a Uspike/Usample ratio of ∼3–4%: a value recommended by Weyer et al.33 to minimize spike consumption, abundance sensitivity effect of 238U onto 236U, as well as contribution from amplifier noise and counting statistic on 233U and 236U to the measurement uncertainty. To ensure full homogenization of the sample-spike mixture, all samples were completely dried down on hot plate at 150 °C, taken back in 1 mL of concentrated HNO3, evaporated to near dryness and taken back into 2.5 mL of 3 M HNO3 + 0.02 M oxalic acid. The dilute oxalic acid was used to solubilize Zr34 and prevent retention of Zr (which makes up ∼50 wt% of the matrix of zircons) during column chemistry.4.4. Uranium purification for Zr rich samples
Uranium purification was done on U/Teva resin, following a procedure modified from Tissot and Dauphas16 (Table 1). Given the small mass of U (∼1–50 ng) and the large Zr/U atomic ratio of the samples (∼481 for a zircon assuming typical Zr and U concentrations of, respectively, 48 wt% and 2600 ppm, ref. 35), two main modifications were brought to the procedure: (i) a more extensive column cleaning was done to minimize blank contribution from the column, and (ii) sample loading and matrix rinsing used 3 M HNO3 + 0.02 M oxalic acid, as oxalic acid solubilizes Zr.34 The procedure was repeated twice to ensure complete matrix removal. The purified U cuts were then evaporated completely at 175 °C, covered with 0.5–1 mL of HNO3/H2O2 (1:1) and dried completely to remove residual organics, before being taken back in 2 mL of concentrated HNO3 and left on the hotplate overnight at 140 °C to ensure full re-dissolution of the sample.
| Column #1 | Column #2 | |||||
|---|---|---|---|---|---|---|
| Step | Acid type | Volume | Comment | Acid type | Volume | Comment |
| Cleaning | 0.05 M HCI | 40 mL | 0.05 M HCI | 40 mL | ||
| Conditioning | 3 M HNO3 + 0.02 M oxalic acid | 10 mL | 3 M HNO3 + 0.02 M oxalic acid | 10 mL | ||
| Sample loading | 3 M HNO3 + 0.02 M oxalic acid | 2.5 mL | 3 M HNO3 + 0.02 M oxalic acid | 2.5 mL | ||
| Matrix rinse | 3 M HNO3 + 0.02 M oxalic acid | 12 mL | Elution of matrix except U, Th, Np | 3 M HNO3 + 0.02 M oxalic acid | 6 mL | Elution of remaining Zr |
| 3 M HNO3 | 6 mL | Oxalic rinse | ||||
| Conversion to HCl | 10 M HCl | 5 mL | 10 M HCl | 5 mL | ||
| Th rinse | 5 M HCl | 8 mL | Elution of Th | 5 M HCl | 8 mL | Elution of remaining Th |
| Elution | 0.05 M HCl | 15 mL | U is recovered | 0.05 M HCl | 15 mL | U is recovered |
4.5. Yield, blanks and purity checks
For each sample, a 1.5% solution aliquot (30 μL) was taken post-column chemistry, diluted with 380 μL of 0.3 M HNO3, and measured by MC-ICPMS to determine U recovery and Zr/U ratio in the purified solution. Yields, calculated as the ratio of U in the sample solution before and after column chemistry, were between 80 and 98%. The Zr/U atomic ratios varied mostly between 0.1 and 1.2, with four samples showing Zr/U between 1.4 and 6.4 (Table S2†). Given the typical zircon Zr/U atomic ratio of ∼481, these values indicate that ∼99–100% of the Zr was removed during sample purification. The procedural blank was 0.005–0.017 ng U (∼0.002 to 0.7% of sample uranium) and is therefore negligible.4.6. Mass spectrometry
Uranium isotope analyses were performed on two MC-ICPMS instruments: a Nu-Plasma II-ES in the McGee lab (MIT) and a Thermo Finnigan Neptune upgraded to Neptune Plus specifications at the Origins Lab (University of Chicago). The Nu-II was equipped with high-sensitivity dry plasma cones (Ni sampler cones 319–646, Ni skimmer cones 325–294) and sample introduction was done using an Aridus II desolvating nebulizer, yielding a sensitivity of ∼0.75–1.0 V ppb−1 on 238U for a sample flow rate of 100 μL min−1. The Neptune was equipped with a set of Jet sample cones and X-skimmer cones and the sample introduction was also done using an Aridus II, yielding a sensitivity of ∼1.5–1.7 V ppb−1 on 238U for a sample flow rate of 100 μL min−1. The measurements were done in low-resolution mode using static cup configurations (Table 2), and typically comprised 50 or 60 cycles of 4.194 s integration time each. Take up time was set to 60 seconds and rinse time between 450 and 550 seconds were used.| Isotope | 232Th | 233U | 234U | 235U | 236U | 238U |
| Neptune Plus (U. of Chicago) | ||||||
| Cup | L2 | L1 | Axial | H1 | H2 | H3 |
| Resistor (Ω) | 1011 | 1011 | SEM | 1011 | 1011 | 1011 |
|
||||||
| Nu-Plasma II-ES (MIT) | ||||||
| Cup | L4 | L3 | L2 | L1 | Axial | H2 |
| Resistor (Ω) | 1011 | 1011 | 1011 | 1011 | 1011 | 1011 |
Due to the large dynamic range of the U system (238U/235U ∼137.8), measurements at low concentration are counting statistics limited. To achieve high-precision on small samples loads, the volume of solution was adjusted to obtain a signal of at least 10 V on 238U (and ∼77 mV on 235U). Following this protocol, measurements were done at U concentrations between 6.5 and 12 ppb, sometimes in as little as 0.25 mL of solution. Signal intensities were thus between 10 and 20 V for 238U, 165 and 275 mV for 236U and 233U, 77 and 145 mV for 235U, 0.6 to 1.2 mV for 234U (when measured on the Nu-II) and ∼31000 and 60000 cps for 234U (when measured on the axial secondary electron multiplier (SEM) on the Neptune). Estimation of the Neptune “cps-to-volt” conversion factor was done once a week by measuring the 236U/238U in a CRM-112a solution spiked with the IRMM-3636 U double-spike using two different cup configurations: first with both 236U and 238U on Faraday cups, then with 236U on the axial SEM and 238U on a Faraday cup (for more details, see Table S4 in ref. 16). Thorium-232 was monitored during each analysis and the signal was found to be always below 10 mV. Given the extremely low rate of hydride formation relevant to the measurements (∼7 × 10⁻⁷; ref. 16), the residual amount of Th in the sample has virtually no effect on the U isotope analysis. This is clearly demonstrated by replicate analyses of the BCR-2 standard (Fig. 2a and Table S3†), where 232Th signals varied between 0.04 and 2.9 mV, with no impact on either the accuracy or the precision of the U isotope data obtained. Baseline measurements and amplifier gain calibrations were done at least daily.
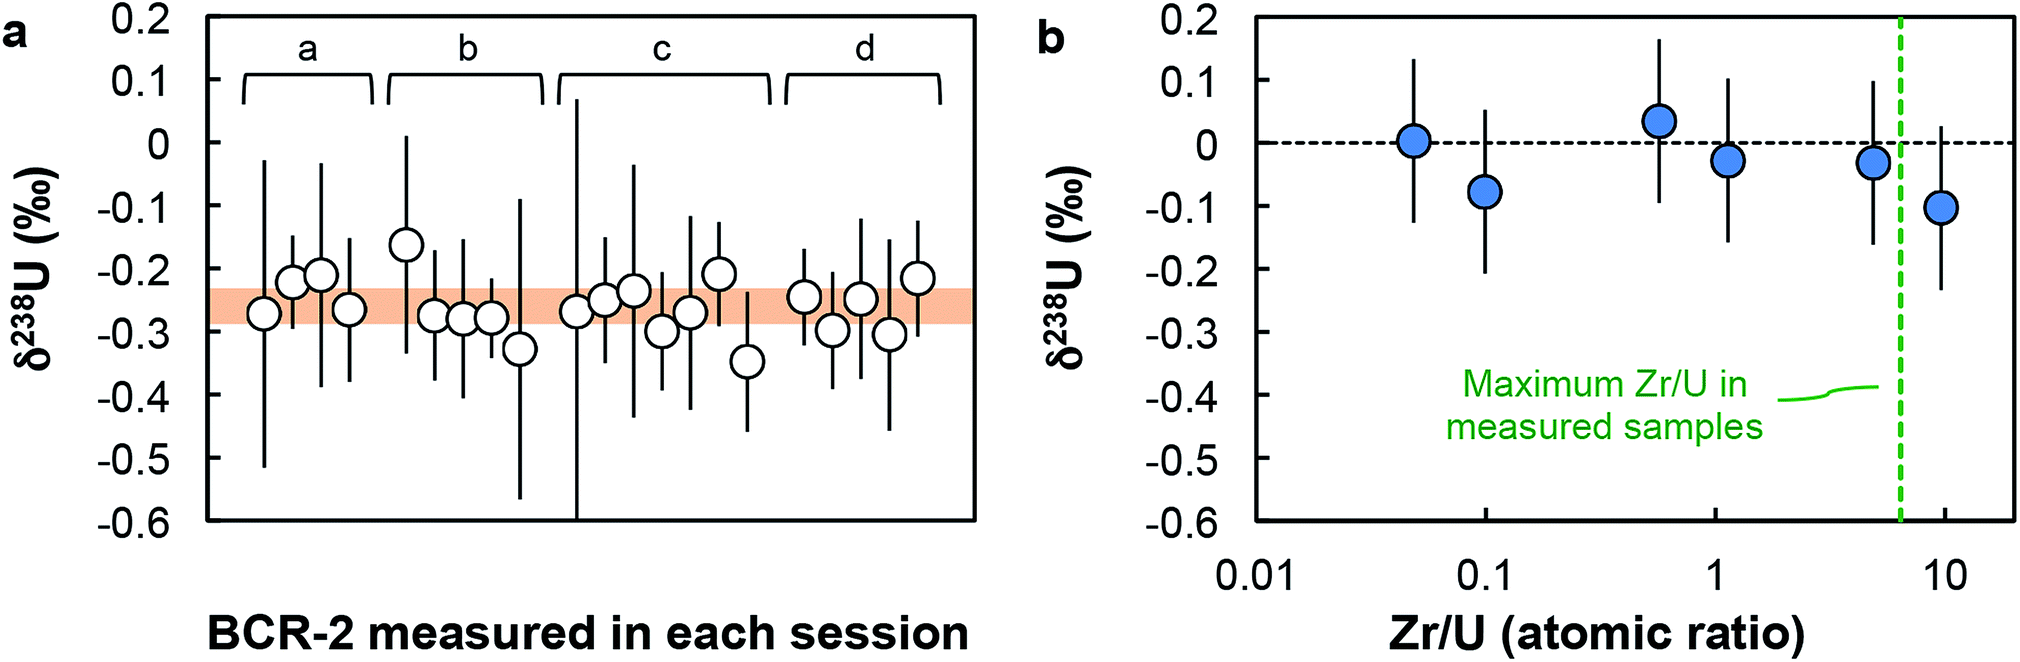 | ||
| Fig. 2 Accuracy tests. (a) δ238U values for geostandard BCR-2 measured during each analytical session (letters a to d refer to sample replicates, see Table S3†). Each data point was acquired using a similar number of solution analyses as the one used for zircons (n between 1 and 8). Every measurement is within error of the recommended average value (orange band) of −0.27 ± 0.05‰ (95% CI). (b) δ238U values measured on Zr-doped CRM-112a solutions vs. Zr/U (atomic) ratios of the doped solutions. All solutions give δ238U values within uncertainty of 0‰, indicating the absence of resolvable matrix effect. | ||
4.7. Instrumental mass bias correction and data reduction
Isotope mass fractionation introduced during chemical separation and mass spectrometry was corrected for using the 233U–236U IRMM-3636 double-spike and the data reduction methodology described in details in Tissot and Dauphas.16 In brief, the raw signals are corrected for: (i) on peak zero, (ii) 238U tail contribution onto 236U, 235U, and 234U signals (respectively, 0.6 × 10⁻⁶, 0.25 × 10⁻⁶, and 0.1 × 10⁻⁶ of the 238U signal intensity), (iii) hydride formation, and (iv) the decay of the spike isotopes (233U and 236U) between the time of spike calibration and sample analysis. The cup configuration and the set of cones used can result in systematic offsets of up to 0.20‰ in the final 238U/235U measured.16 To account for this, every sample was bracketed by measurements of the CRM-112a standard spiked with IRMM-3636 at the same level as the samples. For sample limited analyses, only 18 to 42 cycles could be obtained and the bracketing standard measurements used to calculate the uncertainty were truncated to match the number of cycles measured on the sample.5. Results
5.1 Notations
U isotope compositions are reported as δ238U values relative to the U standard CRM-112a (also named SRM960 or NBL112-a; CRM-145 for the solution form):| δ238U = [(238U/235U)sample/(238U/235U)CRM-112a − 1] × 103. | (1) |
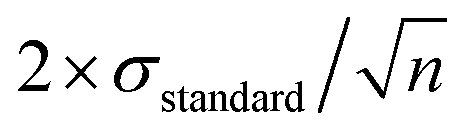
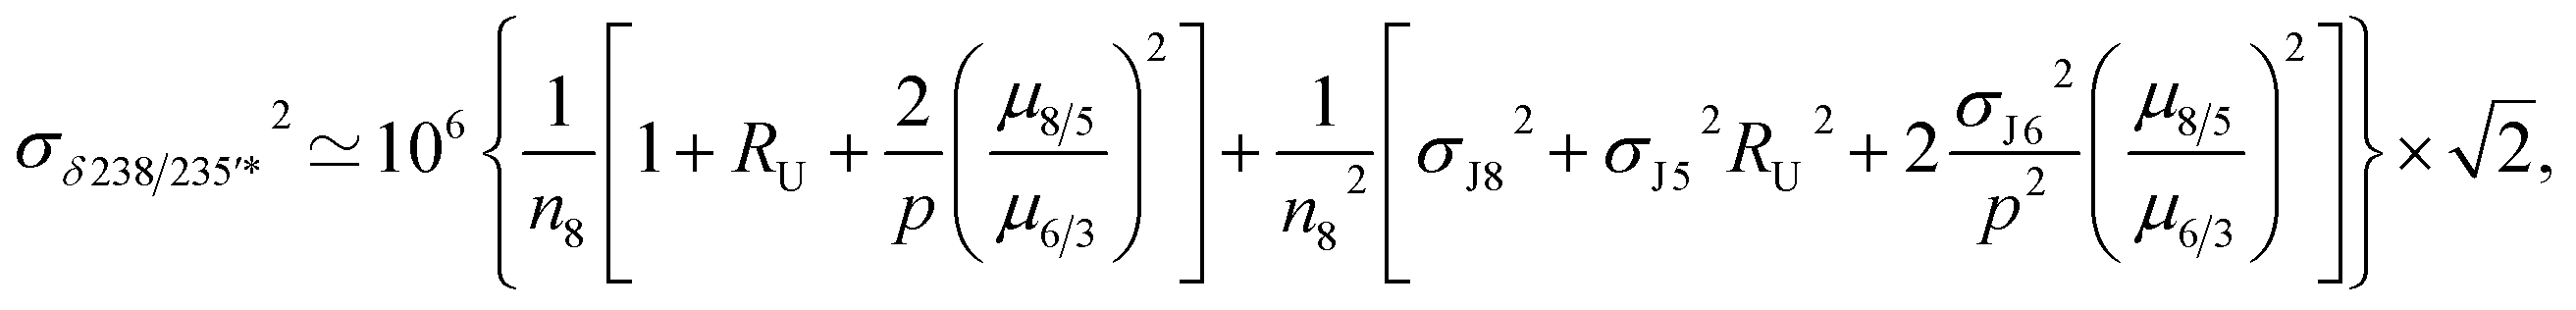
All absolute ratios, including literature data, are calculated assuming 238U/235U = 137.837 ± 0.015 for CRM-112a (ref. 36). This value results from an inter-laboratory calibration effort in which different instruments (i.e., MC-ICPMS and TIMS), reference materials (i.e., IRMM-3636, IRMM-072/15, in-house spikes calibrated against IRMM-074/10 or IRMM-184) and instrumental fractionation correction methods were used. This value is therefore preferred over the often used value of 137.829 ± 0.022 from ref. 9, which was obtained using a single instrument and spike. Uncertainties are reported as “2SE external reproducibility” and calculated as  , where 2 × σstandard is the 2 S.D. daily external reproducibility of repeat measurements of CRM-112a bracketed by itself (measured at the same concentration as the sample), and n is the number of repeat analyses of the same sample solution (typically n = 2–4).
5.2 Data accuracy and precision
Given the analytical challenges posed by the analysis of the low U loads of single zircons (1–50 ng of U), a comprehensive series of precision and accuracy tests were performed (additional details in ESI†).(i) Accuracy test. Four replicates of the Columbia River basalt (BCR-2) were processed and measured with the zircon samples. For each replicate, the average δ238U obtained are both reproducible (−0.23 ± 0.06‰, −0.27 ± 0.05‰, −0.27 ± 0.04‰ and −0.26 ± 0.04‰) and indistinguishable from the average value of −0.27 ± 0.05‰ (95% CI), based on data from 11 studies (see ESI† in ref. 16). Furthermore, the δ238U values measured during each daily session, with a similar number of solution analyses as the one used for zircons (n between 1 and 8), are all within uncertainty of the average value (Fig. 2a).
(ii) Zr doping test. To test whether the residual Zr present in the purified U fractions could result in systematic bias of the 238U/235U analyses, spiked aliquots of CRM-112a were doped with Zr and measured as “unknown” samples. The δ238U obtained on Zr-doped CRM-112a solutions are indistinguishable from 0‰ (Fig. 2b), indicating that the presence of Zr at the levels tested does not affect the U isotope measurements.
(iii) Matrix effects. As the IRMM-3636 double-spike consists almost entirely of 233U and 236U, the presence of matrix effects can be investigated by checking the agreement between the δ238UDS+SSB values, obtained from the double-spike data reduction, and the δ238USSB values, obtained from the raw 238U/235U (striped of the spike 235U and 238U contribution and corrected only for on peak zero, hydride formation and tailing of 238U onto lighter isotopes) bracketed by standard measurements (SSB).16,37 For all but one sample (Fig. 3) there is a very good agreement between these values (δ238UDS − δ238USSB is −0.04‰ on average), indicating that matrix effect did not affect the measurements (except possibly RSES72-18.10 residue).
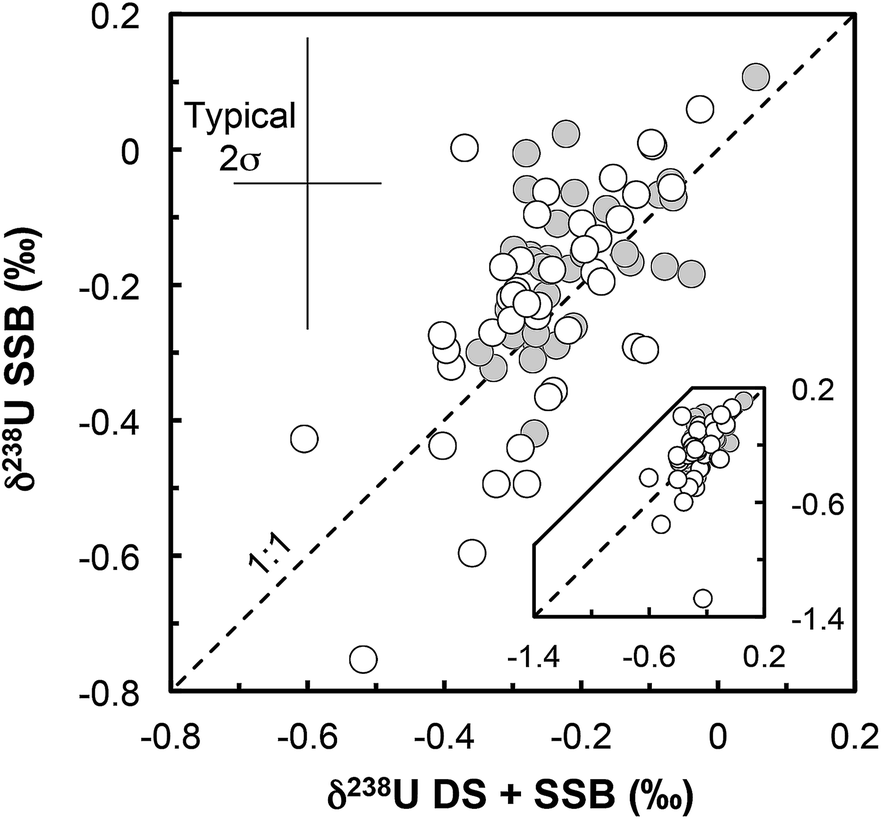 | ||
| Fig. 3 δ 238U values obtained with the double-spike data reduction method (DS + SSB, x-axis) plotted against the raw values measured, striped of the minor 235U and 238U spike contribution (SSB, y-axis). All values are standard bracketed (SSB). The agreement of the two sets of values indicates that no resolvable matrix effects affected the measurements (for more details see ref. 16). Grey circles: geostandards; white circles: zircons. | ||
(iv) Reference zircons. Perhaps the most telling evidence of the reliability of our dataset is the excellent agreement of our reference zircon data with that of Hiess et al.9 and Livermore et al.12 Samples FC-1, R33 and Temora were measured both here and in at least one of these previous studies, and yield identical δ238U values (Fig. 4a). In the present work, analyses were performed with only 7–17 ng of U, while the data from Livermore et al.12 and Hiess et al.9 used 400–801 and 6000–23000 ng of U from pooled zircons, respectively (Fig. 4b).
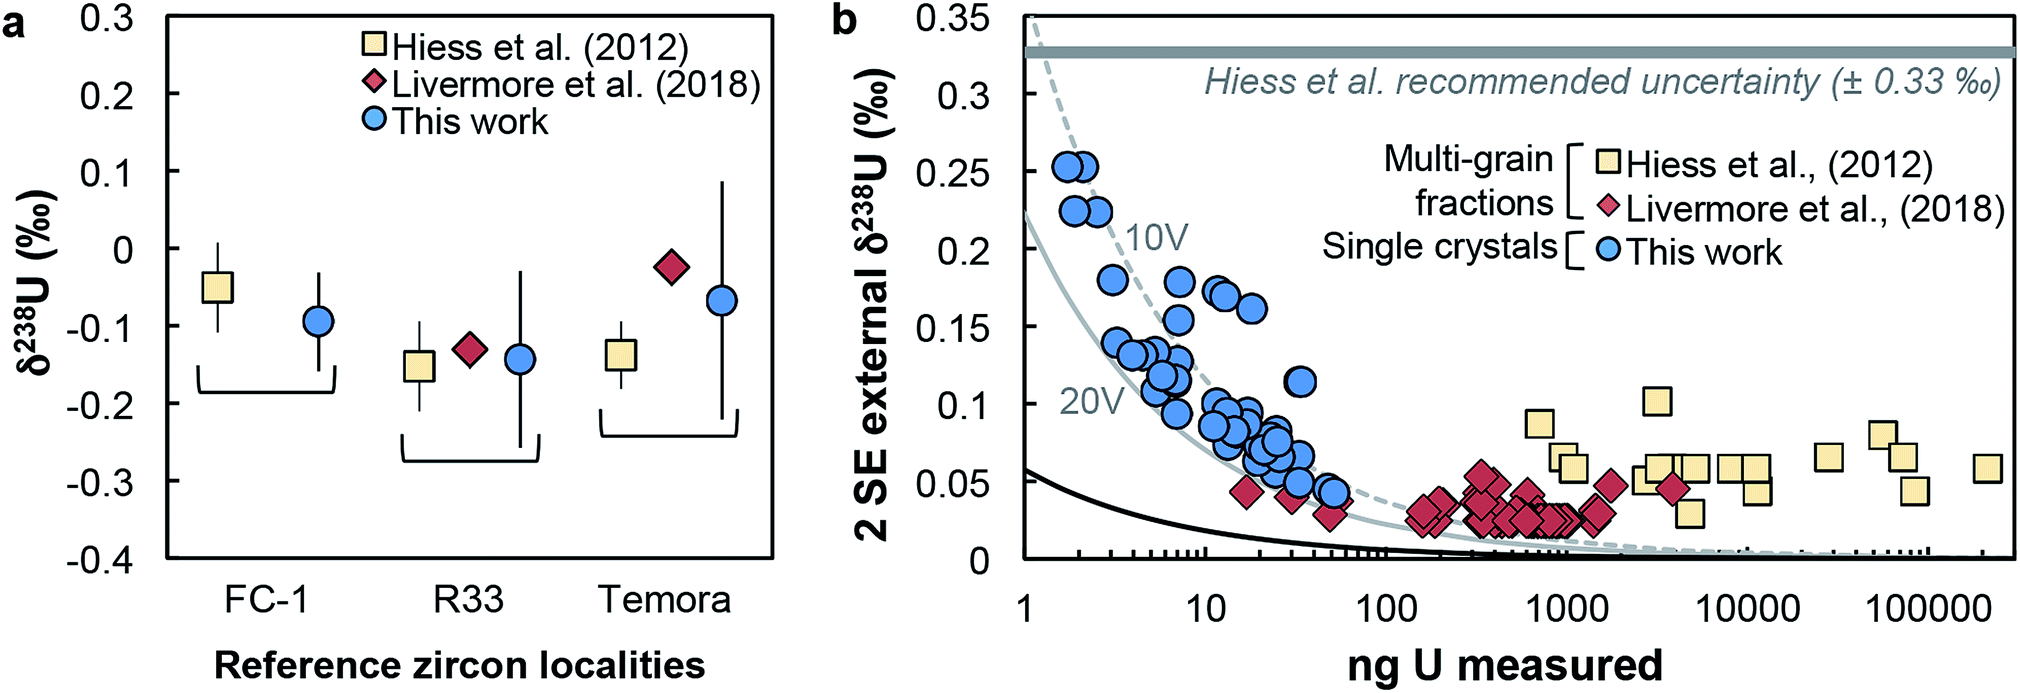 | ||
| Fig. 4 (a) Comparison of δ238U values obtained on single-zircon grains (circles, this work) and pooled zircons (squares: ref. 9; diamonds: ref. 12) for 3 reference zircon localities. (b) Uncertainty on δ238U values vs. amount of U measured (in ng). Uncertainties are 2 SE external reproducibility (see Section 5.1). Grey curves show the theoretical lower limit achievable, calculated with eqn (2), assuming measurements on a Neptune MC-ICPMS with 2.5% ion transmission and 238U measured at 10 V (dashed grey curve) and 20 V (solid grey curve), and with both 235U and 238U measured using 1011 Ω resistors (see Methods and ESI†). The black curve shows the absolute precision limit assuming 100% of ion transmission: i.e., all ions in solution reach the detectors of the instrument. | ||
(v) Achievable precision. The precision of our measurements is in excellent agreement with the lower limit theoretically achievable by MC-ICPMS (grey curves, Fig. 4b). The theoretical curves correspond to the quadratic sum of the counting statistics and Johnson noise uncertainties for 238U/235U measured with a 233U–236U double spike on Neptune MC-ICPMS, calculated as (see derivation in the ESI†):
 | (2) |
5.3 Variable 238U/235U between single zircon grains
Our dataset shows that single-zircon 238U/235U variations exist and can be resolved by high-precision MC-ICPMS measurements (Fig. 5). Individual zircons have δ238U values between −0.52 ± 0.17‰ (RSES72-2.2) and −0.12 ± 0.06‰ (RSES72-6.1) and chemically abraded samples show similar variations, with leachate values between −0.40 ± 0.07‰ (RSES72-3.6) and −0.17 ± 0.12‰ (RSES72-18.3), and residue values between −0.60 ± 0.22‰ (RSES72-3.6) and −0.10 ± 0.08‰ (RSES72-18.3). Less than 20% of the total sample U is released during the HCl and HNO3 pre-cleaning steps, indicating a small, yet non-negligible potential contribution from iron oxides, secondary alteration products and adsorbed U (Table S1†), highlighting the need for cleaning or chemically abrading the grains before dissolution for U isotope measurements. For five of the six chemically abraded samples, leachates and residues have indistinguishable δ238U (within uncertainties), yet, taken at face value, four of these samples show lower δ238U in the leachates relative to their residue counterpart. For one sample (RSES72-1.2) the leachate (δ238U = −0.36 ± 0.08‰) is clearly 235U depleted compared to the residue (δ238U = −0.12 ± 0.13‰), in agreement with pooled zircons data and the suggestion that aggressive acid attacks may preferentially mobilize 235U over 238U (ref. 9 and 12).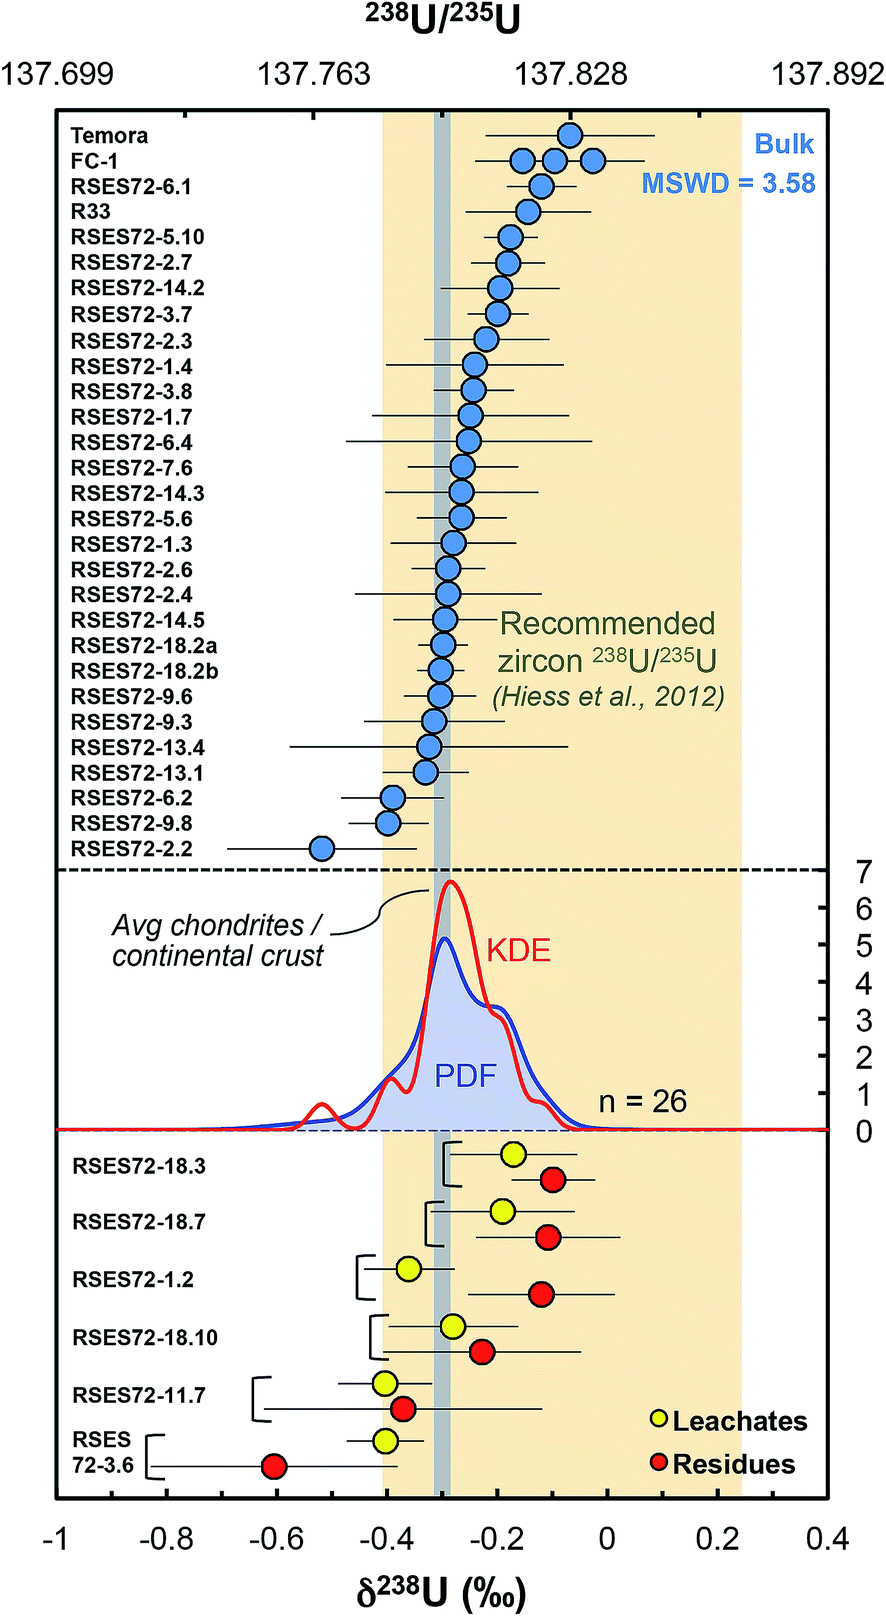 | ||
| Fig. 5 Single-zircon U isotope data revealing resolvable grain-to-grain variations. Vertical grey band shows the chondritic and continental crust value, while the yellow vertical band shows the recommended 238U/235U for use in geochronology. Absolute ratios normalized to 238U/235U = 137.837 for CRM-112a (ref. 36). The Probability Density Function (PDF, blue curve) and the optimized bandwidth Kernel Density Estimator (KDE, red curve) of the Jack Hills zircons are shown. Leachates (yellow circles) and residues (red circles) from chemical abrasion suggest preferential mobilization of 235U during strong acid attack. The high MSWD (=3.58) for the Jack Hills zircons indicates that these samples are isotopically heterogeneous. The PDF/KDE of the Jack Hills zircons is not centered on the recommended 238U/235U, suggesting that there is variation in the U isotope composition of zircon populations from different localities. | ||
6. Discussion
6.1 No evidence for widespread Oklo-type reactors in the early Earth
Under the right conditions, U-rich deposits formed before ∼1.8 Ga, when natural 235U abundance was >∼3%, could have reached criticality. This is particularly true in the Hadean, as 235U abundance was >17%, and the case has been made that a CFF-Xe (CFF = Chemically Fractionated Fission) component, produced by such nuclear reactors, could be present in Earth's atmosphere and explain its Xe isotopic anomalies.38 Yet, in addition to high 235U abundance, the conditions required for self-sustained neutron-induced 235U fission are non-trivial to meet: (i) a high enough U concentration (∼>10–20 wt% in the Hadean) in a sediment layer of at least 50–100 cm of thickness,14,39 (ii) the presence of a neutron flux moderator (e.g., water) and sufficient porosity for water circulation (10–20%), and (iii) no significant amount of neutron absorbing elements (e.g., REEs).40 Our single-zircon 238U/235U measurements provide a way to directly test for the possible existence of Oklo-type reactors in the early Earth.The 238U/235U of the 31 Jack Hills zircons cover a range of ∼0.50‰, with the lightest and heaviest samples displaying δ238U values of −0.60 ± 0.22‰ (RSES72-3.6R) and −0.12 ± 0.06‰ (RSES72-6.1), respectively. This distribution is similar to that of younger igneous rocks, which ranges from −0.50 to +0.17‰ (see compilation in ref. 16), and is centered on the chondritic value of −0.31 ± 0.29‰ (2SD, ref. 41). Therefore, our zircon data shows no evidence of 235U burn-up such as the high δ238U values of +24 to +475‰ documented in the Oklo reactor zones.15 Moreover, the range of δ238U values in Hadean/Archean zircons is ∼10× smaller than the ∼6.2‰ range observed in uraninites (UO2) and younger U ore deposits (see compilation in ref. 16), whose compositions are primarily controlled by redox processes leading to 238U enrichments of up to ∼2‰ in the reduced/mineralized phases. In principle, the 0.50‰ spread in 238U/235U in early Earth zircons could thus be explained by minor contributions from natural reactor material (<1% of the U in the grains) and/or incorporation of some amount of sediments whose composition were affected by redox processes (∼25% of the U in the grains). Both scenarii are unlikely because Jack Hills zircons formed before oxidative conditions could solubilize U in water as UVI (ref. 29), therefore precluding redox driven U isotope fractionation in surface environments and preventing oxidative mobilization and accumulation of U in sediments to the wt% levels required for self-sustained neutron-induced 235U fission. A scenario of weathering-transport-sedimentation and tidal sorting of uraninite has, however, been proposed as a way to produce U-rich sediments capable of reaching criticality.14,42 Even in this framework, the fact that the range of δ238U values measured in early Earth zircons is centered on the chondritic value argues against any contribution from sources with high 238U/235U (e.g., nuclear reactor material or mineralized ore sediments). As such, our data provides no evidence for the widespread existence of Oklo-type reactors in the Hadean/Archean, at least within the basin sampled by the Jack Hills conglomerate. This casts some doubts on the idea that CFF-Xe could be present in Earth's atmosphere. Analysis of grains from other localities will be necessary to test these hypotheses over a larger geographic scale.
6.2 Potential sources of U isotope variations in single-zircons
As discussed above, the spread in δ238U values of Jack Hills zircon crystals is unlikely to stem from U incorporation from natural nuclear reactors and/or 238U enriched sediments (i.e., source effects). Below we consider the potential mechanisms that could lead to U isotope fractionation during magmatic processes, and discuss them in the light of the available data.According to the theory of stable isotope fractionation (review in ref. 43) mass-dependent isotopic effects during equilibrium isotope exchange reactions vary with the temperature of equilibration (∝1/T2), as well as the oxidation state and bonding environment (or speciation) of the element being exchanged. Typically, heavy isotopes concentrate where coordination numbers are low, bond distances short and valence is high (i.e., stiffest bonds). For U, another equilibrium isotope effect exists: a mass-independent but volume-dependent effect called Nuclear Field Shift (NFS), which stems from differences in the electron density at the nucleus of the two isotopes.19 The NFS scales as 1/T, occurs during isotope exchange reactions between reduced and oxidized U phases, and results in isotope fractionations 3× larger than, and of direction opposite to, the vibrational mass-dependent effect.19,44 Changes in the bonding environment, coordination number and/or valence of U during incorporation into minerals could thus lead to 238U/235U variations during magmatic differentiation. This hypothesis is consistent with the 238U excesses of 4.8‰ in pooled titanites relative to pooled zircons in the Fish Canyon Tuff sample,9 the ∼0.30‰ variability in multi-grain dissolutions of coexisting phases from single samples (i.e., zircons vs. apatite),9,12 and the ∼0.20‰ variations among angrite meteorites that correlate with independent tracers of magmatic differentiation (e.g., REE patterns, mineral abundances).20 Because individual zircons from single igneous rock samples can form over protracted periods of magmatic fractional crystallization,45,46 they are thus likely to record changes in δ238U of the evolving magma, whether or not the fractionation is due to zircon crystallization itself.
We review the available data on U bonding environment and valence in silicate melts and minerals to determine the mechanisms likely to fractionate U isotopes. In silicate melts, three U oxidation states can coexist (UIV, UV, UVI), depending on the melt's oxygen fugacity (fO2)47 and alkalinity (ref. 48 and references therein). Under the conditions relevant to most magmatic settings (∼QFM buffer), including the Jack Hills zircons (i.e., between IW and QFM buffer49), UIV is the dominant species, with UV representing <10% of the total U below QFM−1 and up to 40% of the total U at QFM+0.2 (ref. 47). Structure (EXAFS) spectroscopy of silicate glasses indicates that UIV and UV occur in 6-fold coordination sites, with slightly different mean U–O distances of, respectively, 2.26–2.29 Å and 2.19–2.24 Å. In contrast, UVI, present only under highly oxidizing conditions (>QFM+4), occurs in uranyl groups with two axial oxygens at ∼1.77–1.85 Å, and four to five equatorial oxygens at ∼2.21–2.25 Å (ref. 48). Due to its large radius (∼0.89 Å) and charge (4+ or more), U is incompatible during magmatic differentiation until minerals capable of accommodating this large cation start crystallizing: e.g., zircon, baddeleyite, titanite, monazite, apatite, biotite, xenotime, allanite.48 While only limited mineral spectroscopic data is currently available (review in ref. 50), U seems to be predominantly incorporated as UIV in large cation sites in the aforementioned minerals. In zircons, U is thought to be hosted in the large Zr site as UIV (ref. 48 and 51), although some amount of UV has been observed in some natural zircons.52 The coordination of U in zircons is unclear and both 6-fold51 and 8-fold48 have been proposed. In titanite, UIV is incorporated in the 7-coordinated CaII site via coupled substitution of MgII into the TiIV site.53 Although no spectroscopic data is available, monazite is also likely to uptake UIV as it incorporates Th,54 which is tetravalent only. To our knowledge, there are no data on U bond length or coordination numbers in these phases. Therefore, under the conditions prevailing in most terrestrial magmatic settings (<∼QFM), no redox changes are expected to occur during uptake of U from the magma into accessory minerals, and thus changes in the coordination number of U and/or the U–O bond length are the most likely driver of U isotopic fractionation.
Although U isotopic fractionation factors between accessory minerals and silicate liquids remain unknown, resolvable δ238U differences between accessory phases from the same sample (e.g., zircon vs. titanite or apatite9,12) indicate that U incorporation in at least one of these minerals is accompanied by a non-zero isotope fractionation at magmatic temperatures. The magnitude of NFS and vibrational mass-dependent U isotopes effects in magmatic settings can, to first-order, be estimated using the temperature dependent expression from Fujii et al.44: ε = 0.69/T − 82/T2, where ε is the isotope fractionation factor between UIV and UVI during electron exchange, and T is the temperature in K. At the onset of zircon crystallization (∼850 °C, ref. 55), NFS effects would lead to large isotopic fractionation of ∼+0.61‰, whereas mass-dependent vibrational effects would result in opposite and more subdued fractionation of ∼−0.07‰. By the end of magma crystallization (at ∼700 °C), NFS and mass-dependent effects will have increased to, respectively, +0.71‰ and −0.09‰. Distillation effects would result in larger δ238U variations. In the simplest scenario, assuming that zircon is the only U host phase crystallizing and using the smaller fractionation factors expected at 850 °C, a Rayleigh distillation during fractional crystallization driven by NFS effects would results in a spread of δ238U values from +0.61‰ to −1.83‰ (at 95% U removal) around the bulk sample value, whereas the same Rayleigh distillation driven by mass-dependent effects would produce variations between −0.07‰ and +0.22‰ around the bulk value (Fig. 6a). In reality, other phases also uptake U, from pyroxenes to late stage forming phases such as titanite, apatite or monazite, all of which can potentially fractionate U isotopes to different degrees depending on the bonding environment and valence of U in their crystal structure. Nonetheless, this simplified scenario is instructive as it reveals that even the small (∼0.07‰) equilibrium mass-dependent U isotope effects expected at 850 °C can explain the entire spread of 238U/235U observed in the Jack Hills zircons (Fig. 6a). Without whole-rock and single-zircon data from the same sample, we cannot definitely conclude as to the direction or magnitude of the Δzircon-melt fractionation factor under the conditions (e.g., redox, T) relevant to early Earth zircons, and more work will be needed to constrain this value.
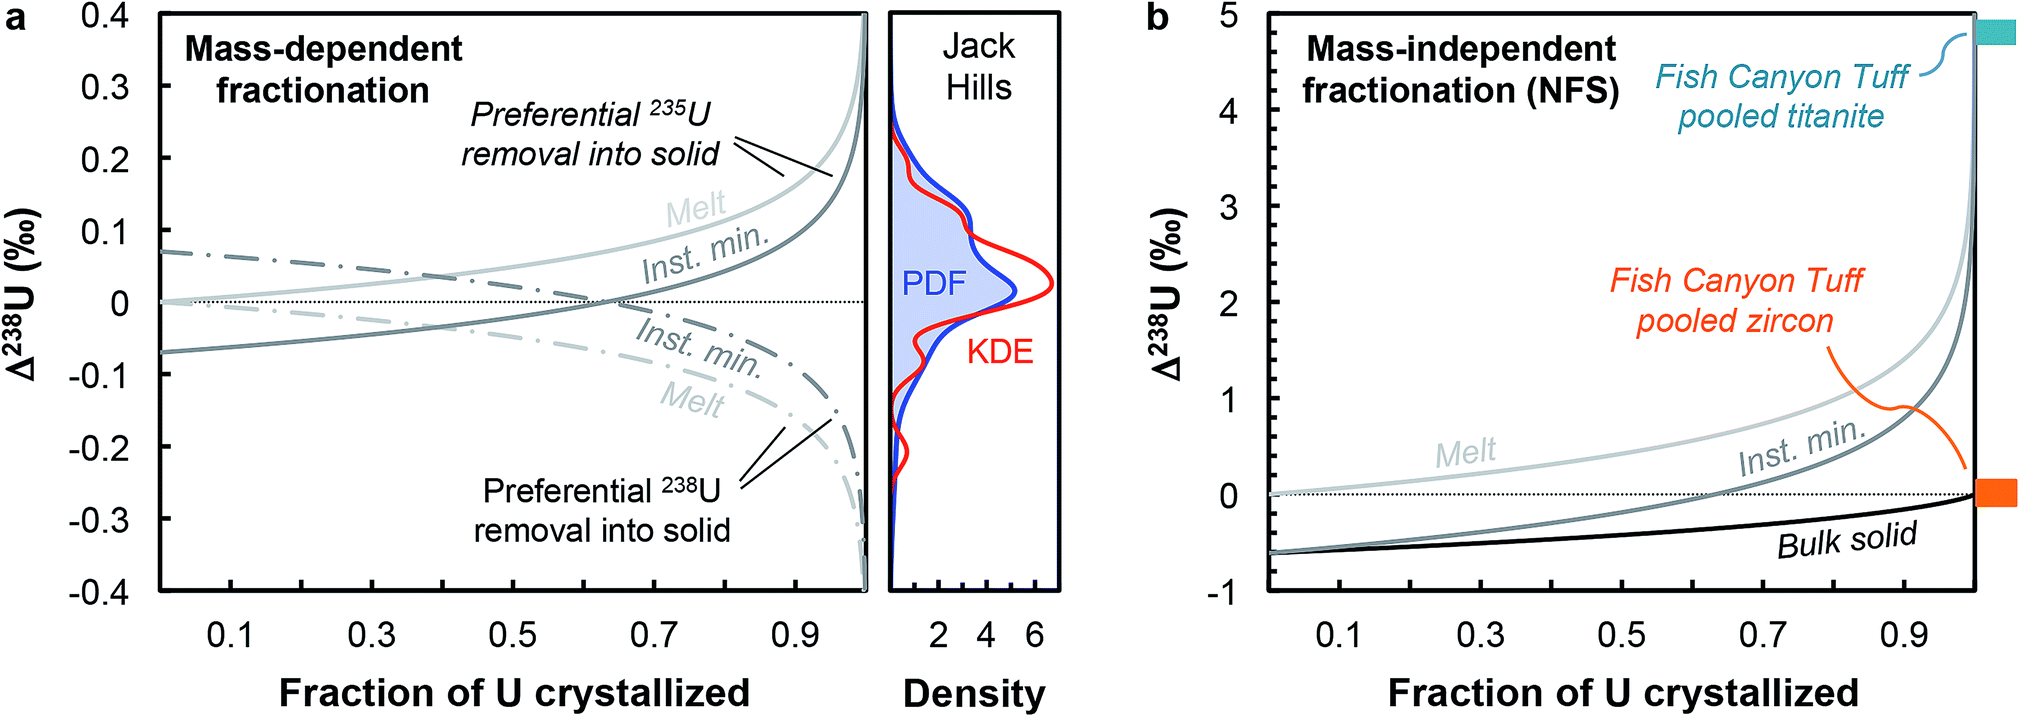 | ||
| Fig. 6 (a) Melt and instantaneous solid (minerals) U isotope composition evolution during a Rayleigh distillation, as a function of the fraction of U removed from the melt. Two pairs of curves are shown illustrating preferential incorporation of 235U (solid curves) and 238U (dashed curves) into the crystallizing phase. The absolute magnitude of the Δmineral-melt fractionation factor is 0.07‰ (expected value for vibrational mass-dependent fractionation effects at 850 °C, see text for details). This small mass-dependent effect can explain the entire spread of 238U/235U values in the Jack Hills zircons (see density distribution curves). (b) Same as (a), with addition of the bulk solid evolution curve, but using a Δmineral-melt fractionation factor of −0.61‰ (expected value for NFS effects at 850 °C). The 4.8‰ offset between pooled titanite and pooled zircons in the Fish Canyon Tuff sample (data from ref. 9) suggests a redox change during U incorporation into zircons (and/or other accessory phases) in oxidizing silicate melts. | ||
In contrast, the offset in 238U/235U between pooled titanite and pooled zircons observed in Fish Canyon Tuff sample9 provides insight into the mechanisms of U isotope fractionation in magmatic settings under oxidizing conditions (∼QFM+2, ref. 56), and suggests preferential incorporation of 235U in zircons, or some of the other accessory phases crystallizing before titanite (e.g., monazite, apatite). Indeed, the large (4.8‰) 238U excess in titanite cannot be explained solely by a NFS effect during U incorporation into titanite, which at ∼850 °C can only produce 238U excesses 0.61‰ above the bulk rock value (which we assume is represented by the pooled zircon value, for lack of bulk rock data). As titanite is a late forming phase,57 the large 238U excess it records implies that one (or several) of the accessory phases crystallizing before titanite preferentially incorporated 235U, driving the melt composition towards higher δ238U values during differentiation. Assuming that the Δtitanite-melt is negligible, a 4.8‰ excess in the residual melt would require formation of titanite after more than 99% of U removal into other phases associated with a NFS Δsolid-melt of −0.61‰ (Fig. 6b), suggesting a redox change during U incorporation into zircons (and/or other accessory phases) in oxidizing silicate melts.
At this writing, the available δ238U data from different phases within a single sample is too limited to allow systematic trends to be identified. For instance, Hiess et al.9 reported δ238U values 0.23 ± 0.06‰ lower in apatite than zircon of the Mud Tank carbonatite, whereas Livermore et al.12 reported values up to 0.30‰ higher in apatite than in zircons in leucogabbro and orthogneiss from Labrador. These differences could be explained in at least two ways: (1) by different crystallization times of apatite from a magma of evolving U isotope composition; or (2) by different U coordination environment in carbonatite and silicate melts, leading to opposite equilibrium fractionation in these phases during fractional crystallization. Single-grain U isotope analysis will allow investigations of these questions through quantification of mineral-melt fractionation factors, and the extent of δ238U variability within a mineral type for any given sample.
6.3 A shift in global zircon 238U/235U after the Paleo-archean?
Multi-grain zircon dissolution data,9,12 which include samples spanning Earth's post-Eo-Archean history, are not centered on the chondritic (−0.31 ± 0.29‰, ref. 41) or bulk continental crust value (−0.29 ± 0.03‰, ref. 16), but are displaced toward higher δ238U values by ∼0.20‰ (Fig. 5). In contrast, the Jack Hills zircons δ238U distribution is indistinguishable from that of chondrites and the bulk continental crust. Taken at face value, this suggests an increase in 238U/235U in (some) zircon populations sometime after the Eo- to Paleo-archean transition. Such increase in 238U/235U could be the result of either (1) the influence of source materials with higher δ238U in younger rocks, or (2) a change in mantle redox conditions sometime after the Eo-Archean, allowing the expression of a stronger zircon-melt U isotope fractionation than those observed in older zircons. More work on Hadean/Archean zircons will be necessary to confirm the statistical significance of the δ238U offset relative to younger zircons.6.4 Practical relevance of single grain analyses for U–Pb and Pb–Pb geochronology
Owing to analytical advances, sources of uncertainty that were once dominant (e.g., procedural blank, instrumental mass fractionation, Pb-isotope counting statistics) no longer represent a major impediment for high precision U–Pb and Pb–Pb geochronology. State-of-the-art measurements58,59 using CA-ID-TIMS (chemical abrasion-isotope dilution-thermal ionization mass spectrometry10,30) can now attain single-zircon U–Pb date precisions on the order of 0.2‰. Although laboratory blank Pb isotope composition and U-series disequilibrium remain a main limitation for high-precision 206Pb/238U dating of Phanerozoic zircons,60 the accuracy with which geological events in the Proterozoic and earlier rock/mineral record can be determined is now significantly limited by how precisely and accurately the sample 238U/235U is known. Single-zircon 238U/235U measurements have been theoretically recognized as a way to refine U–Pb and Pb–Pb geochronology, but the small U mass harvested from individual zircons has led to claims that only limited, if any, improvements could be gained from such measurements.10–12 Here, we consider these claims in the light of our data.For single-zircon 238U/235U analyses, uncertainties vary as a function of the amount of U measured (Fig. 4b) and are often limited by counting statistics. Nevertheless, the ± 0.25‰ external reproducibility uncertainty (2SE) obtained here on U loads of only 2 ng is still 25% smaller than the ± 0.33‰ uncertainty associated with the ‘recommended 238U/235U value’ that is widely used for U–Pb geochronology9 (grey band, Fig. 4b). Moreover, by measuring 235U on a 1012 Ω instead of a 1011 Ω amplifier, precision better than 0.30‰ can theoretically be achieved for U loads as low as 0.4–0.5 ng (see Section 6.6). To determine if these U-mass limits are an impediment for application of single-zircon 238U/235U analysis to high-precision geochronology, literature data from 2515 individual zircon crystals dated by CA-ID-TIMS at the MIT and Princeton University labs were compiled (Fig. 7). The compilation includes grains covering Earth's history and shows that the typical U mass recovered from chemically abraded zircons ranges from 0.01 to 10 ng. Contrary to the prevailing notion that chemical abrasion results in insufficient amounts of U for precise 238U/235U determination in routine U–Pb geochronology analyses,9–12 the data reveal that 48% of the zircons in those studies yielded more than 0.4 ng of U, and 24% yield more than 1 ng of U. Therefore, virtually every other zircon dated by the CA-ID-TIMS method would be amenable to single-grain U isotope measurements.
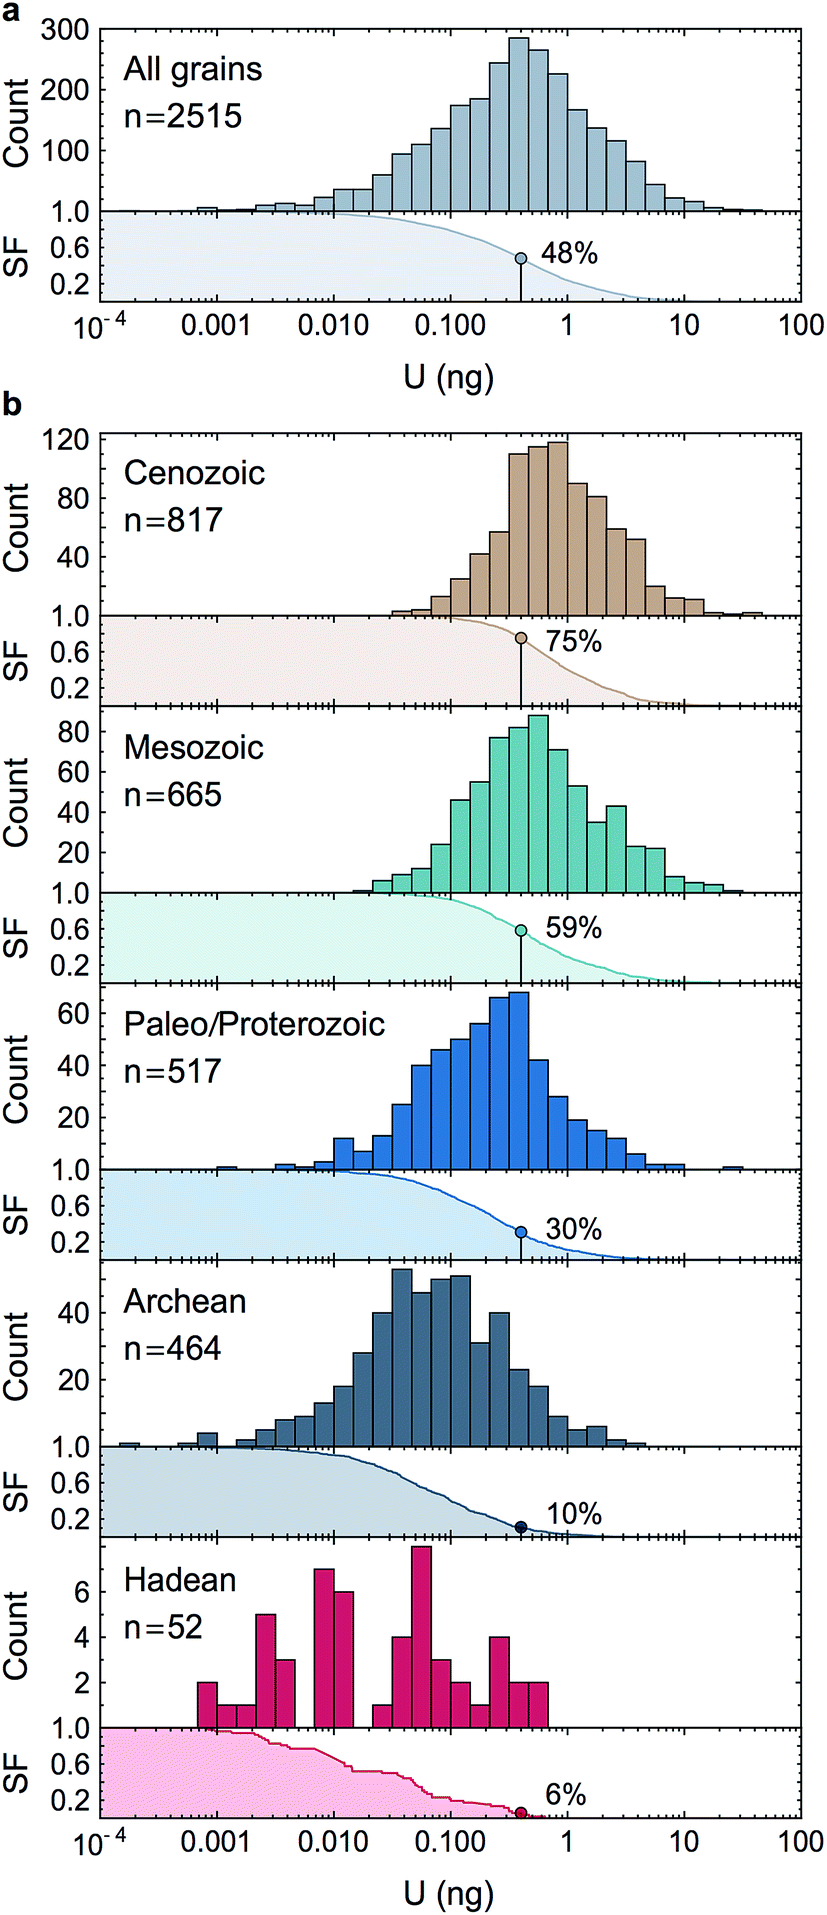 | ||
| Fig. 7 Histograms and associated survival functions of post chemical abrasion U mass (in ng) recovered from 2515 individual zircon crystals analyzed in recent high-precision geochronology studies (data from ref. 23, 24, 35, 66, 67 and 70–94). (a) All data, (b), data shown by geological time periods. For each panel, the % of grains with more than 0.4 ng of U is shown on the survival function. The decrease in U content with increasing age is an artifact due to the chemical abrasion treatment. Indeed, radiation damages on the crystal lattice are more extensive in older zircons, resulting in greater proportion of the grain being leached away during the chemical abrasion step. | ||
6.5 Implications for U–Pb and Pb–Pb geochronology
Below we show how single-grain U isotope measurements would yield more accurate, and in many instances more precise, high-precision Pb–Pb and U–Pb dates than those calculated using a ‘recommended’ 238U/235U ratio.9,12 To the exception of the section discussing chemically abraded zircons, the general chronological considerations below directly apply to all U–Pb geochronology, including other U-rich accessory phases such as baddeleyite,61 or titanite.62,63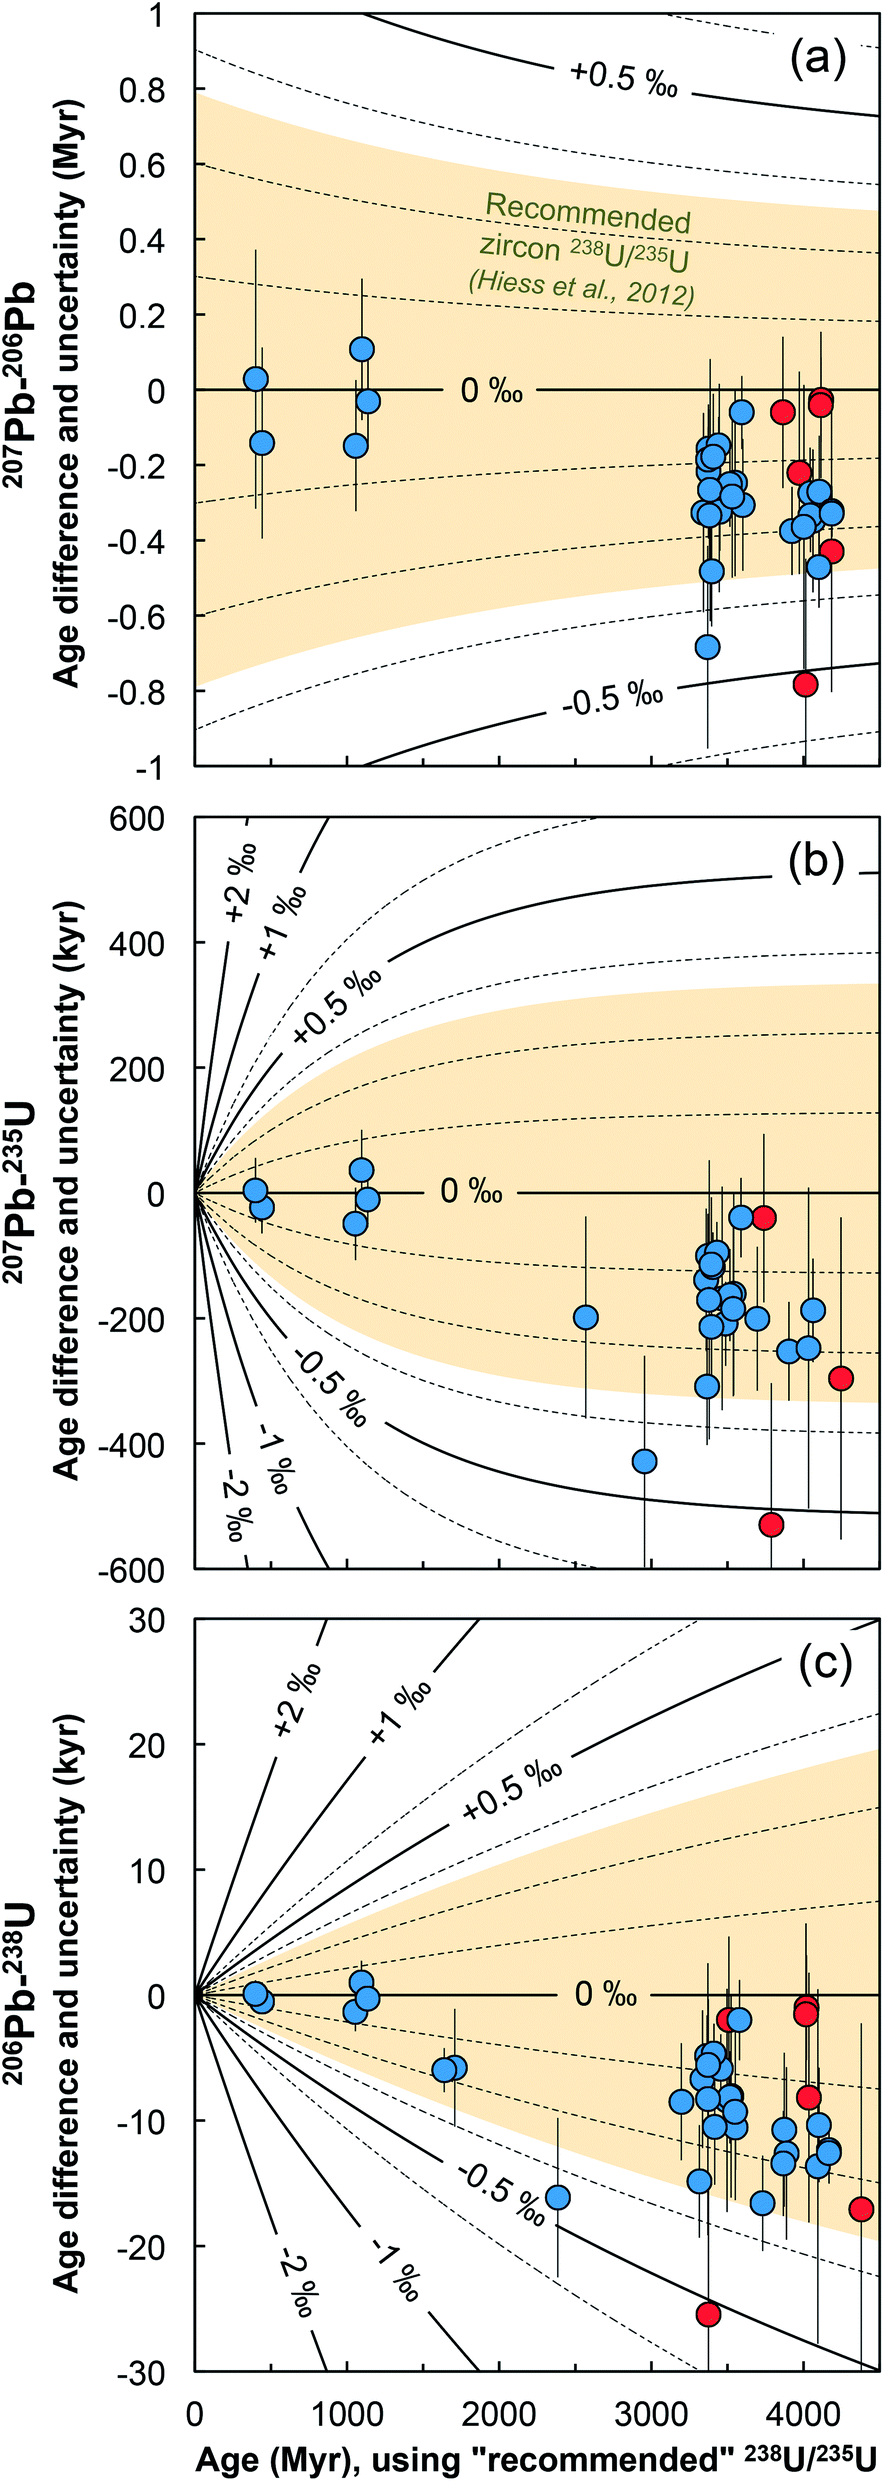 | ||
| Fig. 8 Age corrections for the (a) 207Pb–206Pb, (b) 207Pb–235U and (c) 206Pb–238U ages of the zircons measured in this work (blue = bulk grain, red = chemical abrasion residue) stemming from the difference between the recommended 238U/235U from ref. 9 and the ratio measured in each grain. Lines of equal ΔU values (ΔU = [238U/235Usample/238U/235UHiess − 1] × 1000, in ‰) are shown and were calculated using eqn (A.3), (A.4), and (A.5). | ||
To further illustrate the impact that single-zircon 238U/235U analysis can have on high-precision Pb–Pb and U–Pb age determinations, we use data from two geologically important samples: a 1.09 Ga Midcontinent Rift zircon66 and a 3.97 Ga lunar zircon.67 While Midcontinent Rift zircon dates have been used to constrain the rates of plate motions in the past, lunar zircons provide the most direct constraint on the age of the Moon. Substituting the median 238U/235U uncertainty of our measurements (i.e., ± 0.10‰) in place of the ± 0.33‰ uncertainty of the recommended value from Hiess et al.,9 we estimate that, in addition to an increase in accuracy, 207Pb–206Pb dates would become 23 to 54% more precise (Fig. 9 and S1†). Provided laboratory blank and instrumental Pb mass fractionation are not the main sources of uncertainty, removal of the U-oxide correction uncertainty through MC-ICP-MS 238U/235U measurement could improve the typical precision of 206Pb–238U and 207Pb–235U dates by 6 to 22% (Fig. 9 and S1†).
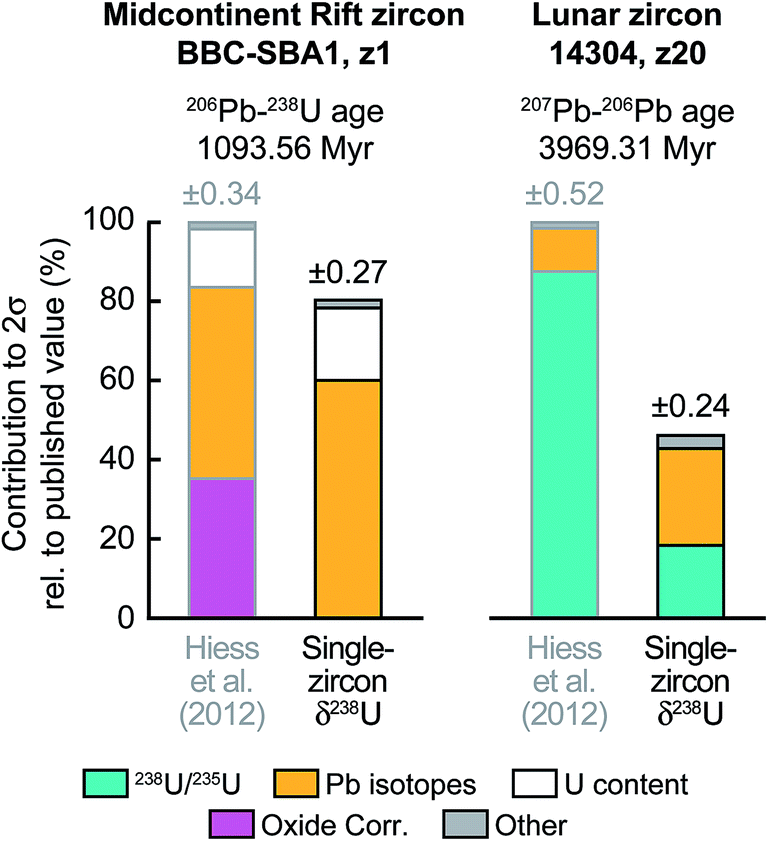 | ||
| Fig. 9 Contribution of the different sources of uncertainty to the high-precision 206U–238Pb age of a 1.09 Ga Midcontinent rift zircon66 (sample BBC-SBA1, fraction z1) and the 207Pb–206Pb age of a 3.97 Ga lunar zircon67 (sample 14304, fraction z20). 206U–238Pb and 207Pb–206Pb dates are typically reported for events younger and older, respectively, than ∼1.5 Ga. For each sample the published errors calculated using the recommended 238U/235U from ref. 9 are compared to the errors that would be achieved if a single-zircon U isotope measurement with precision of ±0.10‰ had been performed instead. Details of error contribution on all Pb–Pb and U–Pb ages are shown in ESI Fig. S1.† | ||
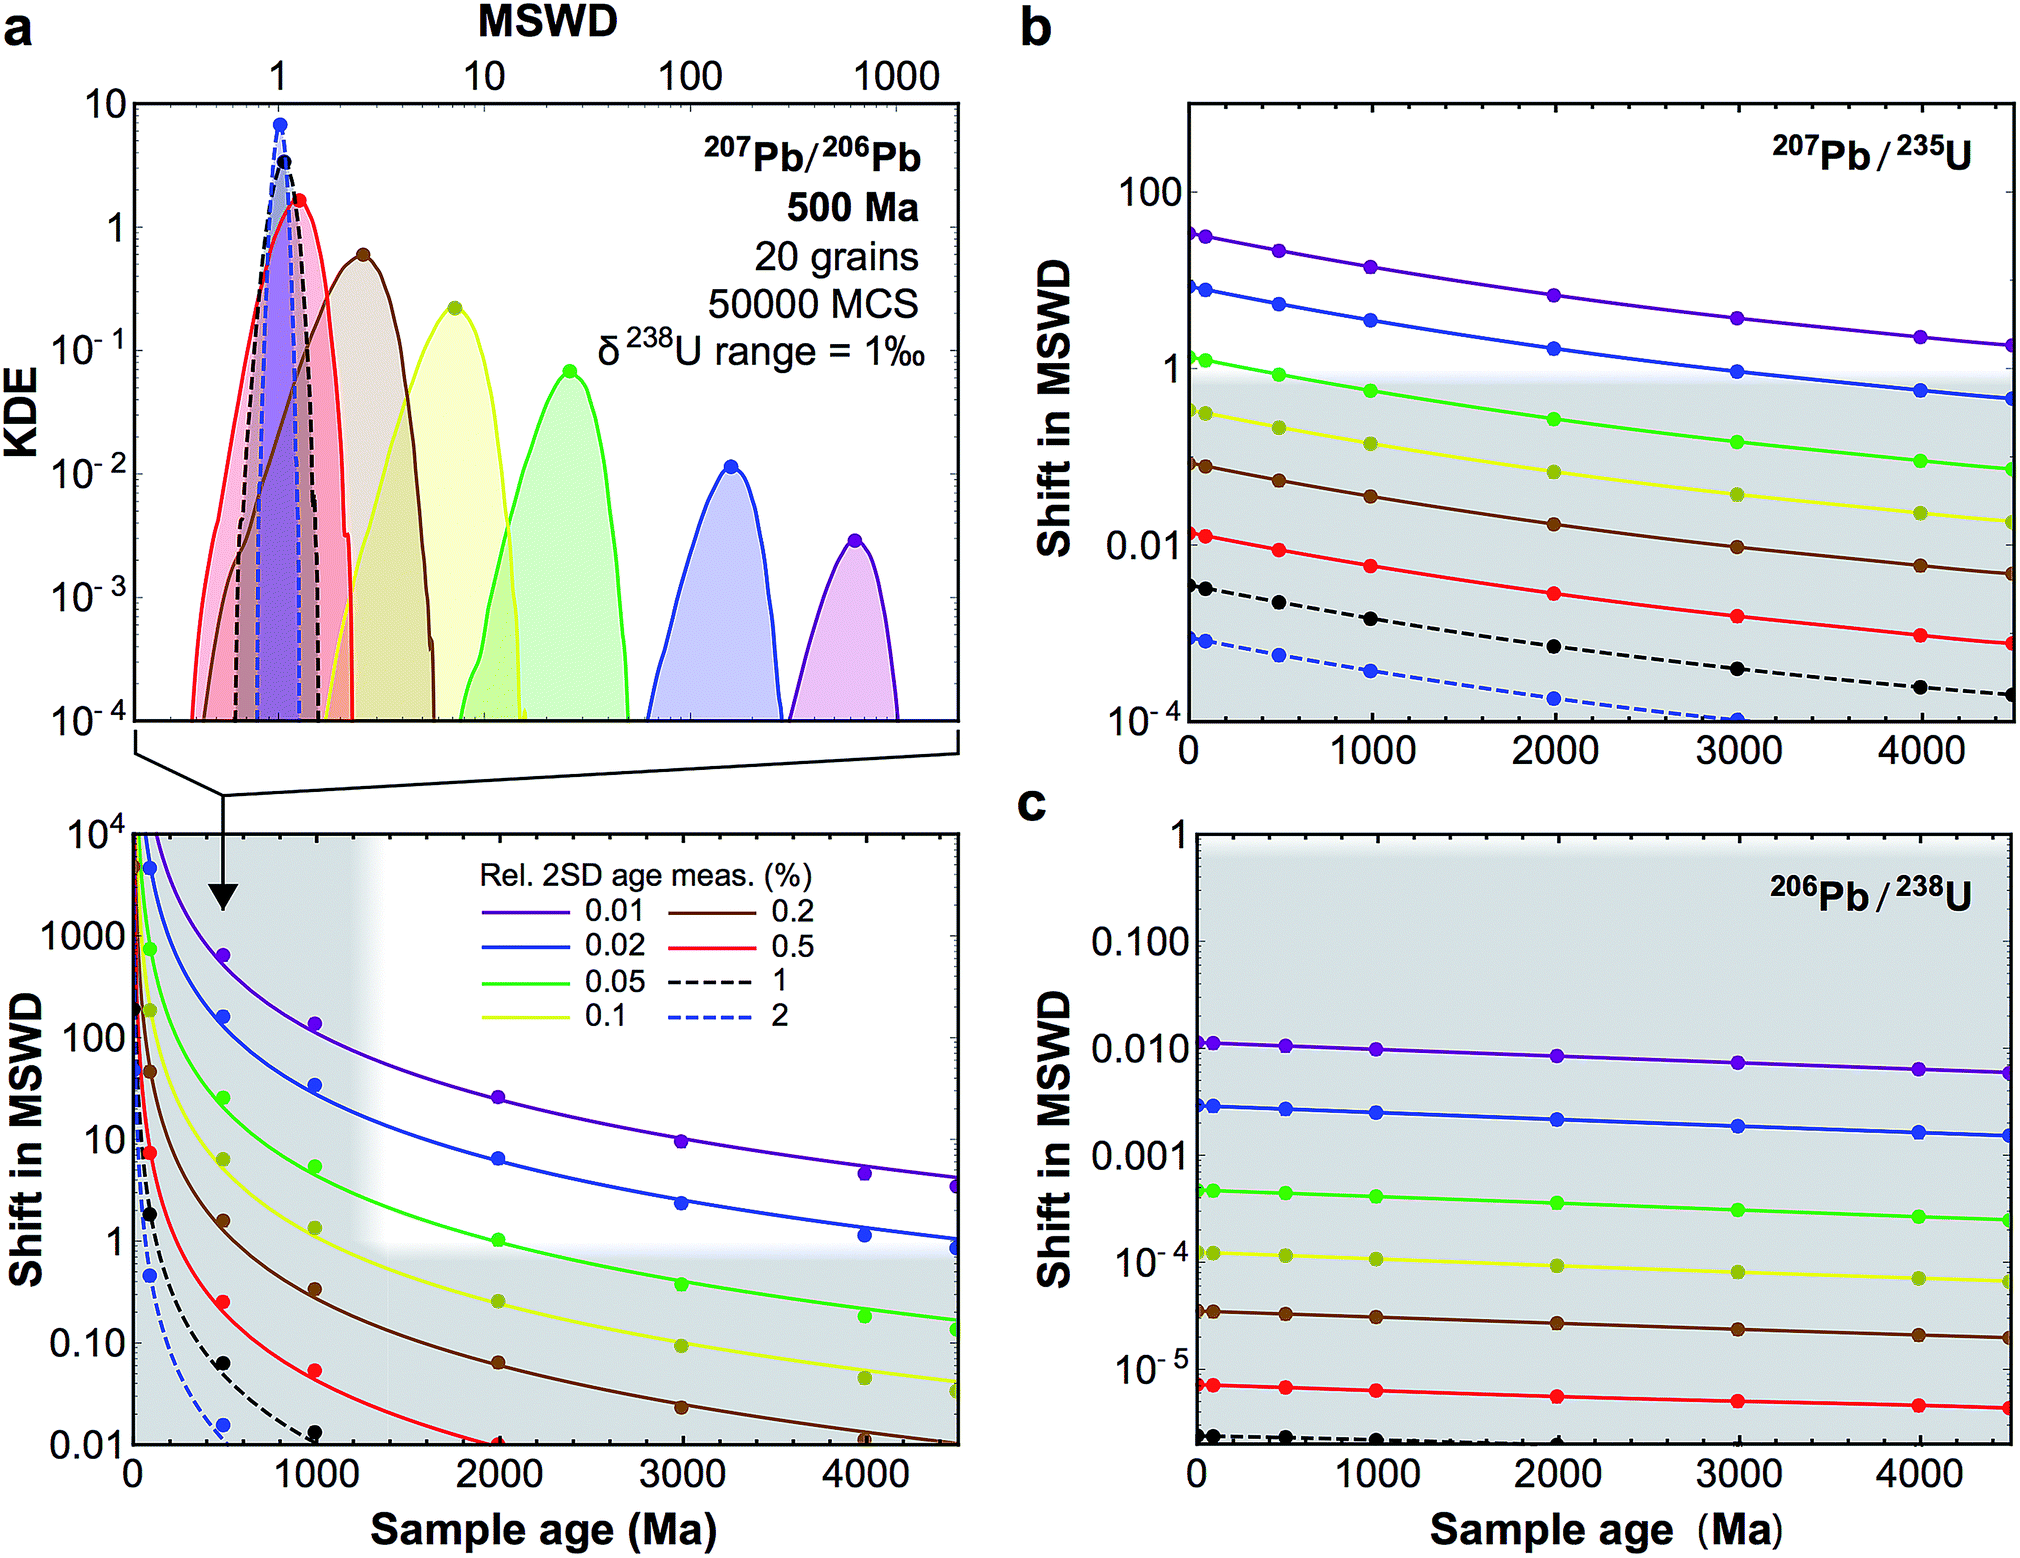 | ||
| Fig. 10 (a, top-panel) Example of KDE of the U-corrected MSWD of the weighted mean age calculated for 500 Ma zircons (20 grains), for relative precision on the age measurement of individual grains between 2 and 0.01% (see legend bottom panel). The Monte-Carlo analysis used 50000 simulations (MCS) and δ238U values were randomly picked within a uniform distribution of width 1‰, centered on the ‘recommended’ value from ref. 9. For simplicity, and to be conservative, age uncertainties are kept constant before and after age correction: i.e., only the improvement in accuracy is evaluated. (a, bottom-panel) Median shift in MSWD of the weighted mean 207Pb/206Pb age of 20 zircon grains resulting from U-based age corrections. Grey areas denote statistically insignificant shifts (horizontal band), and ages for which 206Pb–238U ages are preferred to 207Pb–206Pb ages (which are too imprecise, vertical band). (b and c) Same as bottom-panel a, but for 207Pb–235U and 206Pb–238U ages, respectively. | ||
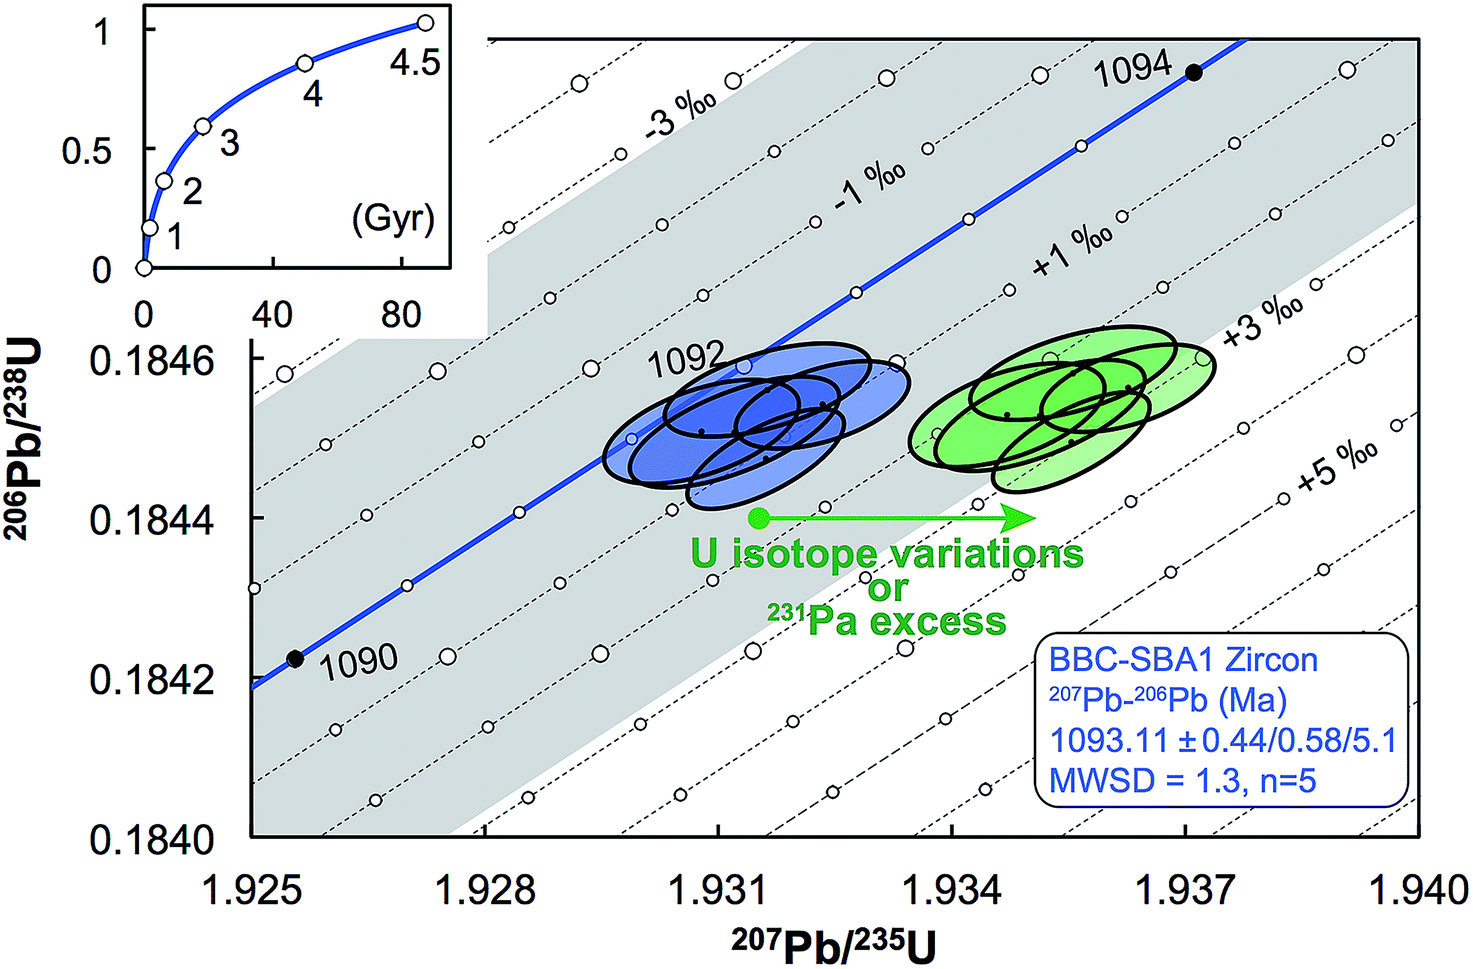 | ||
| Fig. 11 Concordia diagram, with error envelope due to the uncertainty in U half-lives (grey), showing the effect of a difference between actual and assumed 238U/235U of the sample. Lines of equal ΔU values are 1‰ apart and were calculated using eqn (A.1) and (A.2). Also shown are the data for five zircons from the Midcontinent rift sample BBC-SBA166 (blue).66 Excess of 231Pa and U isotope variations both result in horizontal displacement of the data in a concordia diagram (green), and as such, disequilibrium of intermediate decay products can only be properly assessed if single-zircon U isotope measurements are performed. Half-lives and their uncertainties from ref. 95. | ||
6.6 Current limitations and future improvements
Some zircons will be either too small, too radiation damaged, or too U-poor to yield sufficient U amounts for high-precision single-zircon U analysis. Taking a fiducial amount of U of 0.4 ng (see below), we estimate (Fig. 7) that ∼50% of zircons will contain too little U to allow direct 238U/235U measurement with current methodologies. The precision achieved in this study is at the theoretical level of MC-ICPMS counting statistics (Fig. 4b) but only ∼2.5% of the atoms in the solution make it to the detector. A recent study showed that up to 5% efficiency for U was achievable using cavity source TIMS.69 There is thus ample room for improvement as the transmission of mass spectrometers continues to improve (black curve on Fig. 4b shows absolute precision limit: 100% ion transmission). In cases where U contents remain too low, measurement of small pooled fractions of co-genetic zircons (e.g., 2 to 5 grains) is the only way to obtain useful estimates approaching the true sample 238U/235U variability, for high-precision Pb–Pb and U–Pb chronology.The method presented here is by no means fully optimized and significant improvements would help make single-zircon U isotope measurements more routine. In particular, exploration of the parameter space relevant to measurement precision using eqn (2) reveals that using higher spiking ratios and amplifiers equipped with 1012 and/or 1013 Ω resistors could significantly improve measurement precision for small U loads (<2 ng U, Fig. 12).
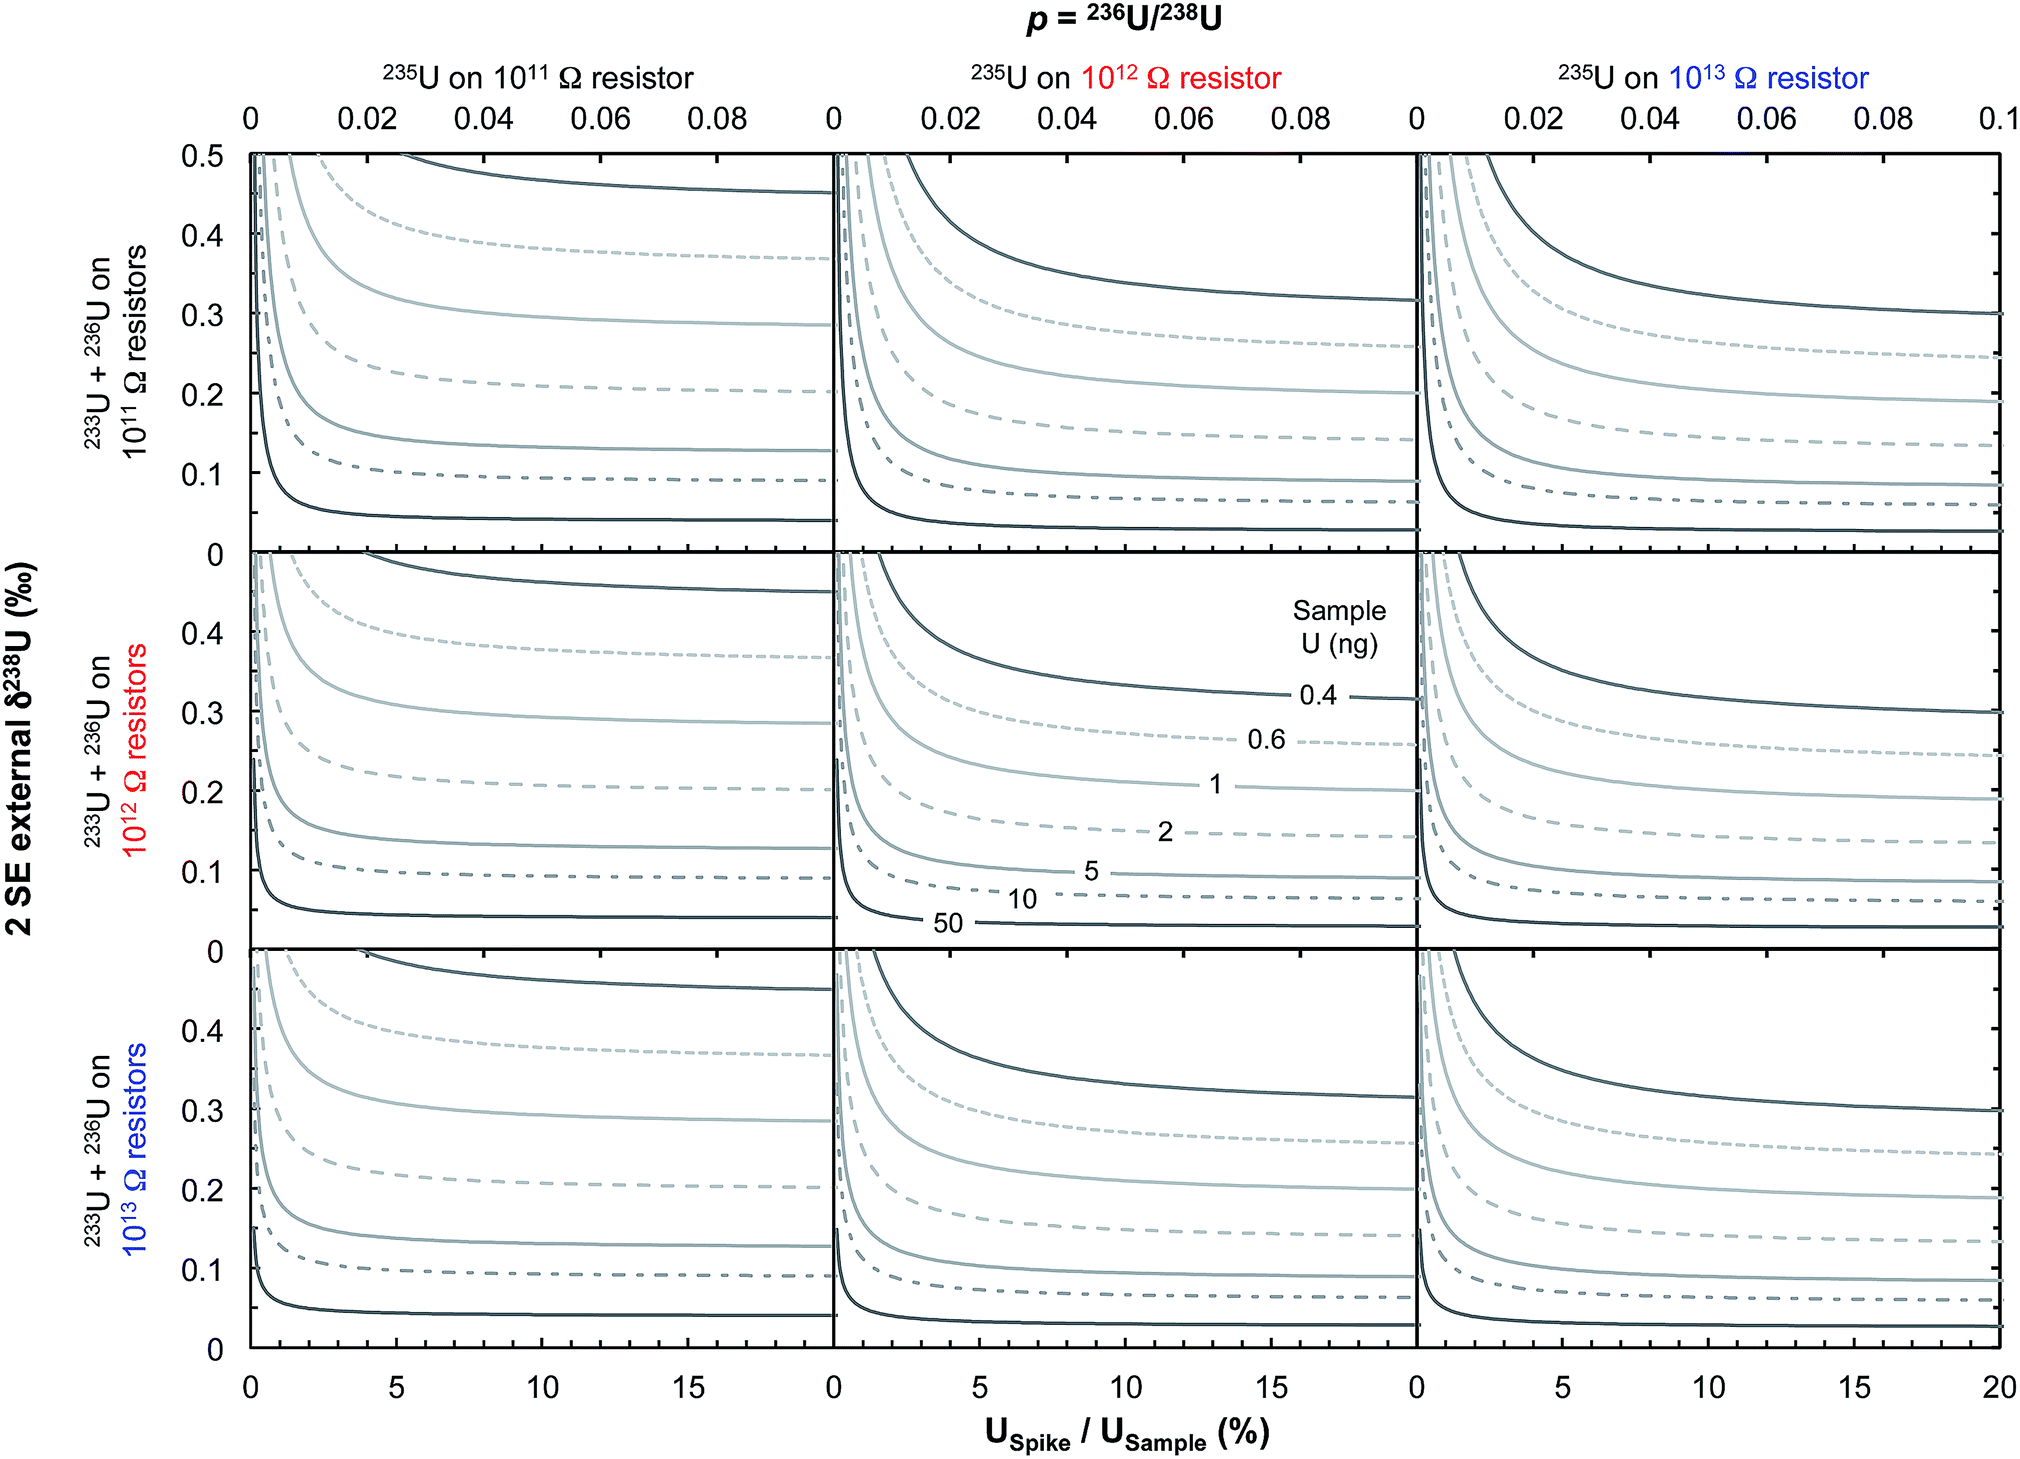 | ||
| Fig. 12 Theoretical limit on δ238U values uncertainty (2 SE external) achievable on Neptune MC-ICPMS plotted as a function of the sample spiking level (bottom x-axis, USpike/USample; top x-axis, parameter p from eqn (2), which relates the number of ions of 236U and 238U as: n6 = p n8). The various curves represent different amounts of total U measured (in ng). Uncertainties are calculated using eqn (2), assuming 238U is measured at 10 V with a 1011 Ω resistor, and each cycle of 4.192 s consumed 0.072 ng of U. Left, center and right panels assume that 235U is measured using, respectively, a 1011, 1012 or 1013 Ω resistor, with the top, center and bottom row assume that the spike isotopes (233U and 236U) are measured using, respectively, 1011, 1012 or 1013 Ω resistors, respectively. For small U loads, optimal precision can be achieved using USpike/USample ratio of ∼8–10% (where uncertainties plateau) and by measuring 235U in a 1012 or 1013 Ω resistor. | ||
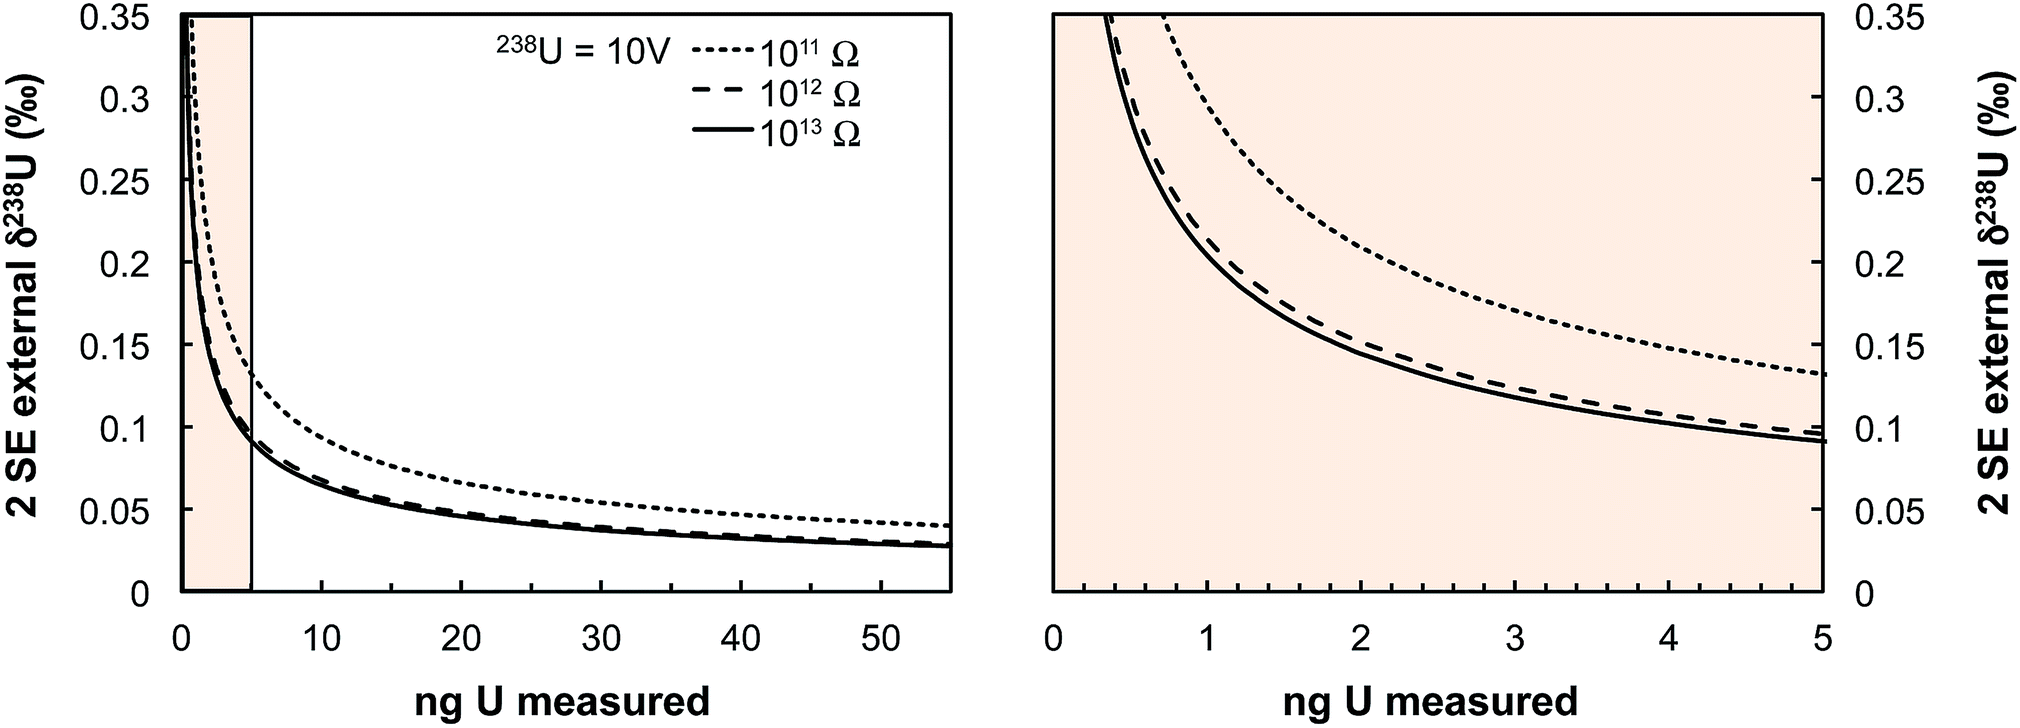 | ||
| Fig. 13 Theoretical limit on δ238U values uncertainty (2 SE external) achievable on Neptune MC-ICPMS plotted as a function of the amount of U measured (in ng). Uncertainties are calculated using eqn (2) assuming a USp/USmp of 10%, that 238U is measured at 10 V with a 1011 Ω resistor, and that each cycle of 4.192 s consumed 0.072 ng of U. The three black curves show the theoretical lower limit achievable when 235U is measured using a 1011, 1012 or 1013 Ω resistor (see legend). The spike isotopes can be measured with 1011, 1012 or 1013 Ω resistors without any significant impact on the results given the high spiking level. Even for U sample loads as low as 0.4–0.5 ng, a precision of 0.30‰ is achievable, comparable to the ± 0.33‰ of the recommended 238U/235U value from ref. 9. | ||
7. Concluding remarks
As the exact origin of U isotope variations in zircons is unknown, future investigations using extended X-ray absorption fine structure (EXAFS) and/or synchrotron spectroscopy will be needed to address the cruel lack of data on the bonding environment (bond length, coordination number) and valence state of U in minerals. Future works trying to understand the causes of these variations in greater detail could explore potential correlations between 238U/235U ratios and other geochemical and isotopic tracers of magmatic and/or source rock nature and evolution, such as Th/U ratios, oxygen isotopes, initial 176Hf/177Hf ratios, or Ti-thermometry. Through such investigations, which are beyond the scope of this study, single-zircon 238U/235U analysis has the potential of becoming a new tool to probe processes of crustal formation and differentiation, potentially tied to sediment burial or changes in the oxygenation state of the atmosphere-ocean system.Funding
This work was supported by an NSF grant (EAR1824002) and Crosby Postdoctoral Fellowships (MIT) to FT and MI, a Chamberlin Postdoctoral Fellowship (University of Chicago) to PB, grants from NSF (PG EAR1444951 and CSEDI EAR1502591) and NASA (LARS NNX17AE86G, EW NNX17AE87G, and SSW NNX15AJ25G) to ND, an MIT Ferry Fund award and NSF award (EAR1439559) to DM, and a NASA (EW 80NSSC17K0773) grant to TG.Author contributions
FT, PB, MI and ND initiated the study; FT, PB and MI designed the research; TMH provided the Jack Hills zircons; FT and MI performed the research. FT performed the measurements on ND's and DM's instruments and analyzed the data (including modeling). FT, MI and PB interpreted the data. FT wrote the manuscript with contributions from all co-authors.Data and materials availability
All data needed to evaluate the conclusions in the paper are present in the paper and/or the ESI.† Additional data related to this paper may be requested from the authors.Appendix A: shift in concordia space and age corrections
For a given sample, unrecognized U isotope variations will lead to erroneous age calculations9,16 and shifts in a concordia diagram (Fig. 11), which were quantified using the following analytical formulae (see derivations in the ESI†). Let's consider ΔU, the difference between the actual and assumed U isotope composition of the sample, and defined as: ΔU = (238U/235Uactual/238U/235Uassumed −1) × 1000).Parameters specific to the spike used for the U–Pb measurement will influence the magnitude of these age and concordia offsets. Here we take the example of U–Pb measurements made with the EARTHTIME ET535 tracer (a mixed 205Pb–233U–235U tracer). For a given shift in U isotope composition, the corresponding shifts in the ratio of radiogenic Pb isotope to parent U isotope, 206Pb*/238U and 207Pb*/235U, are respectively noted ΔR68 and ΔR75, and calculated as:
 | (A.1) |
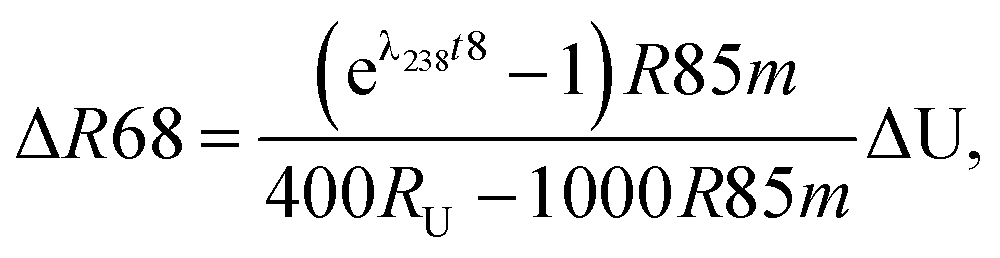 | (A.2) |
Similarly, for a given shift in U isotope composition, the corresponding offsets in 207Pb/206Pb, 206Pb/238U and 207Pb/235U dates, are respectively noted Δt, Δt8 and Δt5, and calculated as (see derivations in ESI†):
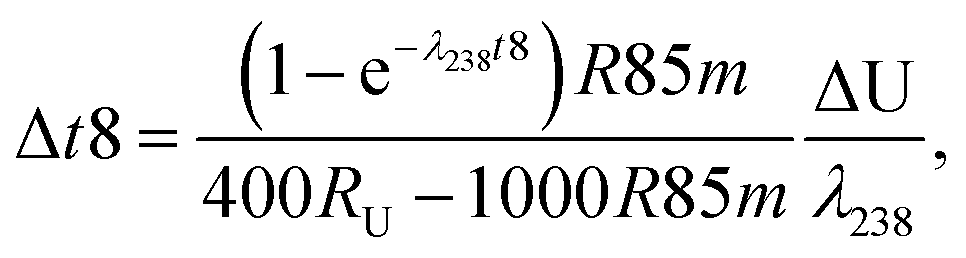
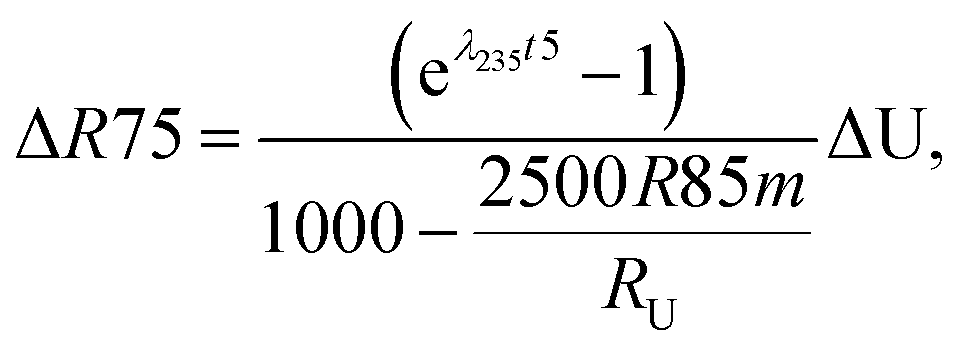 | (A.3) |
 | (A.4) |
 | (A.5) |
Conflicts of interest
Authors declare no competing interests.Acknowledgements
We thank Melanie Barboni for providing the lunar zircon data and Blair Schoene and Jahan Ramezani for compiling some of the data in Fig. 7. Comments on an earlier version of the manuscript by A. Bauer, M. Barboni, C. Y. Chen, M. Collinet, N. Greber, J. Ramezani and D. Trail are greatly appreciated.Notes and references
- S. A. Bowring and I. S. Williams, Contrib. Mineral. Petrol., 1999, 134, 3–16 CrossRef CAS.
- T. M. Harrison, Annu. Rev. Earth Planet. Sci., 2009, 37, 479–505 CrossRef CAS.
- T. M. Harrison, E. A. Bell and P. Boehnke, Rev. Mineral. Geochem., 2017, 83, 329–363 CrossRef CAS.
- A. Morbidelli, D. Nesvorny, V. Laurenz, S. Marchi, D. C. Rubie, L. Elkins-Tanton, M. Wieczorek and S. Jacobson, Icarus, 2018, 305, 262–276 CrossRef CAS.
- E. A. Bell and T. M. Harrison, Earth Planet. Sci. Lett., 2013, 364, 1–11 CrossRef CAS.
- M. T. Rosing, Science, 1999, 283, 674–676 CrossRef CAS PubMed.
- S. J. Mojzsis, G. Arrhenius, K. D. McKeegan, T. M. Harrison, A. P. Nutman and C. R. L. Friend, Nature, 1996, 384, 55–59 CrossRef CAS PubMed.
- J. W. Valley, A. J. Cavosie, T. Ushikubo, D. A. Reinhard, D. F. Lawrence, D. J. Larson, P. H. Clifton, T. F. Kelly, S. A. Wilde, D. E. Moser and M. J. Spicuzza, Nat. Geosci., 2014, 7, 219–223 CrossRef CAS.
- J. Hiess, D. J. Condon, N. McLean and S. R. Noble, Science, 2012, 335, 1610–1614 CrossRef CAS PubMed.
- D. J. Condon, B. Schoene, N. M. McLean, S. A. Bowring and R. R. Parrish, Geochim. Cosmochim. Acta, 2015, 164, 464–480 CrossRef CAS.
- N. M. McLean, D. J. Condon, B. Schoene and S. A. Bowring, Geochim. Cosmochim. Acta, 2015, 164, 481–501 CrossRef CAS.
- B. D. Livermore, J. N. Connelly, F. Moynier and M. Bizzarro, Geochim. Cosmochim. Acta, 2018, 237, 171–183 CrossRef CAS.
- F. L. H. Tissot, N. Dauphas and L. Grossman, Sci. Adv., 2016, 2(3), e1501400 CrossRef PubMed.
- I. G. Draganic, Z. D. Draganic and D. Altiparmakov, Precambrian Res., 1983, 20, 283–298 CrossRef CAS.
- J. R. Lancelot, A. Vitrac and C. J. Allegre, Earth Planet. Sci. Lett., 1975, 25, 189–196 CrossRef CAS.
- F. L. H. Tissot and N. Dauphas, Geochim. Cosmochim. Acta, 2015, 167, 113–143 CrossRef CAS.
- M. B. Andersen, C. H. Stirling and S. Weyer, Non-Traditional Stable Isotopes, 2017, vol. 82, pp. 799–850 Search PubMed.
- F. Z. Teng, N. Dauphas and J. Watkins, Non-Traditional Stable Isotopes, Mineralogical Society of America, 2017 Search PubMed.
- J. Bigeleisen, J. Am. Chem. Soc., 1996, 118, 3676–3680 CrossRef CAS.
- F. L. H. Tissot, N. Dauphas and T. L. Grove, Geochim. Cosmochim. Acta, 2017, 213, 593–617 CrossRef CAS.
- Y. Amelin, A. Kaltenbach, T. Iizuka, C. H. Stirling, T. R. Ireland, M. Petaev and S. B. Jacobsen, Earth Planet. Sci. Lett., 2010, 300, 343–350 CrossRef CAS.
- T. J. Blackburn, P. E. Olsen, S. A. Bowring, N. M. McLean, D. V. Kent, J. Puffer, G. McHone, E. T. Rasbury and M. Et-Touhami, Science, 2013, 340, 941–945 CrossRef CAS PubMed.
- S. D. Burgess, S. Bowring and S. Z. Shen, Proc. Natl. Acad. Sci. U. S. A., 2014, 111, 3316–3321 CrossRef CAS PubMed.
- B. Schoene, K. M. Samperton, M. P. Eddy, G. Keller, T. Adatte, S. A. Bowring, S. F. R. Khadri and B. Gertsch, Science, 2015, 347, 182–184 CrossRef CAS PubMed.
- J. H. F. L. Davies, A. Marzoli, H. Bertrand, N. Youbi, M. Ernesto and U. Schaltegger, Nat. Commun., 2017, 8, 15596 CrossRef CAS PubMed.
- B. Schoene, M. P. Eddy, K. M. Samperton, C. B. Keller, G. Keller, T. Adatte and S. F. R. Khadri, Science, 2019, 363, 862–866 CrossRef CAS PubMed.
- J. M. Mattinson, Chem. Geol., 2010, 275, 186–198 CrossRef CAS.
- P. Holden, P. Lanc, T. R. Ireland, T. M. Harrison, J. J. Foster and Z. Bruce, Int. J. Mass Spectrom., 2009, 286, 53–63 CrossRef CAS.
- D. A. Sverjensky and N. Lee, Elements, 2010, 6, 31–36 CrossRef CAS.
- J. M. Mattinson, Chem. Geol., 2005, 220, 47–66 CrossRef CAS.
- B. Schoene, J. L. Crowley, D. J. Condon, M. D. Schmitz and S. A. Bowring, Geochim. Cosmochim. Acta, 2006, 70, 426–445 CrossRef CAS.
- A. Verbruggen, A. Alonso, R. Eykens, F. Kehoe, H. Kuhn, S. Richter and Y. Aregbe, JRC Scientific and Technical Reports, 2008 Search PubMed.
- S. Weyer, A. D. Anbar, A. Gerdes, G. W. Gordon, T. J. Algeo and E. A. Boyle, Geochim. Cosmochim. Acta, 2008, 72, 345–359 CrossRef CAS.
- E. Horwitz, M. Dietz, R. Chiarizia, H. Diamond, A. Essling and D. Graczyk, Anal. Chim. Acta, 1992, 266, 25–37 CrossRef CAS.
- K. M. Samperton, B. Schoene, J. M. Cottle, C. B. Keller, J. L. Crowley and M. D. Schmitz, Chem. Geol., 2015, 417, 322–340 CrossRef CAS.
- S. Richter, R. Eykens, H. Kuhn, Y. Aregbe, A. Verbruggen and S. Weyer, Int. J. Mass Spectrom., 2010, 295, 94–97 CrossRef CAS.
- F. L. H. Tissot, C. Chen, B. M. Go, M. Naziemiec, G. Healy, A. Bekker, P. K. Swart and N. Dauphas, Geochim. Cosmochim. Acta, 2018, 242, 233–265 CrossRef CAS.
- A. P. Meshik, O. V. Pravdivtseva and C. M. Hohenberg, Phys. Rev. C, 2016, 93, 044614 CrossRef PubMed.
- S. E. Bentridi, B. Gall, F. Gauthier-Lafaye, A. Seghour and D. E. Medjadi, C. R. Geosci., 2011, 343, 738–748 CrossRef CAS.
- E. Roth, J. Radioanal. Chem., 1977, 37, 65–78 CrossRef CAS.
- A. Goldmann, G. Brennecka, J. Noordmann, S. Weyer and M. Wadhwa, Geochim. Cosmochim. Acta, 2015, 148, 145–158 CrossRef CAS.
- Z. Adam, Astrobiology, 2007, 7, 852–872 CrossRef CAS PubMed.
- M. Blanchard, E. Balan and E. A. Schauble, Non-Traditional Stable Isotopes, 2017, vol. 82, pp. 27–63 Search PubMed.
- Y. Fujii, N. Higuchi, Y. Haruno, M. Nomura and T. Suzuki, J. Nucl. Sci. Technol., 2006, 43, 400–406 CrossRef CAS.
- R. B. Ickert, R. Mundil, C. W. Magee and S. R. Mulcahy, Geochim. Cosmochim. Acta, 2015, 168, 88–110 CrossRef CAS.
- K. M. Samperton, E. A. Bell, M. Barboni, C. B. Keller and B. Schoene, Geology, 2017, 45, 983–986 CrossRef.
- H. R. Halse, PhD thesis, Imperial College London, 2014.
- F. Farges, C. W. Ponader, G. Calas and G. E. Brown, Geochim. Cosmochim. Acta, 1992, 56, 4205–4220 CrossRef CAS.
- D. Trail, E. B. Watson and N. D. Tailby, Nature, 2011, 480, 79–U238 CrossRef CAS PubMed.
- J. M. Hanchar, Rev. Mineral., 1999, 38, 499–519 CAS.
- F. Farges and G. Calas, Am. Mineral., 1991, 76, 60–73 CAS.
- E. R. Vance and D. J. Mackey, J. Phys. C: Solid State Phys., 1974, 7, 1898–1908 CrossRef CAS.
- M. Tiepolo, R. Oberti and R. Vannucci, Chem. Geol., 2002, 191, 105–119 CrossRef CAS.
- A. M. Seydoux-Guillaume, J. L. Paquette, M. Wiedenbeck, J. M. Montel and W. Heinrich, Chem. Geol., 2002, 191, 165–181 CrossRef CAS.
- T. M. Harrison, E. B. Watson and A. B. Aikman, Geology, 2007, 35, 635–638 CrossRef.
- J. A. Whitney and J. C. Stormer, J. Petrol., 1985, 26, 726–762 CrossRef CAS.
- B. R. Frost, K. R. Chamberlain and J. C. Schumacher, Chem. Geol., 2001, 172, 131–148 CrossRef CAS.
- A. von Quadt, J. F. Wotzlaw, Y. Buret, S. J. E. Large, I. Peytcheva and A. Trinquier, J. Anal. At. Spectrom., 2016, 31, 658–665 RSC.
- J. F. Wotzlaw, Y. Buret, S. J. E. Large, D. Szymanowski and A. von Quadt, J. Anal. At. Spectrom., 2017, 32, 579–586 RSC.
- M. D. Schmitz and S. A. Bowring, Geochim. Cosmochim. Acta, 2001, 65, 2571–2587 CrossRef CAS.
- J. H. F. L. Davies and L. M. Heaman, Precambrian Res., 2014, 249, 180–198 CrossRef CAS.
- G. R. Tilton and M. H. Grunenfelder, Science, 1968, 159, 1458–1461 CrossRef CAS PubMed.
- D. P. Hawkins and S. A. Bowring, Contrib. Mineral. Petrol., 1999, 134, 150–169 CrossRef CAS.
- M. D. Schmitz and B. Schoene, Geochem., Geophys., Geosyst., 2007, 8(8), Q08006 CrossRef.
- N. M. McLean, J. F. Bowring and S. A. Bowring, Geochem., Geophys., Geosyst., 2011, 12(6), Q0AA18 CrossRef.
- L. M. Fairchild, N. L. Swanson-Hysell, J. Ramezani, C. J. Sprain and S. A. Bowring, Lithosphere, 2017, 9, 117–133 CrossRef.
- M. Barboni, P. Boehnke, B. Keller, I. E. Kohl, B. Schoene, E. D. Young and K. D. McKeegan, Sci. Adv., 2017, 3, e1602365 CrossRef PubMed.
- J. L. Crowley, B. Schoene and S. A. Bowring, Geology, 2007, 35, 1123–1126 CrossRef.
- A. Trinquier, C. Maden, A. L. Faure, A. Hubert, F. Pointurier, B. Bourdon and M. Schonbachler, Anal. Chem., 2019, 91, 6190–6199 CrossRef CAS PubMed.
- B. Schoene, M. J. de Wit and S. A. Bowring, Tectonics, 2008, 27(5), TC5010 CrossRef.
- B. Schoene and S. A. Bowring, Geol. Soc. Am. Bull., 2010, 122, 408–429 CrossRef CAS.
- M. Barboni and B. Schoene, Nat. Geosci., 2014, 7, 524–528 CrossRef CAS.
- W. C. Clyde, P. Wilf, A. Iglesias, R. L. Slingerland, T. Barnum, P. K. Bijl, T. J. Bralower, H. Brinkhuis, E. E. Comer, B. T. Huber, M. Ibanez-Mejia, B. R. Jicha, J. M. Krause, J. D. Schueth, B. S. Singer, M. S. Raigemborn, M. D. Schmitz, A. Sluijs and M. D. Zamaloa, Geol. Soc. Am. Bull., 2014, 126, 289–306 CrossRef CAS.
- N. L. Swanson-Hysell, S. D. Burgess, A. C. Maloof and S. A. Bowring, Geology, 2014, 42, 475–478 CrossRef CAS.
- M. Barboni, C. Annen and B. Schoene, Earth Planet. Sci. Lett., 2015, 432, 436–448 CrossRef CAS.
- S. D. Burgess and S. A. Bowring, Sci. Adv., 2015, 1, e1500470 CrossRef PubMed.
- S. D. Burgess, S. A. Bowring, T. H. Fleming and D. H. Elliot, Earth Planet. Sci. Lett., 2015, 415, 90–99 CrossRef CAS.
- W. C. Clyde, J. Ramezani, K. R. Johnson, S. A. Bowring and M. M. Jones, Earth Planet. Sci. Lett., 2016, 452, 272–280 CrossRef CAS.
- C. D. Deering, B. Keller, B. Schoene, O. Bachmann, R. Beane and M. Ovtcharova, Geology, 2016, 44, 267–270 CrossRef CAS.
- M. P. Eddy, S. A. Bowring, P. J. Umhoefer, R. B. Miller, N. M. McLean and E. E. Donaghy, Geol. Soc. Am. Bull., 2016, 128, 425–441 CrossRef CAS.
- M. P. Eddy, S. A. Bowring, R. B. Miller and J. H. Tepper, Geology, 2016, 44, 331–334 CrossRef CAS.
- J. M. Husson, B. Schoene, S. Bluher and A. C. Maloof, Earth Planet. Sci. Lett., 2016, 436, 108–120 CrossRef CAS.
- C. E. Bucholz, M. P. Eddy, O. Jagoutz, S. A. Bowring, M. W. Schmidt and O. Sambuu, Geology, 2017, 45, 11–14 CrossRef CAS.
- M. P. Eddy, K. P. Clark and M. Polenz, Lithosphere, 2017, 9, 652–664 Search PubMed.
- M. P. Eddy, O. Jagoutz and M. Ibanez-Mejia, Geology, 2017, 45, 527–530 CrossRef CAS.
- E. B. Harris, C. A. E. Stromberg, N. D. Sheldon, S. Y. Smith and M. Ibanez-Mejia, Geol. Soc. Am. Bull., 2017, 129, 1241–1251 CrossRef CAS.
- J. M. Krause, W. C. Clyde, M. Ibanez-Mejia, M. D. Schmitz, T. Barnum, E. S. Bellosi and P. Wilf, Geol. Soc. Am. Bull., 2017, 129, 886–903 CrossRef CAS.
- A. J. Schaen, J. M. Cottle, B. S. Singer, C. B. Keller, N. Garibaldi and B. Schoene, Geology, 2017, 45, 835–838 CrossRef.
- J. Kasbohm and B. Schoene, Sci. Adv., 2018, 4(9), eaat8223 CrossRef PubMed.
- S. MacLennan, Y. Park, N. Swanson-Hysell, A. Maloof, B. Schoene, M. Gebreslassie, E. Antilla, T. Tesema, M. Alene and B. Haileab, Geology, 2018, 46, 539–542 CrossRef CAS.
- B. C. Ratschbacher, C. B. Keller, B. Schoene, S. R. Paterson, J. L. Anderson, D. Okaya, K. Putirka and R. Lippoldt, J. Petrol., 2018, 59(9), 1787–1809 CAS.
- S.-Z. Shen, J. Ramezani, J. Chen, C.-Q. Cao, D. H. Erwin, H. Zhang, L. Xiang, S. D. Schoepfer, C. M. Henderson, Q.-F. Zheng, S. A. Bowring, Y. Wang, X.-H. Li, X.-D. Wang, D.-X. Yuan, Y.-C. Zhang, L. Mu, J. Wang and Y.-S. Wu, Geol. Soc. Am. Bull., 2018, 131(1–2), 205–223 Search PubMed.
- M. P. Eddy, M. Ibanez-Mejia, S. D. Burgess, M. A. Coble, U. G. Cordani, J. DesOrmeau, G. E. Gehrels, X. H. Li, S. MacLennan, M. Pecha, K. Sato, B. Schoene, V. A. Valencia, J. D. Vervoort and T. T. Wang, Geostand. Geoanal. Res., 2019, 43, 113–132 CrossRef CAS.
- N. L. Swanson-Hysell, J. Ramezani, L. M. Fairchild and I. R. Rose, Geol. Soc. Am. Bull., 2019, 131(5–6), 913–940 CrossRef.
- A. H. Jaffey, K. F. Flynn, L. E. Glendenin, W. C. Bentley and A. M. Essling, Phys. Rev. C, 1971, 4, 1889–1906 CrossRef.
Footnote |
| † Electronic supplementary information (ESI) available: Additional notes on Materials and methods, supplementary text, Fig. S1–S11, Tables S1–S5. See DOI: 10.1039/c9ja00205g |
| This journal is © The Royal Society of Chemistry 2019 |