
 Open Access Article
 This Open Access Article is licensed under a Creative Commons Attribution-Non Commercial 3.0 Unported Licence
Mass spectrometry imaging as a novel approach to measure hippocampal zinc†
Masoumeh
Dowlatshahi Pour
a,
Lin
Ren
a,
Eva
Jennische
b,
Stefan
Lange
b,
Andrew G.
Ewing
 c and
Per
Malmberg
*a
c and
Per
Malmberg
*a
aDepartment of Chemistry and Chemical Engineering, Chalmers University of Technology, Gothenburg, SE-412 96, Sweden. E-mail: malmper@chalmers.se
bInstitute of Biomedicine, Sahlgrenska Academy, University of Gothenburg, Gothenburg, SE-405 30, Sweden
cDepartment of Chemistry and Molecular Biology, University of Gothenburg, Gothenburg, SE-412 96, Sweden
First published on 9th July 2019
Abstract
Zinc (Zn2+) is an essential trace element that plays crucial roles in the functioning of hundreds of enzymes and DNA binding transcription factors. Zinc is also an essential neuromodulator and can act as a potent neurotoxin in excitotoxic brain injury after seizures, strokes, and brain trauma where high levels of Zn2+ can cause irreparable brain damage in certain brain regions. However, the mechanism of neurotoxicity has not been fully understood yet and is still under debate. In the present study, we have developed a time of flight secondary ion mass spectrometry (ToF-SIMS) imaging method to investigate the distribution of zinc in the rat brain. The zinc distribution in hippocampus sections from healthy rats and rats exposed to traumatic brain injury was imaged and the results were compared to those from conventional zinc-probe based fluorescence microscopy. Two related zinc species, ZnOH3+ and ZnO2H+, can successfully be visualized by ToF-SIMS in the rat hippocampus. Statistical data analysis of the image data demonstrated a substantial increase of both ZnOH3+ and ZnO2H+ in the zinc related species in the acute brain injury tissue. Our findings positively support the fact that toxic vesicular zinc accumulation might not be the sole source for neuronal degeneration following traumatic brain injuries. Also, we could successfully apply ToF-SIMS imaging for the first time to visualize the zinc content and distribution across hippocampus sections. Consequently, ToF-SIMS is a powerful method to further investigate biological phenomena such as seizures, ischemia, and strokes and also other forms of cellular damage in the central nervous system.
Introduction
Zinc is one of the most prevalent trace elements in the human body, playing key functional roles in both brain and systemic physiology. Zinc is well known as the main component in numerous proteins, playing a structural role, i.e. in forming zinc-finger proteins that act as DNA binding transcription and gene expression factors. However, zinc also functions as a catalytic part of the active site of several enzymes regulating a wide variety of physiological processes such as cell proliferation and differentiation, growth and normal development, nuclear acid metabolism and other important cellular processes.1–5 Though the vast majority of zinc is bound to proteins as structural and catalytic co-factors, approximately 10% is free or loosely bound, and this zinc function is not associated with any proteins or amino acid ligands. This free zinc (Zn2+) is predominantly localized in synaptic vesicles, called vesicular zinc, and appears to be in the hippocampus at concentrations of few mM.3,6–9 Vesicular free zinc is an essential neuromodulator in the regulation of neuronal survival, yet it can also be a potent neurotoxin playing a role in exocytotoxic brain injury after seizures, strokes, and brain trauma where high levels of Zn2+ might cause irreparable brain damage in certain brain regions. Mounting evidence suggests that the released free zinc might contribute to the excitotoxicity of hippocampal neuronal injury after brain trauma and that the accumulation of Zn2+ might be part of the mechanism responsible for reduced neuronal survival following injury; however, this hypothesis has not been fully proven yet.7,10–15 Vesicular free zinc is the only form of zinc which is readily stained and which can be revealed by histochemical techniques with any certainty.4 Direct histochemical detection of synaptic zinc is difficult and puts high demand on sample preparation and treatment and the small detectable amount of zinc in vesicles in the zinc-containing neurons is only a small fraction of the total zinc in the brain. Yet this zinc constitutes virtually 100% of the histochemically detectable zinc in the brain. Most importantly, using standard fluorescent probes or Timms's staining might possibly alter the chemical and physical properties of the labelled molecule thereby altering its intracellular distribution, making quantitative analysis difficult. It is therefore highly relevant to develop alternative methods for zinc localization with high spatial resolution. Time of flight secondary ion mass spectrometry (ToF-SIMS) imaging is a powerful technique that can provide elemental, chemical state and molecular information from surfaces of solid materials with high chemical specificity, high accuracy and high sensitivity.16–18 In contrast to common histochemical staining techniques, mass spectrometry imaging (MSI) has evolved as a powerful label-free method requiring no labelling with probes or any other pre-treatment such as matrix application.19–21 SIMS with nanometer resolution (nanoSIMS) has recently been used by Weng et al. to study the in situ cellular and subcellular distribution of some trace elements including zinc in contaminated oysters,22 yet the low ion yield of zinc has limited its use to mainly plant biology and algae,23 with a relatively high abundance of zinc.Laser ablation inductively coupled plasma mass spectrometry imaging (LA-ICP-MSI) is another common technique to study and directly image the distribution of essential elements and small molecules in biological tissue sections.24–26 In this regard, Shariatgorji et al.27 were able to localize and also quantify the concentration of the accumulated sodium, calcium and iron in traumatic brain injury tissue sections using laser ablation mass spectrometry imaging (LA-MSI). However, the main drawback of LA-ICP-MSI and LA-MSI here is the poor spatial resolution in images compared to ToF-SIMS which can provide spatial resolution in the submicron range allowing subcellular images.28
X-ray fluorescence microscopy (XFM), recently developed with advanced fast detectors, has been well known as a successful imaging technique to detect and visualize zinc distribution across biological samples at subcellular resolution.29,30 And so, images from XFM can provide more detailed information than those from LA-ICP-MSI and LA-MSI, and XFM also has the advantage of providing a quantitative analysis. In comparison to ToF-SIMS, the spatial resolution is comparable; however, ToF-SIMS remains more accessible and can provide a more rapid analysis with a higher sample throughput.
In the present study, we have used ToF-SIMS imaging and fluorescence to investigate and map the distribution of zinc in the rat brain. Brain hippocampi from healthy rats and rats exposed to cryogenic traumatic brain injury were imaged and the results were compared to those from conventional fluorescence microscopy. The ToF-SIMS approach complements fluorescence microscopy imaging where the former measures the bound rather than the free zinc measured in the latter and we found that a substantial increase of both ZnOH3+ and ZnO2H+ occurs in the hippocampus of rats after traumatic brain injury.
Results and discussion
Acquisition of zinc-related peaks
In the present study, we examined and investigated the zinc content in rat hippocampus tissue obtained from both control as well as injured rat brain using ToF-SIMS mass spectrometry imaging. The levels of 64Zn were usually too low to detect and image in tissue (the normalized signal intensity is shown and compared with other zinc related species signals in Fig. 3a) and other forms of zinc were suspected to be formed, mainly organozinc compounds and zinc oxide hydrates which might originate from structural zinc proteins as discussed in detail in the Introduction. Therefore, an automatic peak search function in Surface Lab 6.3 was used to suggest zinc related species, which are listed in Table S1 in the ESI.†The peaks were then analyzed to see if they truly belong to zinc related species and are not due to lipid components or any other compounds with the same molecular mass. In this regard, the isotopic pattern similarity was used to identify candidates, by comparing the ratios of the detected isotopes and matching isotopes from the predicted isotopic pattern of the compound. Accordingly, all of the peaks listed in ESI Table S1† were separately evaluated based on their corresponding isotopic patterns but just two species, [ZnOH3]+ and [ZnO2H]+, were considered to have the most accurate match to their predicted isotopic distribution while also providing high enough ion intensity to allow imaging.
Correspondingly, Fig. S1a and b† show the isotopic pattern of [ZnOH3]+ and the part of the ToF-SIMS mass spectrum including species of m/z 82.9 from a rat hippocampus section. As clearly observed here, four peaks which were marked with red circles correspond well with the isotopic pattern. A similar evaluation is seen in Fig. S1c and d† where the related isotopic pattern of [ZnO2H]+ and the part of the ToF-SIMS mass spectrum comprising m/z 96.9 are shown and compared. This comparison clearly indicates that the spectrum matches the isotopic pattern for [ZnO2H]+ again. Thus, the isotopic pattern confirms that the peaks with the masses of m/z 82.9 and 96.9 belong to the [ZnOH3]+ and [ZnO2H]+ species, respectively.
To further confirm that the two peaks of [ZnOH3]+ and [ZnO2H]+ truly belong to zinc related species, we performed ToF-SIMS analysis on PC12 cells incubated with zinc. Untreated cells served as controls. The results are illustrated in Fig. 1 (data related to [ZnOH3]+ are not shown), and it is clear that the [ZnO2H]+ signals surrounding the cells are greatly increased for the zinc incubated cells in the overlay image of [ZnO2H]+ and [C5H15NO4P]+ signals (Fig. 1c). However, no significant [ZnO2H]+ signal is visualized in the corresponding overlay image for the untreated cells (Fig. 1g), most likely due to the very low levels of native zinc present in PC12 cells. Similarly, a comparison of the spectra from zinc incubated and untreated cells is shown in Fig. 1i and j, respectively. These results clearly show that the [ZnO2H]+ signal appears only in the spectrum of the cells incubated with zinc, while the spectrum of untreated cells does not show evidence of this peak.
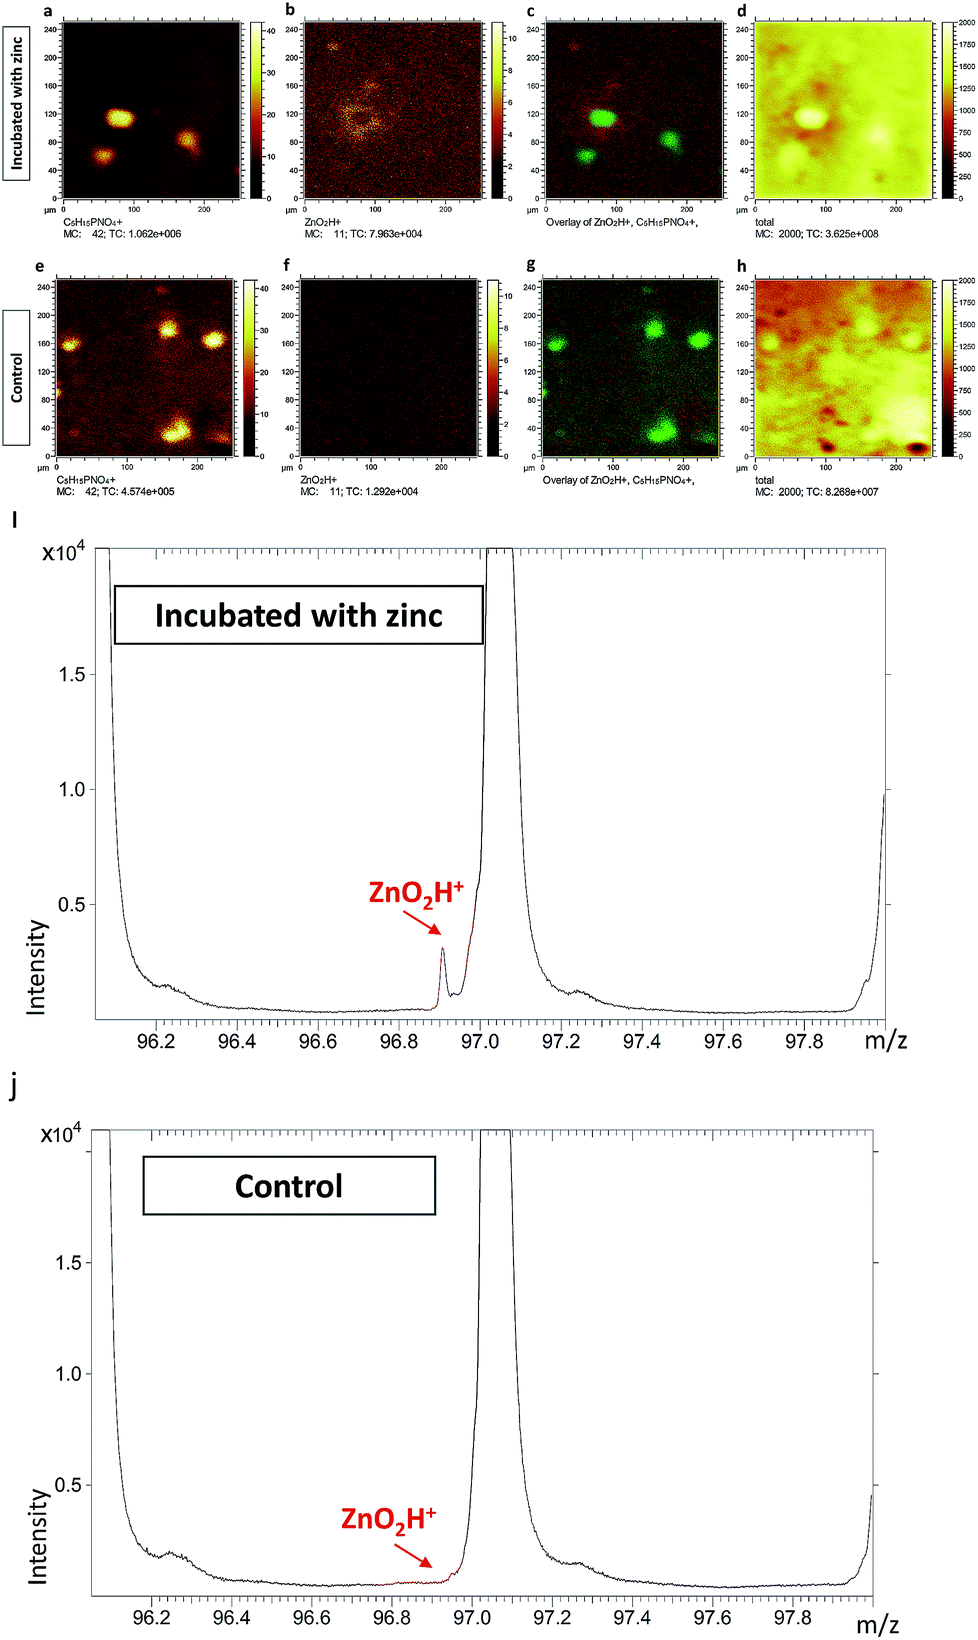 | ||
| Fig. 1 ToF-SIMS ion images of (a) C5H15PNO4+, (b) ZnO2H+, (c) overlay of ZnO2H+ and C5H15PNO4+ signals shown in red and green, respectively, and (d) total ion image from PC12 cells incubated with zinc and ion images of (e) C5H15PNO4+, (f) ZnO2H+, (g) overlay of ZnO2H+ and C5H15PNO4+ signals shown in red and green, respectively, and (h) total ion image from the untreated cells across an analysis area of 250 × 250 μm2 covering 256 × 256 pixels providing a pixel resolution of 1 μm. Also, the corresponding spectrum including ZnO2H+ (m/z 96.9) related to (i) PC12 cells incubated with zinc and (j) the untreated cells. | ||
Investigation of the hippocampal zinc content after brain injury using ToF-SIMS imaging
Six hippocampus sections from control healthy rats, as well as injured rats, were analyzed using ToF-SIMS imaging to investigate changes in zinc after freeze injury. Optical microscopy images, taken prior to the ToF-SIMS analysis of representative freeze-dried sections used in this study, are shown in Fig. 2a and b, showing the whole hippocampus section from control and injured rats, respectively. The two related zinc species, [ZnOH3]+ and [ZnO2H]+, were then selected and imaged in the rat hippocampus sections belonging to each group. Fig. 2c and d demonstrate ion images of [ZnO2H]+ obtained from control and injured rats, respectively, and as clearly seen here, the spatial signal intensity distribution of this zinc related species substantially increases in the CA1 region (labelled with the arrows) in the hippocampus tissue subjected to freeze injury (Fig. 2d) compared to the control tissue sample in Fig. 2c (data related to [ZnOH3]+ are similar and not shown here). This is to be expected based on what was revealed by previous research6,10,13,31 showing a high level of synaptic free zinc (Zn2+) after traumatic brain injury and suggesting that the accumulation of Zn2+ can be part of the mechanism responsible for reduced neuronal survival following injury. However, in that study, they utilized direct histochemical methods using fluorescent probes or Timms's staining, which are commonly used to detect free zinc. In contrast, ToF-SIMS is more prone to detect bound rather than free zinc which results in some differences in zinc localization across hippocampus tissue when compared to the fluorescence microscopy method. These methodological differences and also differences in bound and free zinc localization will be comprehensively discussed in the last part of this paper.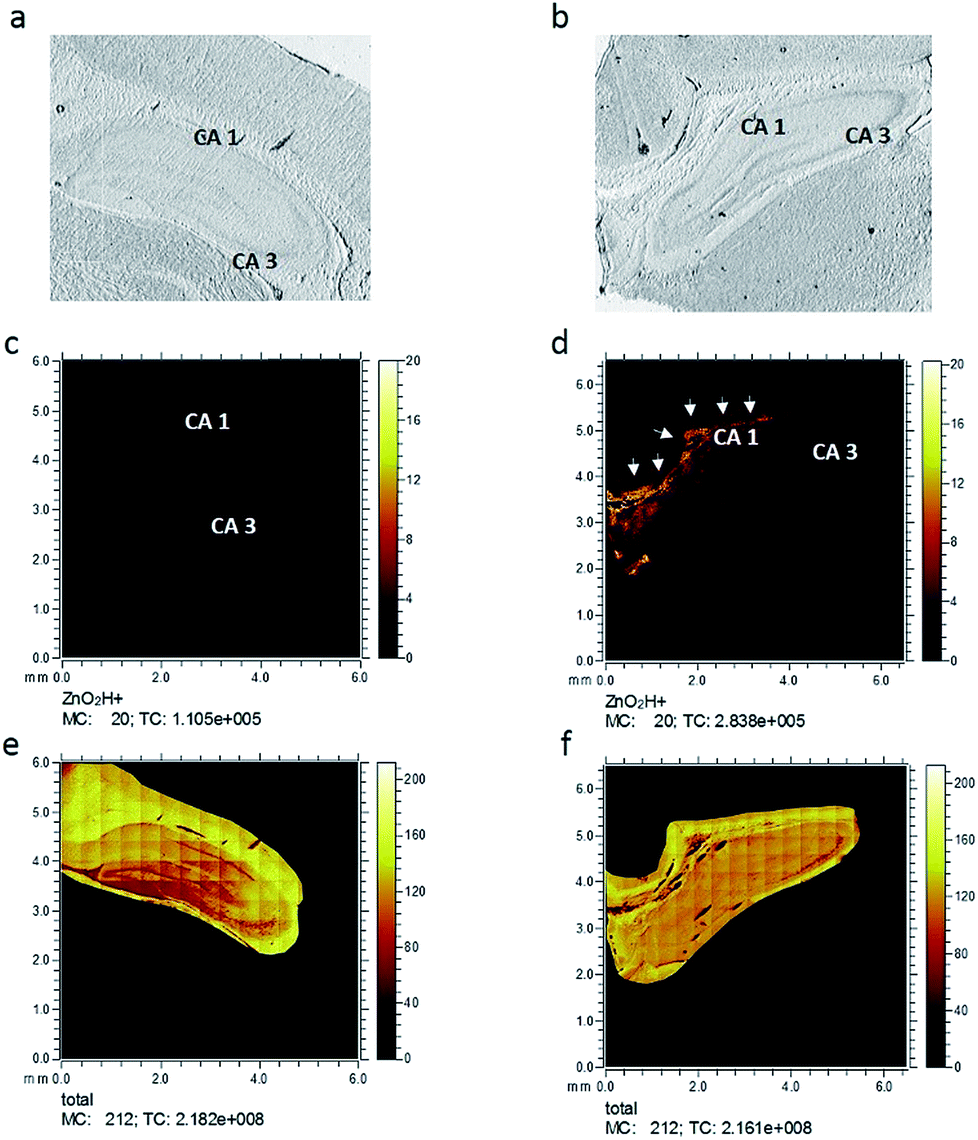 | ||
| Fig. 2 Optical microscopy images of freeze-dried rat hippocampus sections in (a) control and (b) traumatic brain injured rats. ToF-SIMS images showing the spatial signal intensity distribution from [ZnO2H]+ species in (c) control and (d) traumatic brain injured rats and for total ion image in (e) control and (f) traumatic brain injured rats across an analysis area of 6 × 6 mm covering the complete tissue. MC stands for maximum count and TC stands for total count. All data were acquired using a 25 keV Bi3+ beam with a maximum primary ion dose of 1.5 × 10¹¹ ions per cm2. | ||
To examine the spatial distribution of zinc species, 4 regions of 500 × 500 μm2 of hippocampus tissue slices in control and injured rats were selected and analyzed using 256 × 256 pixels, leading to 2 μm resolution images as illustrated in ESI Fig. S2.† These specific regions were selected mainly in the grey/white matter interface region in different areas of CA1 and CA3 across the hippocampus tissue sections to visualize and localize zinc species across the tissue in each group. In Fig. S2† the optical microscopy images of the tissue sections (column I) are shown together with an RGB overlay image. The overlay image (column II) shows [C5H15PNO4]+ (phosphatidylcholine head group), which is most abundant in grey matter, in red color and [C27H45]+ (cholesterol), which is more abundant in white matter, in green. Column III shows the distribution of the [ZnO2H]+ species while column IV shows the total ion images, i.e. the overall ion signal from each tissue section analyzed. In the image data from the first and second ROIs from the CA1 region of the traumatic injury hippocampus sections (Fig. S2b and d†), the [ZnO2H]+ signals can be seen to increase compared to the corresponding image data for control tissue in Fig. S2a and c.† Similarly, image data related to the third and fourth ROIs selected in the CA3 region of hippocampus tissue samples from the injured group, shown in Fig. S2f and h,† demonstrate a substantial increase in [ZnO2H]+ signal intensity compared to the controls as shown in Fig. S2e and g.† It appears that the increase in [ZnO2H]+ signal is considerably higher in the ROIs selected in CA1 than the ones from the CA3 region. This correlates well with what is observed in the whole stage scan image illustrated in Fig. 2d. This result reveals that [ZnO2H]+ appears to be localized in the CA1 region of the hippocampus section in the freeze-injured rats.
Statistical evaluation of the comparison between controls and freeze-injured groups
To statistically elucidate the changes in signal intensity of the zinc related species [ZnOH3]+ and [ZnO2H]+ between the two groups, the average values of these peaks were used to compare data from 3 animals, 2 hippocampus sections from each, and 4 regions in total per each group. These were calculated, plotted, and evaluated by a Welch's t-test (p ≤ 0.05 was considered as significant), showing significant changes between the two groups. A summary of these values as well as the Zn+ normalized signal intensity are shown in Fig. 3a. The 64Zn+ signal was about 1000 times lower than the [ZnOH3]+ and [ZnO2H]+ species signals. Also, it is clearly evident that there is a significant increase in the amount of [ZnOH3]+ and [ZnO2H]+ species in the injured group. Correspondingly, similar plots have been made for lipid species [C5H15PNO4]+ and [C27H45]+ as shown in Fig. 3b; however, no significant changes are observed here. This indicates that practically an equal volume of grey or white matter was selected across the analyzed regions. The signal enhancement of the zinc related species is considered to be solely reflected by the zinc distribution which is closely related to cellular damage in hippocampus tissue sections following brain injury.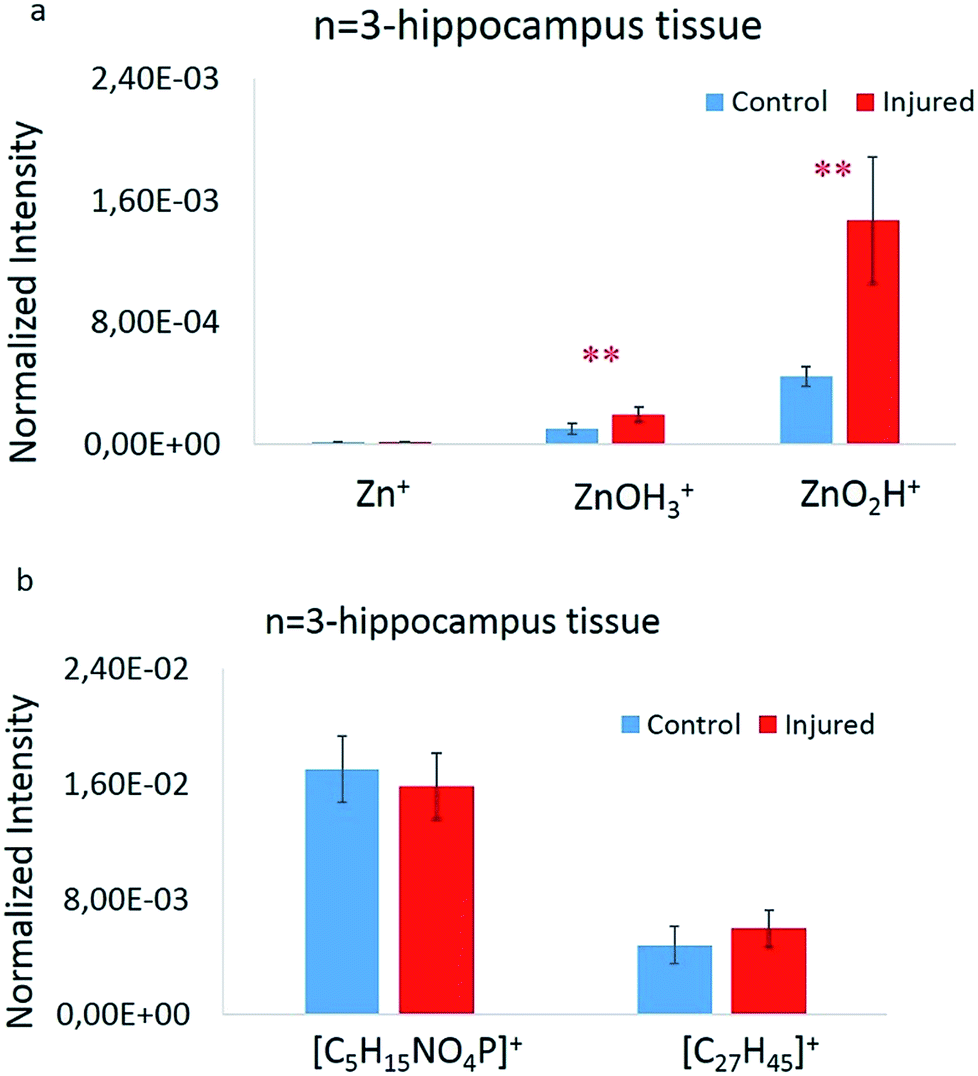 | ||
| Fig. 3 (a) Normalized intensity for Zn+, [ZnOH3]+ and [ZnO2H]+ species in control (blue) and freeze-injured rats (red). (b) Normalized intensity for [C5H15NO4P]+ (phosphatidylcholine head group) and [C27H45]+ (cholesterol) species in control (blue) and traumatic brain injured rats (red). In both charts, the bar heights show the average value and error bars showing a 95% confidence level for each peak. Data from 24 ROIs on 6 hippocampus tissues in total belonging to 3 different animals from the control and 3 freeze-injured rats. | ||
Comparing ToF-SIMS imaging with fluorescence microscopy
Conventional fluorescence microscopy tissue staining with Fluozin-3 as the zinc indicator was used in order to correlate our study with previous investigations visualizing vesicular free zinc across hippocampus tissue. As shown in Fig. 4, a dense fluorescence demonstrates the accumulation of free zinc in the injured CA3 region of the hippocampus (Fig. 4d) when compared to the control tissue section (Fig. 4c). These results are consistent with what has been revealed by other related studies showing the high level of vesicular free zinc in the CA3 region of hippocampus tissue after traumatic brain injuries such as seizures, ischemia, head stroke or any other form of neuronal damage to the brain.10,12,13,32 On the other hand, zinc detected by ToF-SIMS can probably be metabolic and structural zinc which is tightly bound to proteins and as mentioned before, bound zinc forms the vast majority of total zinc rather than free zinc. Therefore, this high abundance and intensity of bound zinc, in turn, might significantly suppress signals from free zinc. Moreover, as the electronic configuration of zinc causes a special stability because of the filled electronic states and also the effective nuclear charge is greater than that of copper, the element that precedes it in the periodic table, more energy is required to ionize zinc which makes it difficult to detect in its natural ionic state of Zn2+ and instead we possibly detect the [ZnOH3]+ and [ZnO2H]+ species. As a result, we conclude here that ToF-SIMS is more likely to detect bound forms of zinc compared to free zinc.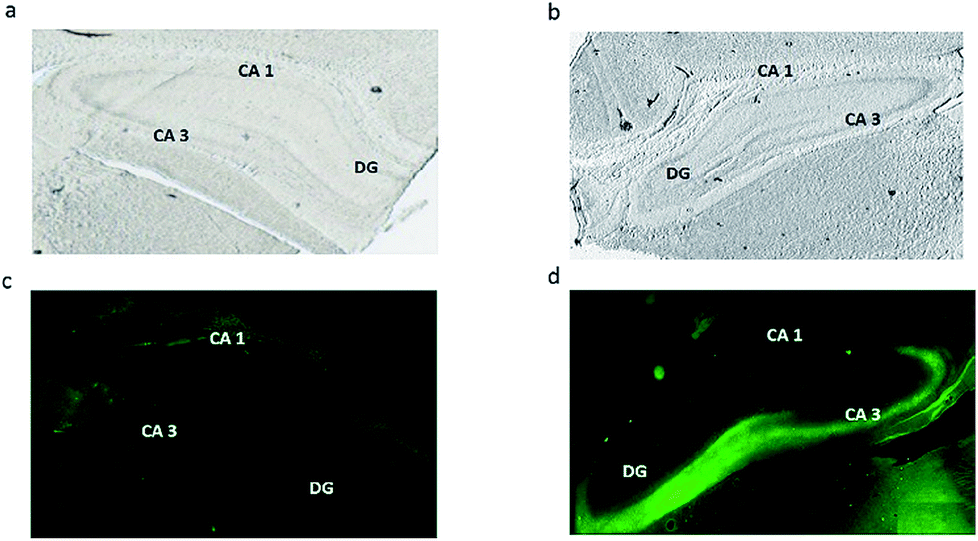 | ||
| Fig. 4 Optical microscopy images of freeze-dried rat hippocampus sections in (a) control and (b) traumatic brain injured rats. Fluorescence images from hippocampus staining with Fluozin-3 in (c) control and (d) traumatic brain injured groups. | ||
ToF-SIMS data in this study confirm an increase in bound zinc species in hippocampus tissue associated with traumatic brain injury. This correlates well with a recent study32 showing an increase in the level of structural and bound zinc (zinc-finger protein) in an animal model exposed to traumatic brain injury and supports our findings. However, looking at overall data from ToF-SIMS and fluorescence microscopy in this study, it is obviously evident that bound zinc and free zinc are differently localized and distributed across the hippocampus sections. The bound zinc species appear to be mainly localized in the CA1 region; however, free zinc is densely accumulated in the CA3 region of the injured hippocampus section. The pivotal question of the present study is what this different localization might mean. As mentioned above, fluorescence microscopy studies have previously confirmed the localization and accumulation of free zinc species in the injured CA3 region of the hippocampus.9,13 They also discussed the possible mechanism for potential neurotoxicity following acute brain injuries in which vesicular free zinc normally localized in presynaptic neuronal terminals might translocate to postsynaptic neurons where it is more localized in the CA3 and, in fact, this accumulation of vesicular zinc and extra release of zinc in postsynaptic neurons might cause neuronal degeneration and death in the CA3. However, in that study they also suggested that vesicular free zinc accumulation is not the sole source for neurotoxicity of zinc. Consistent with these studies, J. Y. Lee and co-workers33 proposed that metallothioneins (MTs), non-enzymatic cysteine-rich metal-binding proteins, are another potential source for toxic zinc accumulation in response to brain injury. They used immunocytochemical analysis to visualize this specific protein across hippocampus tissue in mouse brain and found it to be substantially localized in the CA1 region. They then suggested that MT proteins not only bind to zinc but also release zinc and might act as a possible source of toxic zinc contributing in this way to hippocampal neurodegeneration in the CA1 in acute brain injury. Accordingly in our study, we speculate that the two bound zinc species [ZnOH3]+ and [ZnO2H]+ detected by ToF-SIMS which seem to be more accumulated in the CA1 region might originate from MT proteins; however, this still requires further investigation.
Experimental
Animal
The experimental procedures were approved by the Regional Animal Experiments Ethical Committee in Gothenburg, Sweden (Dnr 159-2015). All handling of rats was performed according to guidelines for animal experiments (EC Directive 86/609/EEC). Male Sprague-Dawley rats with a body weight of 180 ± 20 g were used in this study and they were allowed to have free access to food and water during the whole experiment. Also, the temperature and air ventilation in the animal cages were monitored based on the standard protocols.Surgical procedure for cryogenic brain injury and tissue preparation
The rats were subjected to surgical anaesthesia by inhalation of Isoflurhane® (4% induction, 1.5–2% maintenance in air) and thereafter transferred to a heating pad and placed on the abdomen. Body temperature was kept at 37 °C via monitoring with a rectal thermos-coupled probe. The head skin was shaved, washed with 70% alcohol and then subcutaneously injected with Marcain®. A 2–3 cm long midline incision was made through the skin and fascia on the skull vault, and the bone was mechanically freed from the adherent connective tissue. A copper rod (weight 144 gram) with a tip diameter of 4 mm was then immersed in liquid nitrogen and then applied to the right parietal bone for 60 s. This freezing procedure penetrated the bone and induced a defined, sterile, morphological visible injury in the underlying brain tissue. The cranium midline was avoided not to induce bleeding damage to the superior sagittal sinus. After experimental termination, the resulting lesion volume was morphologically calculated, and uninjured rats served as controls.After a recovery period of 24 h the rats were again anaesthetized with Isoflurhane® anaesthesia, the chest opened and the heart removed. The skull was then opened and the brain taken out and frozen in liquid N2. By means of a cryomicrotome the hippocampus tissue was sectioned into slices of 10 μm thickness and mounted onto ITO glass slides (Bruker GmBH, Germany). The slides were thereafter positioned in closed, plastic containers and then maintained at −80 °C. Prior to ToF-SIMS analysis, the slides were placed at room temperature and then dehydrated in a desiccator under vacuum for 30 min.
Fluorescence microscopy imaging for brain tissue
Fluozin-3 (AM, Invitrogen) was used as a zinc indicator. Fluozin-3 was dissolved in DMSO to prepare 1–5 mM stock solution. The DMSO stock solution was diluted in a buffered physiological medium (PBS, Sigma) with an equal volume of 20% Pluronic to assist in dispersing the non-polar Am ester in aqueous media to give a final 50 μM solution for tissue staining. Without any washing steps, the Fluozin-3 solution was dropped on brain tissue and incubated for 45 min at room temperature. After staining, the brain tissue was rinsed with probe-free PBS carefully to remove the extra Fluozin-3 solution. And subsequently, imaging was initiated immediately thereafter. Fluozin-3 labelled tissues were observed under a fluorescence microscope (Olympus IX71S1F, USA) with a 4× objective (Olympus) using 492 nm excitation (492 FITC, 150 W xenon light source). Because the slice of rat brain was too big to show with one image, several images were obtained in the same plane and combined.Cell culture
PC12 cells, a gift from Lloyd Greene (Columbia University), were maintained in phenol red-free RPMI-1640 media (PAA Laboratories, Inc. Australia) supplemented with 10% donor equine serum (PAA Laboratories) and 5% fetal bovine serum gold (PAA Laboratories) in a 7% CO2, 100% humidity atmosphere at 37 °C. The cells were grown on mouse collagen coated cell culture flasks (collagen type IV, BD Biosciences, Bedford, MA) and were sub-cultured every 7–9 days. The medium was replaced every 2 days throughout the lifetime of all cultures. Cells were cultured on silicon wafers, which had been washed with ethanol, acetone, ethanol, and Milli-Q water and then coated with 1 mL of poly-lysine solution for 1.5 h at room temperature. The cells were seeded on the coated-silicon wafers and incubated in RPMI 1640 media for 3 days before experiments. For zinc treatment, the cells were incubated with RPMI 1640 media containing 100 μM Zn2+ for 3.5 h before TOF-SIMS analysis.Cell preparation for TOF-SIMS
The cells grown on silicon wafers were washed with 150 mM ammonium acetate for 30 s and dried in the air at room temperature before introduction into the TOF-SIMS instrument.ToF-SIMS analysis
Hippocampus tissue sections from Male Sprague-Dawley rats were analyzed using a ToF.SIMS 5 instrument (ION-TOF GmbH, Münster, Germany) equipped with a Bi cluster ion gun. Six hippocampus sections from each group of control rats and freeze injured brain tissue from 3 different rats including two hippocampus sections from each one were imaged using the stage scan macro raster with a lateral resolution of 5 μm for the whole tissue section. Images and spectra were collected from 4 regions of interest (ROIs) per tissue with a spot size of approximately 2 μm and a mass resolution of m/Δm 6000.34 All data were acquired in the high current bunch mode with a pulsed primary ion current of 0.30 pA at 25 keV and a maximum ion dose of 1.5 × 10¹¹ ions per cm2 using Bi3+ ions. Low energy electron flooding was used for charge compensation. The range of primary ion dose densities was maintained below that of the static limit, i.e., 1013 ions per cm2 to be sure that the experiment ended before the primary ion beam had considerably damaged the surface of the sample. The ToF-SIMS data were processed using Surface Lab software (version 6.3 ION-ToF, GmbH, Münster, Germany). Due to the very low intensity of the Zn+ (m/z 64) peaks in mass spectra, an automatic peak search was used to find related zinc species with higher intensity; subsequently, just two species, [ZnOH3]+ and [ZnO2H]+, were found based on the isotopic pattern similarity as seen in Fig. 1. Next, these zinc species were imaged across hippocampus sections in each group of control rats as well as rats exposed to freeze traumatic brain injury. This procedure was performed in order to assess any significant alteration of zinc species between the two groups. The analyzed dataset was collected from 3 animals with 2 hippocampus sections from each and 4 regions in total per group were exposed to a t-test using semi-quantitative analysis.Conclusions
Two zinc species, [ZnOH3]+ and [ZnO2H]+, were visualized by ToF-SIMS in the rat hippocampus. The image data demonstrate a substantial increase of the zinc related species caused by an experimental freeze injury to the central nervous system. Statistical analysis showed a significant increase in the amount of both [ZnOH3]+ and [ZnO2H]+ in the injured sections. It is surprising that comparing ToF-SIMS to conventional fluorescence microscopy revealed noticeable differences, showing that mass spectrometry imaging detects bound zinc versus free zinc with fluorescence. These results indicate that in addition to free vesicular zinc, bound zinc species might also increase in traumatic brain injury and support the hypothesis that free vesicular zinc accumulation is not the only possible source for neurodegeneration, but that proteins that bind zinc might cause intracellular zinc toxicity in brain injuries. Our study is the first to use mass spectrometry imaging to detect and visualize zinc species in neuronal tissue. Consequently, it might be possible to use the ToF-SIMS method in further investigations of biological phenomena related to central nervous damage or degeneration such as seizures, ischemia, and strokes and also other forms of cellular damage in the central nervous system.Conflicts of interest
The authors hereby declare that there are no conflicts of interest.Acknowledgements
The authors acknowledge support from the Swedish Research Council (2015-05274) and the Wallenberg foundation.References
- R. J. Wood, J. Nutr., 2000, 130(5), 1350S–1354S CrossRef CAS.
- M. Hambidge, J. Nutr., 2000, 130(5S), 1344S–1349S CrossRef CAS.
- B. Szewczyk, M. Kubera and G. Nowak, Prog. Neuro-Psychopharmacol. Biol. Psychiatry, 2011, 35, 693–701 CrossRef CAS.
- Y. Yang, X. P. Jing, S. P. Zhang, R. X. Gu, F. X. Tang, X. L. Wang, Y. Xiong, M. Qiu, X. Y. Sun, D. Ke, J. Z. Wang and R. Liu, PLoS One, 2013, 8, e55384 CrossRef CAS.
- G. Vela, P. Stark, M. Socha, A. K. Sauer, S. Hagmeyer and A. M. Grabrucker, Neural Plast., 2015, 2015, 972791 CrossRef.
- A. R. Kay, J. Neurosci., 2003, 23, 6847–6855 CrossRef CAS.
- D. R. Morris and C. W. Levenson, J. Toxicol., 2012, 2012, 785647 Search PubMed.
- C. E. Yeisera, A. A. Leranta, R. M. Castob and C. W. Levensona, Neurosci. Lett., 1999, 277, 75–78 CrossRef.
- T. B. Cole, H. J. Wenzel, K. E. Kafer, P. A. Schwartzkroin and R. D. Palmiter, Proc. Natl. Acad. Sci. U. S. A., 1999, 96, 1716–1721 CrossRef CAS.
- T. B. Cole, C. A. Robbins, H. J. Wenzel, P. A. Schwartzkroin and R. D. Palmiter, Epilepsy Res., 2000, 39, 153–169 CrossRef CAS.
- C. J. Frederickson, W. Maret and M. P. Cuajungco, Neuroscientist, 2004, 10, 18–25 CrossRef CAS.
- S. W. Suh, J. W. Chen, M. Motamedi, B. Bell, K. Listiak, N. F. Pons, G. Danscher and C. J. Frederickson, Brain Res., 2000, 852, 268–273 CrossRef CAS.
- J. Y. Lee, T. B. Cole, R. D. Palmiter and J. Y. Koh, J. Neurosci., 2000, 20, 1–5 CrossRef CAS.
- A. M. Grabrucker, M. Rowan and C. C. Garner, Drug Delivery Lett., 2011, 1, 13–23 CAS.
- S. Pfaender, A. K. Sauer, S. Hagmeyer, K. Mangus, L. Linta, S. Liebau, J. Bockmann, G. Huguet, T. Bourgeron, T. M. Boeckers and A. M. Grabrucker, Sci. Rep., 2017, 7, 45190 CrossRef CAS.
- F. D. Mai, B. J. Chen, L. C. Wu, F. Y. Li and W. K. Chen, Appl. Surf. Sci., 2006, 252, 6809–6812 CrossRef CAS.
- S. Chandra and G. H. Morrison, Int. J. Mass Spectrom. Ion Processes, 1995, 143, 161–176 CrossRef CAS.
- S. Chandra, Appl. Surf. Sci., 2003, 203–204, 679–683 CrossRef CAS.
- P. Malmberg, K. Borner, Y. Chen, P. Friberg, B. Hagenhoff, J. E. Mansson and H. Nygren, Biochim. Biophys. Acta, Mol. Cell Biol. Lipids, 2007, 1771, 185–195 CrossRef CAS PubMed.
- P. Sjovall, J. Lausmaa and B. Johansson, Anal. Chem., 2004, 76, 4271–4278 CrossRef.
- J. Hanrieder, P. Malmberg, O. R. Lindberg, J. S. Fletcher and A. G. Ewing, Anal. Chem., 2013, 85, 8741–8748 CrossRef CAS.
- N. Weng, H. Jiang and W. X. Wang, Environ. Sci. Technol., 2017, 51, 14426–14435 CrossRef CAS.
- F. Penen, J. Malherbe, M. P. Isaure, D. Dobritzsch, I. Bertalan, E. Gontier, P. Le Coustumer and D. Schaumloffel, J. Trace Elem. Med. Biol., 2016, 37, 62–68 CrossRef CAS.
- A. Kindness, C. N. Sekaran and J. Feldmann, Clin. Chem., 2003, 49, 1916–1923 CrossRef CAS.
- J. S. Becker, A. Matusch, C. Depboylu, J. Dobrowolska and M. V. Zoriy, Anal. Chem., 2007, 79, 6074–6080 CrossRef CAS.
- J. S. Becker, M. V. Zoriy, C. Pickhardt, N. Palomero-Gallagher and K. Zilles, Anal. Chem., 2005, 77, 3208–3216 CrossRef CAS.
- M. Shariatgorji, A. Nilsson, M. Bonta, J. Gan, N. Marklund, F. Clausen, P. Kallback, H. Loden, A. Limbeck and P. E. Andren, Methods, 2016, 104, 86–92 CrossRef CAS.
- D. Touboul, F. Halgand, A. Brunelle, R. Kersting, E. Tallarek, B. Hagenhoff and O. Laprevote, Anal. Chem., 2004, 76, 1550–1559 CrossRef CAS.
- A. Grubman, S. A. James, J. James, C. Duncan, I. Volitakis, J. L. Hickey, P. J. Crouch, P. S. Donnelly, K. M. Kanninen, J. R. Liddell, S. L. Cotman, J. de and A. R. White, Chem. Sci., 2014, 5, 2503–2516 RSC.
- B. Ajiboye, I. Cakmak, D. Paterson, M. D. de Jonge, D. L. Howard, S. P. Stacey, A. A. Torun, N. Aydin and M. J. McLaughlin, Plant Soil, 2015, 392, 357–370 CrossRef CAS.
- H. L. Hellmich, K. A. Eidson, B. A. Capra, J. M. Garcia, D. R. Boone, B. E. Hawkins, T. Uchida, D. S. Dewitt and D. S. Prough, Brain Res., 2007, 1127, 119–126 CrossRef CAS.
- J. Y. Chuang, T. J. Kao, S. H. Lin, A. C. Wu, P. T. Lee, T. P. Su, S. H. Yeh, Y. C. Lee, C. C. Wu and W. C. Chang, Redox Biol., 2017, 11, 135–143 CrossRef CAS.
- J. Y. Lee, J. H. Kim, R. D. Palmiter and J. Y. Koh, Exp. Neurol., 2003, 184, 337–347 CrossRef CAS.
- R. N. Sodhi, Analyst, 2004, 129, 483–487 RSC.
Footnote |
| † Electronic supplementary information (ESI) available. See DOI: 10.1039/c9ja00199a |
| This journal is © The Royal Society of Chemistry 2019 |